Krypto-Börsen-Charts: Ein Leitfaden zum Verstehen von Markttrends
Crypto exchange charts are essential tools for traders and investors aiming to navigate the cryptocurrency market. These charts display price movements, trading volumes, and other critical data points, helping users make informed decisions. Whether you’re a beginner or an experienced trader, understanding how to read and analyze these charts is key to success.
What is a Crypto Exchange Chart?
Price Movements:
Tracks the value of a cryptocurrency over time.
Trading Volume:
Shows the number of tokens traded within a specific period.
Indicators and Patterns:
Tools like moving averages, RSI, and candlestick patterns help predict future trends.
- After logging into your Darkex account
- Click on Futures at the top of the page
- Select the asset you want to trade from the top left
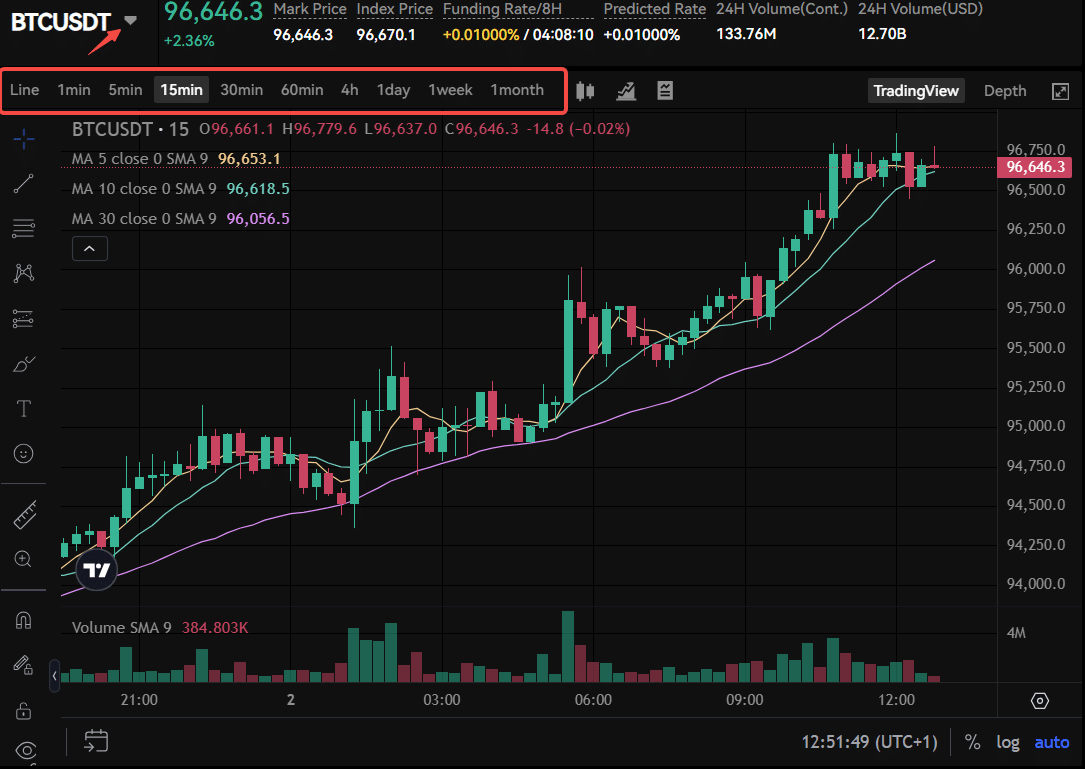
- The chart that appears shows the instant price movements of the wallet you want to trade.
- By clicking on the desired time frame from the line section at the top of the chart, you can analyze short-term or long-term market behavior in time frames ranging from 1 minute to 1 month.
Key Elements of Crypto Exchange Charts
-
Current Price
The current price is the latest value at which an asset is traded in the market. It reflects the most recent agreement between buyers and sellers. Traders and investors monitor the current price to make decisions about buying, selling, or holding the asset. In trading platforms, this value is usually highlighted for quick reference.
You can see it in the upper left corner of the chart.
-
Moving Averages (MA)
Moving Averages (MAs) are widely used technical indicators that smooth out price fluctuations to help identify trends. They are calculated by averaging the asset’s price over a specific number of periods:
Short-Term Moving Average (e.g., MA 5):
Tracks quick changes in price, giving insight into short-term momentum.
Mid-Term Moving Average (e.g., MA 10 or MA 20):
Balances short-term volatility and longer-term trends, offering a clearer perspective on medium-range movements.
Provides a more stable view of the market’s overall direction, filtering out daily noise.
Moving averages are commonly used to spot trend reversals, support, and resistance levels.
-
Price Peak (High)
The price peak is the highest value the asset reaches within a specific time frame. It is often considered a resistance level, where selling pressure might increase. Traders monitor this level for potential breakouts or reversals, as it provides insights into market sentiment and price momentum.
-
Volume
Volume measures the total number of assets traded during a specific time frame. It is a crucial indicator for understanding market activity:
High Volume
Indicates strong interest and reinforces the validity of price movements.
Low Volume
Suggests reduced interest, making price movements less reliable.
Volume is displayed as bars on charts, with green bars reflecting more buying activity and red bars indicating higher selling pressure.
-
Funding Rate
The funding rate is a mechanism specific to perpetual futures markets. It ensures that the contract price stays aligned with the underlying asset’s spot price. It also reflects the market’s sentiment:
Positive Funding Rate:
Indicates dominance of buyers (long positions), who pay sellers (short positions).
Negative Funding Rate:
Reflects dominance of sellers (short positions), who pay buyers (long positions).
Funding rates are important for assessing market sentiment and leverage dynamics.
-
Predicted Rate
Predicted Rate is a calculated estimate of an upcoming funding rate in perpetual futures contracts. It serves as a forecast for how the funding rate will adjust in the next funding interval. This value helps traders anticipate market conditions and the cost of holding positions in leveraged markets.

Haftungsausschluss
Cryptocurrency trading involves significant risks due to market volatility. This guide is for informational purposes only and does not constitute financial advice. Always conduct thorough research or consult a professional before trading.
You can find more detailed information about trading in Darkex in the Darkex Guide tab.