What Is Elliott Wave Theory? A Guide to Wave Patterns and Market Trends
Elliott Wave Theory is a technical analysis method developed by Ralph Nelson Elliott that suggests that price movements in financial markets form repeating patterns based on human psychology and investor sentiment. Used especially in the stock market, currency markets and commodity trading, this theory aims to predict future price movements by recognizing specific wave patterns.
Elliott Wave Theory states that market prices move in two main types of waves: Impulse waves and corrective waves.
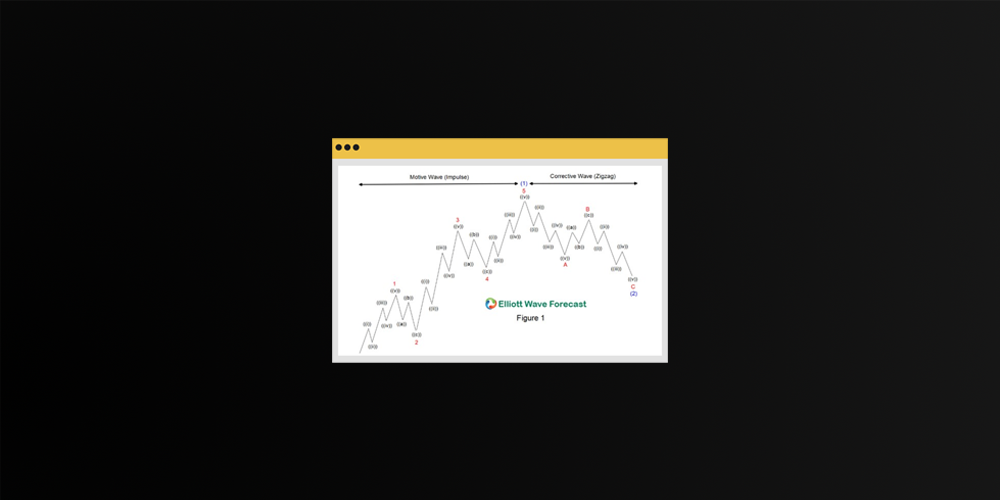
Source: elliottwave-forecast
- Impulse waves: These waves occur in the direction of the main trend and usually consist of 5 waves. Impulse waves represent the main movements of the market.
Wave 1: Indicates the beginning of a new trend.
Wave 2: A retraction, usually correcting part of the first wave.
Wave 3: The strongest wave, usually representing a continuation of the trend.
Wave 4: It is again a correction, undoing part of the third wave.
Wave 5: Marks the final phase of the trend and usually the point at which momentum declines. - Corrective waves: They occur in the opposite direction of the main trend and consist of 3 waves: A, B and C. These waves reverse part of the trend but do not form a new trend.
The Role of Psychology: Elliott Wave Theory emphasizes the influence of human behavior on market prices, as it is based on investor sentiment and mass psychology. Optimism causes prices to rise, and pessimism causes prices to fall. Elliott argues that these changes in sentiment can be measured by wave patterns.
Fibonacci Relationship: The Elliott Wave Theory helps identify potential targets for market movements using Fibonacci ratios. Specifically, the price is expected to retrace or expand at 38.2%, 50% and 61.8%. These ratios play a critical role in creating trading strategies by measuring the levels of correction and expansion.
Wave Degrees: The Elliott Wave Theory has various wave degrees to analyse market movements on different time frames. There are nine wave degrees, ranging from the smallest to the largest, and each one represents trends of different magnitudes in the market:
- Minuette (smallest)
- Minute
- Small
- Middle
- Primary
- Super Loo
- Large Super Loop (largest)
Application and Strategies: Elliott Wave Theory is used to understand the phase of the current trend in the market. By recognizing impulse and corrective wave cycles, traders can better identify entry and exit points. Especially in currency, stock and crypto trading, Elliott waves can be used to predict potential price targets and retracements.
In summary, Elliott Wave Theory is a powerful tool for predicting price movements in financial markets. However, it requires experience and practice due to its subjective nature and complex rules.
A Deeper Look at Technical Analysis with Elliott Wave Theory
Elliott Wave Theory is one of the important technical analysis approaches developed to understand price movements in financial markets. By combining market psychology, trend cycles, and Fibonacci ratios, it can give investors an idea of the possible direction of price movements. However, it is not entirely objective, as the interpretation of wave counts often depends on the analyst’s experience. Therefore, when used in conjunction with other technical and fundamental analysis tools, Elliott Wave Theory can help investors evaluate market dynamics more comprehensively.
Frequently Asked Questions (FAQ)
What is Elliott Wave Theory?
Elliott Wave Theory is a technical analysis method that argues that price movements in financial markets form recurring wave patterns depending on investor psychology. This theory is used to understand market trends and predict potential price movements.
How many waves are there in Elliott Wave Theory?
The Elliott Wave structure generally consists of two main parts: a 5-wave impulse movement followed by a 3-wave corrective movement. This structure represents a market cycle consisting of a total of 8 waves.
What is the difference between impulse and corrective waves?
Impulse waves are movements that progress in the direction of the main trend and usually consist of 5 phases. Corrective waves, on the other hand, are corrective movements that develop in the opposite direction of the main trend and are usually three-phase movements in the form of A-B-C.
Why are Fibonacci ratios important in Elliott Wave Theory?
Fibonacci ratios are used to determine the retracement and expansion levels of waves. Specifically, the 38.2%, 50%, and 61.8% levels are important reference points in identifying price corrections and potential target areas.
Can Elliott Wave Theory be used in cryptocurrency markets?
Yes. Elliott Wave Theory is a widely used analysis method in cryptocurrency markets, as well as in stock and forex markets. It is particularly preferred for analyzing trend cycles and potential price targets in volatile markets.
Does Elliott Wave analysis provide definitive results?
No. While Elliott Wave Theory is a powerful analytical tool, it does not provide completely accurate results. Wave counts can depend on the analyst’s interpretation. Therefore, investors generally use Elliott waves in conjunction with other technical analysis tools and market data.
Disclaimer
The information contained in this content is for general informational and educational purposes only. Elliott Wave Theory and related technical analysis methods are analytical approaches used to interpret price movements in financial markets; however, they do not offer definitive results or guaranteed investment performance.