
MARKET SUMMARY
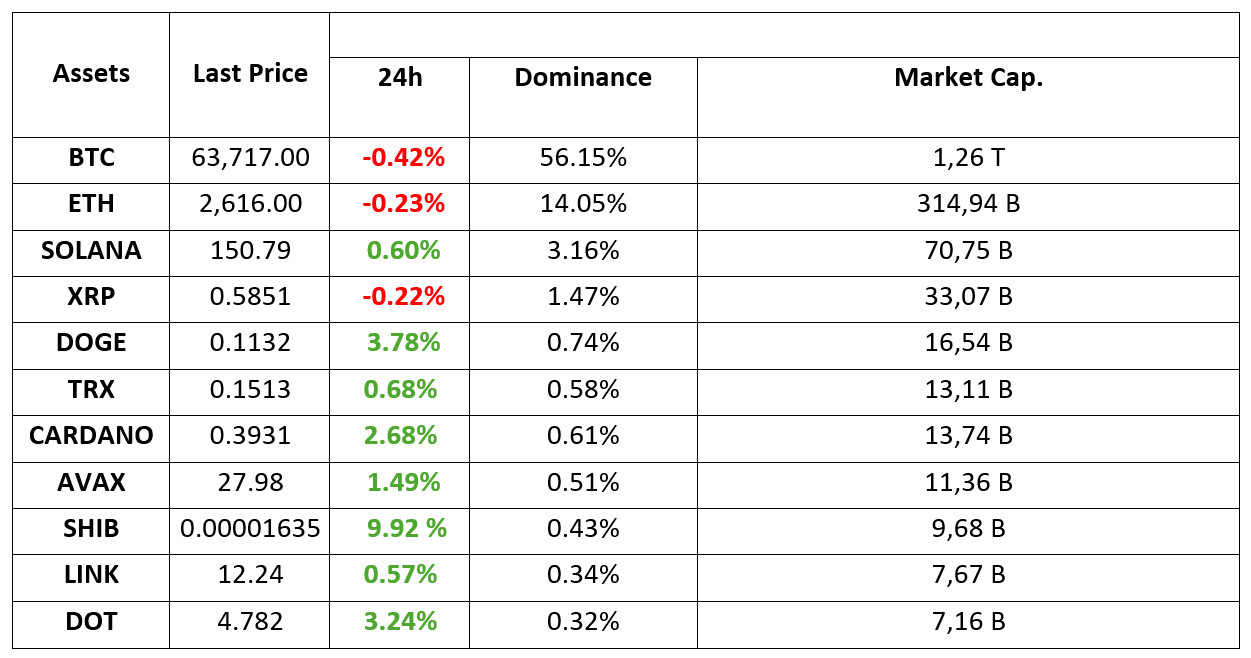
Latest Situation en Crypto Assets
*Prepared el 26.09.2024 at 07:00 (UTC)
WHAT’S LEFT BEHIND
Bitcoin’s Correlation with the S&P500
Recent US Federal Reserve rate cuts have created a higher correlation between digital assets and major stock market indices. A correlation coefficient of 0.67 has recently been observed between the S&P 500 and the 100 most valuable digital assets, which is close to historical highs.
Bitcoin Options
On Friday, $5.8 billion worth of Bitcoin options expire. This amount will be one of the most important option closures of 2024. “The price of Bitcoin could be significantly affected,” said Deribit CEO Luuk Strijers.
Bitcoin ETFs
US Bitcoin ETFs continued to attract investment el their fifth day. BlackRock’s iShares Bitcoin Trust fund received $184 million. In total, US Bitcoin ETFs received a net investment of $246 million.
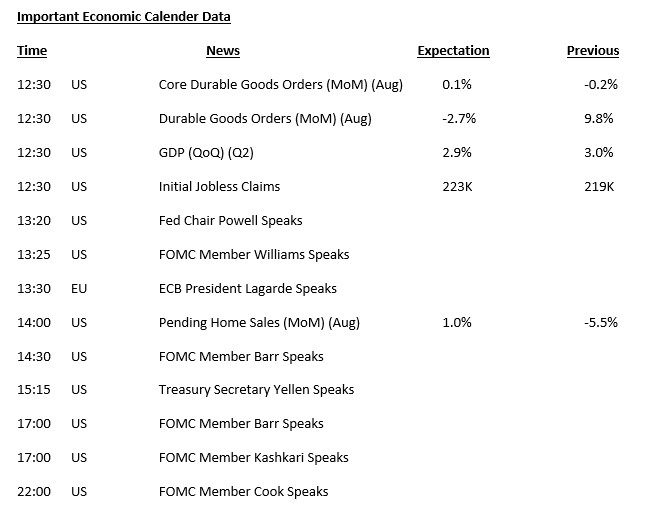
HIGHLIGHTS OF THE DAY
INFORMATION
*The calendar is based el UTC (Coordinated Universal Time) time zone. The economic calendar content el the relevant page is obtained from reliable news and data providers. The news en the economic calendar content, the date and time of the announcement of the news, possible changes en the previous, expectations and announced figures are made por the data provider institutions. Darkex cannot be held responsible for possible changes that may arise from similar situations.
MARKET COMPASS
Starting one of the busiest days of the week, global markets will be watching the US markets. While segundo quarter growth, durable goods orders and Unemployment Claims will be among the highlights, the statements of Federal Open Market Committee (FOMC) officials, including Chairman Powell, will be closely monitored. Considering the options expiring el Friday, we can say that an active “two-day period” awaits the markets.
Let’s take a look at how the markets are doing ahead of this busy calendar. Asian stock markets are en a euphoric mood. European and US futures contracts indicate that indices will start the day en a positive mood. The dollar index retreated slightly after yesterday’s gains. BTC was able to find buyers when it fell to around 62,500 and received support from this area.
At the heart of the festive mood en Asia is new news about China’s support for the economy. After its recent moves, there is talk that China will inject about 142 billion dollars en cash into some of its state-owned banks. The country’s president Jinping held a Politburo meeting to discuss the economy.
In addition to this, we can say that US Micron Technology’s financial results, which came en above expectations, supported technology companies and made a significant contribution to the positive mood en the markets. In Asia, tech companies led the rally, while tech-heavy Nasdaq index futures are at a premium of over 1%.
Inflows to spot Bitcoin ETFs en the US continued. According to SoSoValue data, there was a net inflow of around $10.5 million yesterday, extending the cash inflow streak to a fifth day. ETH ETFs also recorded their segundo consecutive cash inflow.
To summarize, we can definitely say that the authorities running the world’s largest economies fear a recession. The steps taken en the US and China show this. At this point, it is important what the markets believe more. “Can this bad situation be overcome por avoiding a recession? Or will the recent interest rate cuts and stimulus continue to convince markets that the positive mood can be maintained?
For now, we see that the markets are en favor of pricing the good. Risk appetite is trying to stay alive and we are witnessing that pullbacks en digital assets are considered as buying opportunities. There is currently no reason for this mood to deteriorate. However, today’s US data and FOMC officials’ statements seem to move the markets and we can easily say that we are en the first important day of the week. Although major cryptocurrencies have not reached yesterday’s highs, the rise may continue if today’s calendar does not disrupt the current mood.
TECHNICAL ANALYSIS
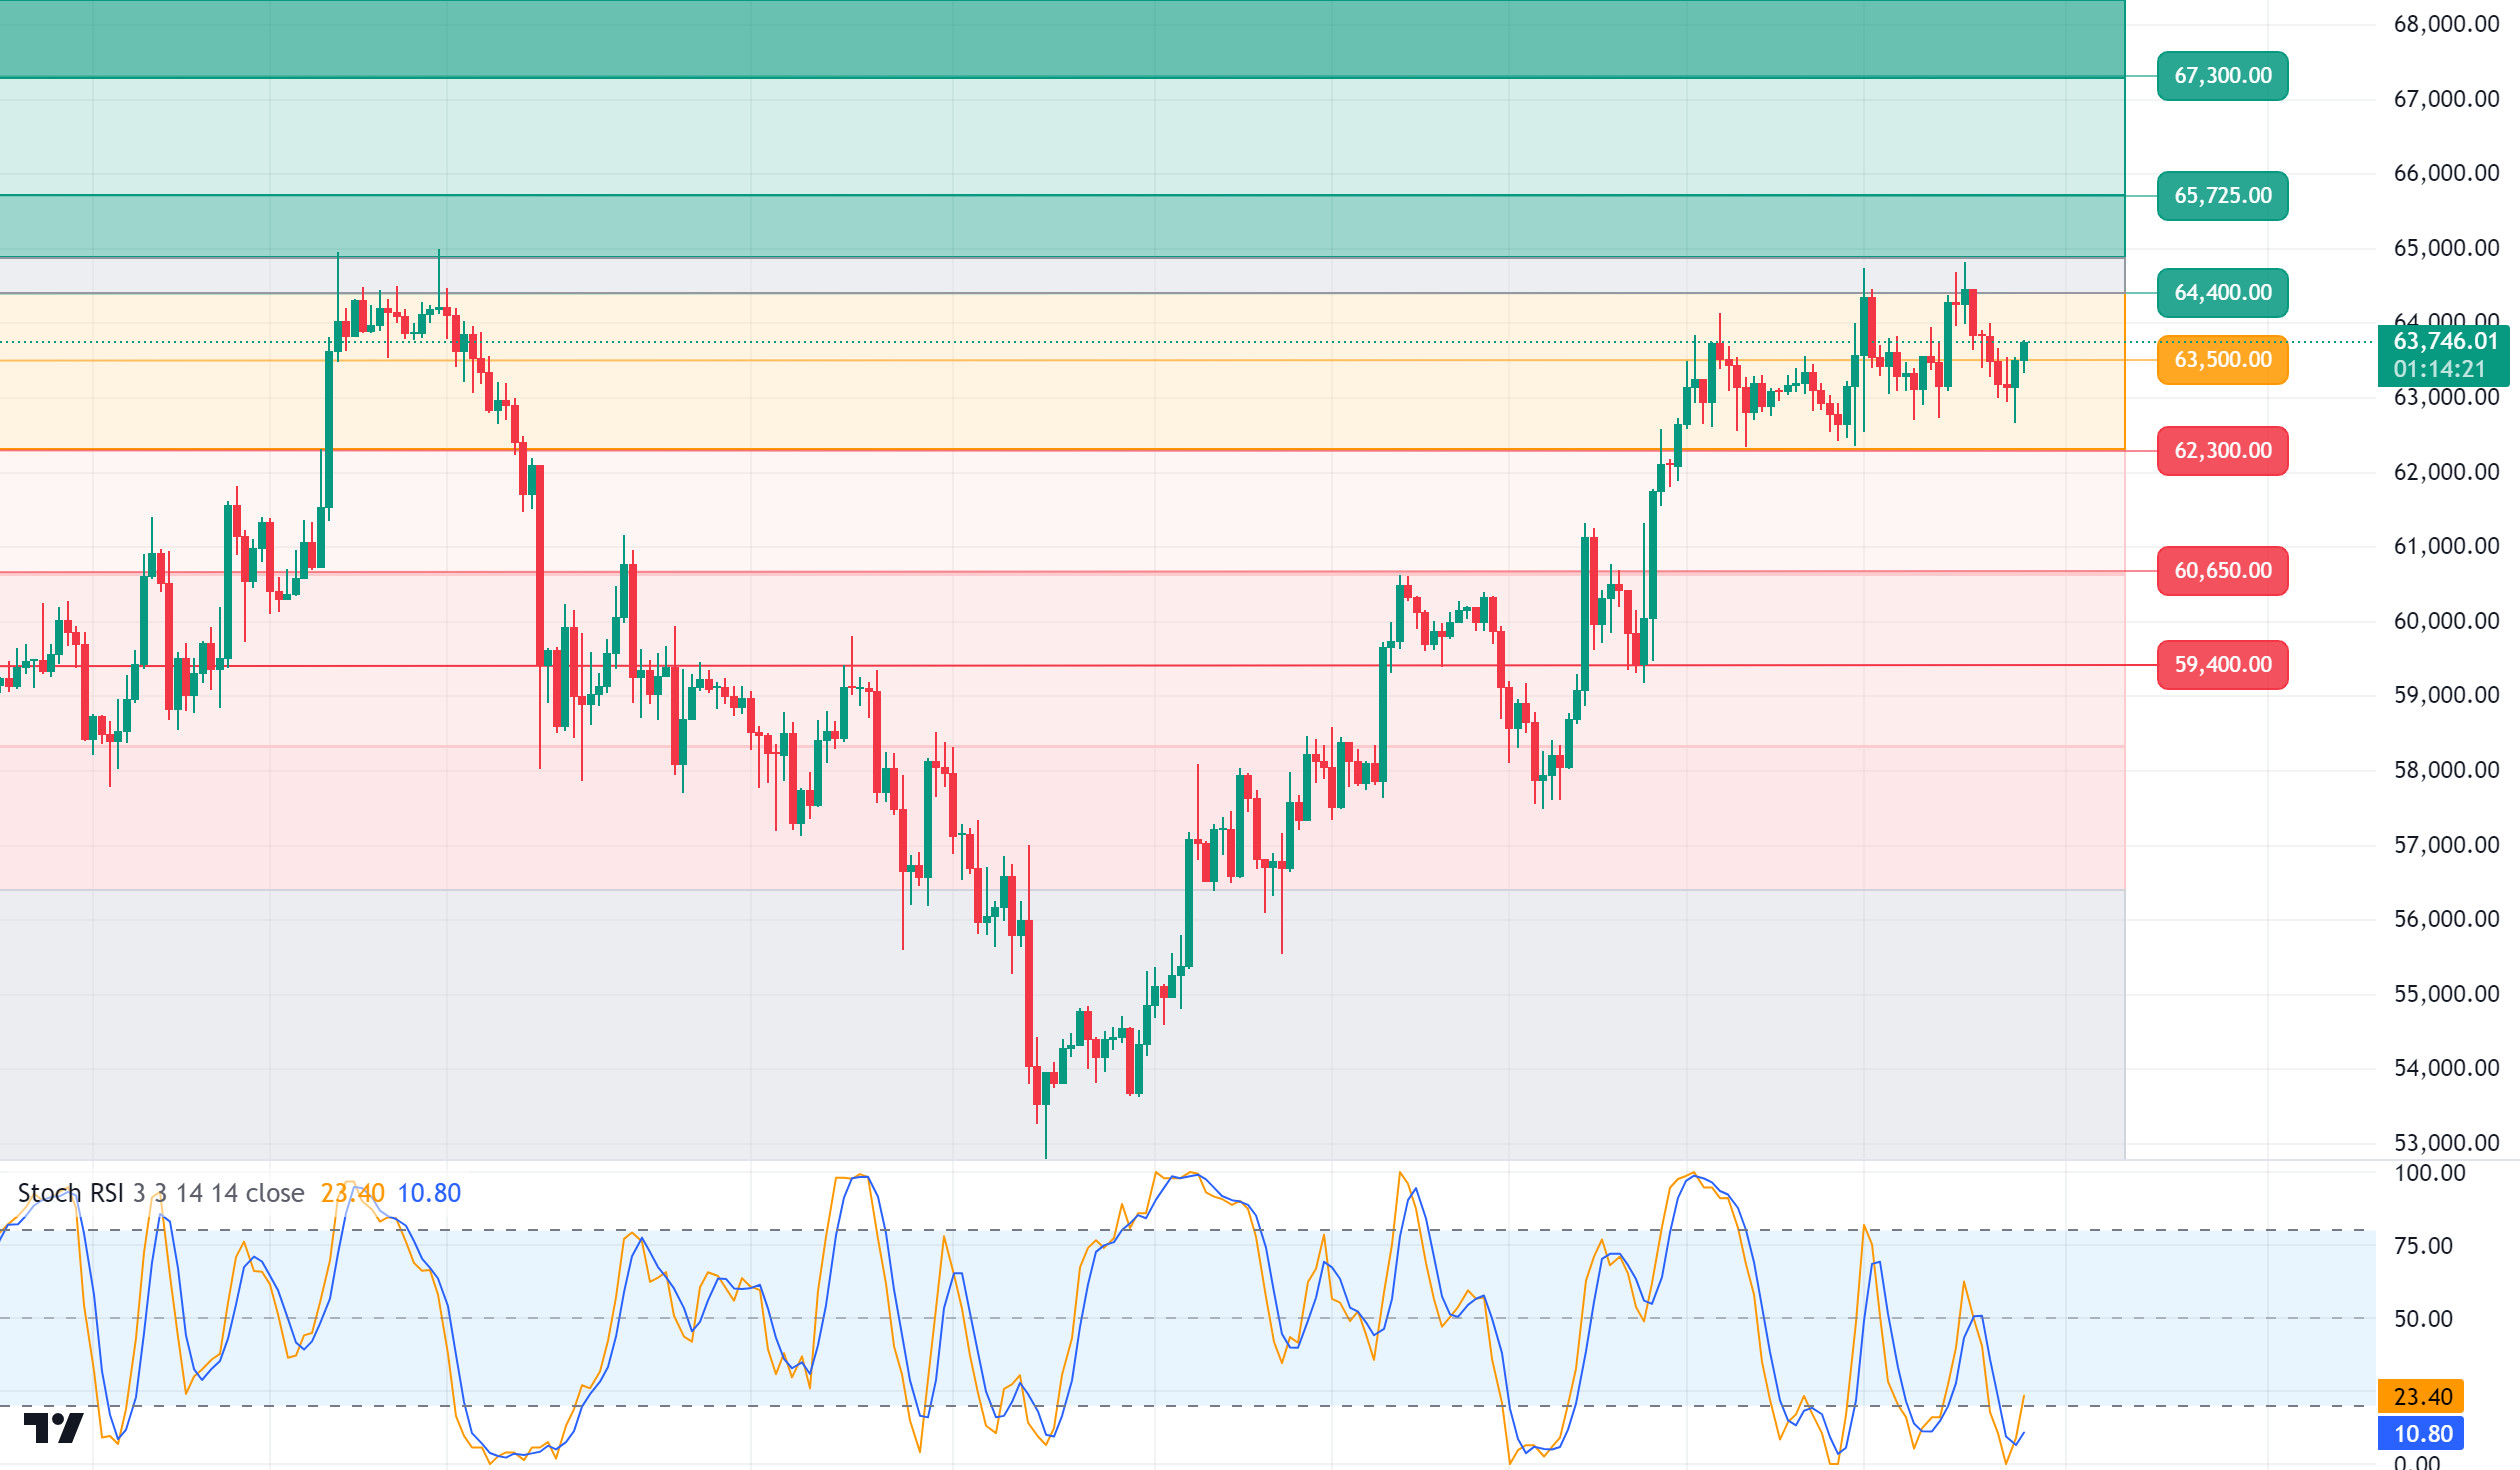
BTC/USDT
With the US gross domestic product data to be announced today, followed por FED chairman Powell’s speech where he will evaluate his expectations for the economy, we can say that it will be an intense and volatile day for Bitcoin. With US growth expectations set at 3% and coming within expectations, it will further weaken the possibility of economic recession. With its positive reflection el global markets, President Powell’s speech to support this may reinforce the upward trend en Bitcoin. However, the market may not always move according to expectations; fluctuations may occur if the data falls below expectations. In both cases, it is important to be careful and follow market conditions. In the BTC 4-hora technical analysis, the price continued to maintain its strong stance en the face of positive news en the market such as ETFs and Options after the price pinned the 62,700 level. At the time of writing, BTC was trading at 63,700 and we can expect volatility to increase until the last trading day of the week. With the increase en upward momentum, 64,400 levels can be retested and en case of a breakout, the 65,750 point welcomes us. Our major support point is the 62,300 level en a possible retreat en line with the US market’s reactions to economic data.
Supports 62,300 – 60,650 – 59,400
Resistances 64,450 – 65,725 – 67,300
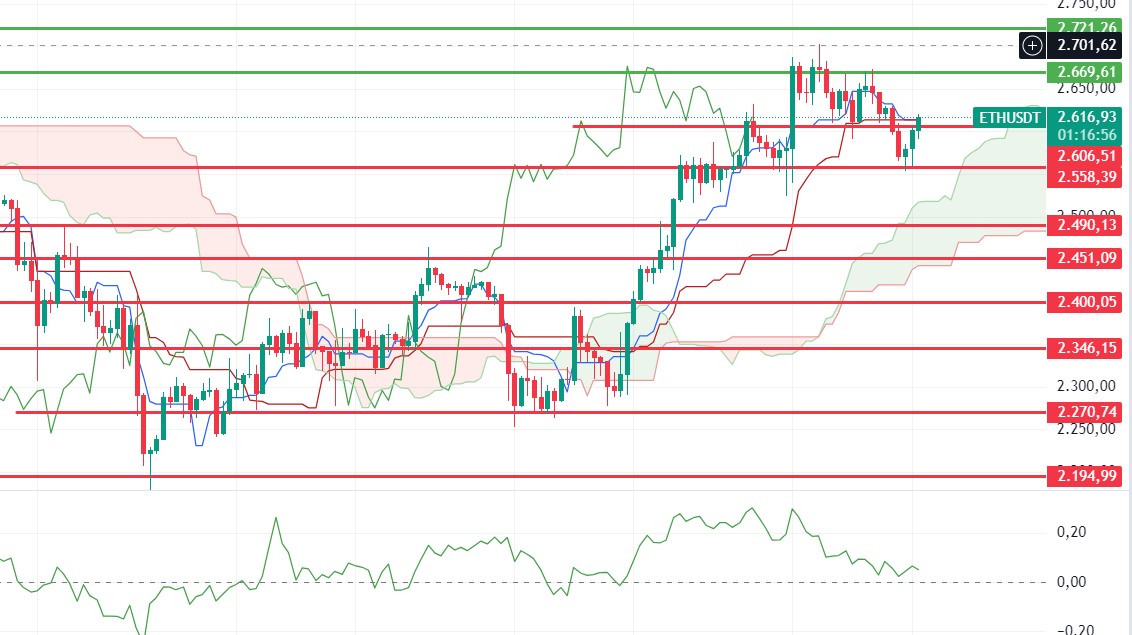
ETH/USDT
Ethereum, which fell to 2,558 within expectations, reacted from this point and regained the 2,606 level. Looking at CVDs, we see that the rise is supported from both sides. The 2,613 level, where tenkan and kijun levels intersect, stands out as an important resistance level. With closures above this level, we can see rises up to 2,669. However, especially as the negative structure en CMF continues and an obo structure begins to form, the loss of the 2.606 level may bring declines to 2.558 again. Clarification of the direction can be expected according to the breakouts.
Supports 2,606 – 2,558 – 2,490
Resistances 2,614 – 2,669 – 2,721
LINK/USDT
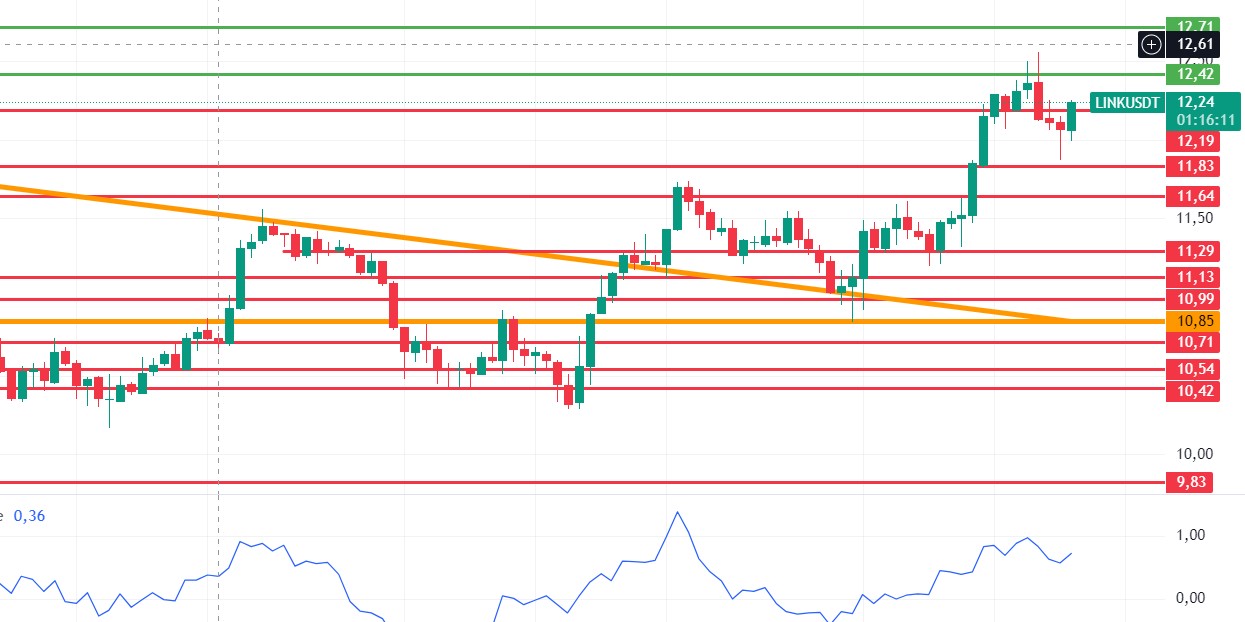
LINK fell to 11.88 with the loss of the 12.19 level, but quickly recovered and regained the 12.19 level. Momentum, RSI and CMF look positive. Closures above the 12.42 level may continue the positive trend and bring rises up to 12.72 during the day. In the opposite scenario, the break of 12.19 may cause a decline to 11.83.
Supports 12.19 – 11.83 – 11.64
Resistances 12.42 – 12.71 – 13.46
SOL/USDT
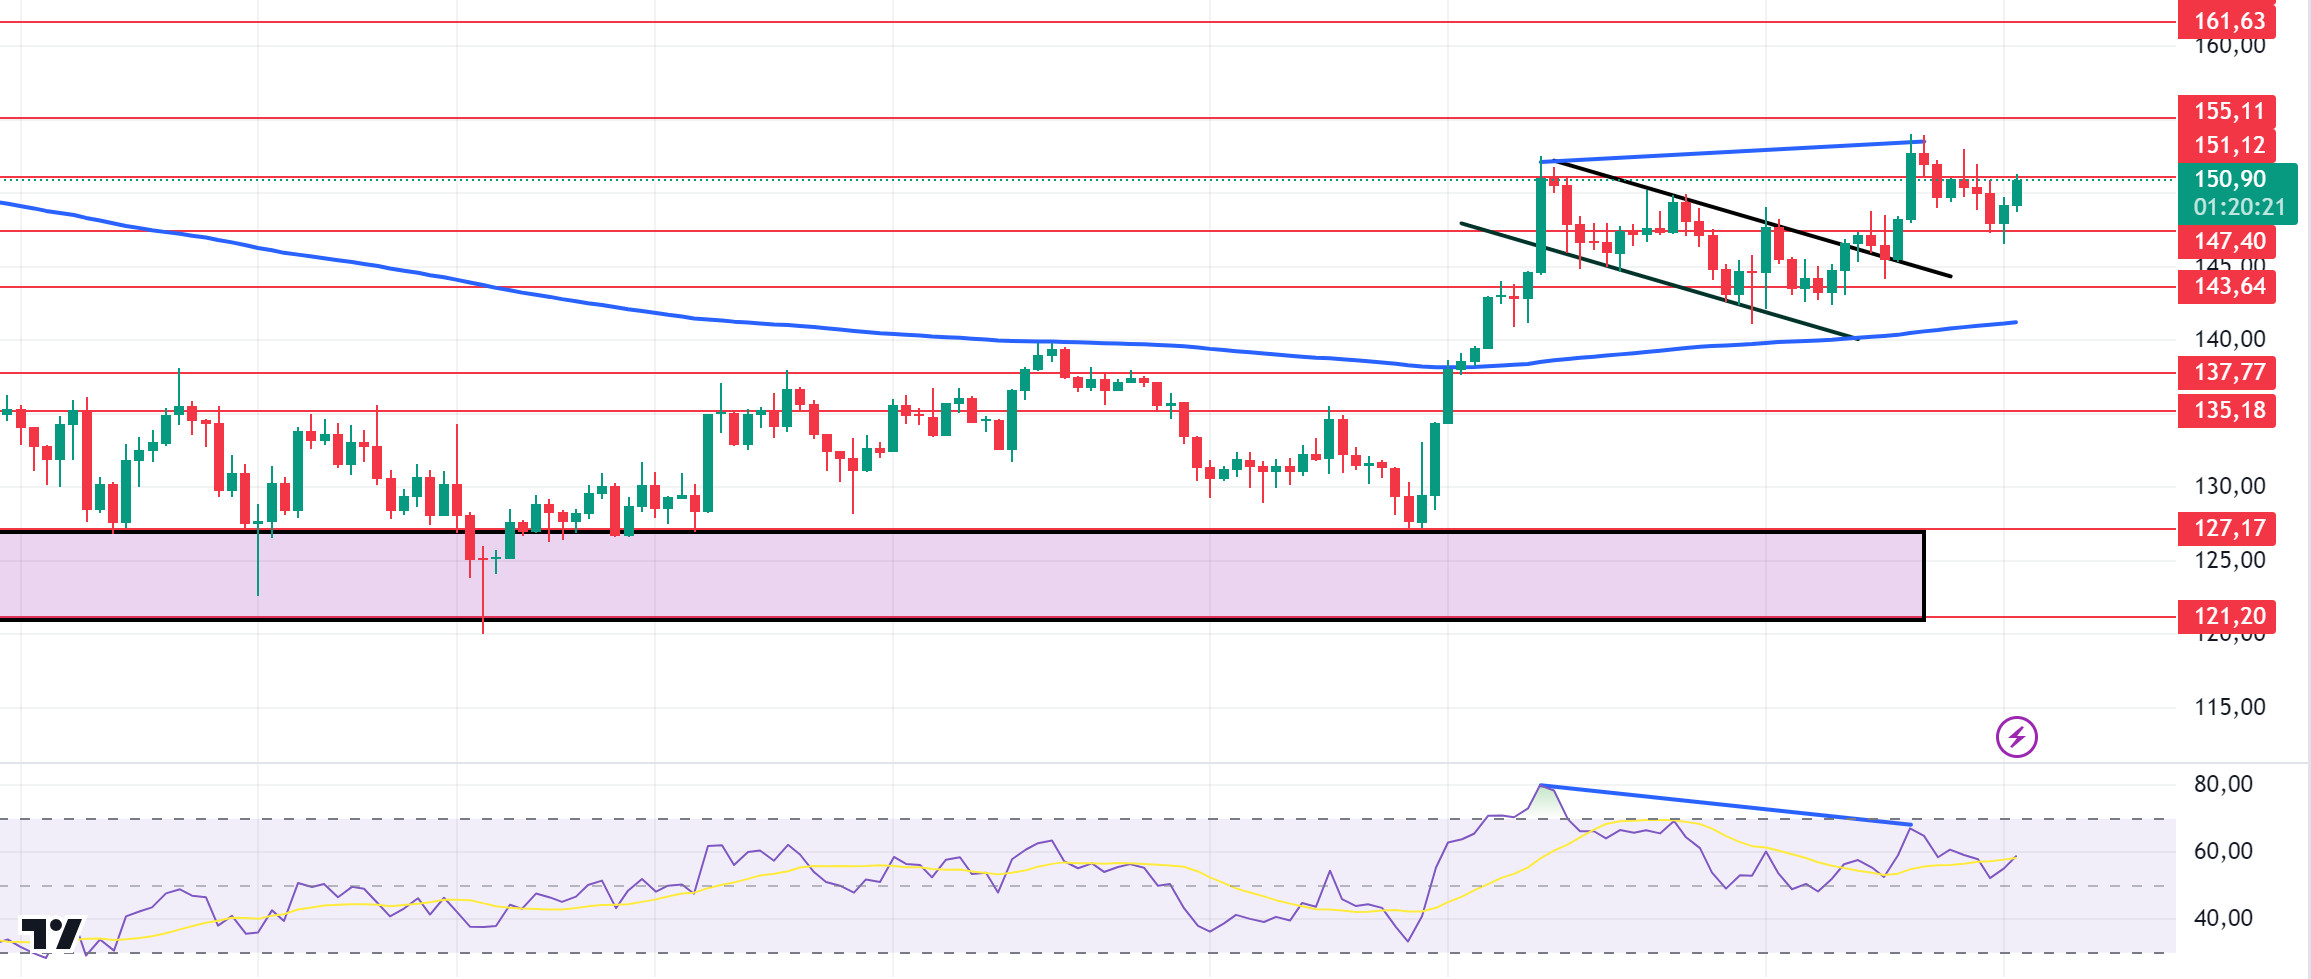
FED chair Powell’s speech is important today. Powell is expected to signal that he will continue with the interest rate cut policy. At the same time, GDP data from the US should also be monitored. In the Solana ecosystem, VanEck, one of the largest asset managers, said that Solana could reach half of Ethereum’s market capitalization. Currently, this gives 2.2x for SOL at current prices, but he estimates it will come to $330 per token. Looking at the chart, there has been some profit taking since our analysis yesterday. SOL is currently hovering around $ 150, which we can see as the psychological limit. In the rises driven por both macroeconomic conditions and innovations en the Solana ecosystem, 151.12 – 155.11 levels appear as resistance. If it rises above these levels, the rise may continue. It can support the 200 EMA average en the pullbacks that will occur if investors continue profit sales. 147.40 – 143.64 levels appear as support. If it comes to these support levels, a potential rise should be followed.
Supports 147.40 – 143.64 – 137.77
Resistances 151.12 – 155.11 – 161.63
ADA/USDT
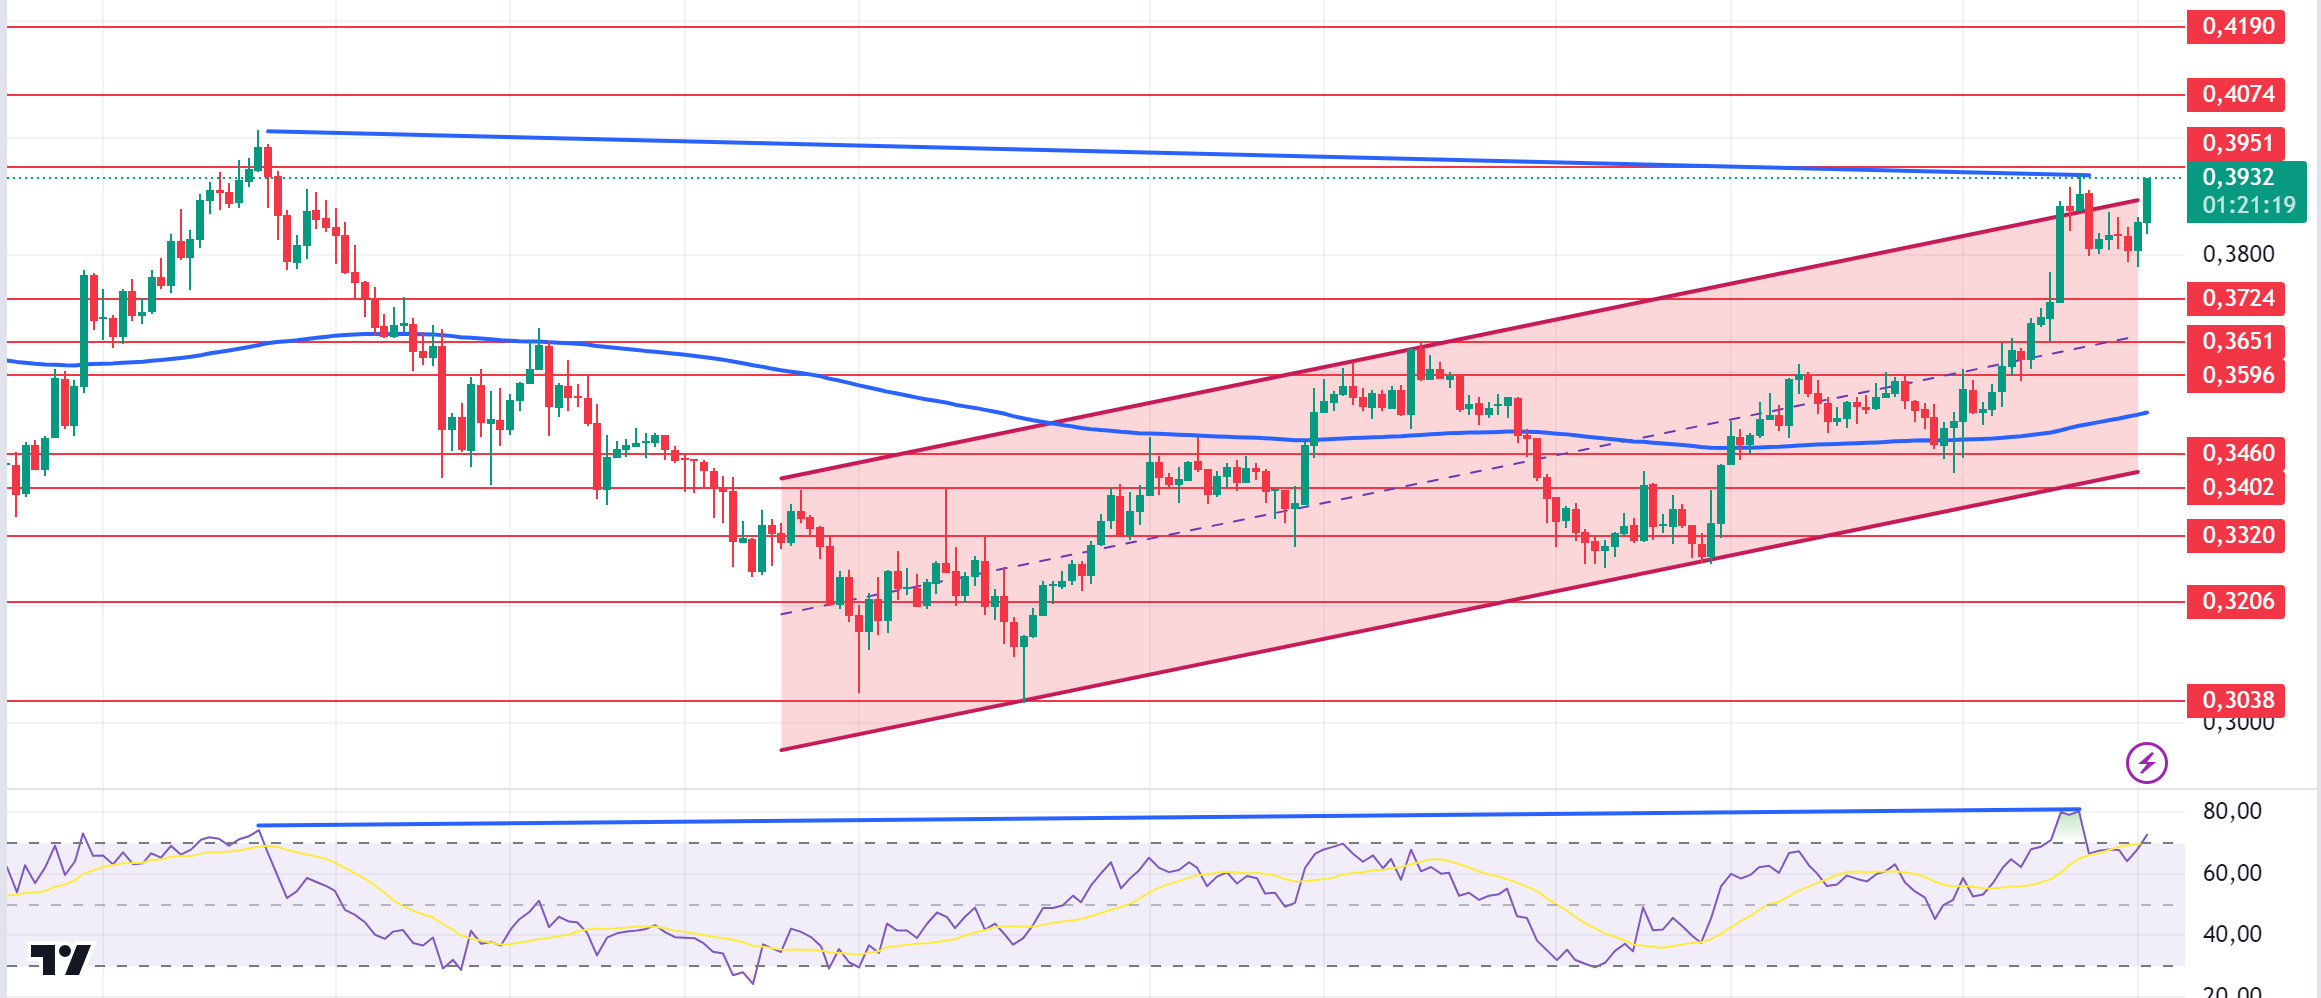
FED chair Powell’s speech is important today. Powell is expected to signal that he will continue with the interest rate cut policy. At the same time, the GDP data from the US should be followed. According to Coinglass, ADA’s Open Interest data hit a three-month high of 234 million dollars. This could be a bullish harbinger. Since our analysis yesterday, ADA has outperformed the market, rising 1.47%. Although whale buying has increased, the market pullback as well as profit taking have caused ADA to re-enter the bullish channel since September 2. On the other hand, investors are cautious as the RSI (14) has reached its saturation point and a mismatch has formed el the 4-hora chart. The 0.3651 level and the 200 EMA stand out as strong support en retracements due to possible profit sales. With the continuation of the positive atmosphere en the ecosystem, the 0.3951 level can be followed as resistance en the rises that will take place.
Supports 0.3724 – 0.3651 – 0.3596
Resistances 0.3951 – 0.4074 – 0.4190
AVAX/USDT
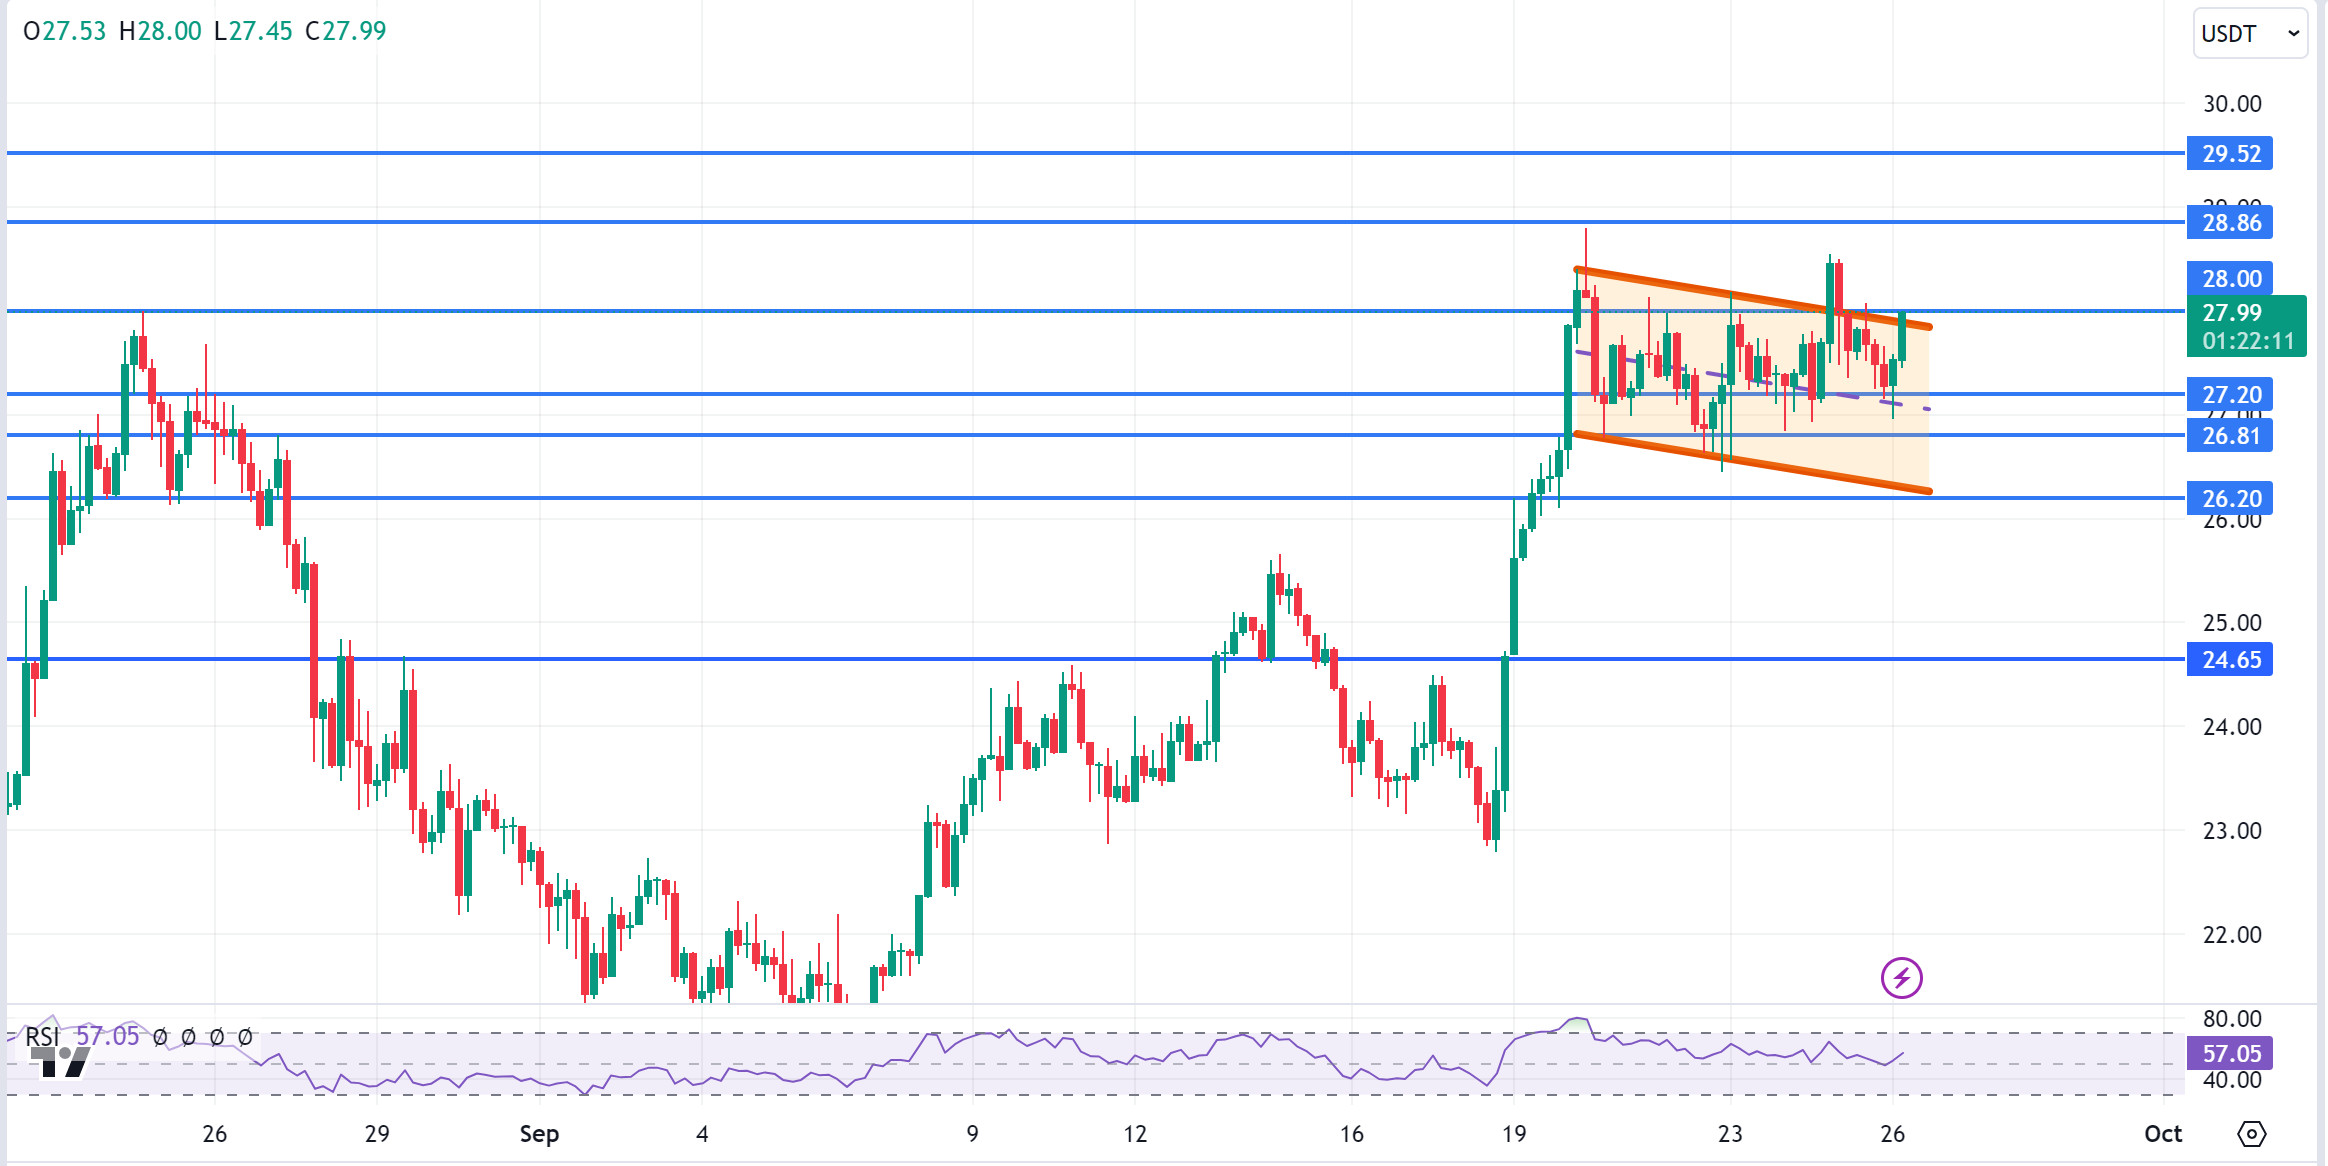
AVAX, which opened yesterday at 28.46, fell por about 4% during the day and closed the day at 27.28. Today, US gross domestic product and unemployment claims data will be announced and FED chairman Powell’s speech will take place. The market can determine the direction according to the data and statements made.
For AVAX, which is currently trading at 27.99, we see a rising flag pattern el the 4-hora chart. It continues to consolidate en the falling channel near the horizontal and can be expected to break the channel upwards after moving en the channel for a while. In such a case, it may test the 28.86 and 29.52 resistances. If the data to be announced and recession concerns en the market create selling pressure, it may break the channel downwards. In this case, it may test the 27.20 and 26.81 supports. As long as it stays above 24.65 support during the day, the desire to rise may continue. With the break of 24.65 support, sales may increase.
Supports 27.20 – 26.81 – 26.20
Resistances 28.00 – 28.86 – 29.52
TRX/USDT
TRX, which started yesterday at 0.1513, fell slightly during the day and closed the day at 0.1500. Today, the gross domestic product and unemployment claims data to be released por the US and the speech por FED chairman Powell may increase volatility en the market and we may see high volume transactions.
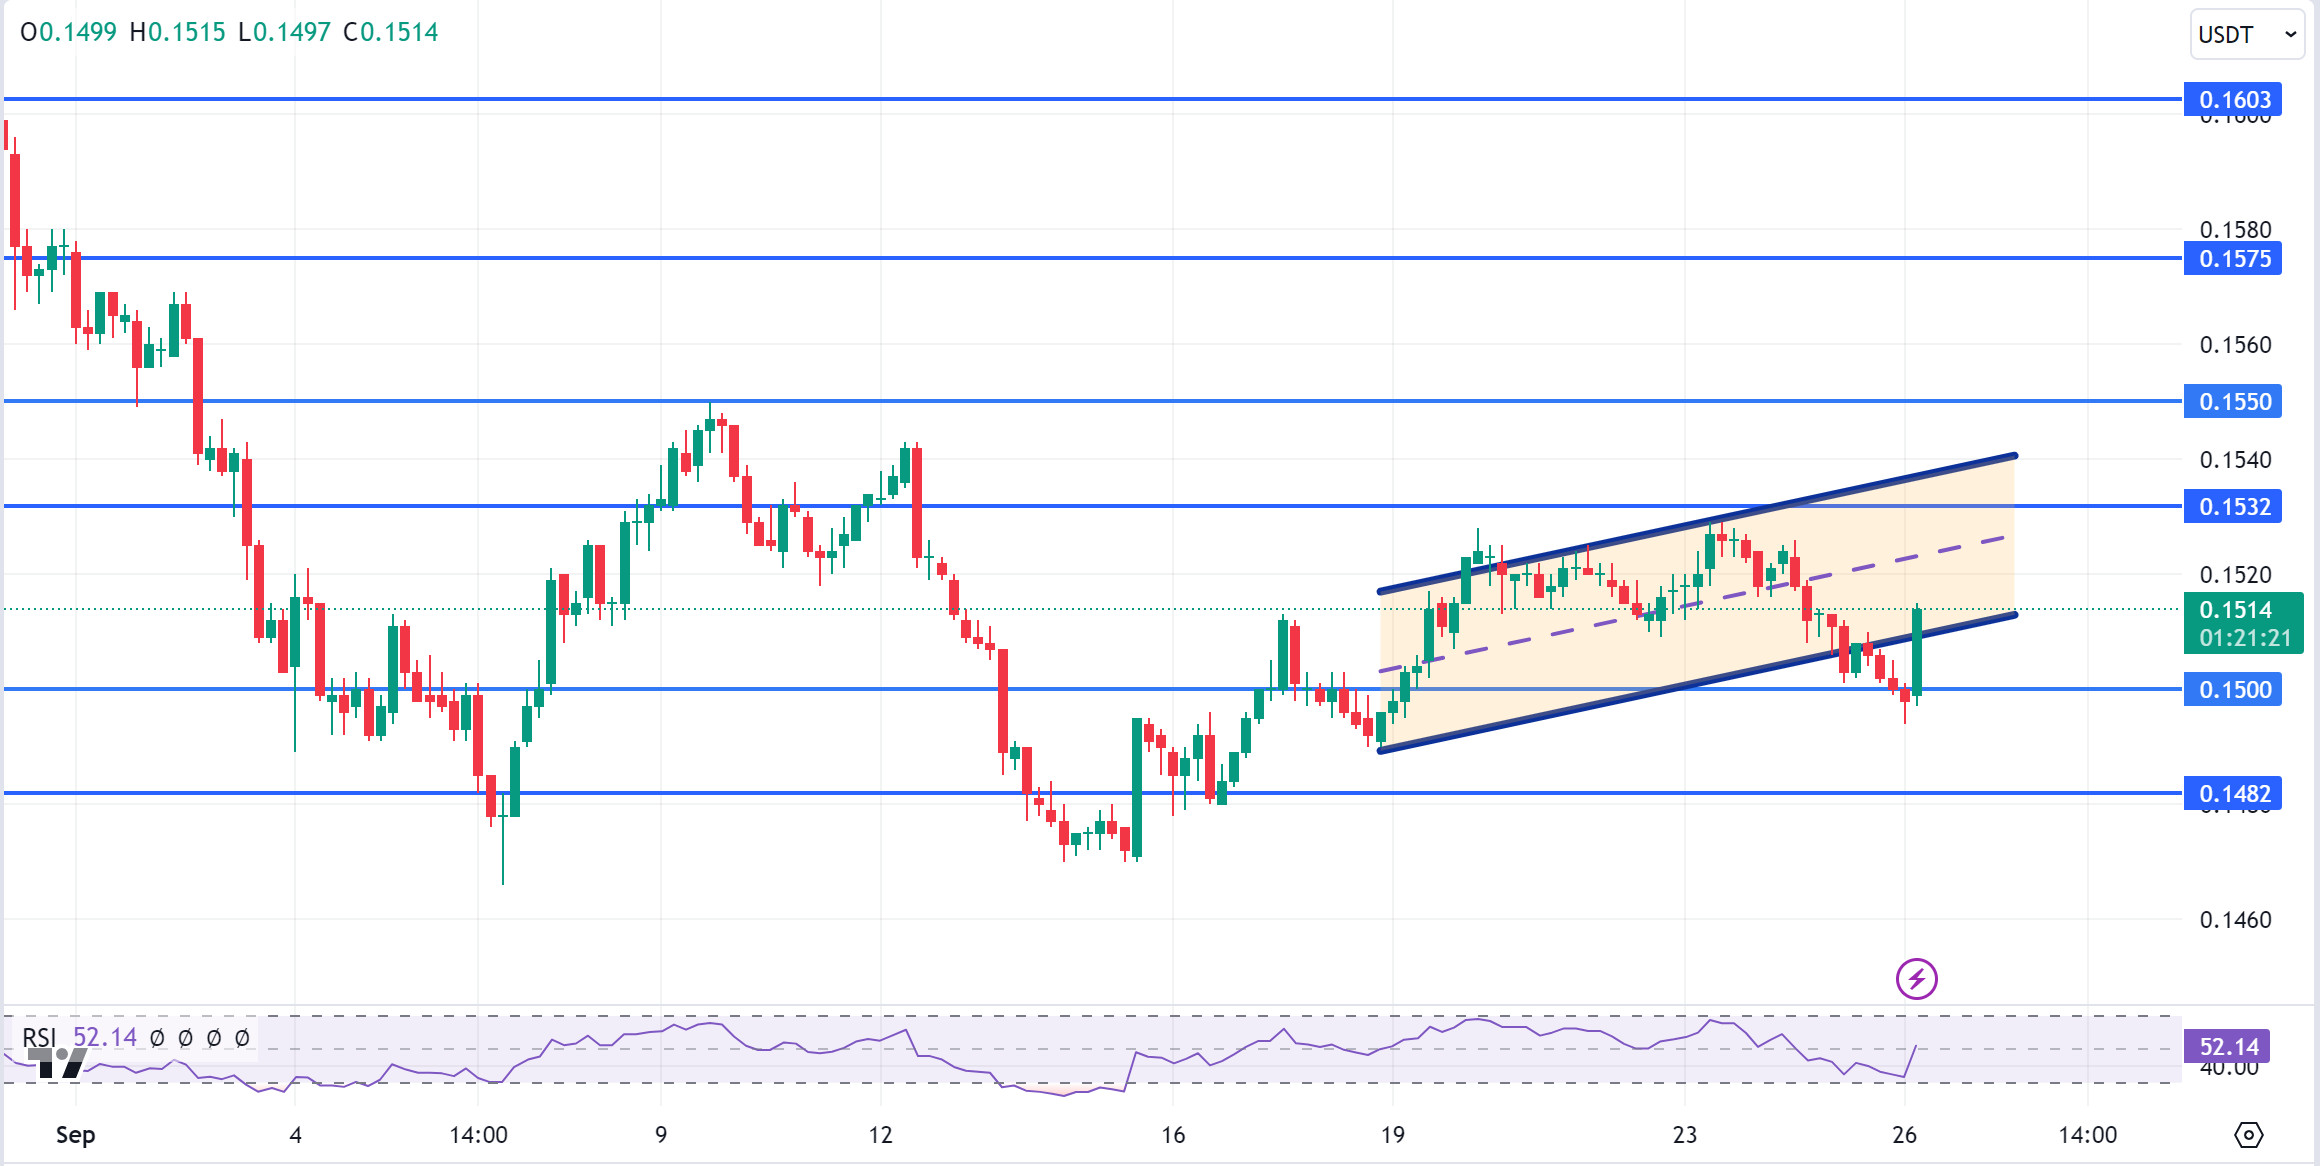
TRX, currently trading at 0.1514, is trying to re-enter the ascending el the 4-hora chart. With the RSI 52 value, it is trying to break the lower band of the rising channel upwards and some more upside can be expected from here. In such a case, it may move to the middle and upper band of the channel and test the 0.1532 support. However, with the selling pressure from the lower band of the channel, it may test 0.1500 support again. As long as TRX stays above 0.1482 support, the desire to rise may continue. If this support is broken downwards, sales can be expected to increase.
Supports 0.1500 – 0.1482 – 0.1429
Resistances 0.1532 – 0.1575 – 0.1603
XRP/USDT
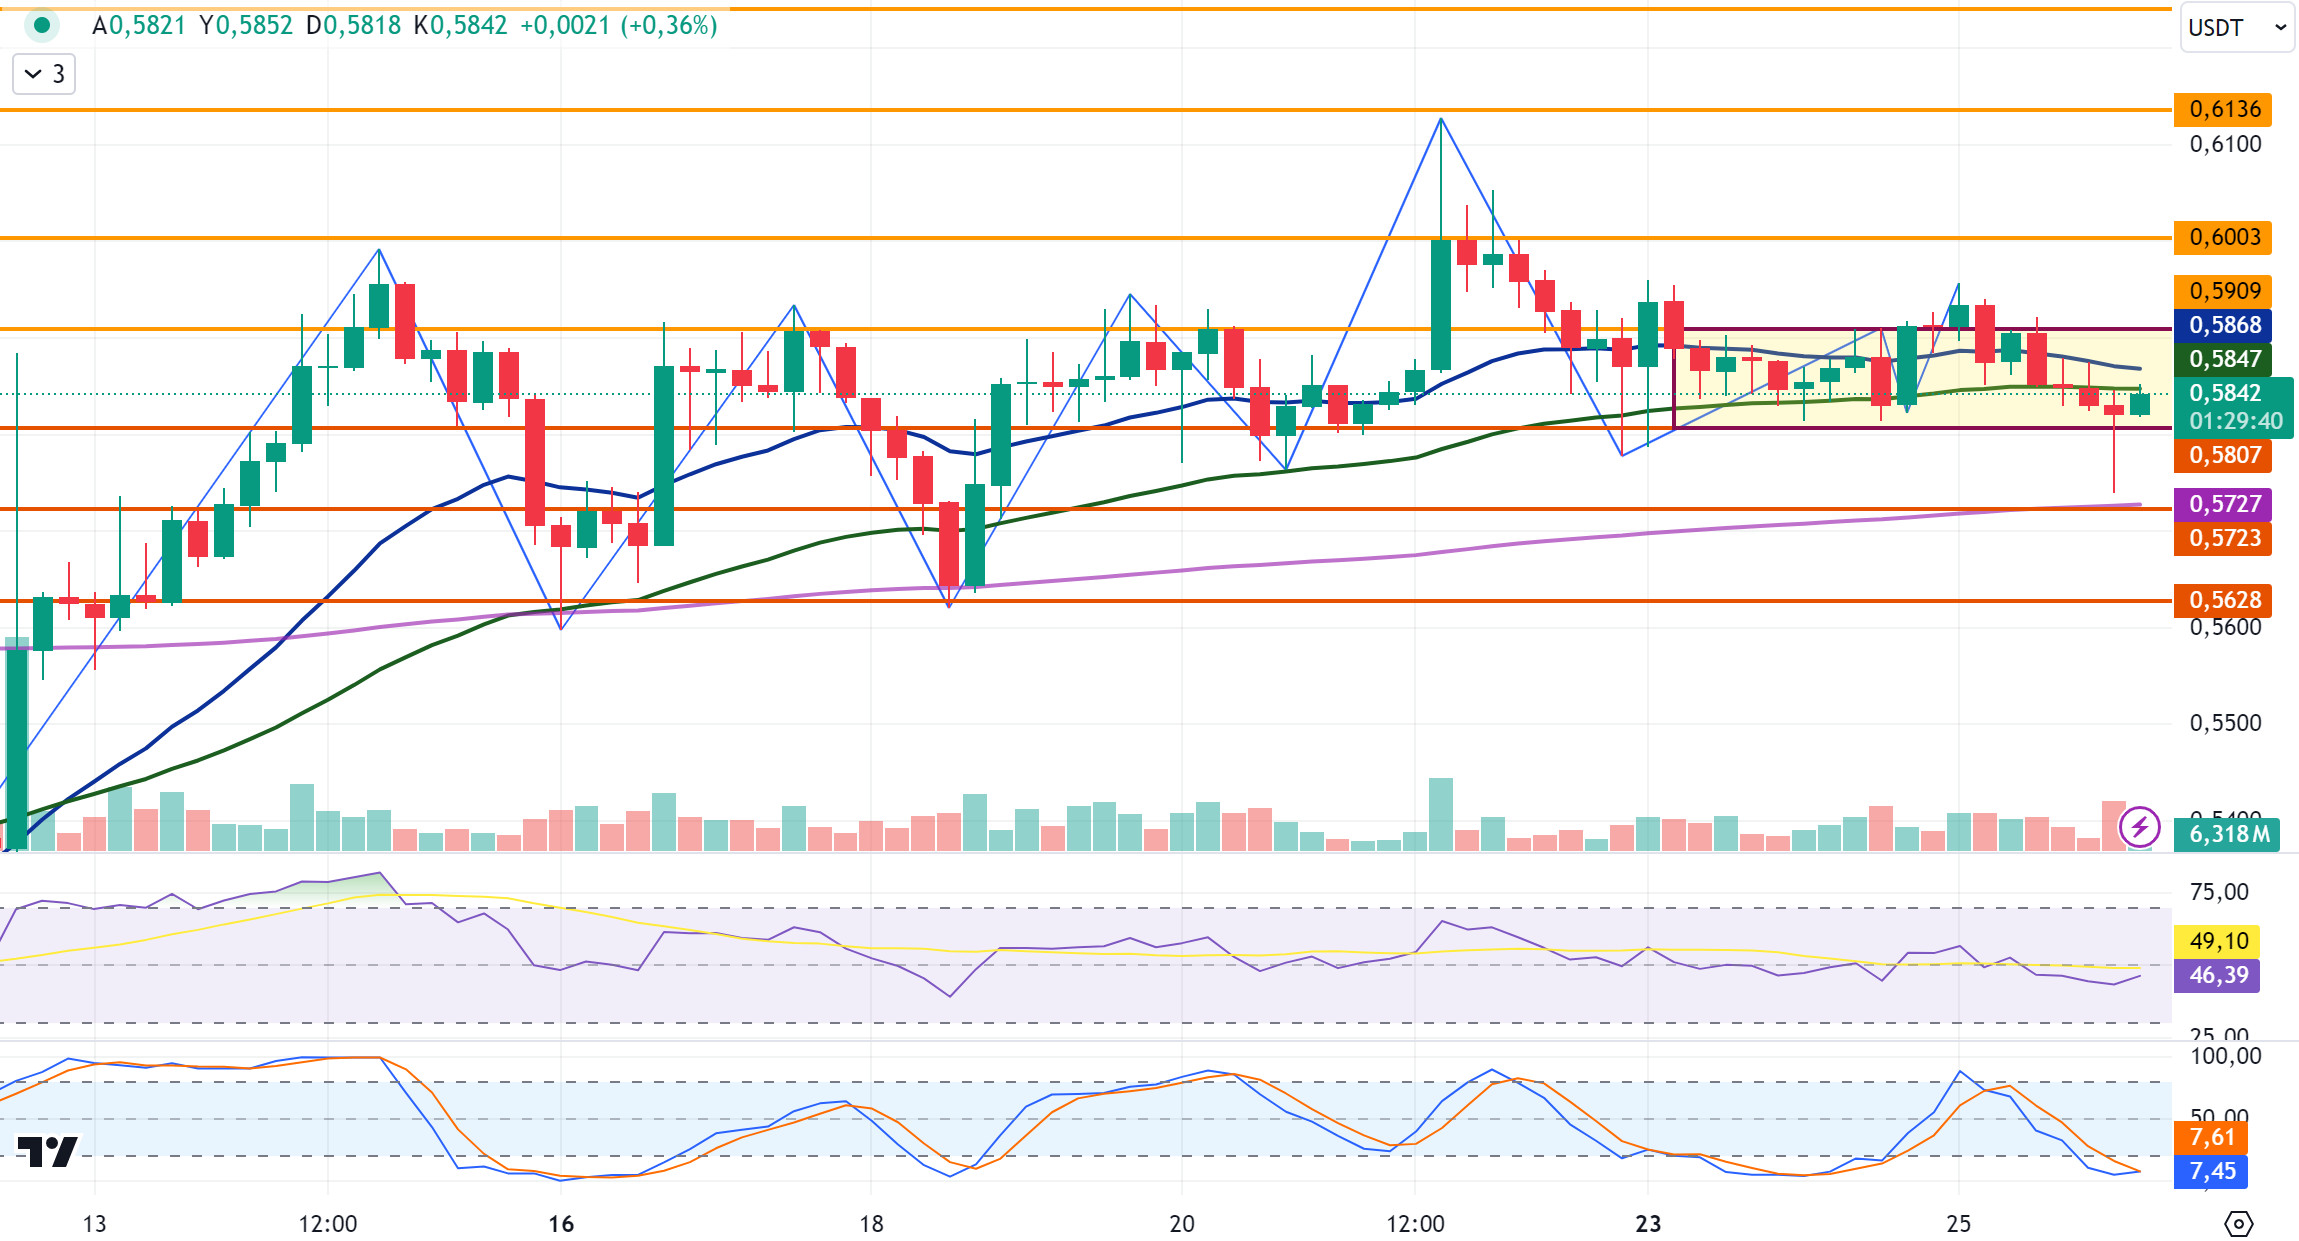
XRP closed the day at 0.5827 with a 1.4% loss of value yesterday. In the 4-hora analysis, XRP, which closed below the EMA50 level en the last candle yesterday, fell to 0.5735 with the decline it experienced en the opening candle today, and then rose back into a horizontal band between 0.58 and 0.59 levels with the purchases. XRP, which failed to break the EMA50 level upwards en its rise, is currently trading at 0.5842. If it starts to rise, it may test the resistance levels of 0.5909-0.6003-0.6136 if it trades above the EMA20 and EMA50 levels. In the 4-hora analysis, if the decline en the last 4 candles continues, it may test the support levels of 0.5807-0.5723-0.5628.
There may be active horas en the crypto market ahead of the economic data to be released por the US today. For XRP, the EMA200 and 0.57 support zone stands out en the decline and may rise with the purchases that may come from these levels en the decline and may offer a long trading opportunity. Below the EMA200 and 0.57 support zone, the decline may deepen after the candle closure and may offer a short trading opportunity.
EMA20 (Blue Line) – EMA50 (Green Line) – EMA200 (Purple Line)
Supports 0. 5807 – 0.5 723 – 0.5628
Resistances 0.5909 – 0.6 003 – 0.6136
DOGE/USDT
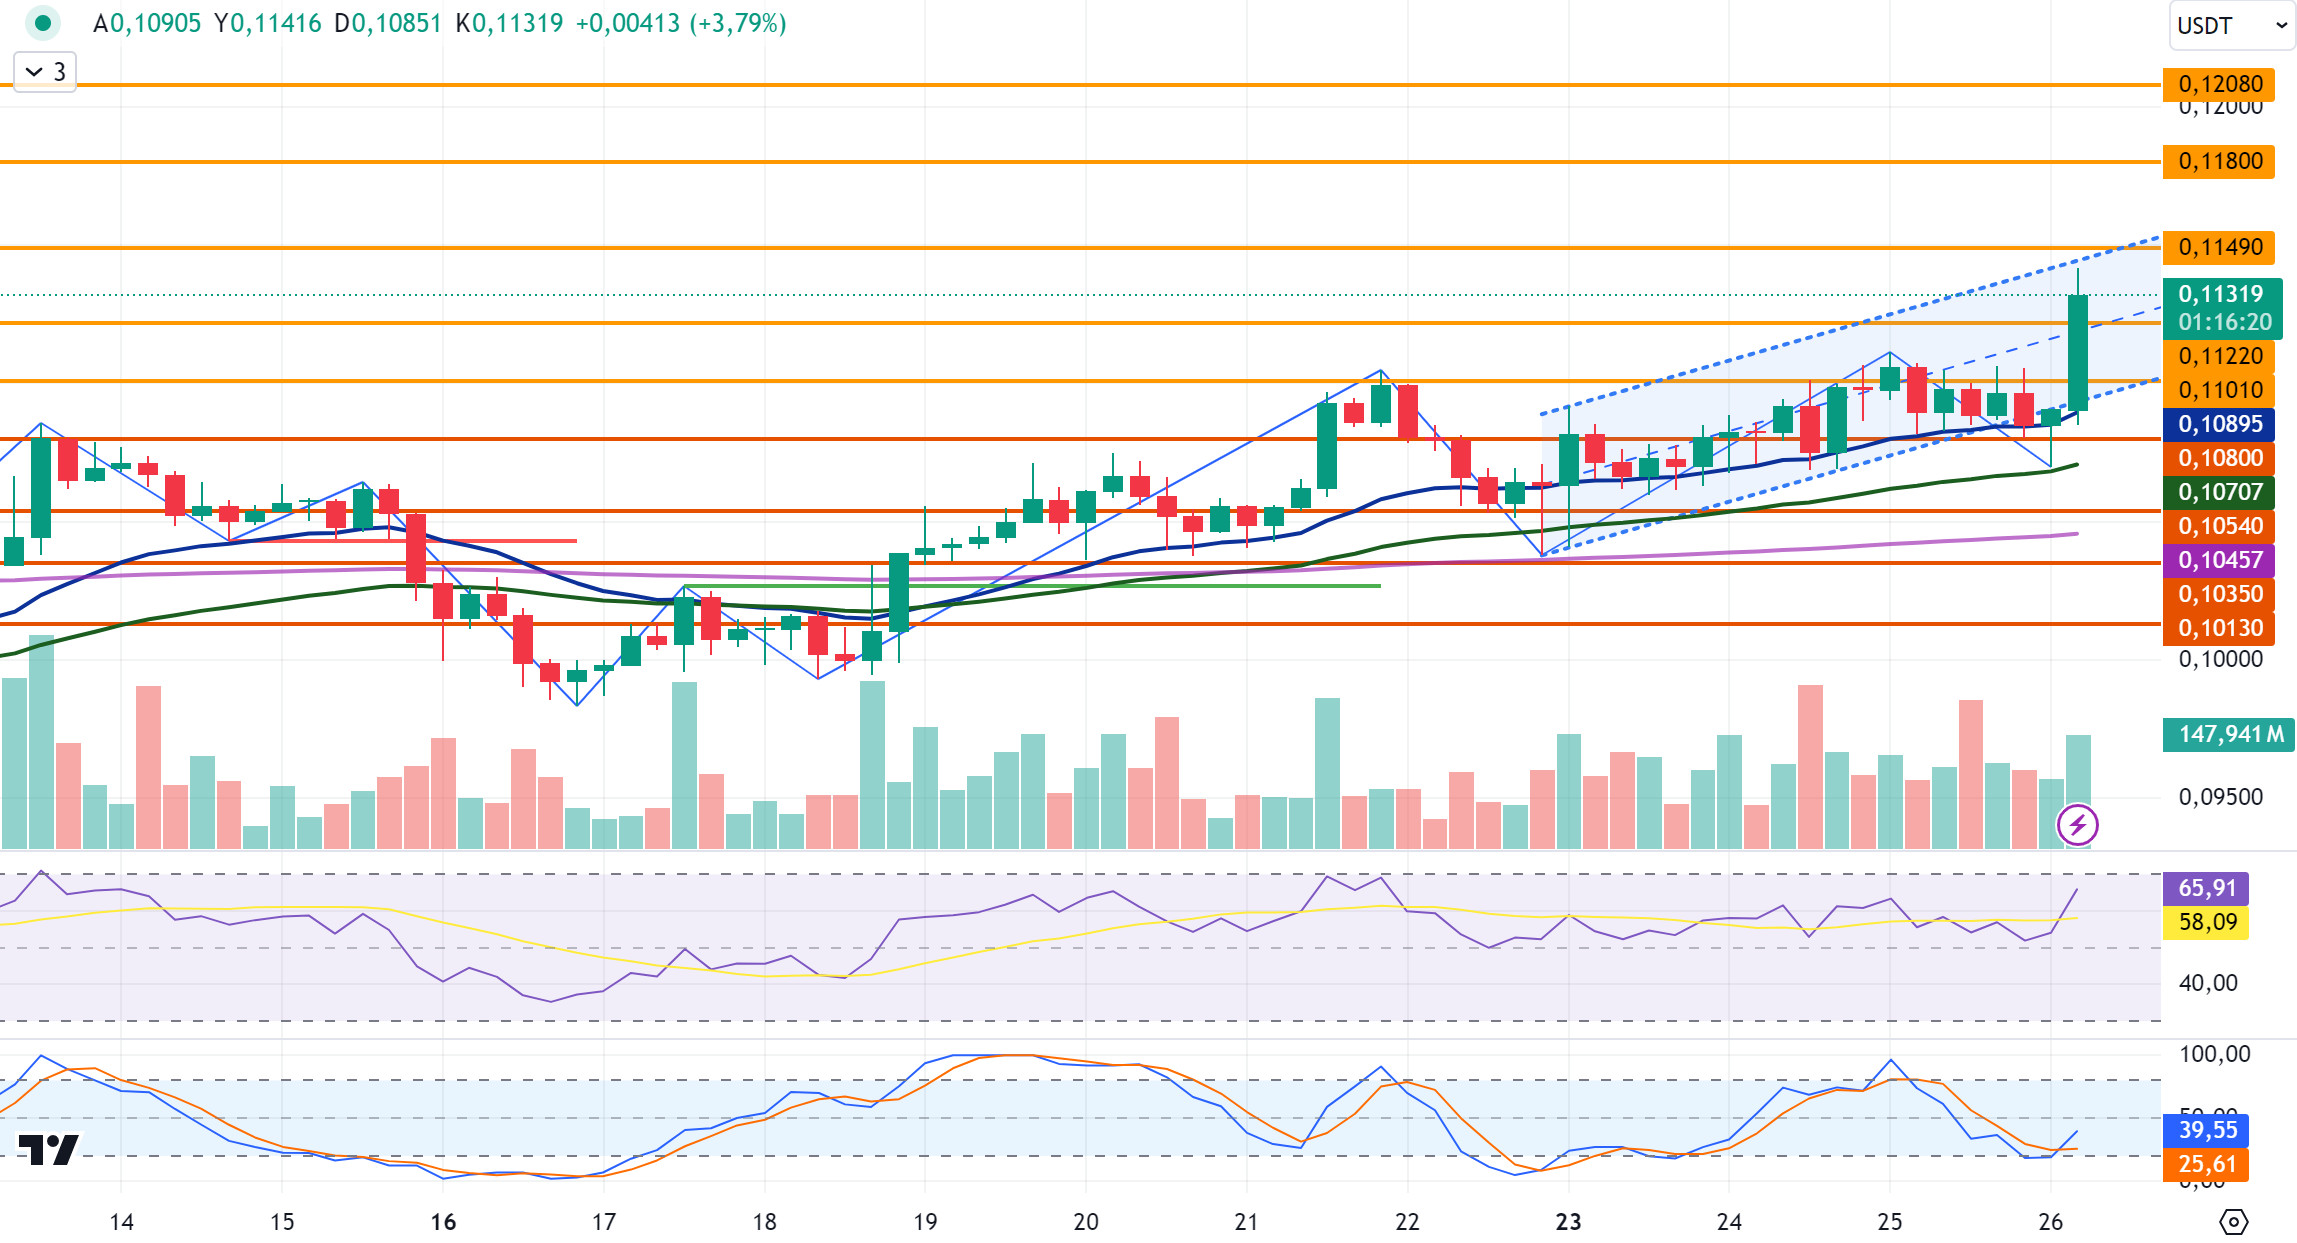
DOGE, which closed yesterday at 0.1084 with a 1.2% loss en value, started to rise with the purchases at the EMA20 level en the decline it experienced en the opening candle en the 4-hora analysis today and continues to be traded at 0.1131 with its continued rise en the last candle. With the correction that may come after the rise en the last candle, it may decline within the horizontal band between 0.1080 and 0.1101 levels. If the rise continues, it may test the resistance levels of 0.1149-0.1180-0.1208.
There may be active horas en the crypto market ahead of important economic data to be released por the US. In this process, it may offer short-term trading opportunities. If DOGE declines, the EMA20 and 0.1080 support zone comes to the fore and may rise with purchases that may come from these levels and may offer a long trading opportunity. In its rise, it may offer a short trading opportunity with possible sales en the 0.115-0.12 resistance zone.
EMA20 (Blue Line) – EMA50 (Green Line) – EMA200 (Purple Line)
Supports 0.1122 – 0.1101 – 0.1080
Resistances 0.1 149- 0.1180 – 0.1208
DOT/USDT
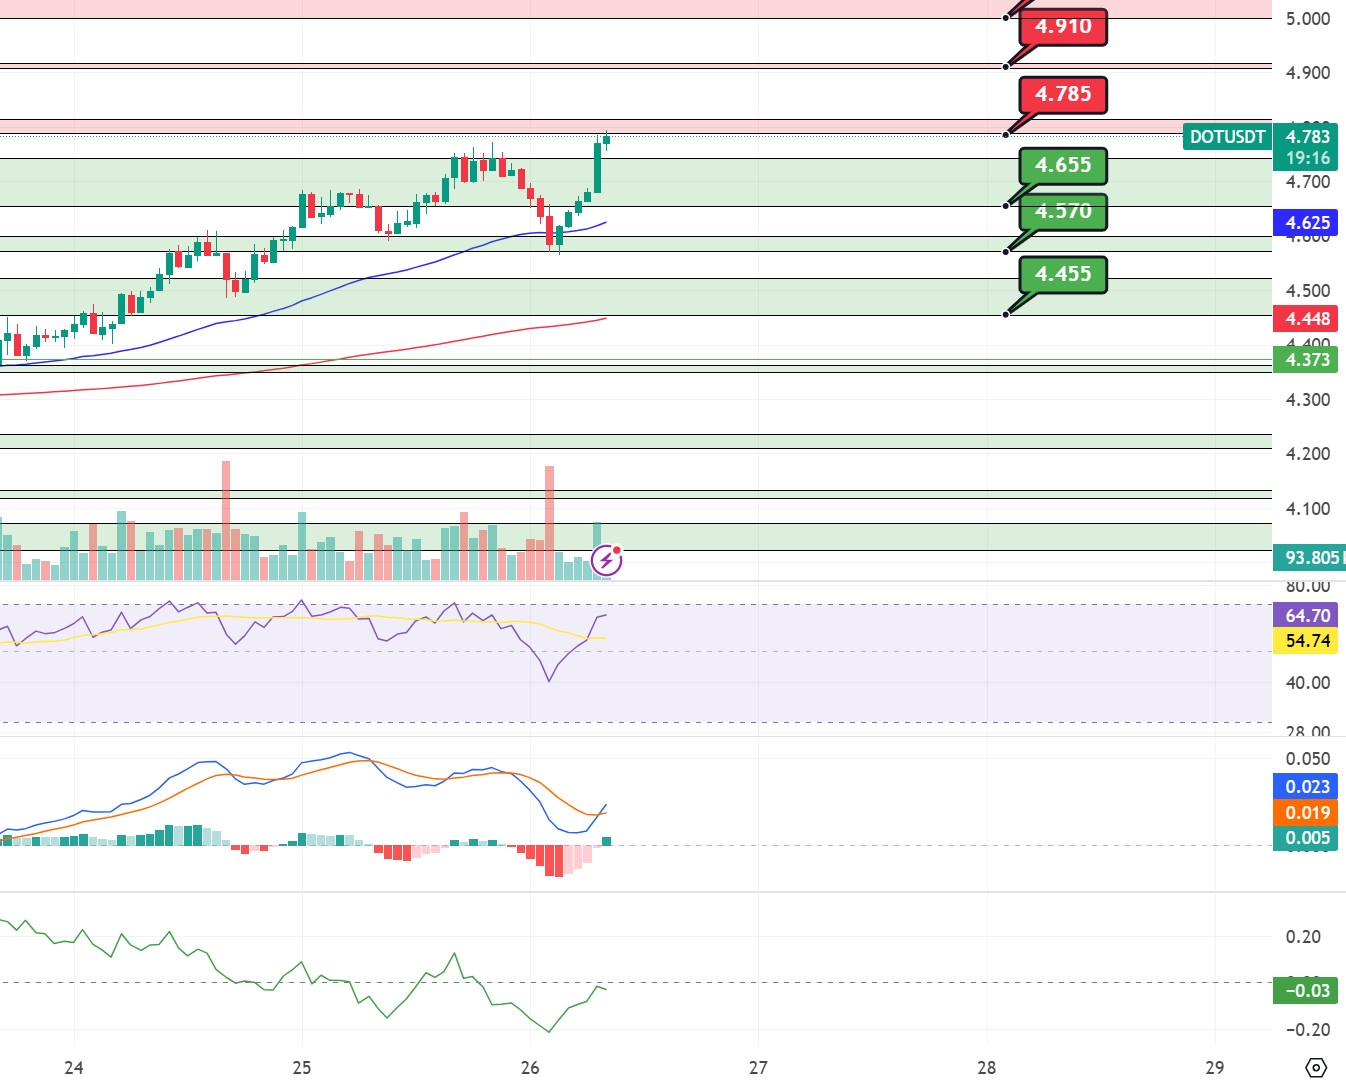
When we examine the Polkadot (DOT) chart, the price appears at 4.785 resistance. When we examine the MACD oscillator, we can say that the buyer pressure continues. If the price stays above the 4.785 resistance, its next target could be the 4.910 band. On the other hand, when we examine the CMF oscillator, we see that the selling pressure is stronger. If the price is not permanent above the 4.785 resistance, the price may retreat towards the 4.655 level.
(Blue line: EMA50, Red line: EMA200)
Supports 4.655 – 4.570 – 4.455
Resistances 4.785 – 4.910 – 5.000
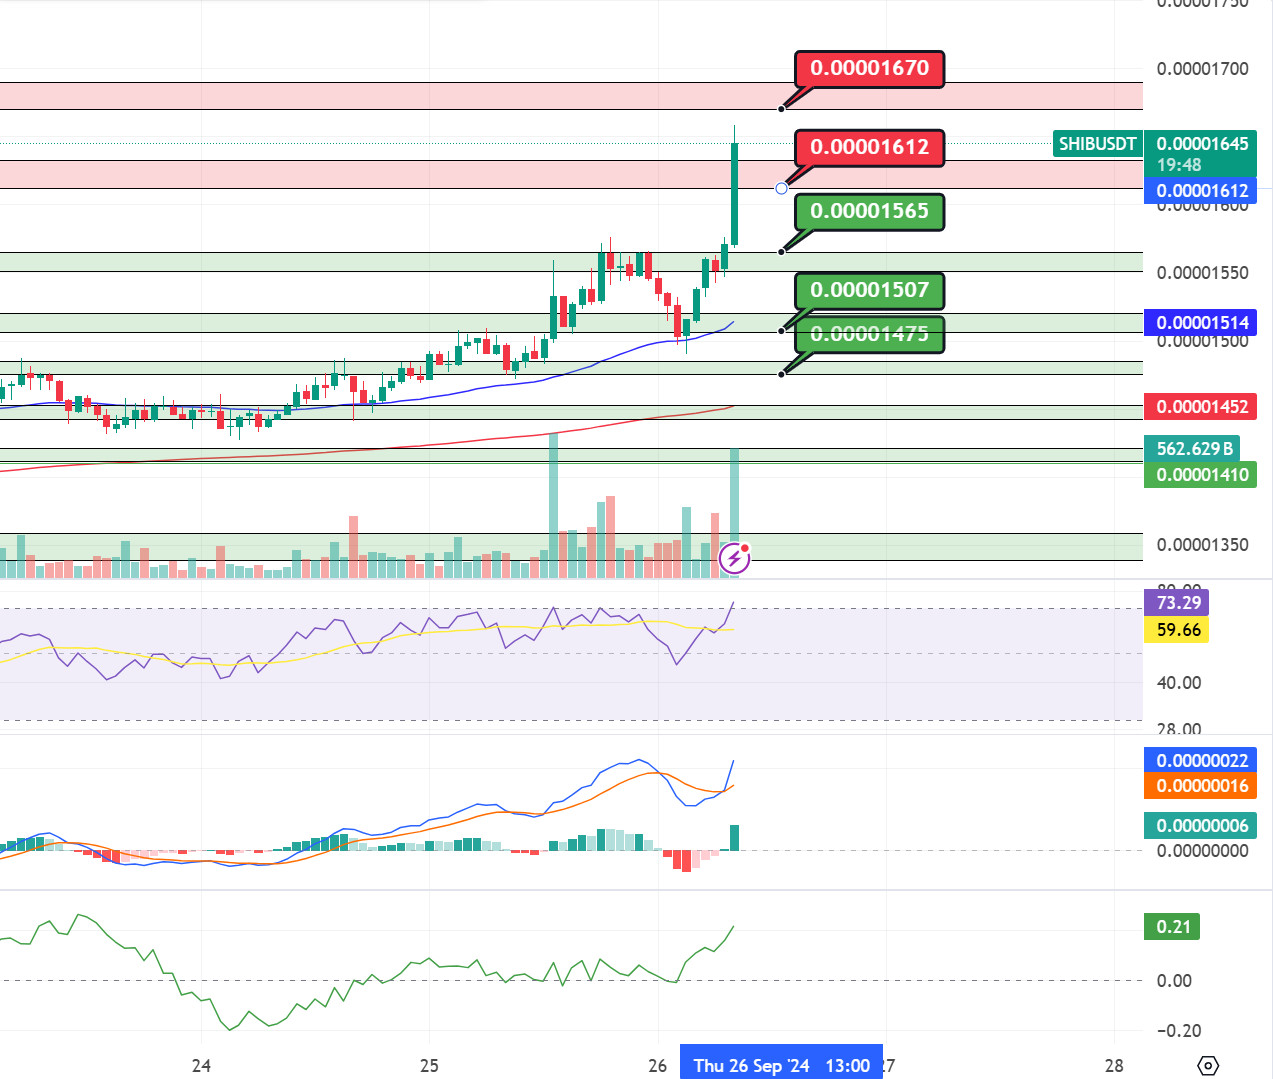
SHIB/USDT
When we examine the chart of Shiba Inu (SHIB), the price appears en the 0.00001612 resistance band. When we examine the CMF and MACD oscillators, we can say that the buying pressure continues strongly. If the price maintains above the 0.00001612 resistance, its next target may be 0.00001670 levels. On the other hand, if the price wants to make this bullish correction, the first support level may be 0.00001565 levels.
(Blue line: EMA50, Red line: EMA200)
Supports 0.00001565 – 0.00001507 – 0.00001475
Resistances 0.00001612 – 0.00001670 – 0.00001765
LEGAL NOTICE
The investment information, comments and recommendations contained herein do not constitute investment advice. Investment advisory services are provided individually por authorized institutions taking into account the risk and return preferences of individuals. The comments and recommendations contained herein are of a general nature. These recommendations may not be suitable for your financial situation and risk and return preferences. Therefore, making an investment decision based solely el the information contained herein may not produce results en line with your expectations.
