
MARKET SUMMARY
Latest Situation en Crypto Assets
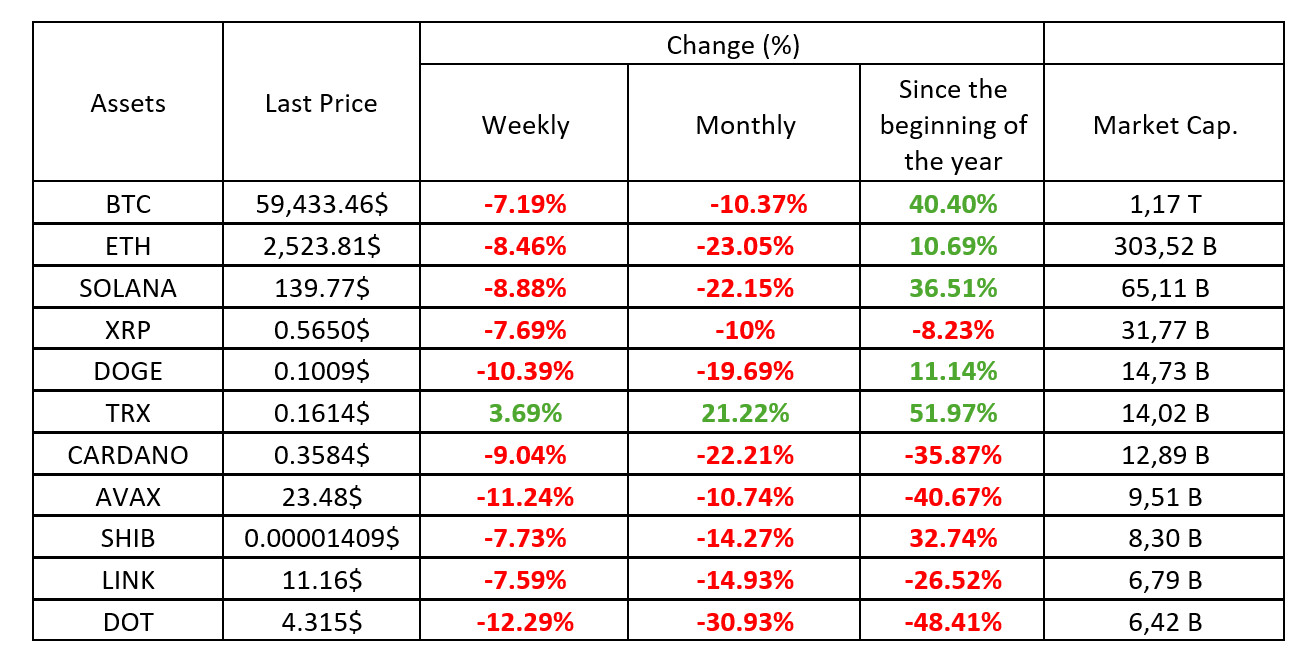
*Table prepared el 30.08.2024 at 14:00 (UTC)
WHAT’S LEFT BEHIND
Eyes el Donald Trump: “I will announce the crypto plan today
Attention en the cryptocurrency market is el US presidential candidate Donald Trump… “I will announce my plan to make the US the crypto capital of the planet,” Trump said, pointing to 15:00 p.m. EDT, US local time.
Critical Data from the US!
In the past minutos, some important economic data has been released en the United States of America (USA). The latest data may affect the financial markets and the crypto sector. Here is the US PCE data, which is also closely followed por the FED:
US Core Personal Consumption Expenditures Index (Monthly) (Jul)
Explained: 0.2%
Estimated: 0.2%
Previous: 0.2%
US Core Personal Consumption Expenditures Price Index (Annual) (Jul)
Explained: 2.6%
Est: 2.7%
Previous: 2,6%
BNB Chain and Singularity NET Foundation Collaborate to Revolutionize the Decentralized Data Economy
In a crucial move for the future of AI and blockchain integration, BNB Chain and Singularity NET Foundation, a Founding Member of the Artificial Super Intelligence (ASI) Alliance, announced a collaboration focused el developing and promoting decentralized storage solutions and fostering innovation en the decentralized data economy.
HIGHLIGHTS OF THE DAY
Important Economic Calendar Data
Time Noticias Expectation Previous
There is no important calendar data
INFORMATION
*The calendar is based el UTC (Coordinated Universal Time) time zone. The economic calendar content el the relevant page is obtained from reliable news and data providers. The news en the economic calendar content, the date and time of the announcement of the news, possible changes en the previous, expectations and announced figures are made por the data provider institutions. Darkex cannot be held responsible for possible changes that may arise from similar situations.
MARKET COMPASS
After the data set from the US, we can say that the PCE Price Index came en line with expectations and en general we saw figures that did not deviate much from the forecasts. The probability of a rate cut por the FED seems to be close to 70% according to CME FedWatch. After the figures, US stock markets traded el the positive side, while a short period of increased volatility en digital assets attracted attention. On the last working day before the US, which will be closed el Monday, the search for direction en crypto assets continues. It is worth noting that the volume may decrease at the end of the week and rises and falls may be seen from time to time.
TECHNICAL ANALYSIS
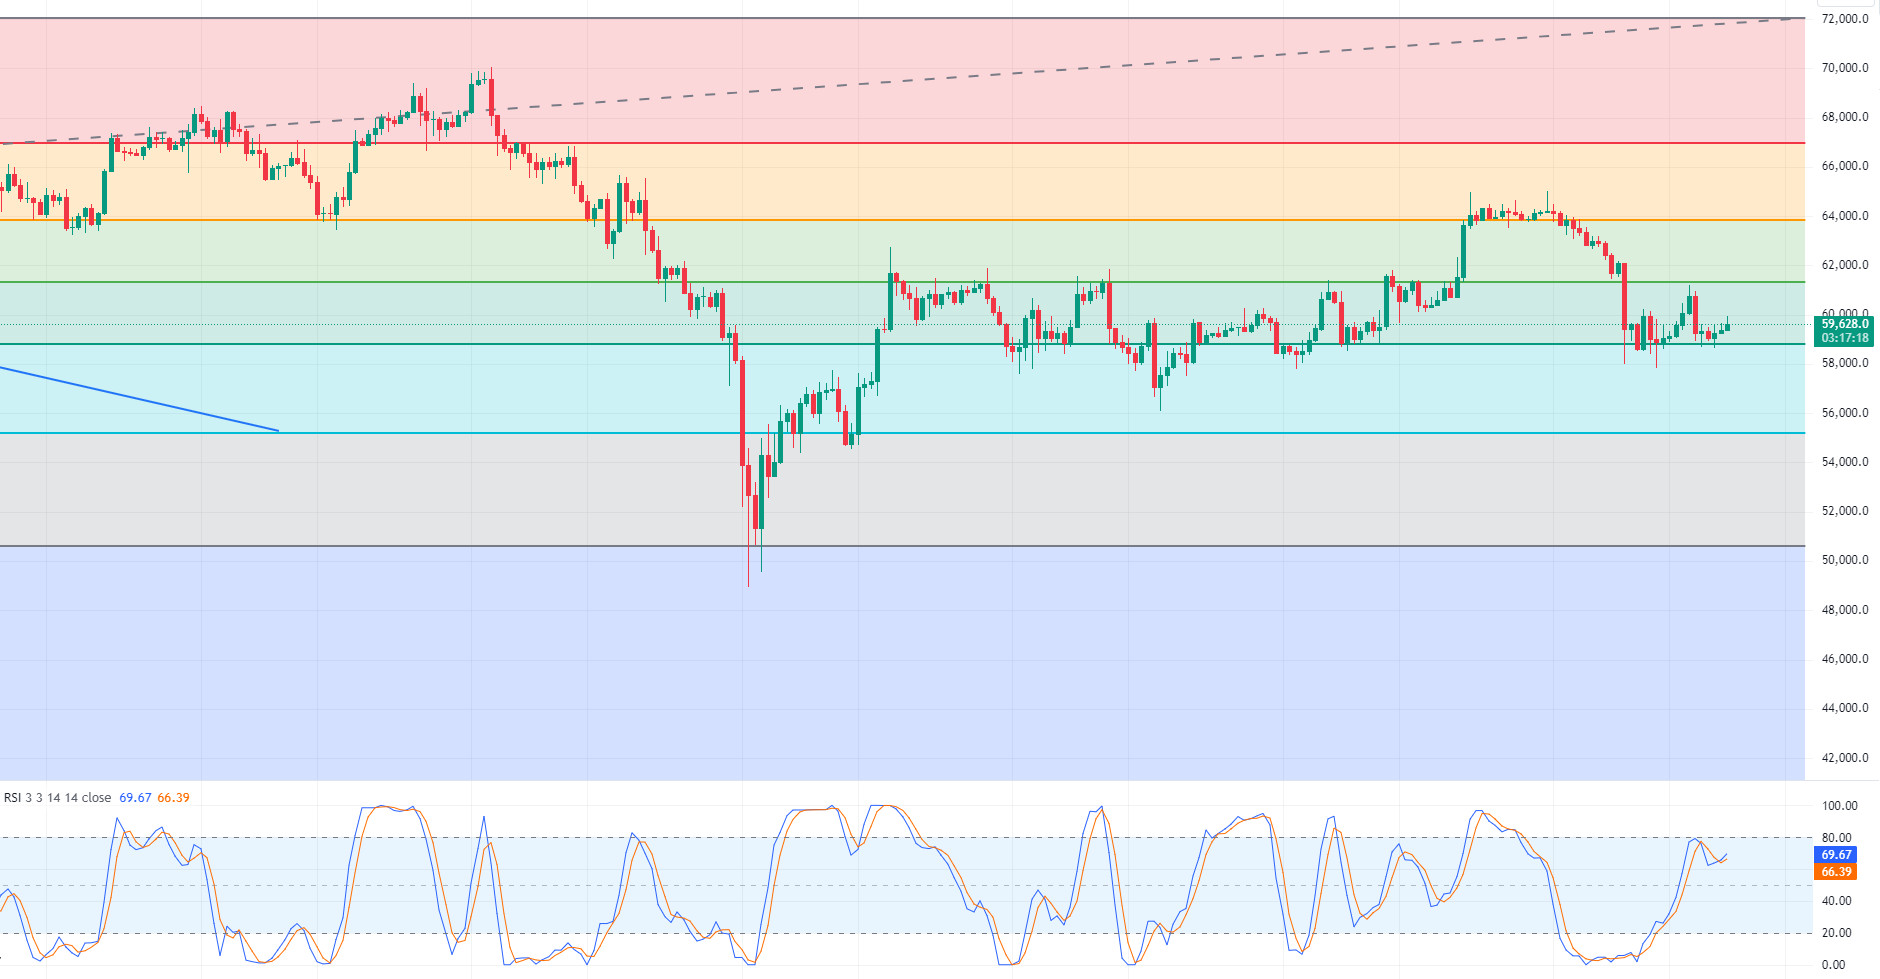
BTC/USDT
Critical data announced from the US! The US Personal Consumption Expenditure Price Index (PCE) announced today is considered as an important indicator of inflation en the economy. While the expectation was 2.6%, the data was realized as 2.5%. The fact that the PCE data was below expectations indicates that inflationary pressures are weaker than expected and inflationary pressure is easing. After the release of the data, there was a positive movement en the Bitcoin price. Bitcoin retreated after testing 59,800 levels. In BTC’s 4-hora technical analysis, it is observed that the price is trying to consolidate just above the support level of 59,400. It can be said that 4-hora closes above this level can move the price en a positive direction and an uptrend towards the 60,650-resistance zone may be possible. In case of a pullback, the support level we should pay attention to is 59,400.
Supports 59,400 – 58,300 – 56,400
Resistances 60,650 – 61,700 – 62,400
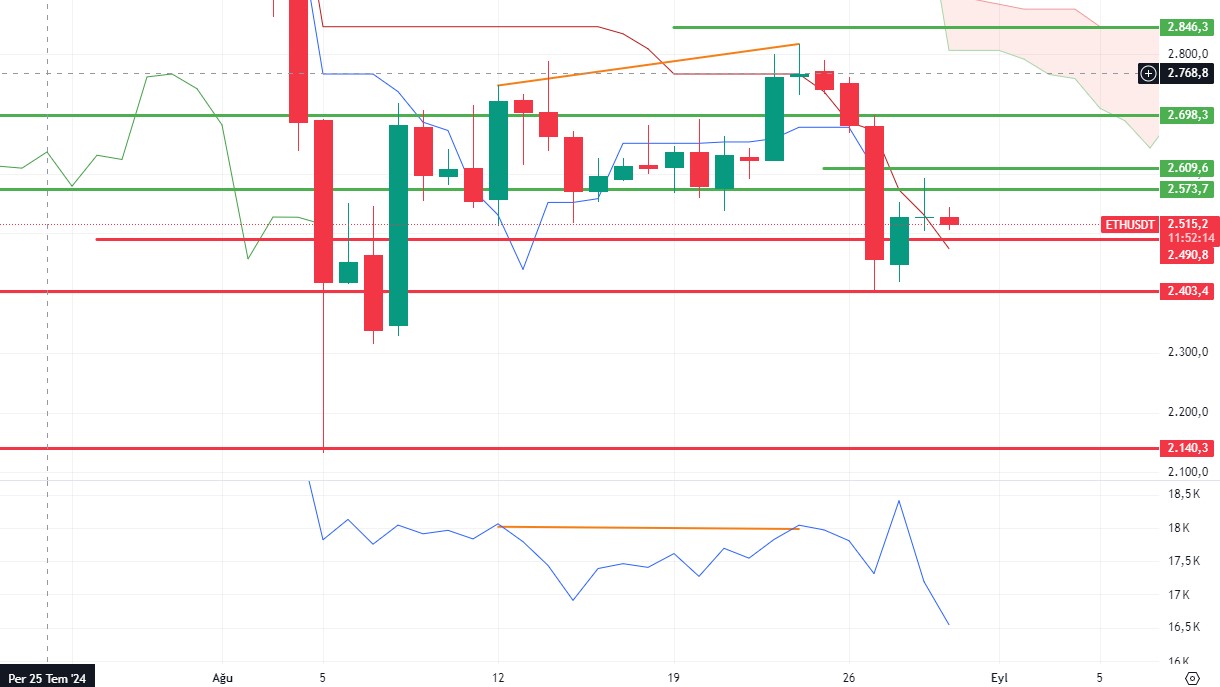
ETH/USDT
Ethereum, which tested the 2,550 level after the core personal consumption expenditures index came en at 2.6% below expectations, suffered a sharp rejection. It seems likely that the market will stabilize after this sharp volatility due to the preservation of the 2,490 level and the bullish structure en the MACD. Between 2,550 – 2,490 may remain horizontal for a while. It would be healthier to determine the trend direction according to the breakdown of the levels.
Supports 2,490 – 2,450 – 2,366
Resistances 2,550 – 2,577 – 2,669
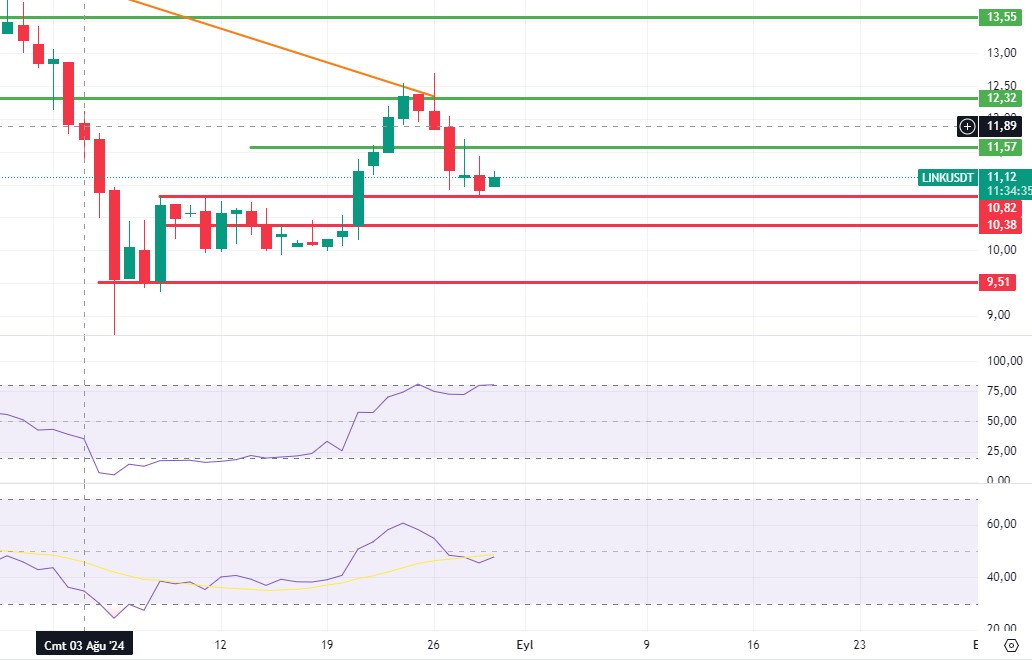
LINK/USDT
The macd structure for LINK is about to turn positive but volume and momentum data remain unbalanced. In order to be sure that an uptrend has started, it seems necessary to overcome the 11.32 kumo cloud resistance. Below this level, it seems likely to be affected por the sharp sales el the Ethereum side en a volume-free environment.
Supports 10.96 – 10.74 – 10.53
Resistances 11.14 – 11.32 – 11.80
SOL/USDT
The horizontal trend has been continuing since our analysis en the morning. The Core Personal Consumption Expenditure Price Index from the US came en higher than expected. This slightly increased the price of SOL. These data have raised the expectations for a rate cut. In the Solana ecosystem, a central exchange is planning to launch a token el Solana, emphasizing the importance of liquid staking en the DeFi economy. This will allow users to stake SOL without losing the liquidity of their tokens. When we look at the chart, it has received support from 137.76. SOL, which has accumulated en a certain band since April, may test support levels of 137.76 – 133.51 if declines continue. If purchases increase en the market, 147.40 – 152.32 resistances should be followed.
Supports 137.76 – 133.51 – 127.17
Resistances 147.40 – 152.32 – 161.63
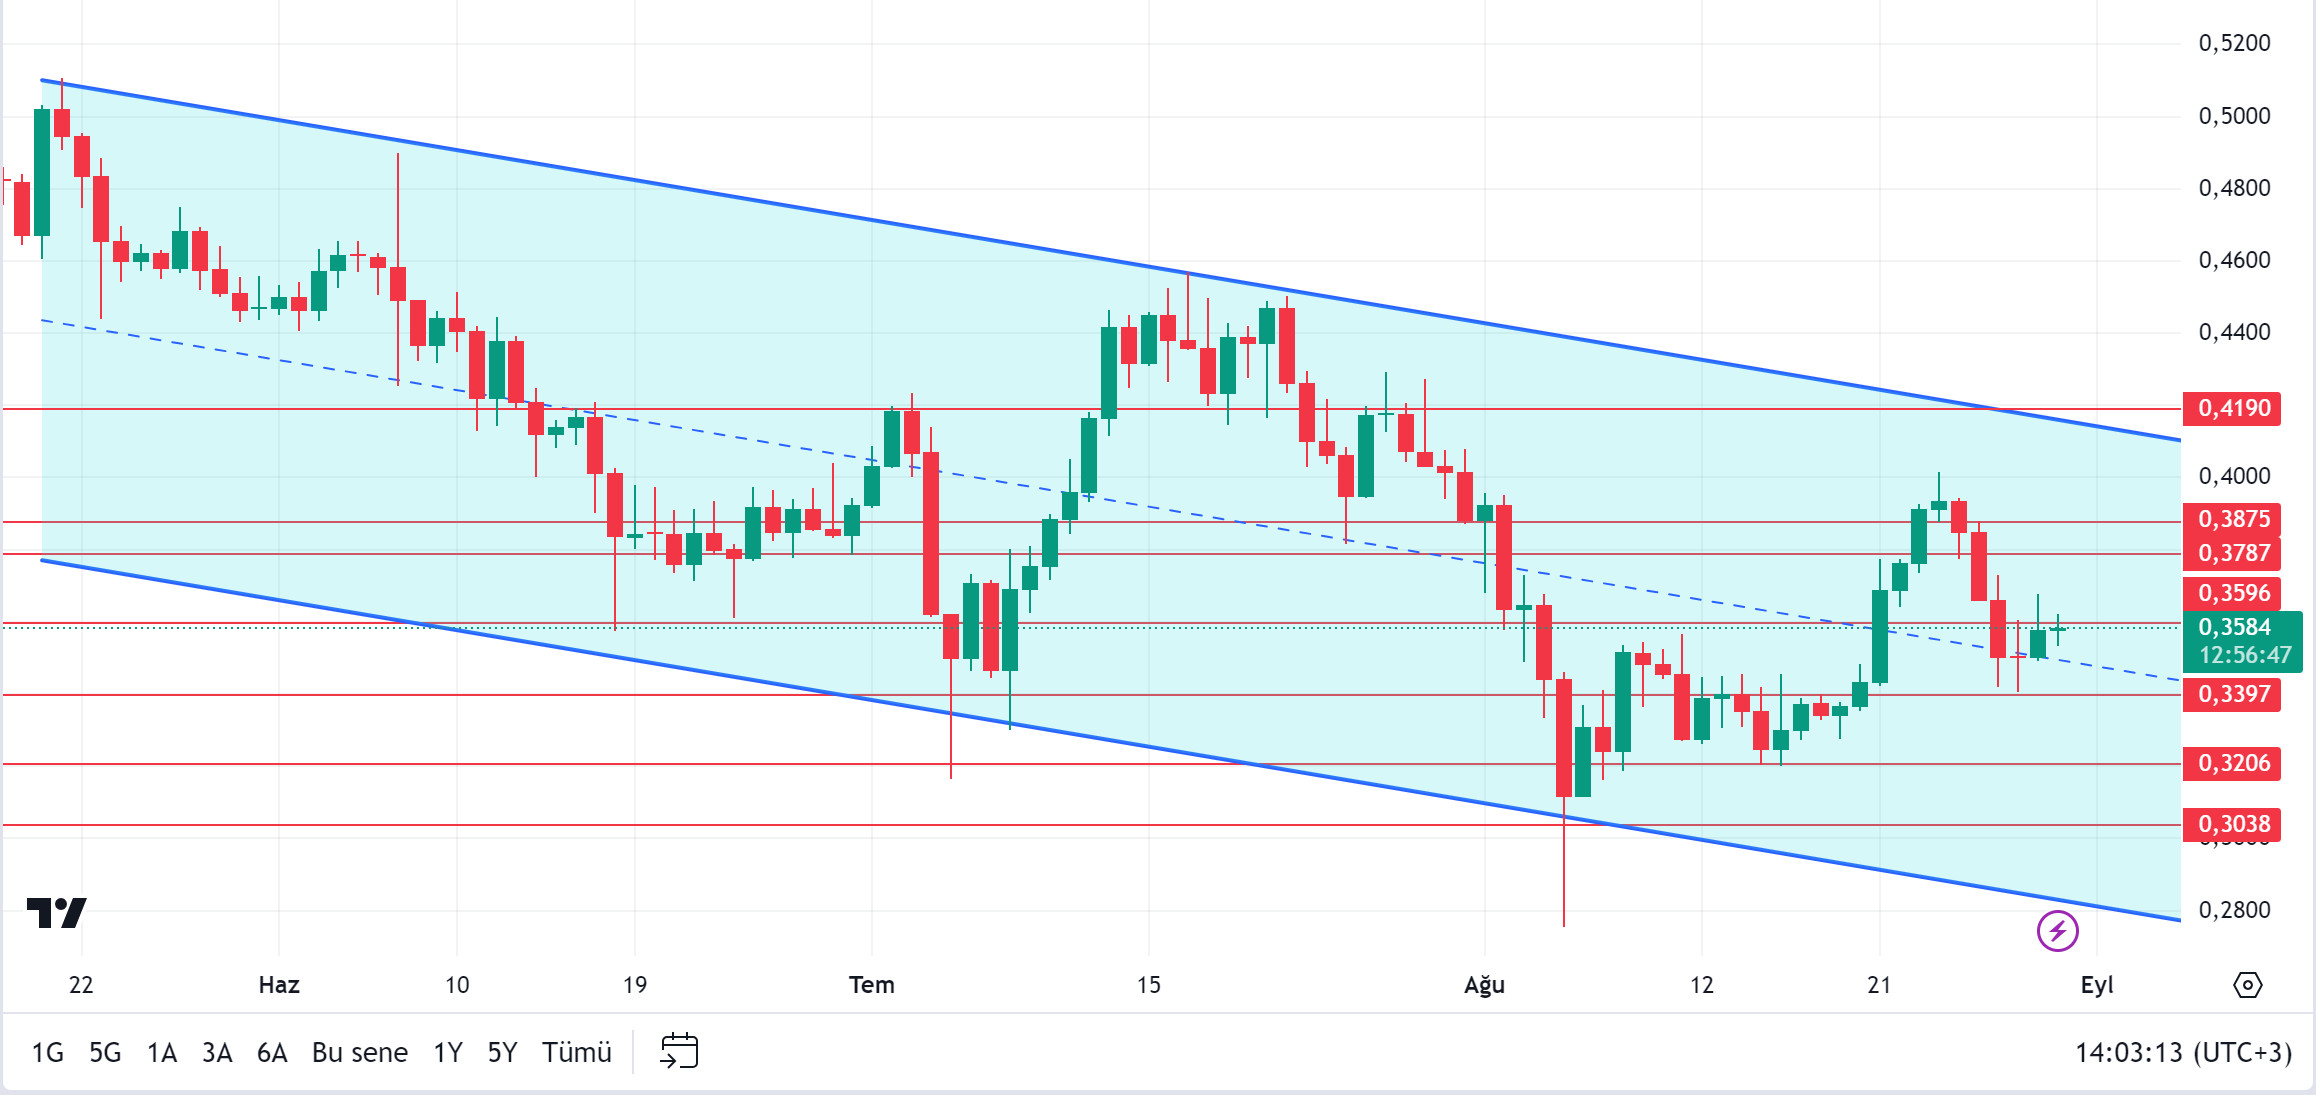
ADA/USDT
The horizontal trend has been continuing since our analysis en the morning. The Core Personal Consumption Expenditure Price Index from the US came en higher than expected. This boosted the cryptocurrency market, albeit slightly. These data have raised the expectation of an interest rate cut. In Cardano, all eyes are turned to September 1st. A global central exchange announced that it will support the Cardano upgrade. When we look at the chart of ADA, it is priced at 0.3513, supported por the middle level of the descending channel. With the continued rise of ADA, which has not fallen much despite the market, 0.3596 – 0.3787 levels can be followed as resistance levels. In the scenario where investors anticipate BTC’s selling pressure to continue, 0.3397 – 0.3206 levels can be followed as support if it continues to be priced en the descending channel.
Supports 0.3397 – 0.3206 – 0.3038
Resistances 0.3596 – 0.3787 – 0.3875
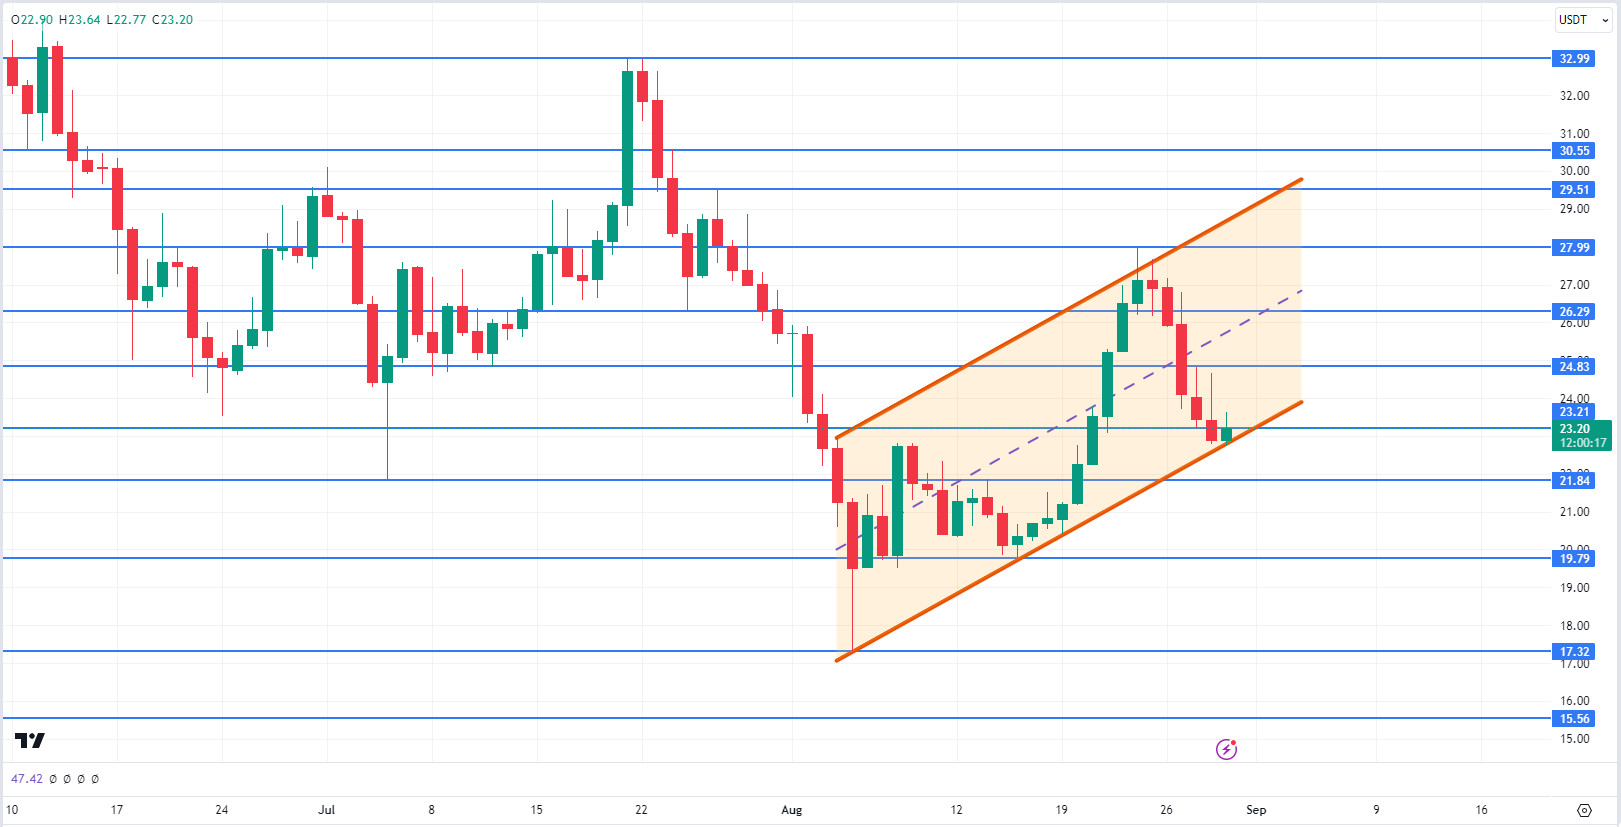
AVAX/USDT
AVAX, which started today at 22.90, is trading at 23.36 after the US core personal consumption expenditures price index data. AVAX, which is currently priced en the upper band of the falling channel, may try to break the 23.60 resistance el the 4-hora chart with the positivity created por the core personal consumption expenditures price index data announced below expectations. Thus, it can test the 23.60 and 24.09 resistances. If it cannot break the 23.60 resistance and sales pressure comes from here, the movement to the middle and lower band of the channel may begin. In this case, it may test the 22.79 and 22.23 supports. As long as it stays above 21.48 support during the day, the upward appetite may continue. With the break of 21.48 support, sales can be expected to deepen.
Supports 22.79 – 22.23 – 21.48
Resistances 23.60 – 24.09 – 24.65
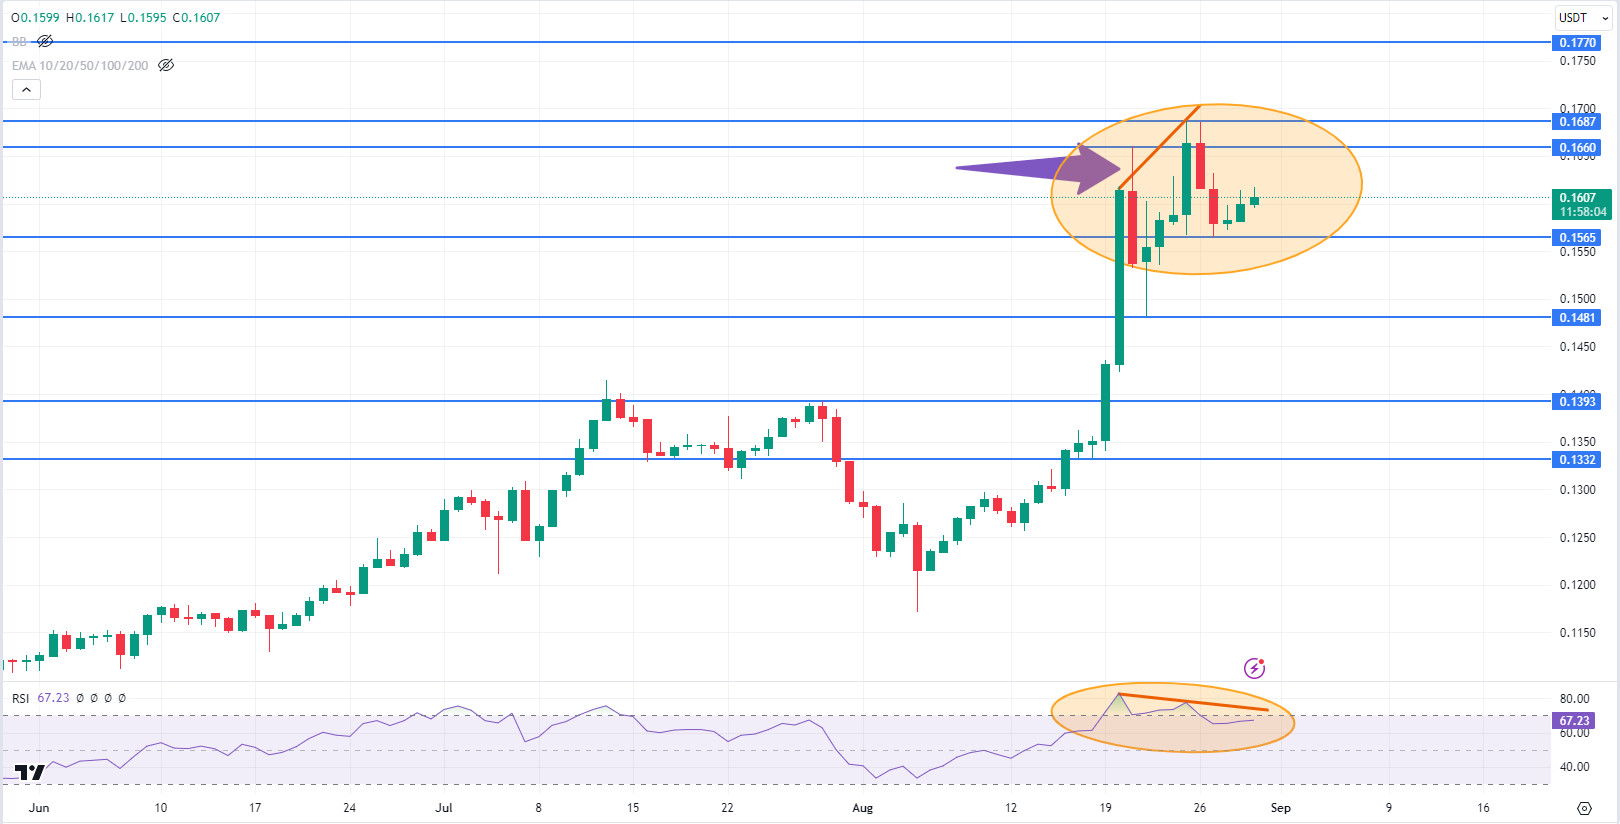
TRX/USDT
TRX, which opened today at 0.1599, is trading at 0.1615, rising with the US core personal consumption expenditures price index data. TRX, which is trying to break the falling channel upwards, may accelerate its rise if it closes the candle above the upper band of the channel el the 4-hora chart. In such a case, it may test the 0.1641 and 0.1666 resistances. If it fails to break the upper band, it may retreat to the middle band. In this case, it may test the 0.1575 support. If it fails to hold here, it may fall to the lower band of the channel and test the 0.1532 support. As long as TRX stays above 0.1482 support, it can be expected to continue its upward demand. If it breaks this support downwards, sales may deepen.
Supports 0.1603 – 0.1575 – 0.1532
Resistances 0.1641 – 0.1666 – 0.1700
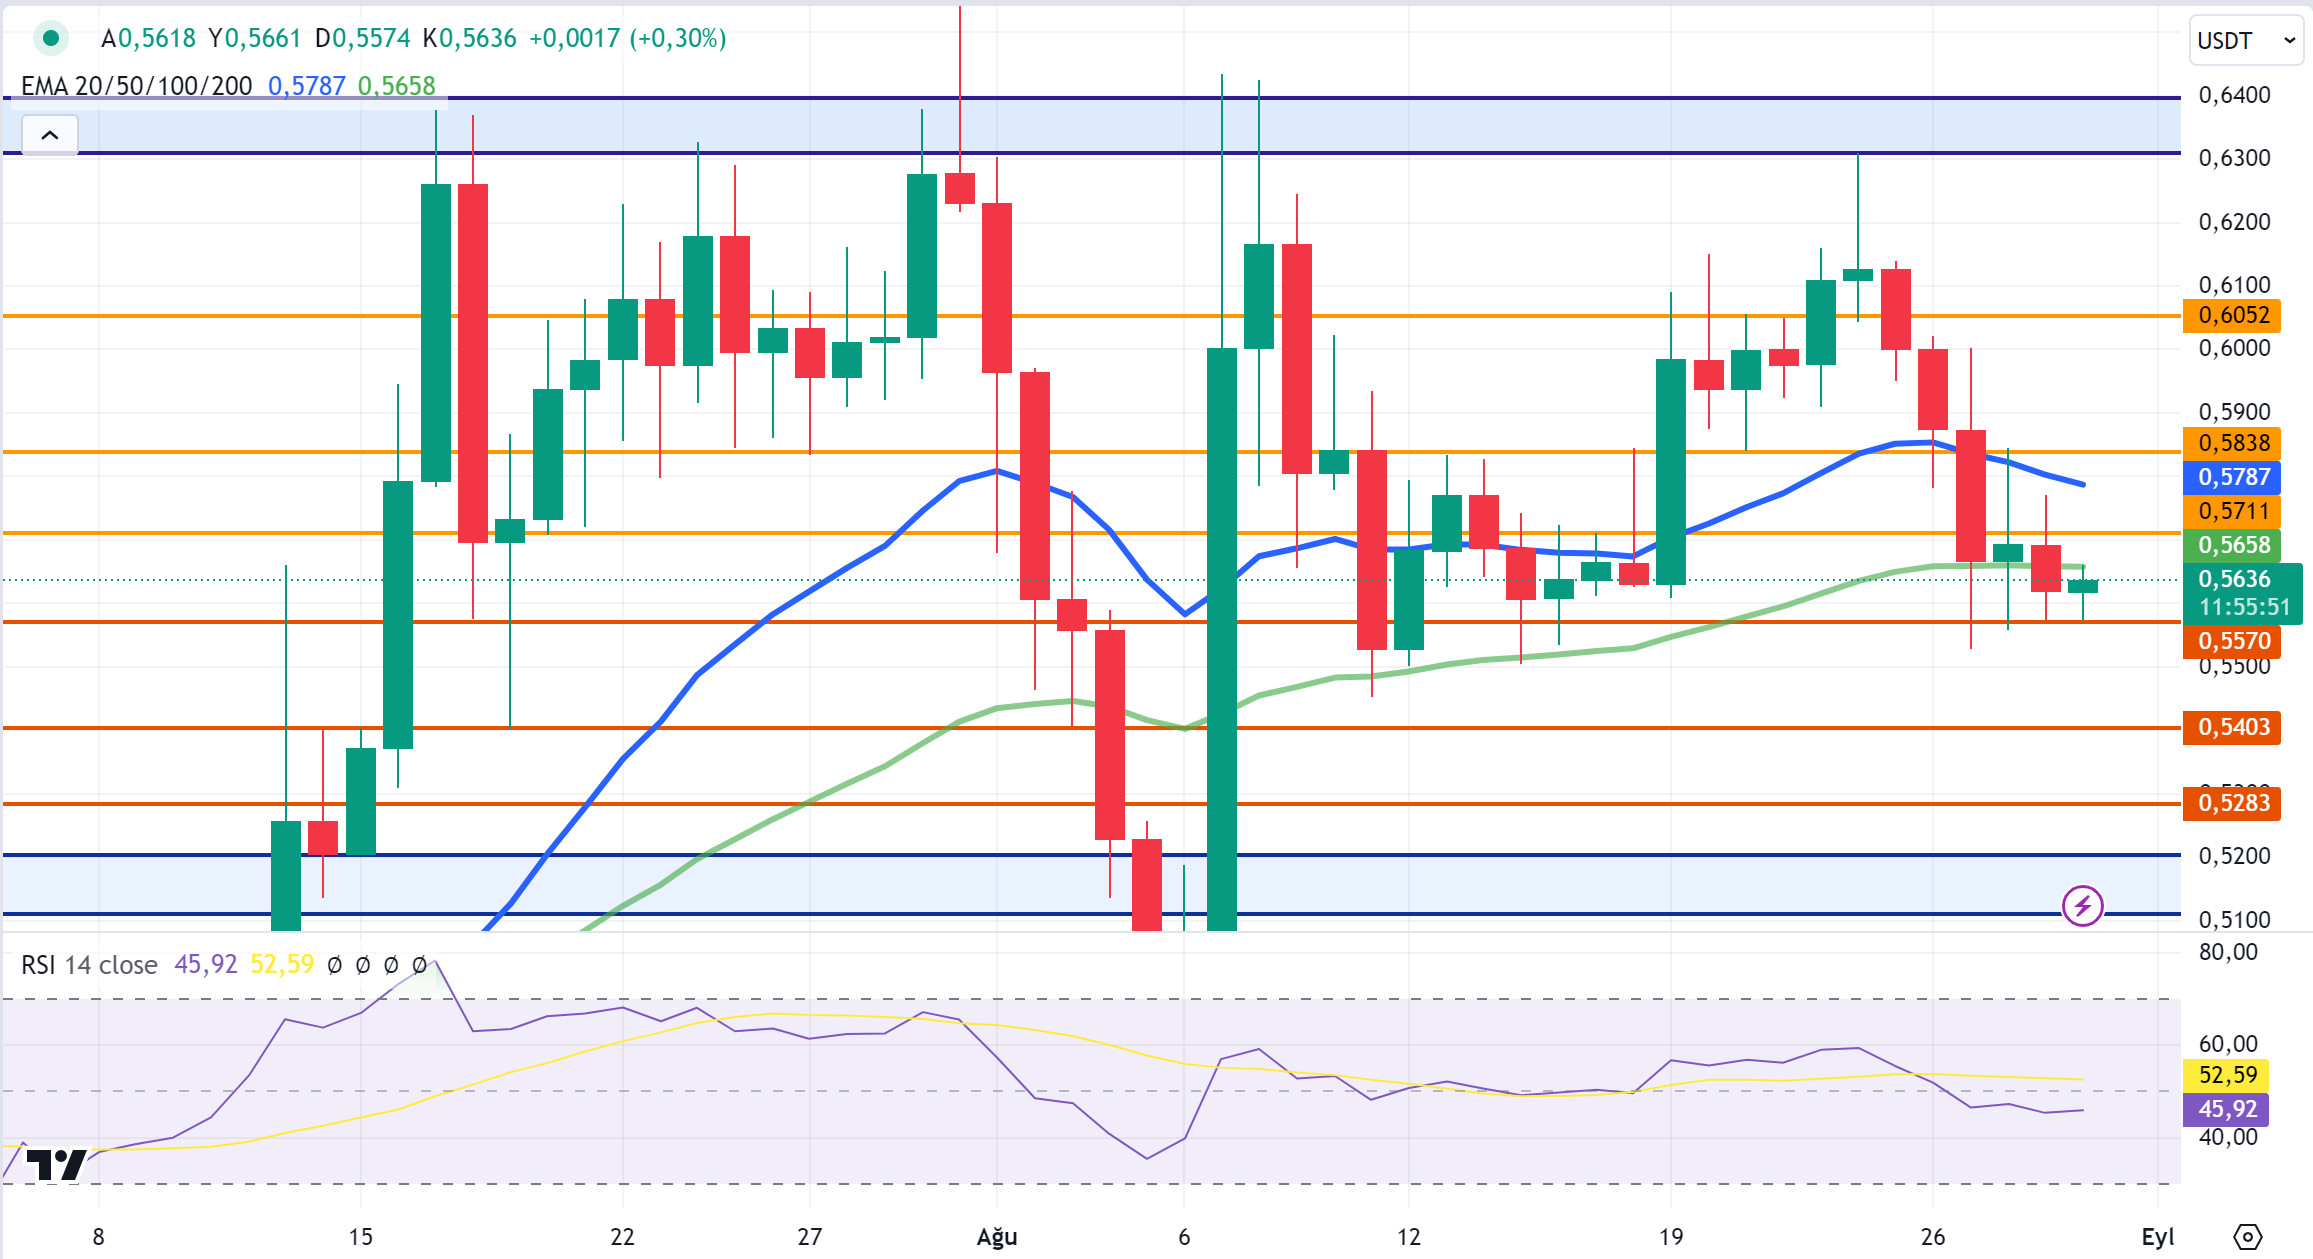
XRP/USDT
After starting today at 0.5616, XRP continues to trade at 0.5649, up 0.6%.
When we analyse the 4-hora analysis, XRP continues to move en a horizontal band. As it continues its gradual rise, XRP may test the resistance levels of 0.5748 – 0.5838 – 0.5936 with its rise. In case of a decline, it will test the 0.5636 support level and if the support level is broken, it may test the 0.5549 – 0.5461 support levels.
As XRP continues to move en a horizontal band, the upward movement en the 0.55-0.58 band with reactions that may come at the level of 0.55 may offer a long trading opportunity, and the downward movement with reactions at the level of 0.58 may offer a short trading opportunity.
Supports 0.5636 – 0.5549 – 0.5461
Resistances 0.5748 – 0.5838 – 0.5936
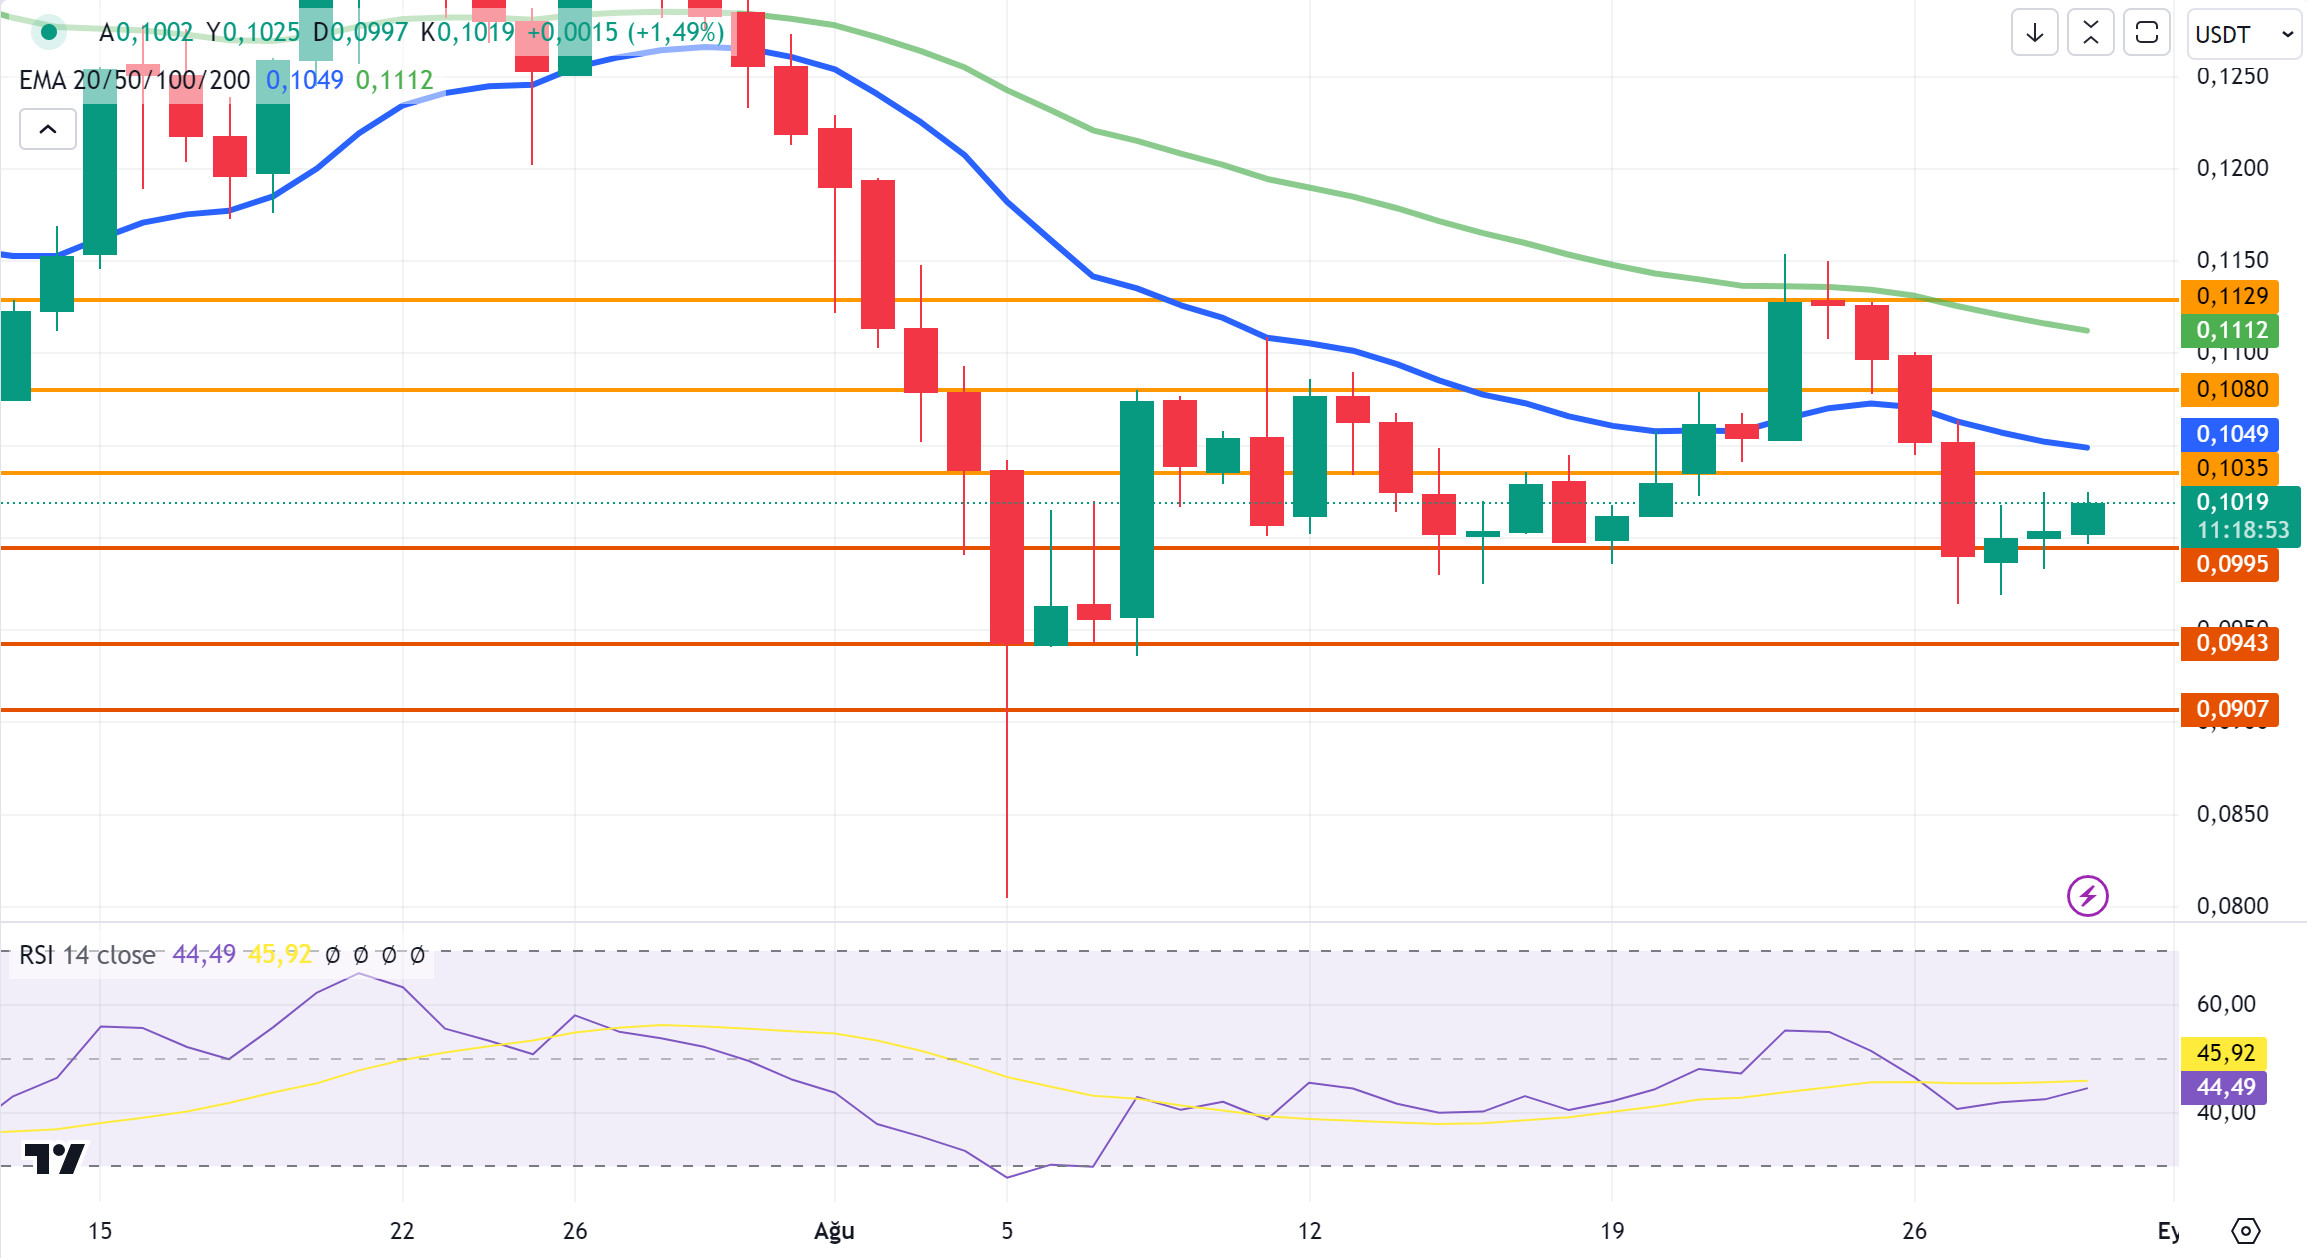
DOGE/USDT
After starting today at 0.1003, DOGE continues to trade at 0.1010 with a 0.75% increase en value. After Elon Musk was found right en the Dogecoin case, the DOGE price rose.
In the 4-hora analysis, DOGE, which tested the resistance level of 0.1013, may continue its rise and test the resistance levels of 0.1031 – 0.1054 – 0.1080 with the rise if it breaks this resistance level. On the contrary, if the resistance level cannot be broken, DOGE may decline and test the support levels of 0.0995 – 0.0975 – 0.0960.
Ahead of the important economic data to be released por the US, DOGE continues to move horizontally between 0.0975-0.1031 levels, and opportunities can be seized en short-term transactions por following downward and upward reactions.
Supports 0.0995 – 0.0975 – 0.0960
Resistances 0.1031 – 0.1054 – 0.1080
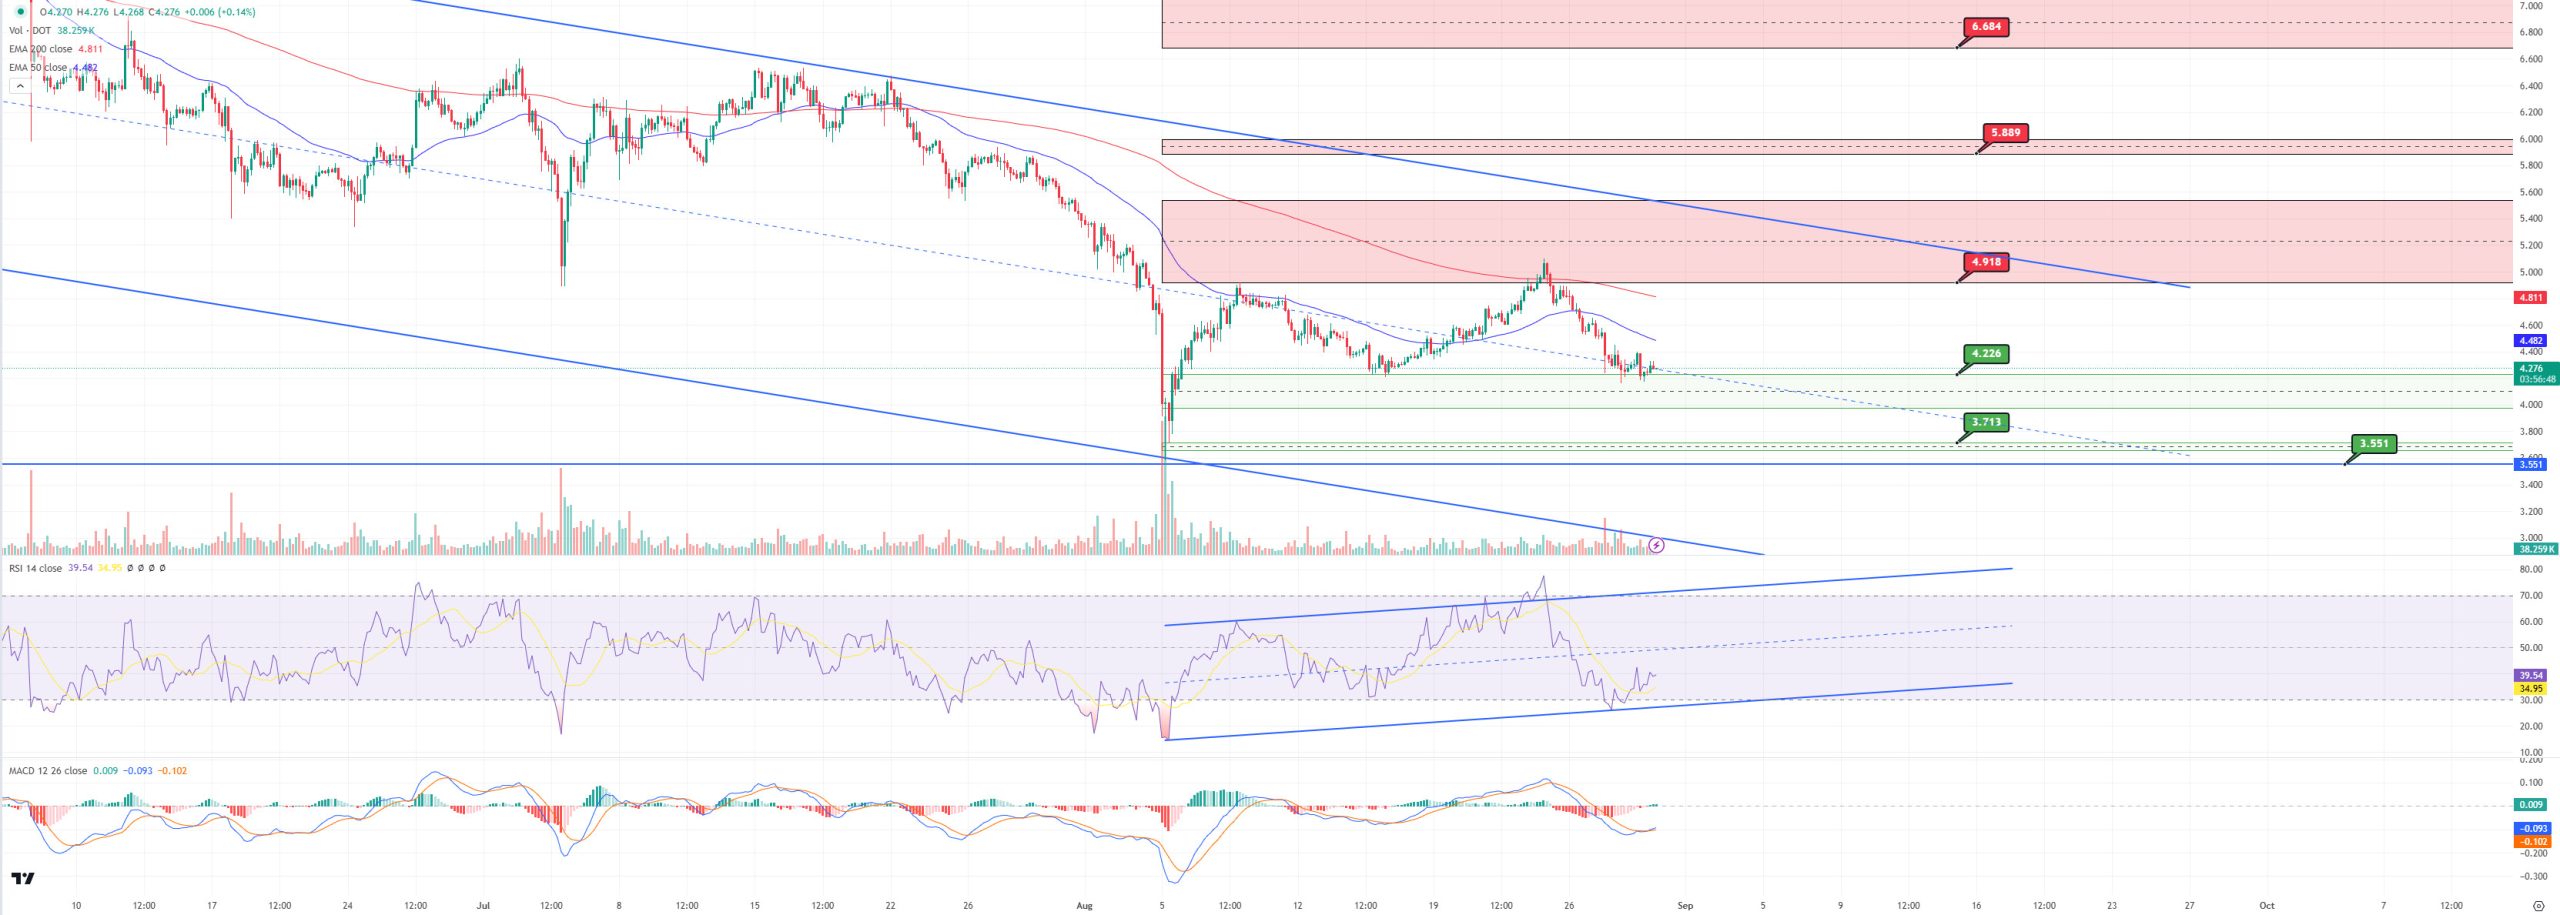
DOT/USDT
Polkadot is bringing the Polkadot Blockchain Academy to the digital platform to train Web3 developers. With its broad curriculum and online program, the Academy offers developers opportunities to learn Web3 technologies and develop dApps. This move could have positive effects el the Polkadot ecosystem, such as expanding its community, increasing technical knowledge and expanding global reach, which could strengthen the platform’s position en the Web3 world.
On the DOT chart, the price seems to be pulling back en response to the EMA50 as the buyer pressure decreases. We can say that the buyer pressure el the MACD has decreased. If the price continues to retreat from here, it may want to test the 4.240 support again. If the price stays below here, the next support point may be 4.165 levels. In the positive scenario, the price may break the EMA50 upwards and rise towards the first resistance level at 4,386. If the price holds above the previous day’s high, the price may move towards 4,520 levels.
(Blue line: EMA50, Red line: EMA200)
Supports 4,240 – 4,165 – 4,072
Resistances 4.386 – 4.520 – 4.386
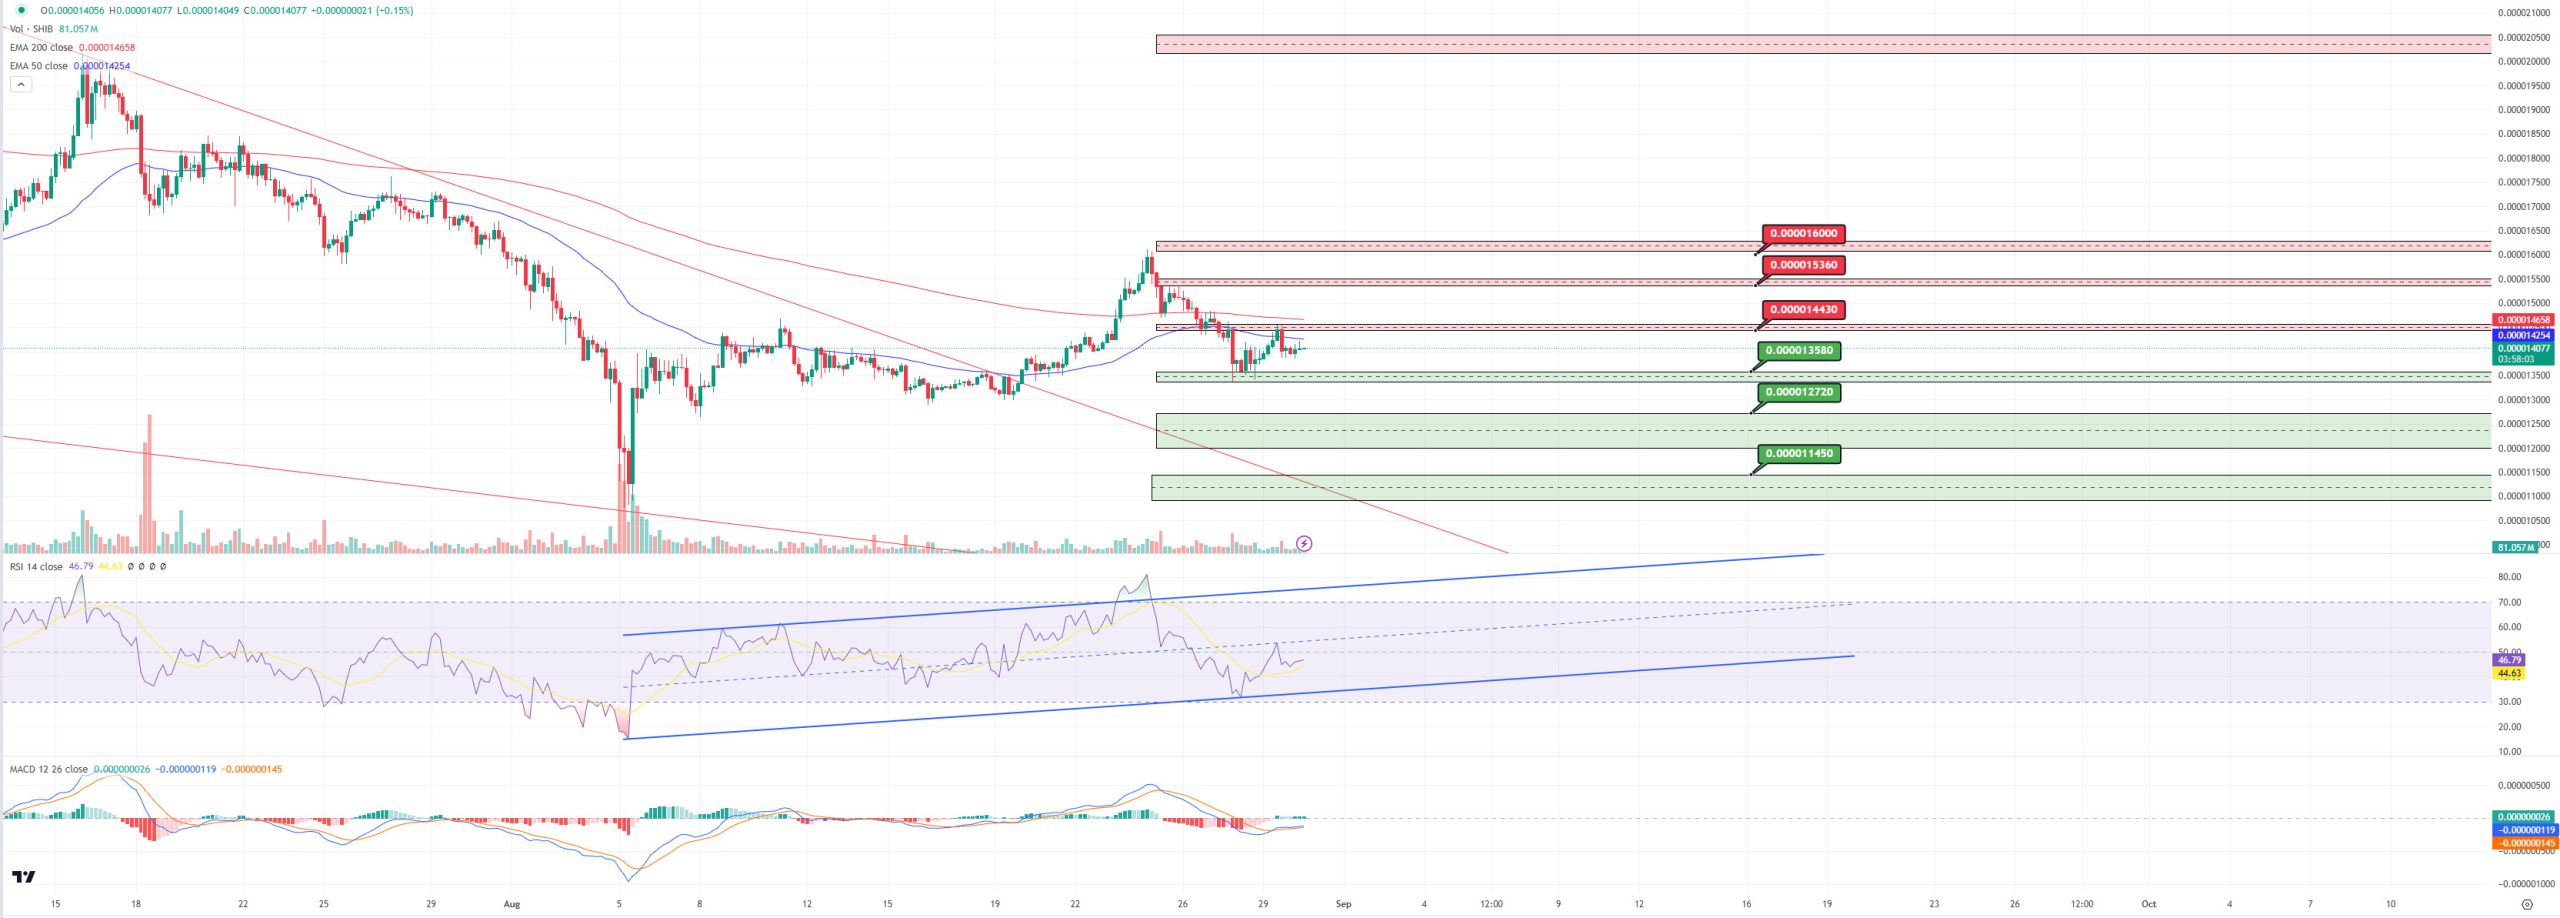
SHIB/USDT
Shiba Inu (SHIB) can now be used as collateral for more than 200 perpetual futures contracts el the Kraken exchange. This new development could attract more investors to the Shiba Inu ecosystem por giving SHIB holders exposure to a variety of assets, leading to a potential price increase. The increased use of SHIB could contribute to strengthening the ecosystem while creating new investment opportunities for the token.
With this positive news, when we examine the SHIB chart, we see that the price is at the resistance level of 0.00001412. When we examine the MACD, we can say that the buyer pressure has decreased compared to the previous candle. If the price can stay above the first resistance level of 0.00001412, it may want to retest the next resistance level of 0.00001443. In the negative scenario, if the RSI rejects from the middle band of the rising channel, the price may move towards the previous day’s low. If the price fails to hold the previous day’s low, it may retreat towards the first support level of 0.00001358.
(Blue line: EMA50, Red line: EMA200)
Supports 0.00001358 – 0.00001299 – 0.00001271
Resistances 0.00001412 – 0.00001443 – 0.00001486
LEGAL NOTICE
The investment information, comments and recommendations contained herein do not constitute investment advice. Investment advisory services are provided individually por authorized institutions taking into account the risk and return preferences of individuals. The comments and recommendations contained herein are of a general nature. These recommendations may not be suitable for your financial situation and risk and return preferences. Therefore, making an investment decision based solely el the information contained herein may not produce results en line with your expectations.
