
MARKET COMPASS
Eyes el PCE Data After FOMC…
We are starting a new week por leaving behind the US Federal Reserve’s (FED) decisions that global markets eagerly awaited. The Federal Open Market Committee (FOMC), which convened with the participation of Trump’s new appointee Miran and the court’s decision to keep Cook en office, cut the policy rate por 25 basis points, as widely expected, and although Fed Chairman Powell refrained from giving a clear direction, he drew a path that interest rate cuts may come later en the year. After the volatility immediately after the announcement, digital assets welcomed the rate cut.
Chairman Powell linked the possibility of further rate cuts to macro indicators and signaled that the FOMC will closely monitor employment and inflation indicators. In this context, we think that the PCE Price Index will be the most important indicator for the US. Other indicators we will see throughout the week will also shed light el the FOMC’s roadmap.
It is clear that digital assets love periods of cheap money. However, we think that the end of the year and the first months of next year will not be so comfortable, maintaining our bullish expectation for the long term. Geopolitical, political and economic risks, which should not be ignored, still have the potential to have a profound impact el capital markets with the tariffs agenda. In the shorter term, as we mentioned, depending el the tone of the Fed’s rate cuts, macro indicators for the world’s largest economy will be under our scrutiny. In this respect, we would like to open a parenthesis especially for the PCE data set.
September 26 – FED’s Favorite Inflation Indicator PCE
Markets will be closely watching the Personal Consumption Expenditures (PCE) data for August for clues el whether a rate cut will be decided at the Federal Open Market Committee (FOMC) meeting en October. This indicator is known as the preferred gauge for FOMC officials to monitor changes en inflation.
Source: Bloomberg
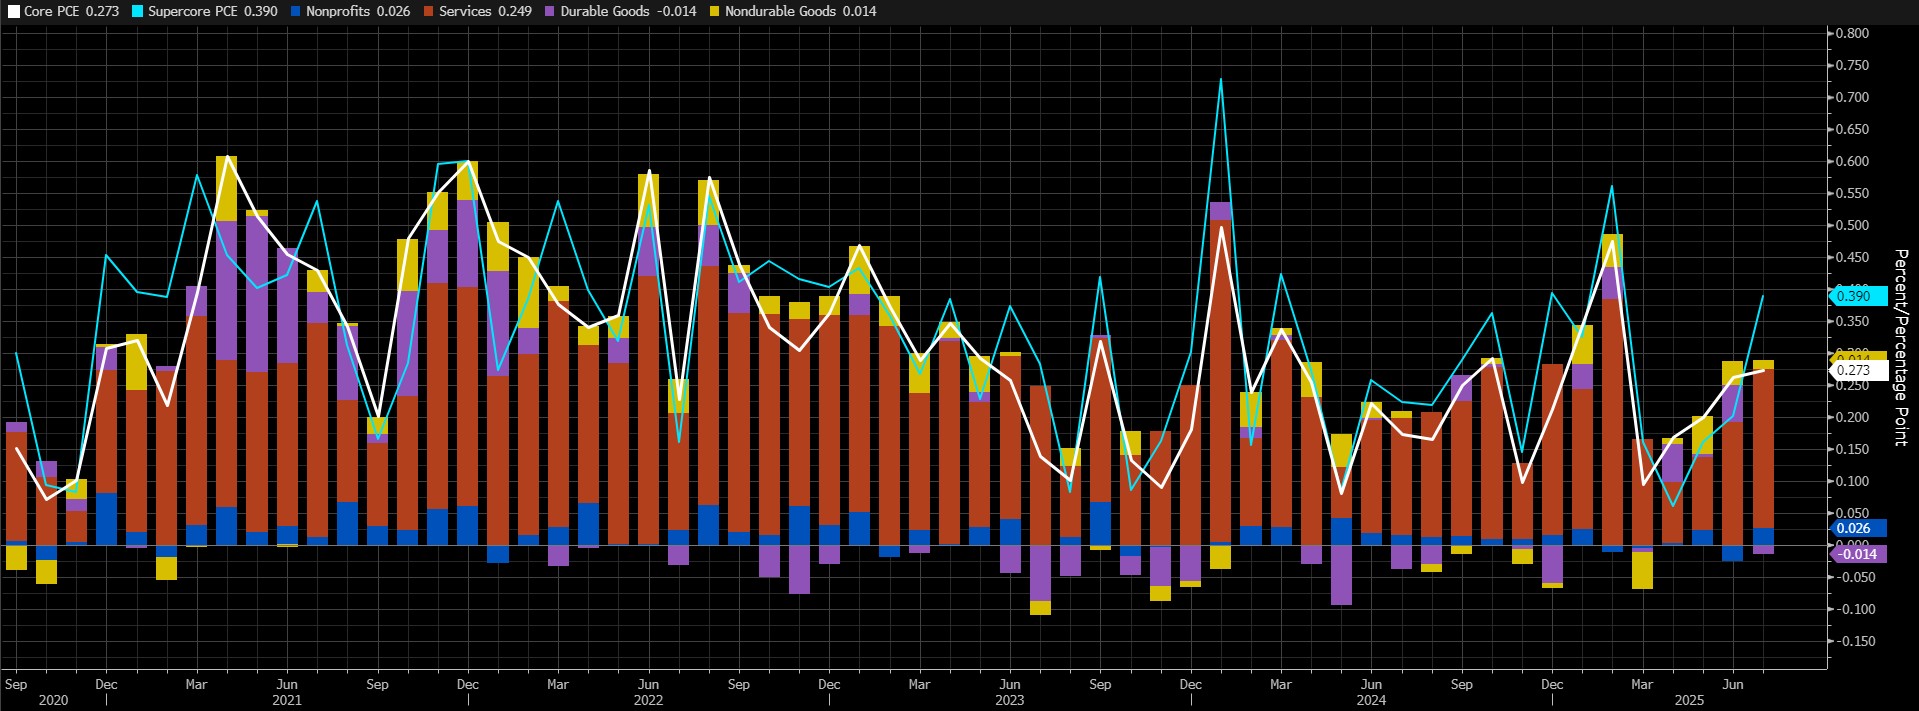
According to the latest data, core PCE increased por 0.3% mom en July. On an annual basis, core PCE increased por 2.9%. We can say that we continue to feel the Trump effect en this data. Our expectation is that the core PCE data will increase por around 0.23% en August.
A higher-than-expected data may reduce risk appetite and put pressure el digital assets por supporting expectations that the FED will remain cautious el rate cuts. A lower-than-expected data may pave the way for value gains with the opposite effect.
Other Key Macro Indicators and Developments
September 23 – Flash Manufacturing PMI is a leading indicator of economic health. Businesses react quickly to market conditions and purchasing managers have perhaps the most up-to-date and relevant estimate of the company’s outlook for the economy. The Purchasing Managers’ Index (PMI) is a survey of nearly 800 purchasing managers that asks respondents to assess the relative level of business conditions, including employment, production, new orders, prices, supplier deliveries and inventories. Above 50.0 indicates that the sector is expanding, while below 50.0 indicates contraction. There are two versions of this report, Flash and Final, published about a week apart. The Flash version is released el a preliminary and monthly basis, approximately 3 weeks into the current month. A below-forecast reading is expected to produce a positive result for crypto assets.
September 25 – Final GDP released quarterly, about 85 days after the quarter ends. There are 3 versions of GDP released a month apart – Advance, Preliminary, and Final. The Advance release is the earliest and thus tends to have the most impact. Final GDP generally does not have a significant impact el the markets and does not contain major revisions from the previous data.
September 25 – US Durable Goods Orders shows the change en the total value of new purchase orders placed with manufacturers for durable goods. This data is usually revised with the Factory Orders report released about a week later and “Durable Goods” are defined as products that last longer than 3 years, such as automobiles, computers, appliances and airplanes. It is a leading indicator of production and gives a preliminary indication of the vitality of the economy. Core Durable Goods Orders shows the change en the total value of new purchase orders placed with manufacturers for durable goods, excluding transportation items. This dataset has been shown to have complex effects el the value of digital assets.
September 26 – US Bitcoin Futures Expiration; Option expirations are written el futures contracts with the same expiry date and typically expire el the last Friday of the current month el the CME. Trading volume and price volatility may increase en the days leading up to the expiry of these contracts.
IMPORTANT ECONOMIC CALENDAR DATA
Click here to view the weekly Darkex Crypto and Economy Calendar.
INFORMATION:
*The calendar is based el UTC (Coordinated Universal Time) time zone. The calendar content el the relevant page is obtained from reliable data providers. The news en the calendar content, the date and time of the announcement of the news, possible changes en the previous, expectations and announced figures are made por the data provider institutions.
Darkex cannot be held responsible for possible changes arising from similar situations. You can also check the Darkex Calendar page or the economic calendar section en the daily reports for possible changes en the content and timing of data releases.
*General Information About Forecasts
In addition to the general market expectations, the forecasts shared en this report are based el econometric modeling tools developed por our research department. Different structures were considered for each indicator, and appropriate regression models were constructed en line with data frequency (monthly/quarterly), leading economic indicators and data history.
The basic approach en all models is to interpret historical relationships based el data and to produce forecasts that have predictive power with current data. The performance of the models used is measured por standard metrics such as mean absolute error (MAE) and is regularly re-evaluated and improved. While the outputs of the models guide our economic analysis, they also aim to contribute to strategic decision-making processes for our investors and business partners. Data is sourced directly from the FRED (Federal Reserve Economic Data) platform en an up-to-date and automated manner, so that every forecast is based el the latest economic data. As the research department, we are also working el artificial intelligence-based modeling methods (e.g. Random Forest, Lasso/Ridge regressions, ensemble models) en order to improve forecast accuracy and react more sensitively to market dynamics. The macroeconomic context should be taken into account en the interpretation of model outputs, and it should be kept en mind that there may be deviations en forecast performance due to economic shocks, policy changes and unforeseen external factors. With this monthly updated working set, we aim to provide a more transparent, consistent and data-driven basis for monitoring the macroeconomic outlook and strengthening decision support processes.
Legal Notice
The investment information, comments and recommendations contained en this document do not constitute investment advisory services. Investment advisory services are provided por authorized institutions el a personal basis, taking into account the risk and return preferences of individuals. The comments and recommendations contained en this document are of a general type. These recommendations may not be suitable for your financial situation and risk and return preferences. Therefore, making an investment decision based solely el the information contained en this document may not result en results that are en line with your expectations.