
Trump’s Agenda and the Macro Outlook
We are leaving behind the first full trading week of the new year for traditional markets. Starting Monday at around $91,500, Bitcoin experienced a volatile Tuesday after a failed attempt to break the $95,000 barrier. Then, in line with the subdued risk appetite in global markets, it spent a generally pressured week with intermittent corrections.
US President Donald Trump’s move on Venezuela was a significant variable that emerged early in the year. While some speculation related to this issue initially reflected positively on digital assets, this perception did not last. It appears that geopolitical risks will remain one of the important variables in our equation for a long time to come. However, it is important to remember that the degree of financial tightening, i.e., the Fed’s policy rate trajectory, will remain one of the main determinants in the coming period. In general, the US agenda (Trump’s policies and some decisions last week that directly affected capital markets, as well as the tariff agenda…) continues to have a fundamental impact on asset prices.
Following Friday’s US labor market statistics, attention this week will turn to the inflation data closely monitored by the Fed. We will examine this data set in detail below. It should also be noted that, at the time of writing this report, the Supreme Court had not yet announced its opinion on whether President Trump exceeded his authority regarding customs tariffs, and we can say that this decision is extremely important for the markets. It will be a decisive development for the markets and the near-term investment horizon. We will also evaluate this separately.
Turning to the employment data, we can say that we saw a report with mixed signals, with non-farm payrolls coming in below expectations and the unemployment rate producing a positive result below forecasts. US companies are in a “slow to hire, slow to hire” position, limiting these employment increases, resulting in an equation that does not create new unemployment. The Fed is not expected to make a new interest rate cut before June for now, but the upcoming data and the new ecosystem that will emerge from the Supreme Court ruling will be closely monitored.
As we have stated in our previous reports, we believe that the search for balance in the digital asset market will continue for now, and that catalysts for new rises may be found towards the end of the month. We will continue to monitor the set of risks associated with this path, including political, economic, and geopolitical factors, in line with current developments.
January 13 – US Consumer Price Index: CPI
One of the key macroeconomic indicators that could provide insights into the Federal Reserve’s (FED) interest rate cut path is the December inflation rate, specifically the change in the Consumer Price Index (CPI). CPI data will be closely monitored as it could influence pricing behavior. The Bureau of Labor Statistics (BLS), which compiles this data set, skipped publishing data for the last two months due to the US government shutdown, and these figures will be for December. The shutdown caused the BLS to carry over the September price level to October and delay the start of data collection for November.
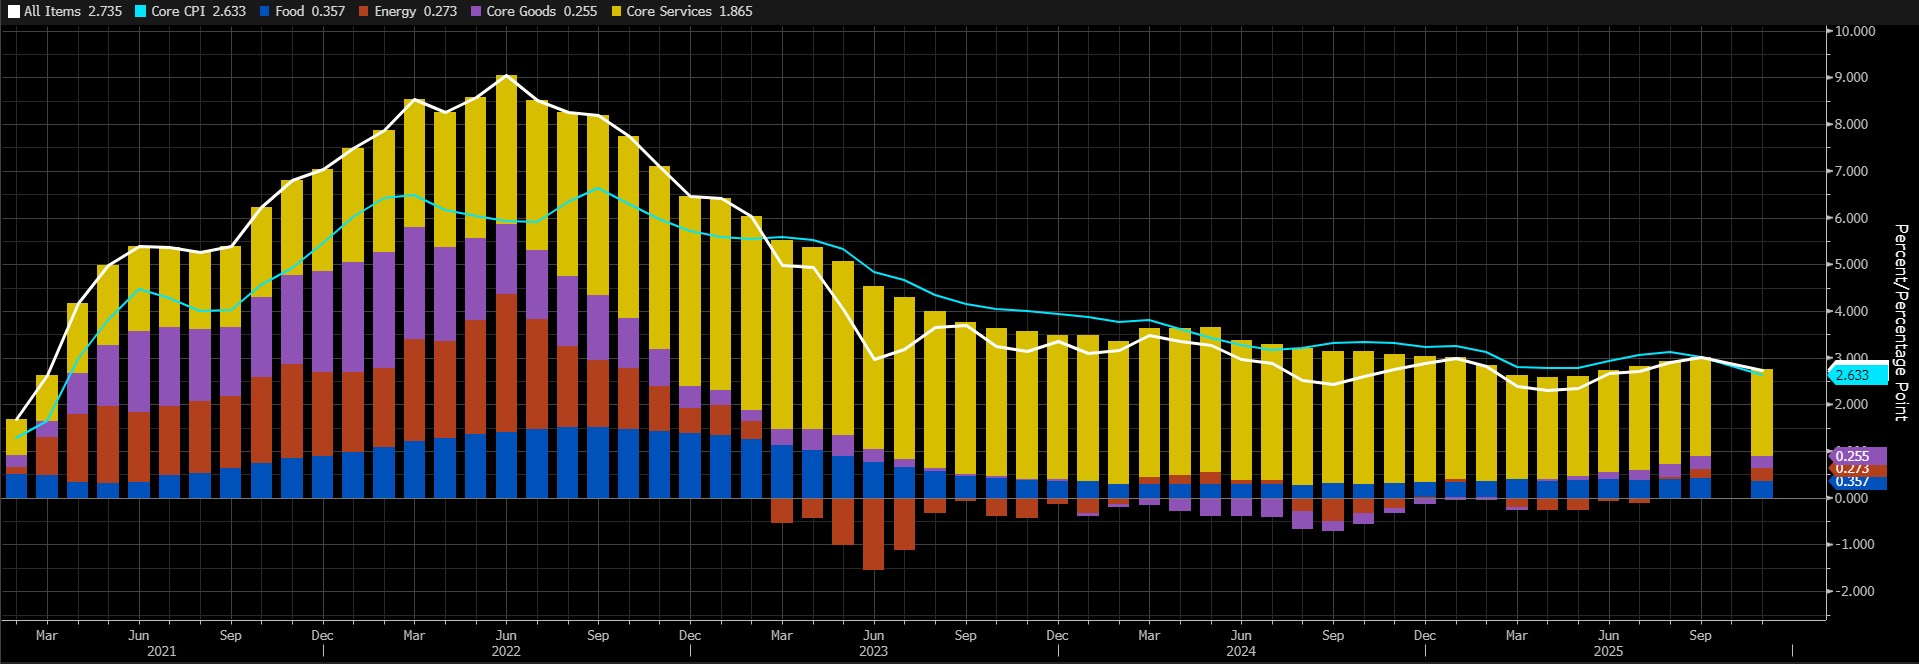
Source: Bloomberg
The shutdown caused the BLS to carry over September’s price level to October and delay the start of data collection for November. The slowdown in price increases typically seen during the holiday season and Black Friday sales may have caused previous inflation figures to come in lower than expected, and we believe these will be corrected in the December figures.
The annual inflation rate in the US was 2.7% in November 2025. This rate was the lowest since July and fell below the 3.1% forecast and the 3% figure announced for September. Annual core inflation fell to 2.6%, the lowest level since March 2021, compared to forecasts of 3%. The BLS did not collect data for October 2025 due to the 43-day government shutdown. As a result, October figures were missing, and monthly data for November was not released. However, the BLS reported that the CPI increased by 0.2% over the two-month period from September to November 2025.
Our model produces results suggesting that the monthly CPI data could come in at 0.22% in December, representing an annual rate of 2.8%.
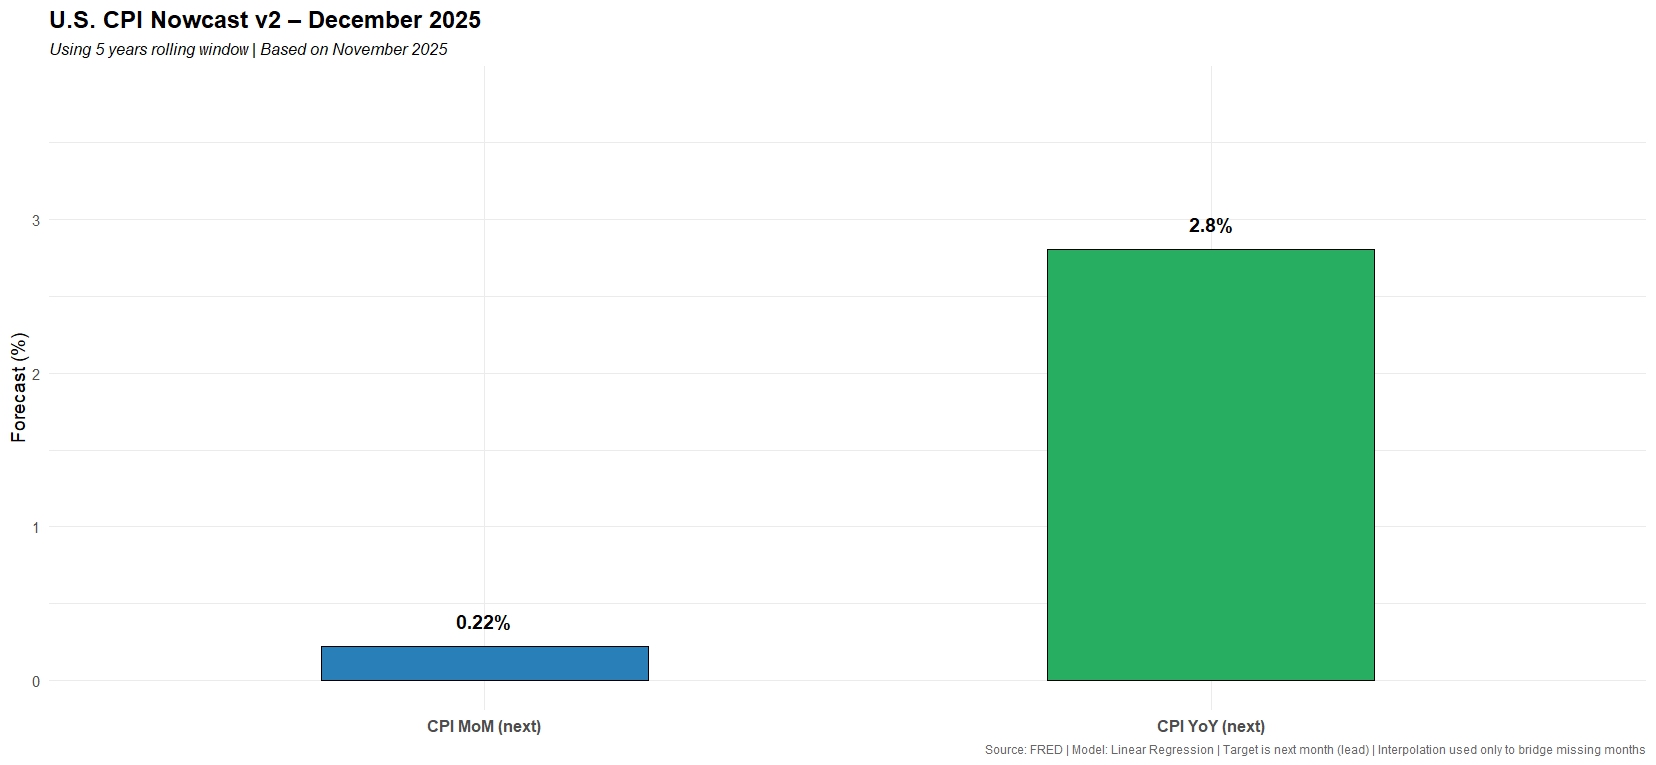
Source: Darkex Research, FRED
A CPI figure that falls below market expectations could be interpreted as giving the Fed more leeway to cut interest rates, which could have a positive impact on digital assets. A figure that exceeds expectations, however, could reinforce expectations that the Fed may hesitate to implement another rate cut, potentially exerting downward pressure.
*Forecast Methodology Note – CPI Nowcast
The US CPI forecasts shared in this report were generated using a lag (momentum)-based, short-term (rolling window) nowcast model. The model estimates the explanatory power of movements in the previous month’s inflation sub-components (core, food, energy, and housing) on the next month’s CPI realization, based on the last 5 years of data. The absence of October 2025 CPI data in the dataset due to the temporary government shutdown in the US created a continuity issue in the monthly change calculations. This technical gap was addressed by using linear interpolation at index levels solely for the purpose of calculating monthly changes (MoM). This approach does not replace official data but merely prevents the model’s time series structure from being disrupted. Annual change (YoY) estimates were calculated directly from published data without any imputation. As a result, the estimates presented reflect a transparent and repeatable nowcast framework focused on capturing short-term inflation momentum. The estimates provide a nowcast framework indicating the short-term direction and are updated based on the data flow.
Other Key Macroeconomic Indicators and Developments
January 13– ADP Weekly Employment Change: This data was first published by Automatic Data Processing, Inc. (ADP) in October 2025. It is high-frequency private sector employment data based on a four-week moving average and tends to be more volatile than the monthly ADP Employment Report. It is also known as NER Pulse, short for National Employment Report. In summary, it shows the estimated average weekly change in the number of people employed over the previous four weeks, excluding the agricultural and public sectors. It is released on the first Tuesday of each week, approximately two weeks after the four-week period ends. The release of these data is skipped in weeks when the monthly ADP Employment Report is published. Job creation is closely monitored because it is an important leading indicator of consumer spending, which constitutes a large part of overall economic activity. During periods when market pricing is heavily influenced by the Fed’s monetary policy decisions, data above expectations is expected to have a negative impact on digital assets, while figures below expectations are expected to have a positive impact.
January 14 – Producer Price Index (PPI); The PPI, which shows changes in the prices of finished goods and services sold by producers, is published monthly, approximately 13 days after the end of the month. It is a leading indicator of consumer inflation. When producers demand higher prices for goods and services, higher costs are generally passed on to consumers. The Core PPI measures changes in the prices of finished goods and services sold by producers, excluding food and energy. PPI data below forecasts are generally expected to have a positive impact on cryptocurrencies.
January 14 – US Retail Sales Data; It is an important measure of consumer spending, which accounts for a large part of overall economic activity. It shows the change in the total value of retail-level sales and is published monthly, about 16 days after the end of the month. A separate measure of the change in the total value of retail-level sales excluding automobiles is called core retail sales. The retail sales data set is generally expected to have a positive impact on digital assets if it is below expectations.
January 14 – The Beige Book; is one of the three books of the Federal Open Market Committee (FOMC), along with the Green Book and the Blue Book, which provide information on how interest rate decisions may change, and only the Beige Book is made public. Its impact on markets is generally limited and it is published eight times a year, two weeks before the FOMC meetings. It reflects information provided by the 12 Federal Reserve banks on local economic conditions in the country, and the messages from it may provide clues for the next interest rate decision by the US Federal Reserve.
January 15 – Initial Jobless Claims; This shows the number of people who filed for unemployment insurance for the first time during the previous week and is published weekly, usually on the first Thursday after the week ends. Although it is a lagging indicator, the number of unemployed is considered an indicator of overall economic health because consumer spending is highly correlated with labor market conditions. Market impact can vary from week to week, and market participants tend to focus more on this data when they are more sensitive to recent developments or when macro indicators related to the labor market are at extreme levels.
January 15 – Empire State Manufacturing Index; This is a diffusion index based on manufacturers participating in a survey in New York State. It is published monthly, around the middle of the current month, and values above 0 indicate improving conditions, while values below 0 indicate deteriorating conditions. It covers approximately 200 manufacturers in New York State and is compiled from a survey asking participants to assess the relative level of general business conditions. Data above expectations may have a positive impact on digital assets.
Important Economic Calendar Data
Click here to view the weekly Darkex Crypto and Economy Calendar.
Information:
*The calendar is based on UTC (Coordinated Universal Time) time zone. The calendar content on the relevant page is obtained from reliable data providers. The news in the calendar content, the date and time of the announcement of the news, possible changes in the previous, expectations and announced figures are made by the data provider institutions.
Darkex cannot be held responsible for any changes arising from similar situations. You can also check the Darkex Calendar page or the economic calendar section in the daily reports for possible changes in the content and timing of data releases.
Legal Notice
The investment information, comments, and recommendations contained in this document do not constitute investment advisory services. Investment advisory services are provided by authorized institutions on a personal basis, taking into account the risk and return preferences of individuals. The comments and recommendations contained in this document are of a general nature. These recommendations may not be suitable for your financial situation and risk and return preferences. Therefore, making an investment decision based solely on the information contained in this document may not result in outcomes that align with your expectations.