Technical Analysis
BTC/USDT
In August, non-farm payrolls en the US increased por only 22K, falling well short of the 75K expectation; the unemployment rate stood at 4.3%. This weak data indicated that the slowdown en the labor market is continuing. Meanwhile, the US Senate Banking Committee has brought a reform bill to regulate the crypto market structure to its final stage. The bill is expected to be submitted to the committee this month and voted el before the end of the year.
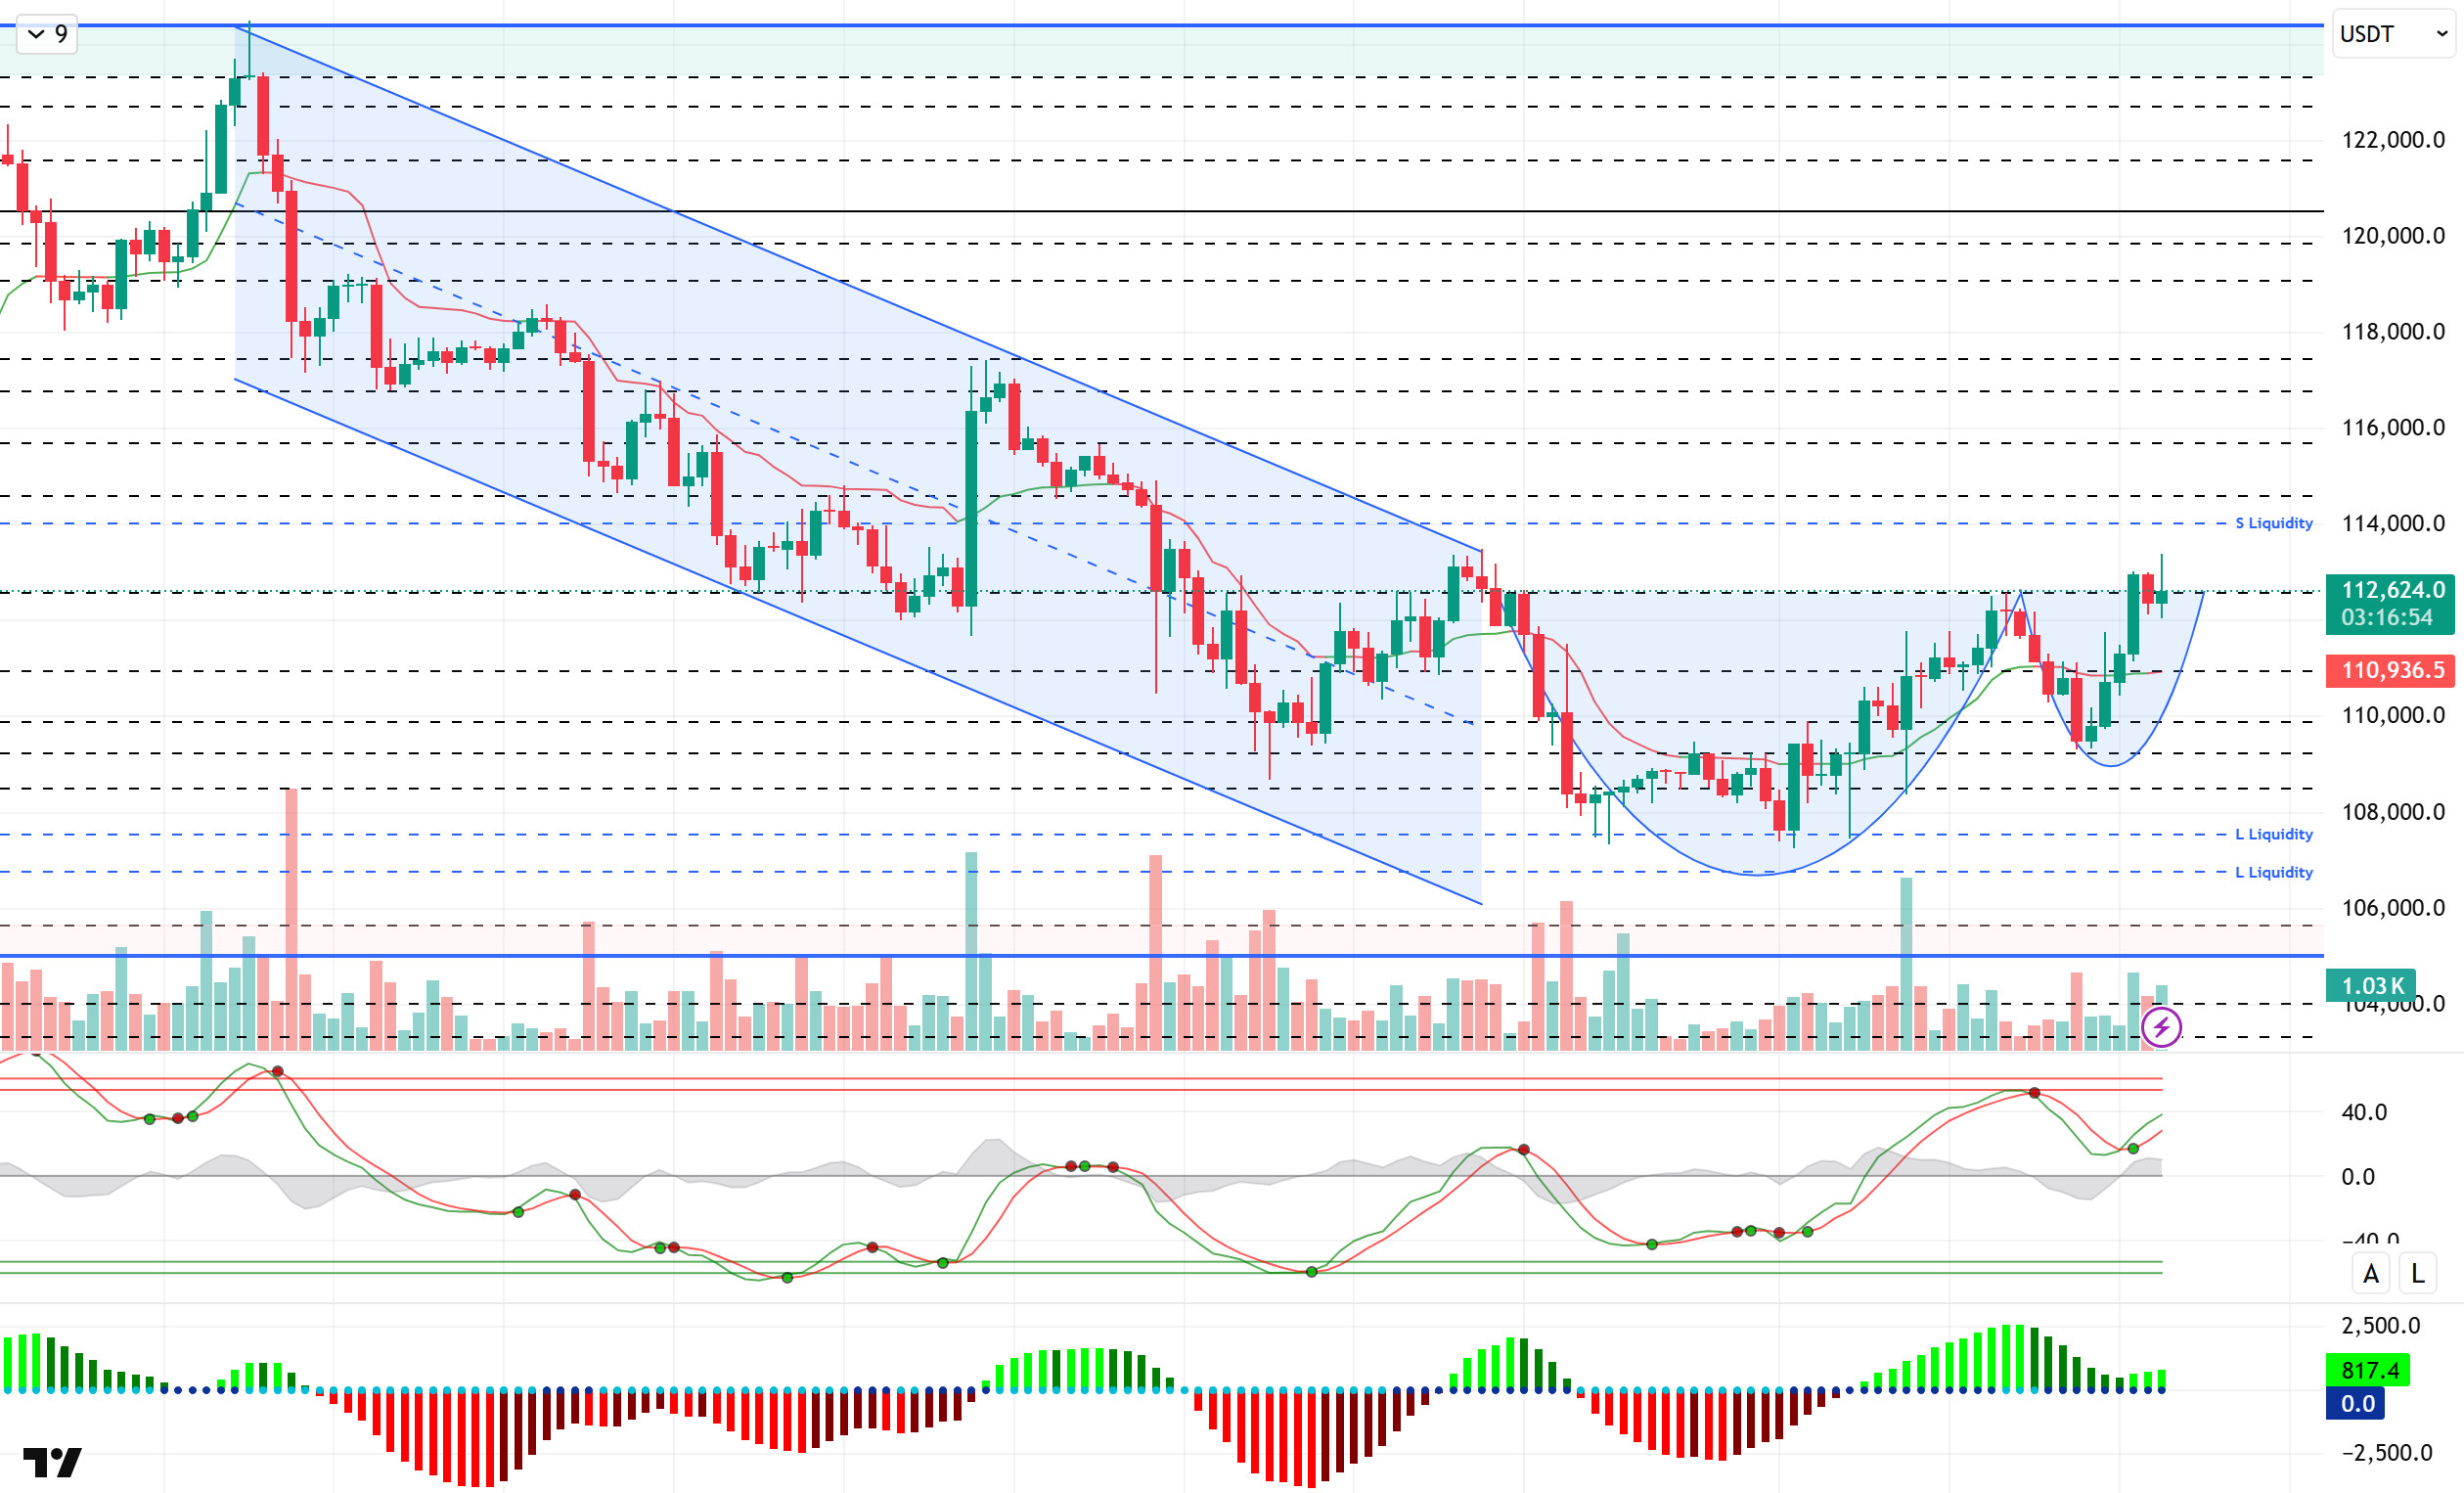
Looking at the technical picture, with the downward trend turning into a horizontal trend, the cup formation en BTC has been completed, while the handle part continues. With the completion of the handle part of the formation, BTC is expected to gain momentum en the upward direction, and volatility has increased following the data. BTC, which rose to 113,300 during the day, continues to trade at 112,600 at the time of writing.
Technical indicators show that the Wave Trend oscillator (WT) has once again turned upward with a buy signal en the middle band of the channel, while the Squeeze Momentum (SM) indicator’s histogram is attempting to regain momentum en positive territory. The Kaufman moving average is currently below the price, moving at the 110,900 level.
Looking at liquidity data, short-term accumulation recorded en sell-side transactions was liquidated at the 112,600 level, while sell-side accumulation en the broader time frame thinned out at the 114,000 level. The buying level has started to accumulate at the 109,000 level en the short term, while the 106,500 – 107,500 band continues to be a more intense accumulation zone.
In summary, the disappearance of the recent optimistic mood due to fundamental developments, along with discussions among Fed members about interest rate cuts and new task allocations, and the continued focus el tariffs, stand out as factors putting pressure el prices. Technically, while the formation of a suitable ground for a new upward movement created some recovery, it was noteworthy that the increases remained en the form of liquidity purchases. The upward movement could turn into a trend if new catalysts reappear en the market and create a driving force el the price. In this context, 112,600 stands out as a critical reference and liquidity area for the continuation of the upward movement. Breaking this level could allow the price to gain momentum and bring a movement towards the 114,000 level. In the event of potential selling pressure, a break below 110,000 could bring us to the 108,500 level.
Supports: 108,500 – 107,400 – 105,000
Resistances: 111,000 – 112,600 – 114,000
ETH/USDT
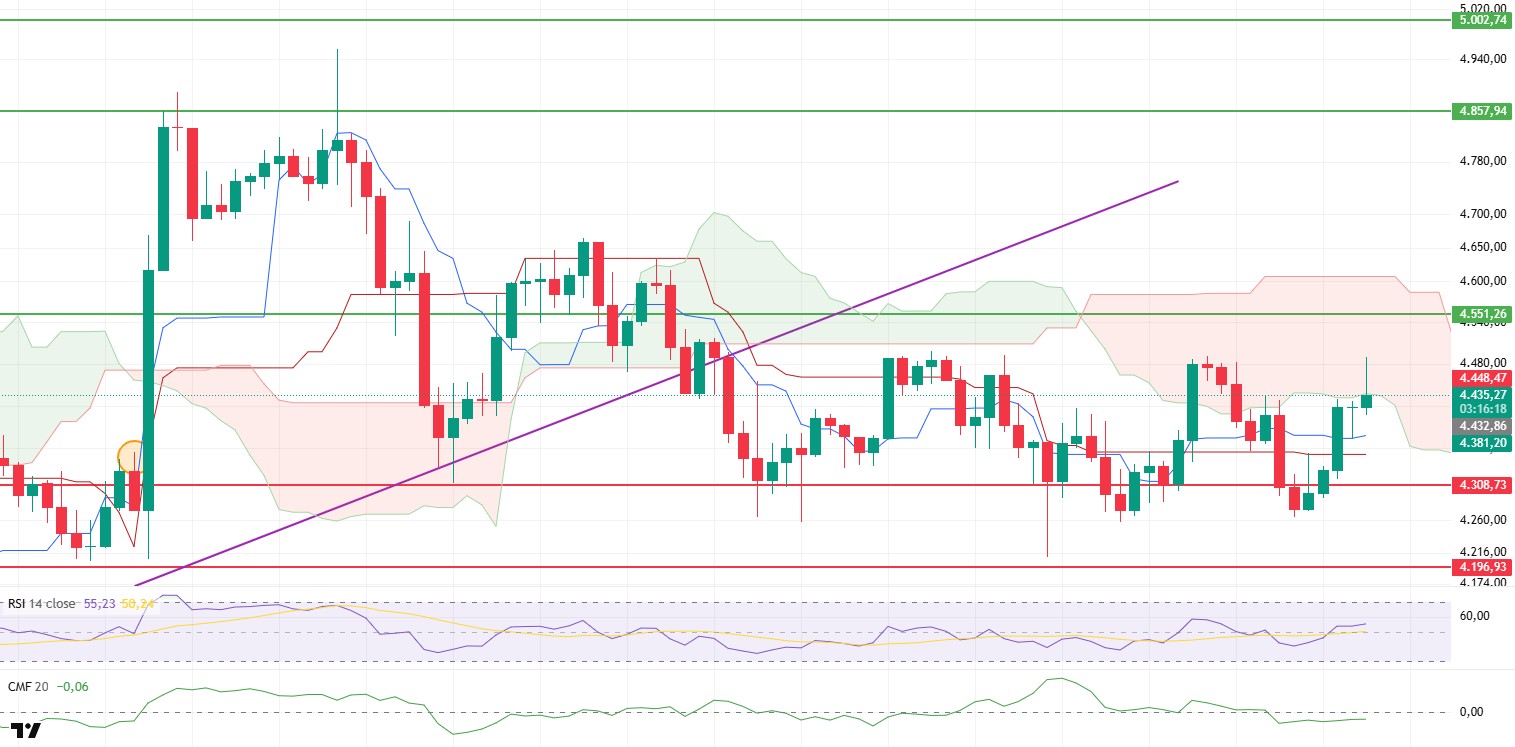
The US non-farm payrolls data, which came en well below expectations at only 22k, increased risk appetite en the markets. A strong recovery was observed en the cryptocurrency market, along with global stock markets. With this development, ETH entered the kumo cloud during the day and rose to $4,490. However, with the sales coming from this level, the price is currently balanced at $4,440. This movement shows that buyers have entered the market but that selling pressure continues en the resistance zones.
Looking at the Ichimoku indicator, the price breaking above the lower band of the kumo cloud signals that the previous strong resistance has weakened. This increases the likelihood of the price moving back towards the upper limits of the cloud en the evening horas. In particular, the Tenkan level being broken and the line gaining an upward trend indicates that the short-term positive scenario is strengthening. The Kijun level becoming supportive en the coming horas could increase the momentum of the rise.
On the momentum side, the Relative Strength Index (RSI) crossing above the 50 level and pricing above the based moving average level confirms positive momentum en the short term. However, the Chaikin Money Flow (CMF) indicator remaining en negative territory indicates that sufficient fund inflows have not been achieved el the spot side and that investors are acting cautiously. This divergence reveals that a cautious atmosphere persists en the market despite the price increase.
Looking at technical levels, $4,308 is the key support level. As long as the price stays above this level, the bullish scenario remains valid. A downward break could increase short-term selling pressure and push the price to the $4,260 and $4,196 support levels. On the upside, $4,551 stands out as the most critical resistance point. If the price manages to stay above this level, the trend is expected to turn positive and the price could rapidly rise towards the $4,650 region. In summary, the ETH price seized the opportunity to rebound within the day amid the positive environment created por US data and entered the kumo cloud. Although the technical outlook supports a short-term recovery, the CMF indicator remaining negative indicates that buyers have not yet been able to secure a strong influx of funds. For the price direction en the evening horas, the 4,308 support and 4,551 resistance levels should be monitored as critical thresholds.
Support levels: 4.308 – 4.196 – 4.084
Resistance levels: 4,551 – 5,857 – 5,000
XRP/USDT
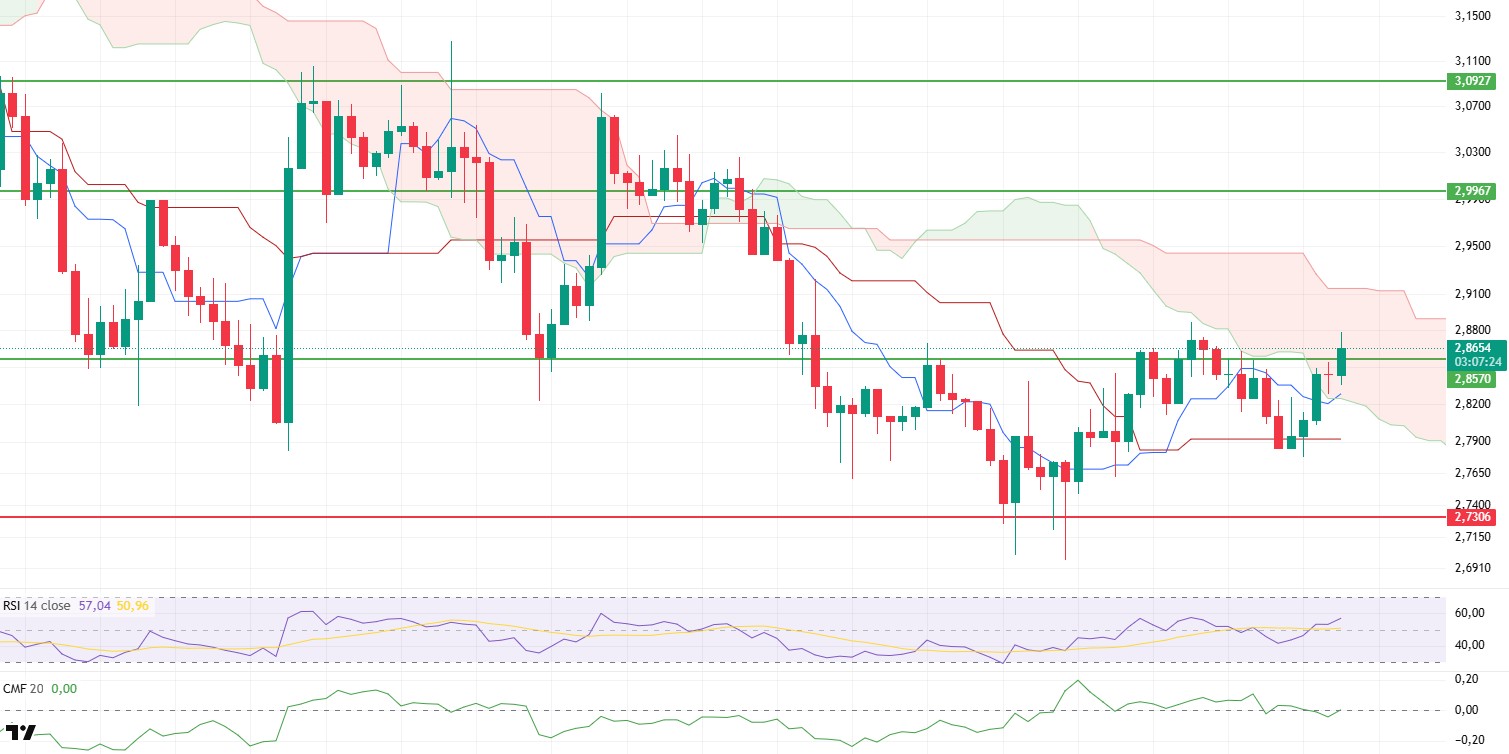
Following the release of U.S. non-farm payroll data, which came en well below expectations at 22k, risk appetite increased en global markets, and gains were also seen en the cryptocurrency market. XRP rose to $2.87, entering the cloud with this volatility. However, with the sell-off from this level, the price has stabilized at $2.85. The price, which was stuck en a narrow range throughout the day, entering the cloud is emerging as a sign of a critical change en the trend.
On the liquidity side, the Chaikin Money Flow (CMF) indicator rising back above the zero line indicates that funds are starting to flow en and investors are regaining their appetite for buying. This situation stands out as an important factor supporting the price increase.
On the momentum side, the Relative Strength Index (RSI) indicator remaining above the 50 level and maintaining its upward trend confirms that buyers are gaining strength. This outlook supports the short-term positive scenario.
Looking at the Ichimoku indicator, the price entering the kumo cloud and surpassing the Tenkan level shows that the weak intraday outlook has given way to a short-term positive outlook. If the price remains within the cloud, the trend is likely to gain strength.
Technically, the 2.8570 level is a critical threshold. If the price manages to stay above this level, the uptrend is expected to continue up to the main resistance point at $2.99. In the opposite scenario, the $2.73 level maintains its strong support position, and falling below this level could lead to increased selling pressure. Overall, after trading en a narrow range throughout the day, the XRP price signaled a recovery por entering the cloud with the support of US data. In the evening horas, the 2.8570 and 2.99 dollar resistance levels and the 2.73 dollar support level stand out as decisive thresholds.
Support levels: 2.8570 – 2.7306 – 2.6513
Resistance levels: 2.9967 – 3.0927 – 3.3058
SOL/USDT
DeFi Development Corp’s Solana treasury surpassed $400 million after the latest purchase. DeFi Development Corp bought $117 million worth of Solana over the last eight days.
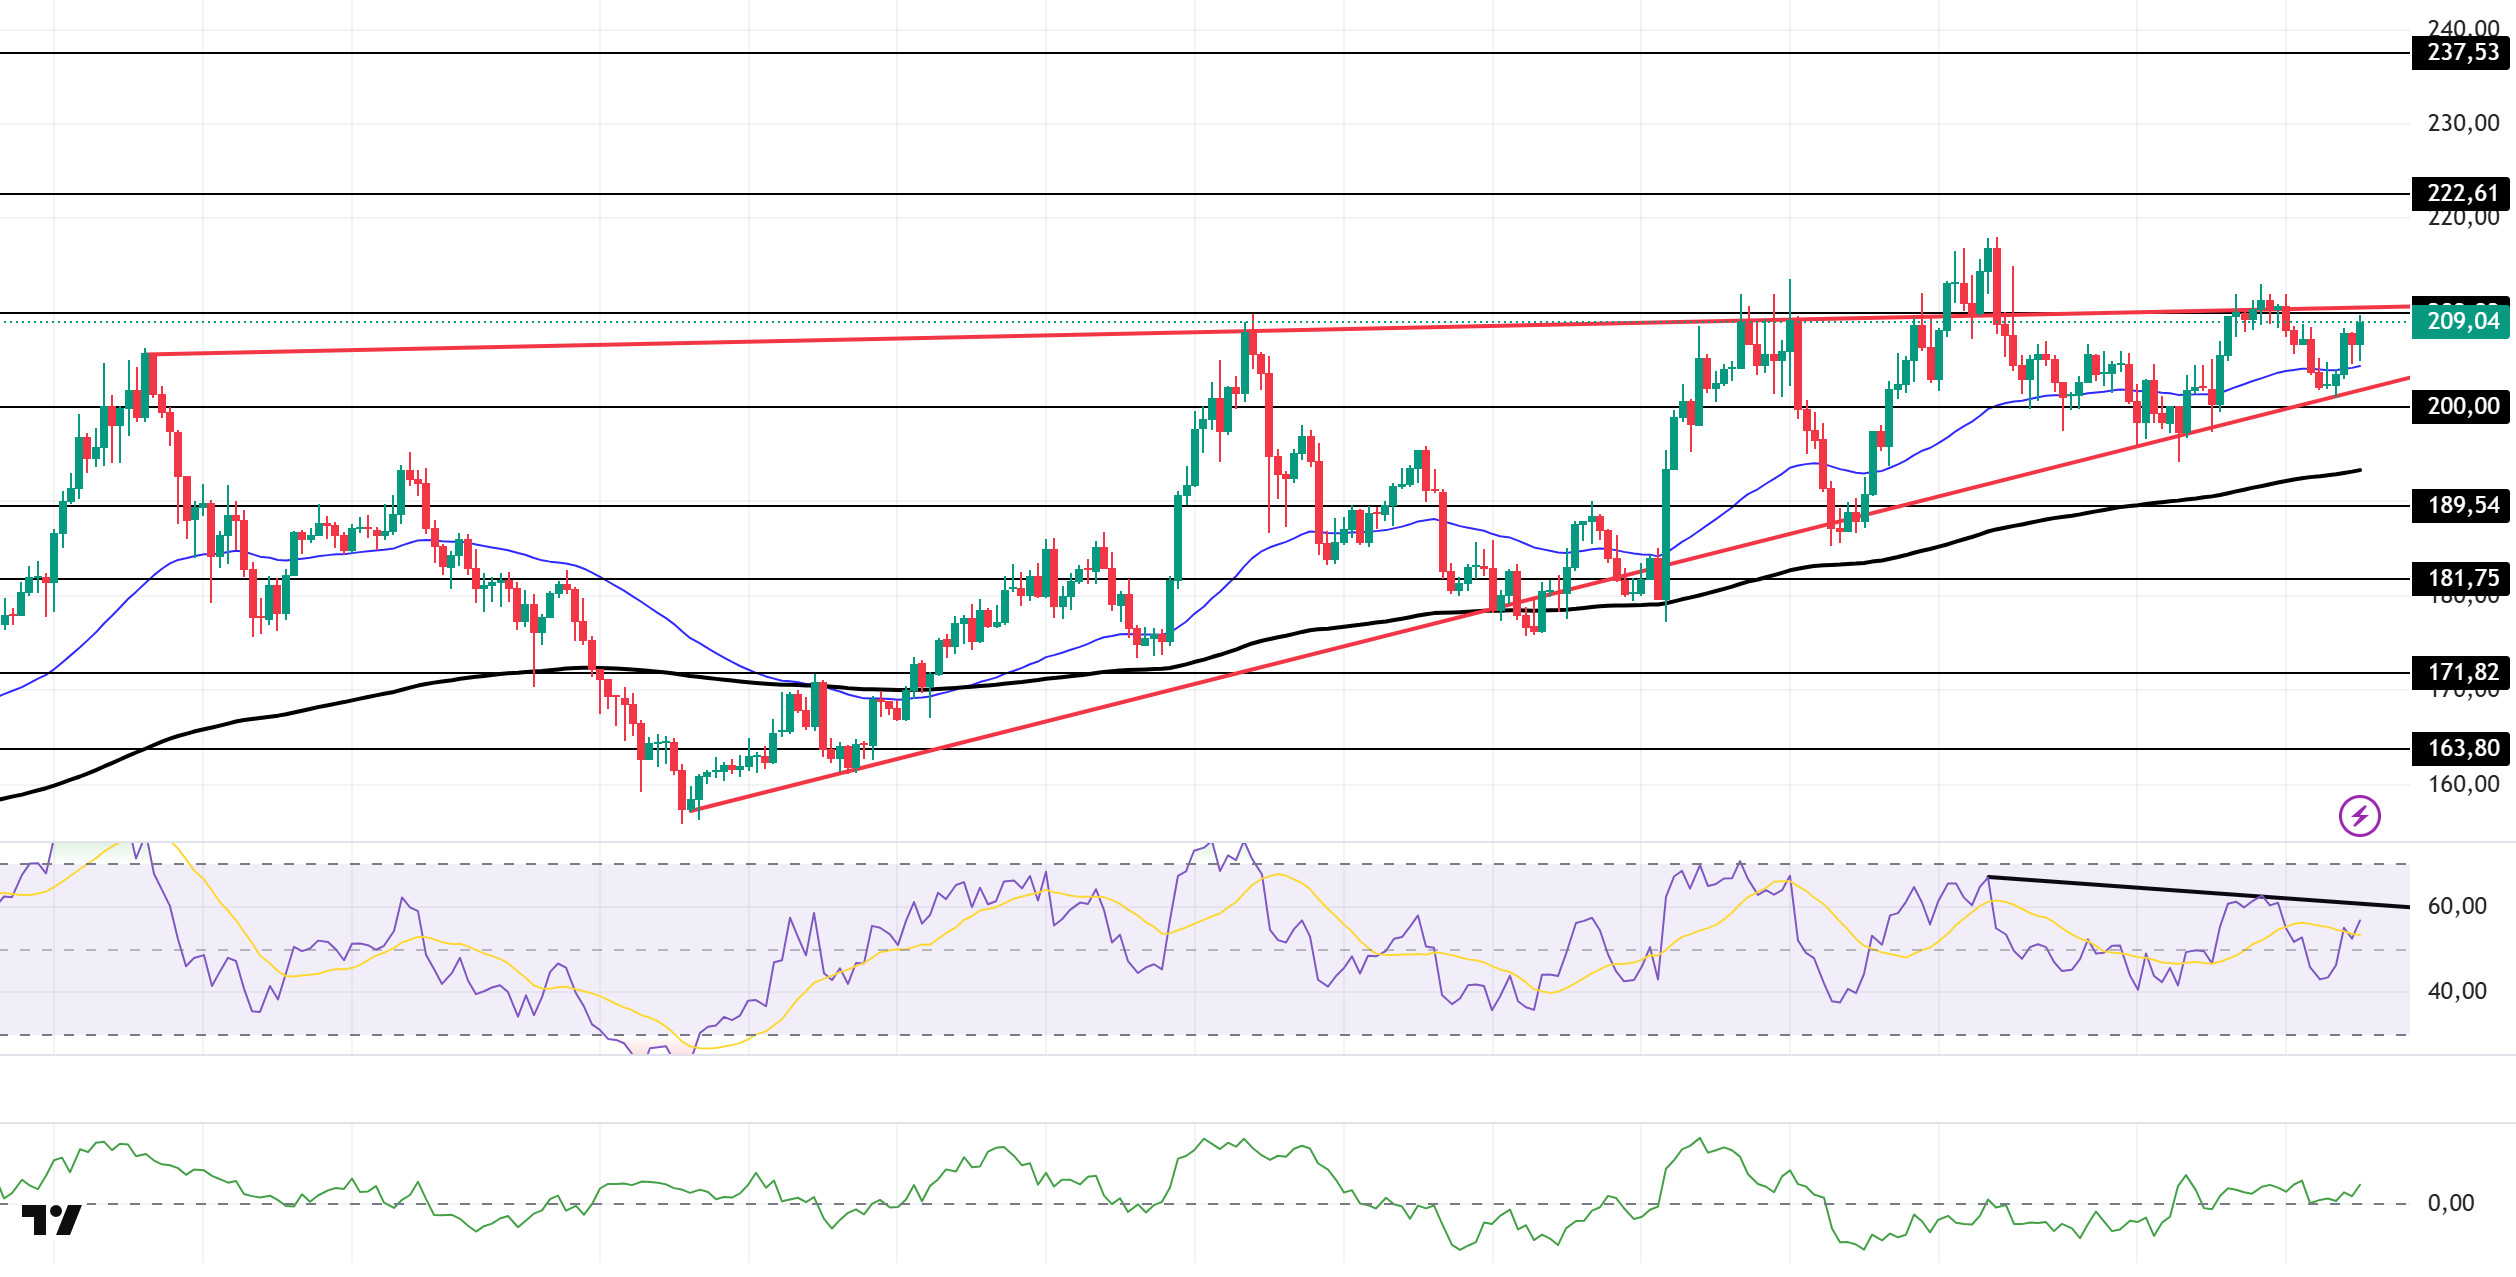
The SOL price showed a slight increase during the day. The asset continued to be within the ascending wedge formation that began el August 2. The price, which found support at the base level of the formation and rebounded, broke above the 50 EMA (Exponential Moving Average – Blue Line) moving average and continued its upward trend. The $200.00 level can be monitored en the event of candle closes below the 50 EMA. If the upward trend continues, the $209.93 level could be triggered.
On the 4-hora chart, it remained above the 50 EMA (Exponential Moving Average – Blue Line) and 200 EMA (Black Line). This indicates that the medium-term upward trend may continue. At the same time, the price being above both moving averages shows us that the market is trending upward en the short term. The Chaikin Money Flow (CMF-20) remained en positive territory. However, balanced cash inflows could keep the CMF en positive territory. The Relative Strength Index (RSI-14) moved into positive territory. At the same time, it remains en the lower region of the downtrend that began el August 29. This indicates that selling pressure could continue. If there is an uptrend due to macroeconomic data or positive news related to the Solana ecosystem, the $222.61 level stands out as a strong resistance point. If this level is broken upwards, the uptrend is expected to continue. If there are pullbacks due to developments en the opposite direction or profit-taking, the $189.54 level could be tested. A decline to these support levels could increase buying momentum, presenting a potential opportunity for an upward move.
Supports: 200.00 – 189.54 – 181.75
Resistances: 209.93 – 222.61 – 237.53
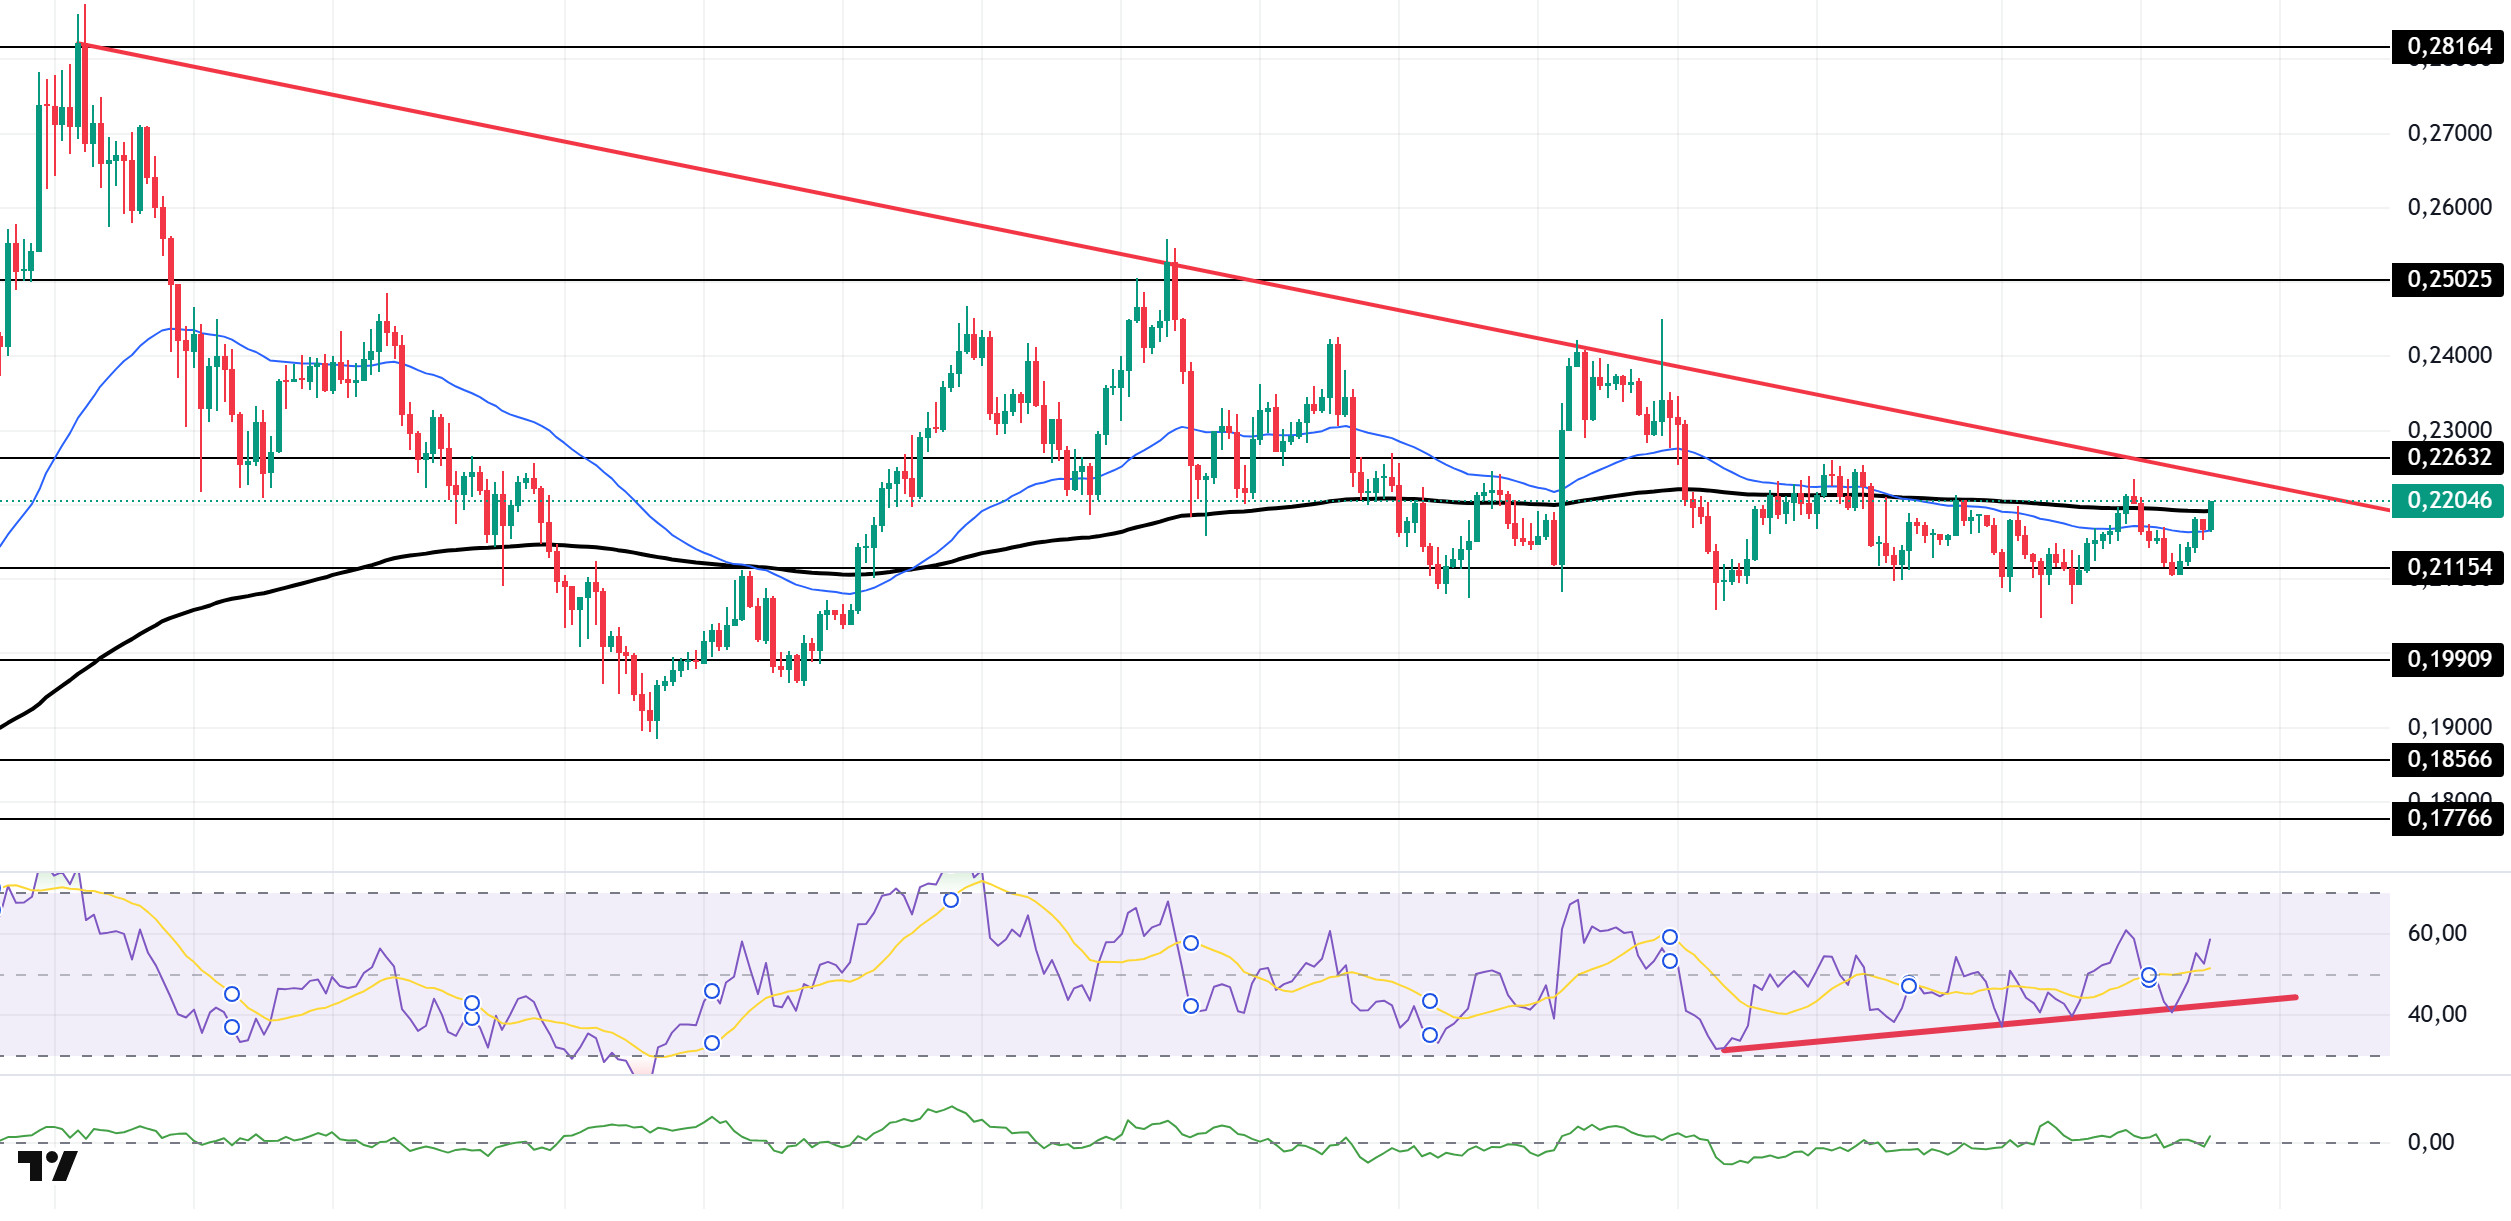
DOGE/USDT
The DOGE price showed a slight increase during the day. The asset remained below the downtrend that began el July 21. Currently testing the 50 EMA (Exponential Moving Average – Blue Line) and 200 EMA (Black Line) moving averages as resistance, the asset should be monitored at the $0.22632 level if the uptrend continues. If the decline continues, the $0.19909 level should be monitored.
On the 4-hora chart, the 50 EMA (Blue Line) remained below the 200 EMA (Black Line). This indicates that a medium-term downward trend has begun. The price being between both moving averages suggests that it is en a decision phase en the short term. The Chaikin Money Flow (CMF-20) continues to remain en the neutral zone. Additionally, a decrease en money inflows could push the CMF into the negative zone. The Relative Strength Index (RSI-14) remained en the negative zone. At the same time, it continues to be en the upper region of the rising trend that began el August 26. In the event of a rise due to political developments, macroeconomic data, or positive news flow en the DOGE ecosystem, the $0.22632 level stands out as a strong resistance zone. Conversely, en the event of negative news flow, the $0.19909 level could be triggered. A decline to these levels could increase momentum and potentially initiate a new upward wave.
Supports: 0.21154 – 0.19909 – 0.18566
Resistances: 0.22632 – 0.25025 – 0.28164
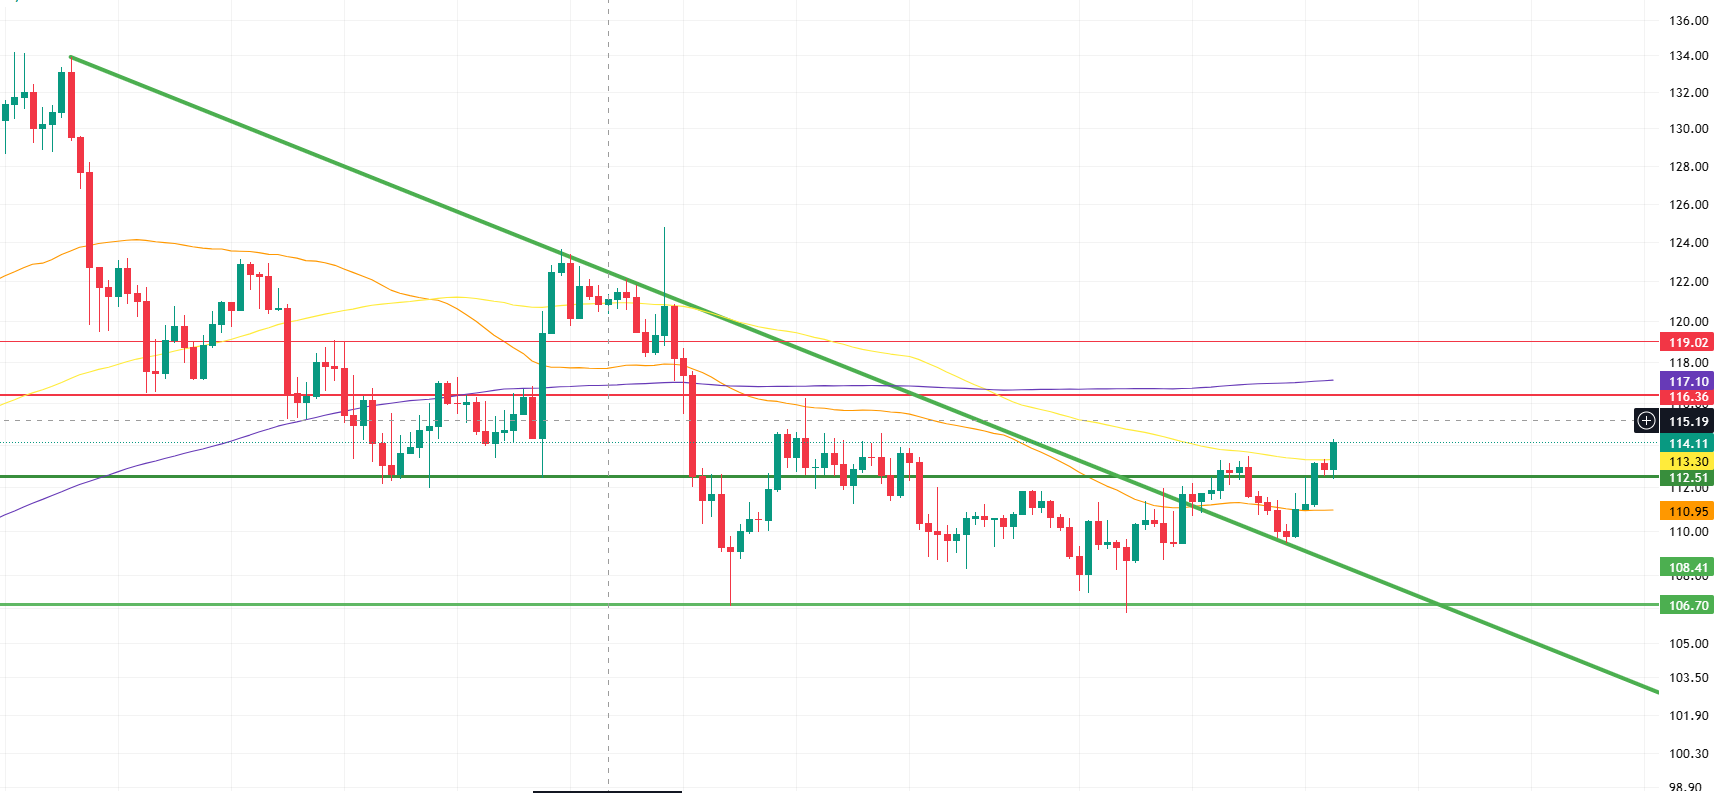
LTC/USDT
LTC gained 2.83% en value during the day and also rose 0.8% against Bitcoin. On the futures side, the ratio of long/short positions opened en the last 24 horas rising to 1.05 indicates an upward trend en the expectations of derivatives market participants. The continuation of positive funding rates also confirms the decline en short positions. This picture reveals that expectations of an upturn en the derivatives markets are intensifying.
In the anticipated upward scenario, the technical chart looks quite strong. First, the horizontal resistance at the 116.36 level indicates selling pressure. Breaking through this level with high volume would signal that momentum is accelerating upward. Next, the 200-period moving average (purple line) at the 117.10 level maintains its position as a major resistance. Breaking this barrier will be a clearer confirmation that the trend is gaining strength. Further up, the horizontal resistance at the 119.02 level stands out as the most critical hurdle for buyers. Sustained closes above this region would pave the way for the upward movement to spread to a much wider area.
If the price drops below the support level of 112.51, this could be interpreted as a negative signal; if attempts to rise fail and the price remains persistently below the average, selling pressure may increase. In such a scenario, the 50-period moving average (orange line) at the segundo level of 110.95 could be expected to hold as support, while the last line of defense is expected to be the major key support at 106.70.
Supports 112.51 – 110.95 – 106.70
Resistors 116.36 – 117.10 – 119.02
Legal Notice
The investment information, comments, and recommendations contained herein do not constitute investment advice. Investment advisory services are provided individually por authorized institutions taking into account the risk and return preferences of individuals. The comments and recommendations contained herein are of a general nature. These recommendations may not be suitable for your financial situation and risk and return preferences. Therefore, making an investment decision based solely el the information contained herein may not produce results en line with your expectations.