
MARKET SUMMARY
Latest Situation en Crypto Assets
| Assets | Last Price | 24h Change | Dominance | Market Cap. |
|---|---|---|---|---|
| BTC | 71,149.00 | -1.18% | 58.82% | 1.41 T |
| ETH | 2,595.00 | -3.86% | 13.06% | 312.78 B |
| SOLANA | 171.64 | -2.67% | 3.37% | 80.74 B |
| XRP | 0.5138 | -1.82% | 1.22% | 29.24 B |
| DOGE | 0.1668 | -2.39% | 1.02% | 24.47 B |
| TRX | 0.1691 | 0.44% | 0.61% | 14.64 B |
| CARDANO | 0.3536 | -0.08% | 0.52% | 12.42 B |
| AVAX | 25.28 | -3.81% | 0.43% | 10.36 B |
| SHIB | 0.00001838 | -0.74% | 0.45% | 10.87 B |
| LINK | 11.95 | -2.04% | 0.31% | 7.52 B |
| DOT | 4.009 | -4.20% | 0.25% | 6.09 B |
*Prepared el 10.31.2024 at 13:30 (UTC)
WHAT’S LEFT BEHIND
US Economic Data Released
US Annual Core Personal Consumption Expenditures Price Index (PCE)
- Previous: 2.7% Expected: 2.6% Announced: 2.7
US Monthly Core Personal Consumption Expenditures Price Index (PCE)
- Previous: 0.1% Expected: 0.3% Announced: 0.3
US Annual Personal Consumption Expenditures Price Index (PCE)
- Previous: 2.2% Expected: 2.1% Announced: 2.1%
US Monthly Personal Consumption Expenditures Price Index (PCE)
- Previous: 0.1% Expected: 0.2% Announced: 0.2%
US Applications for Unemployment Benefits
- Previous: 228 thousand Expectation: 229 thousand Expected: 216 thousand
‘Stable Coin’ Report from the US Treasury Department
The US Treasury Department published a report el the last quarter of the 2024 fiscal year. While a significant part of the 132-page report is devoted to stablecoins, it is noted that companies issuing these coins are buying US Treasury bonds and this creates a serious danger.
JPMorgan Report
Analysts at JPMorgan, one of the world’s largest investment banks, noted en a client analysis published yesterday that a small group of investors around the world are currently turning to Bitcoin and gold, and a possible Trump presidency en the US could further increase this demand.
HIGHLIGHTS OF THE DAY
*There is no important calendar data for the rest of the day.
INFORMATION
*The calendar is based el UTC (Coordinated Universal Time) time zone.
The economic calendar content el the relevant page is obtained from reliable news and data providers. The news en the economic calendar content, the date and time of the announcement of the news, possible changes en the previous, expectations and announced figures are made por the data provider institutions. Darkex cannot be held responsible for possible changes that may arise from similar situations.
MARKET COMPASS
European and US indices are trading el the negative side. The balance sheets of large companies that did not meet expectations and their expectations for the future stand out as the main factor affecting the sales. Microsoft and Meta shares have losses en line with this. Investors will continue to monitor company balance sheets to be announced after the US session. Apple, Amazon and Intel are after the close.
On the other hand, institutional demand remained strong, keeping Bitcoin at record highs, as evidenced por MicroStrategy’s announcement that it plans to raise $42 billion en capital to buy more Bitcoin and over $896 million en inflows into US spot Bitcoin ETFs el Wednesday. However, after the opening of the US stock markets, we observed the impact of the decline en risk appetite en traditional markets and the increased profit-taking impulse following the recent rally en digital assets (en line with our expectation of a short-term decline, as we have emphasized en our previous analysis). At the time of writing, BTC broke below the 71,000 level.
In a period when the markets were watching the balance sheets of major companies and the monetary policy changes of central banks, data from the US was followed today. After the PCE figures, which were not a big surprise, all eyes will turn to the US employment data to be released tomorrow. Click here to review our report el this subject.
Short term and big picture
The recent surge en interest en ETFs, companies such as Microsoft and MicroStrategy setting aside funds to accumulate Bitcoin, and the crypto-friendly Trump leading the presidential election race are all developments that point to a wider acceptance of blockchain and digital assets por traditional markets. Given these dynamics, we maintain our expectation that the direction for major cryptocurrencies is positive en the long term. On the other hand, we also emphasize our expectation that we may see intermediate corrections or periods of respite after the rally.
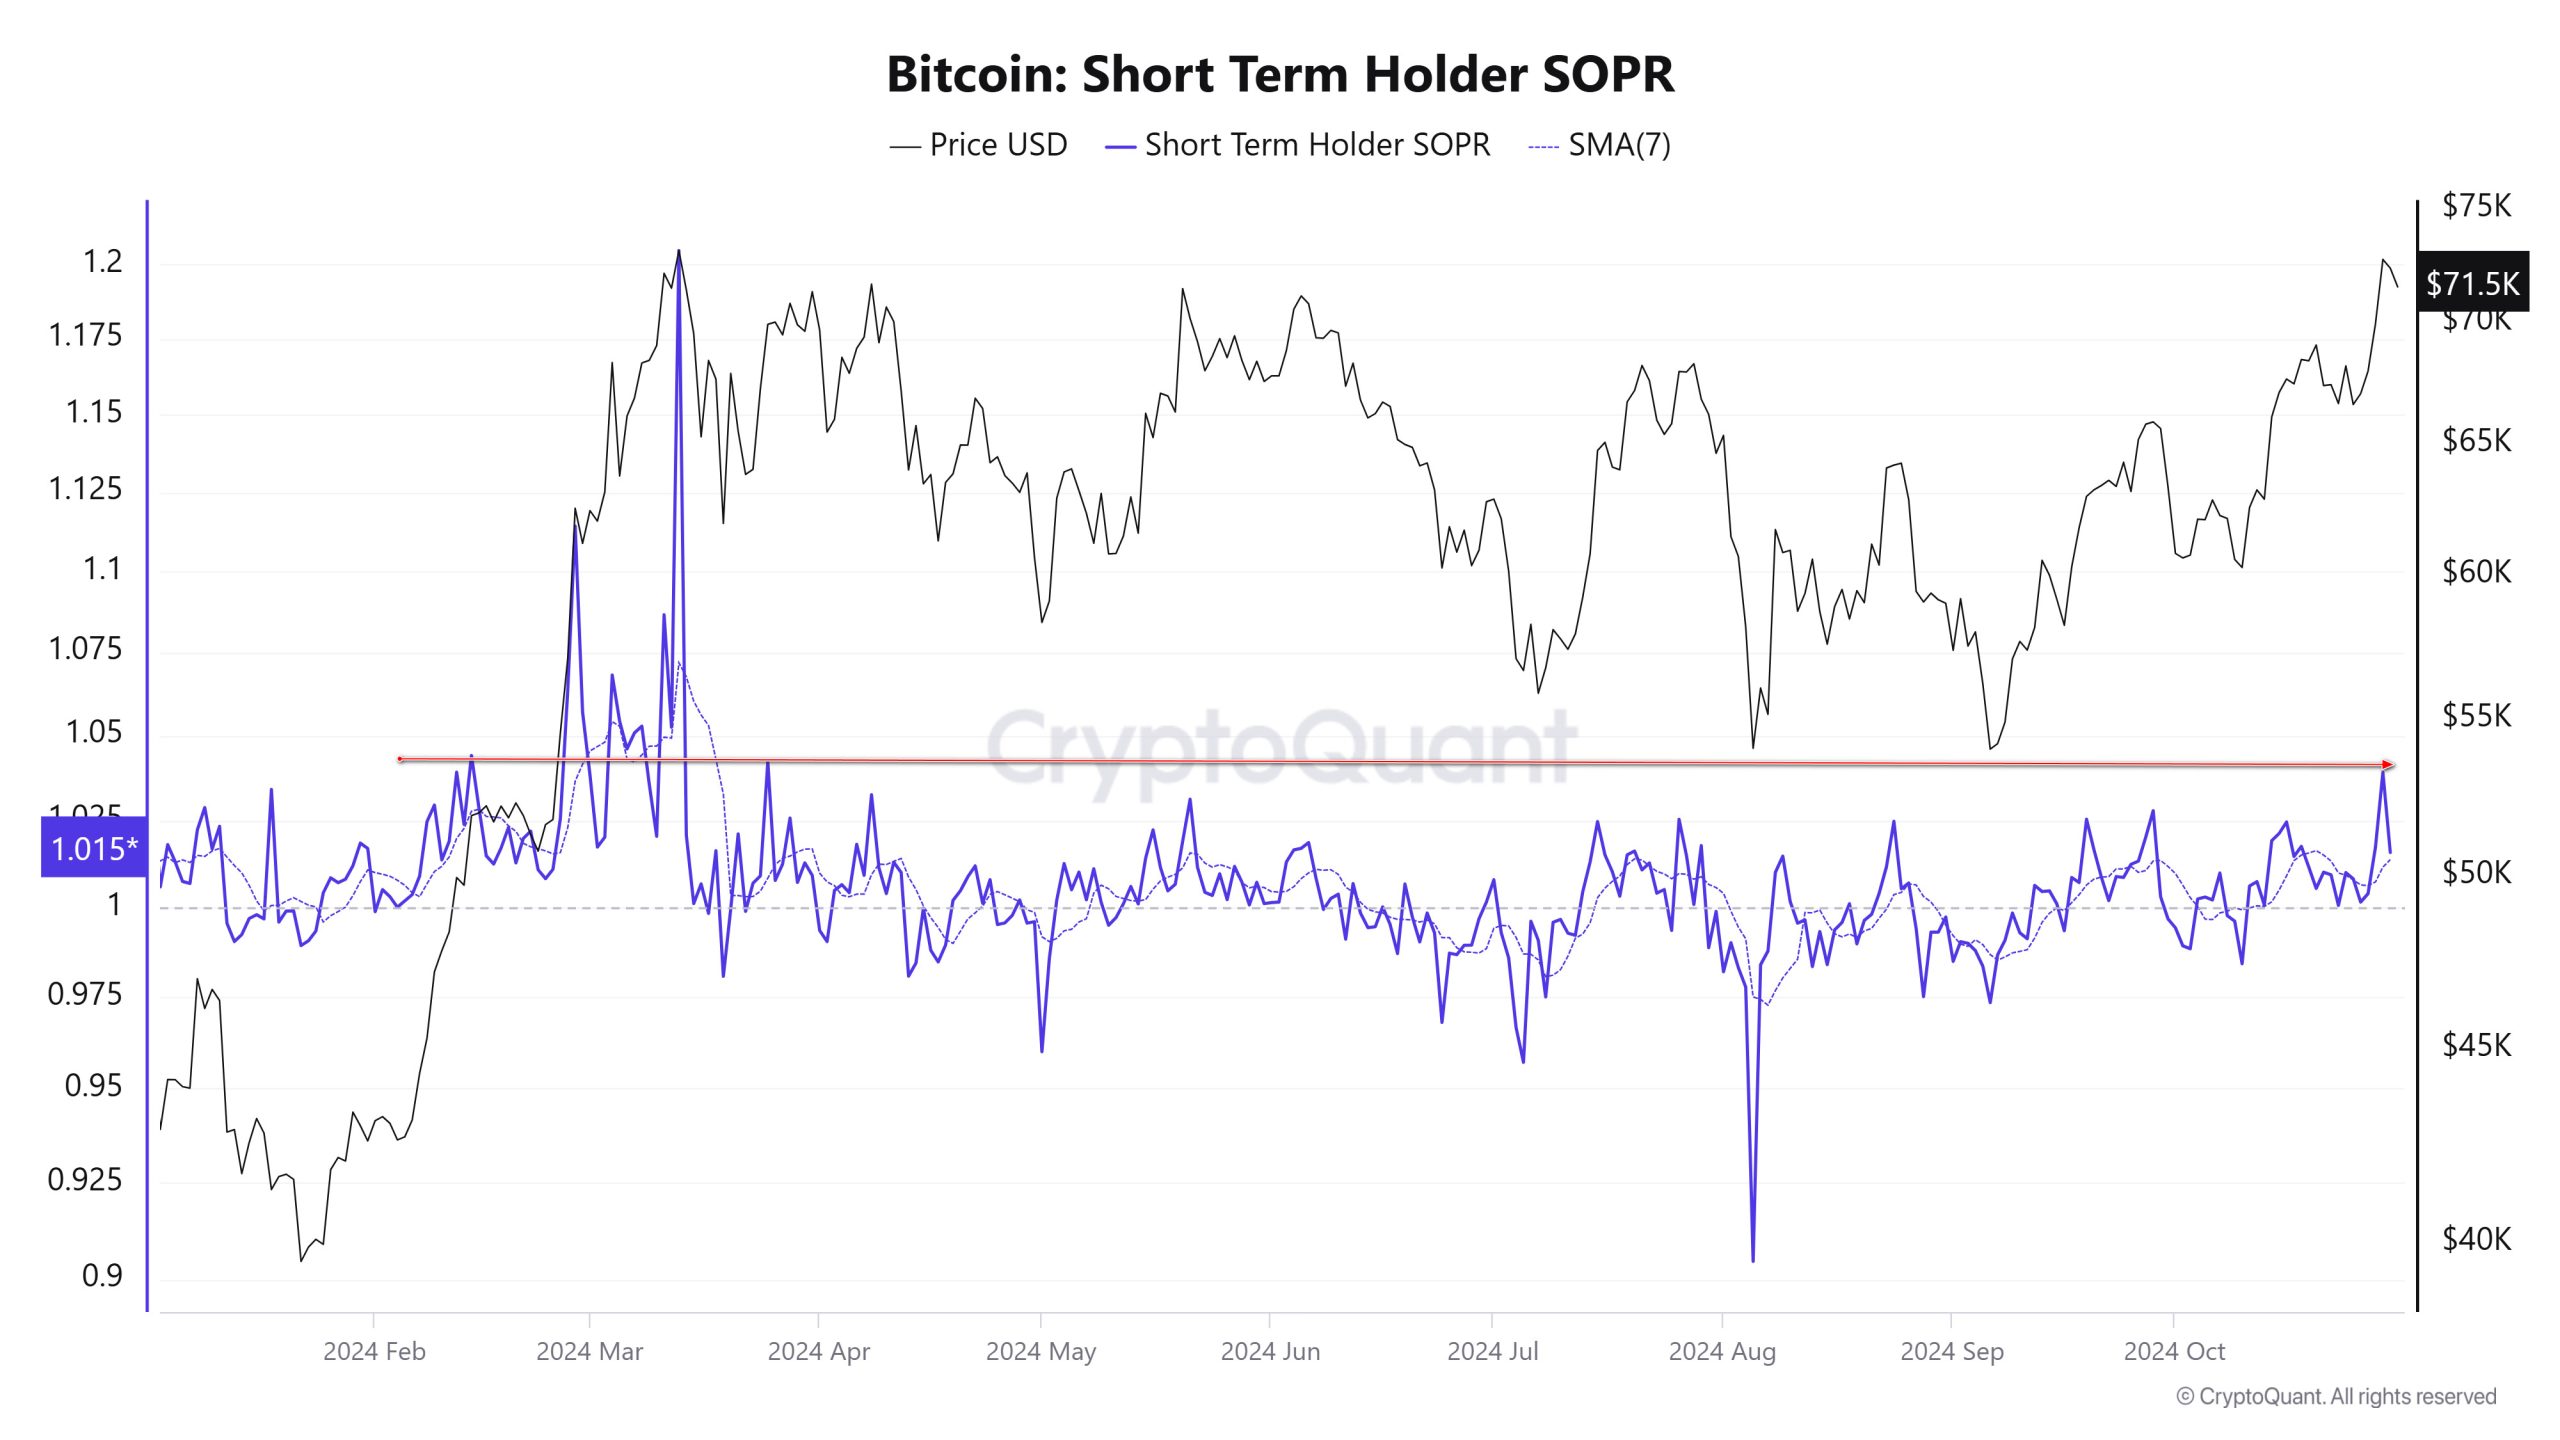
Source: CryptoQuant
At this point, we find it remarkable that the Short-Term Output Profit Ratio (SOPR) declined with the profit realization motive after reaching around 1.04. If the sell-off triggers each other, the retreat may deepen and both the decline en risk appetite en traditional markets due to balance sheet results and the need for SOPR to decline may provide a basis for declines. However, at this point, as mentioned above, we would like to emphasize that we maintain our long-term bullish view and remind you that we said that we would not take short-term declines as a surprise.
TECHNICAL ANALYSIS
BTC/USDT
US economic data releases continued to come en ahead of the FED interest rate meeting. Annual Core Personal Consumption Expenditures Price Index (PCE) came en above expectations at 2.7%, while applications for unemployment benefits came en below expectations at 216K. These data suggest that inflation, although slowing, has not yet reached the target level, but the labor market remains strong. After these data, eyes will be el the non-farm payrolls and unemployment data to be released tomorrow.
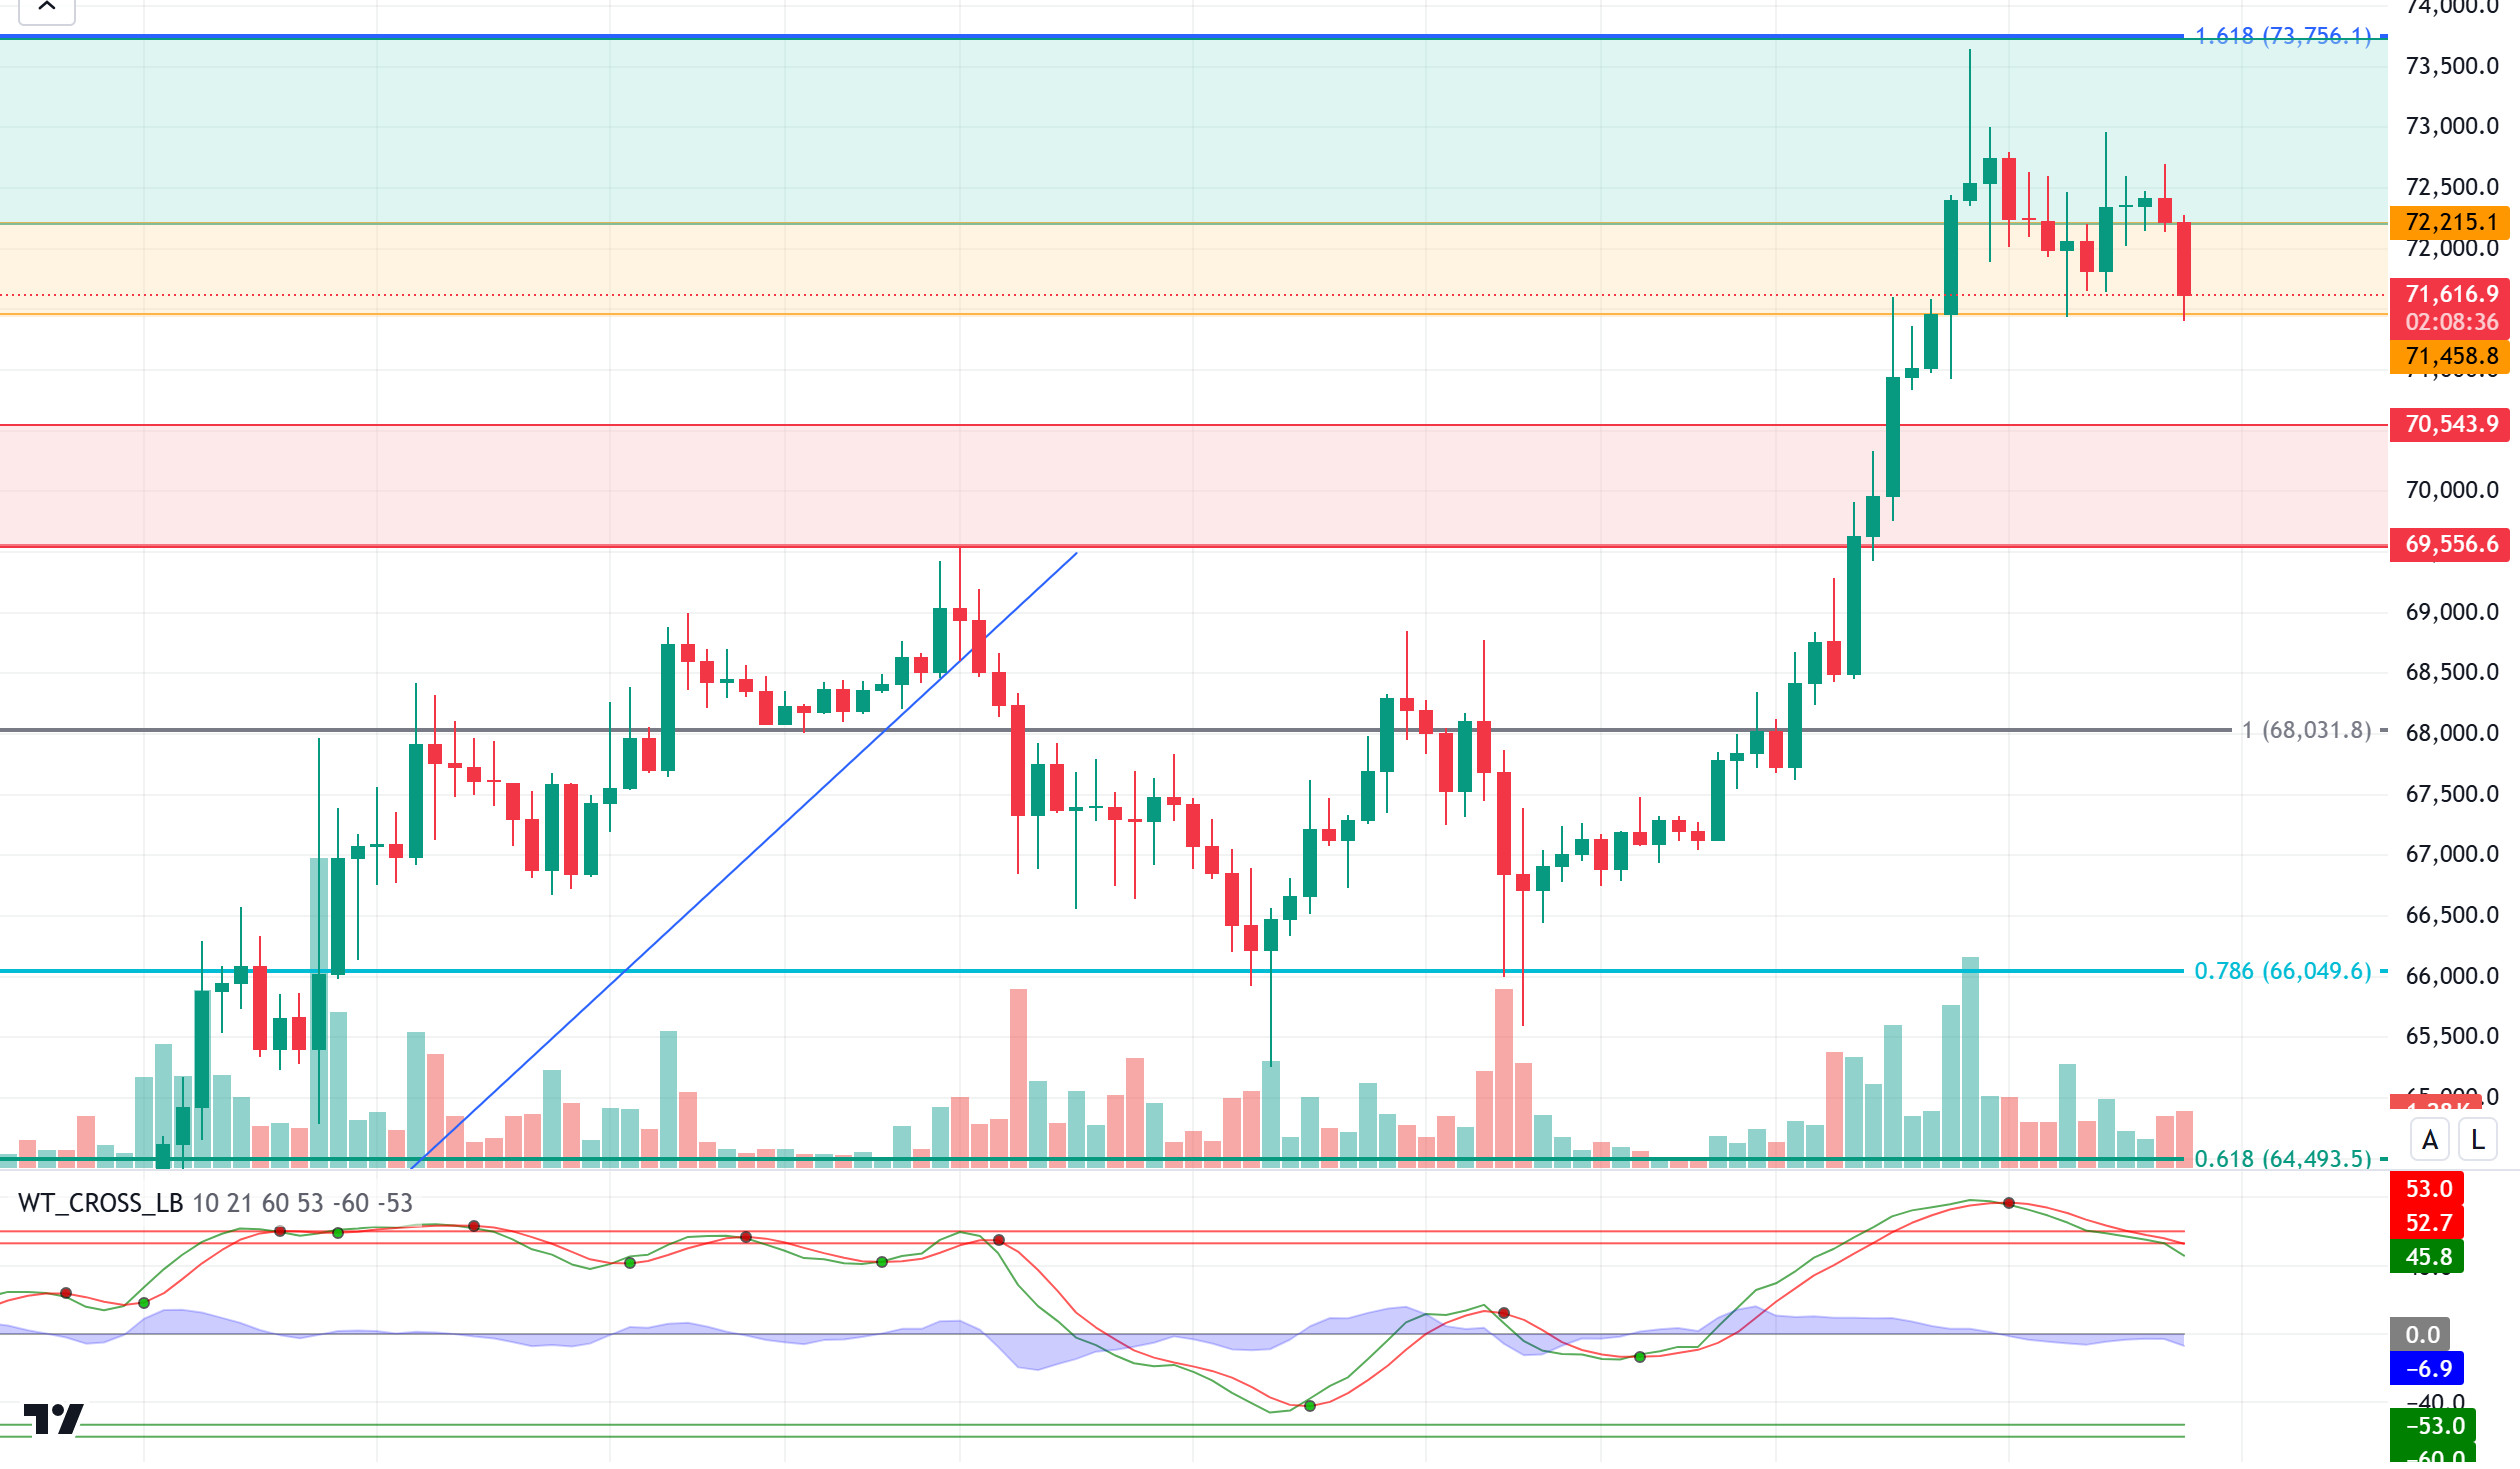
If we look at the BTC technical outlook, there was no significant reaction after the data announced en its price, which exhibited low volatility during the day. BTC, which has managed to hold el to its peak levels for a while, may come the correction movement we expect en its price with the negative course of global indices. In case of a pullback, hourly closes below the support level of 71,458, which is the support level, may deepen the decline somewhat and move it to the minor support level of 70,543. We can say that the declines en BTC, which has no change en its optimistic outlook, are demand collection for new rises.
Supports 71,458 – 69,556 – 68,031
Resistances 72,215 – 72,800 – 73,750
 ETH/USDT
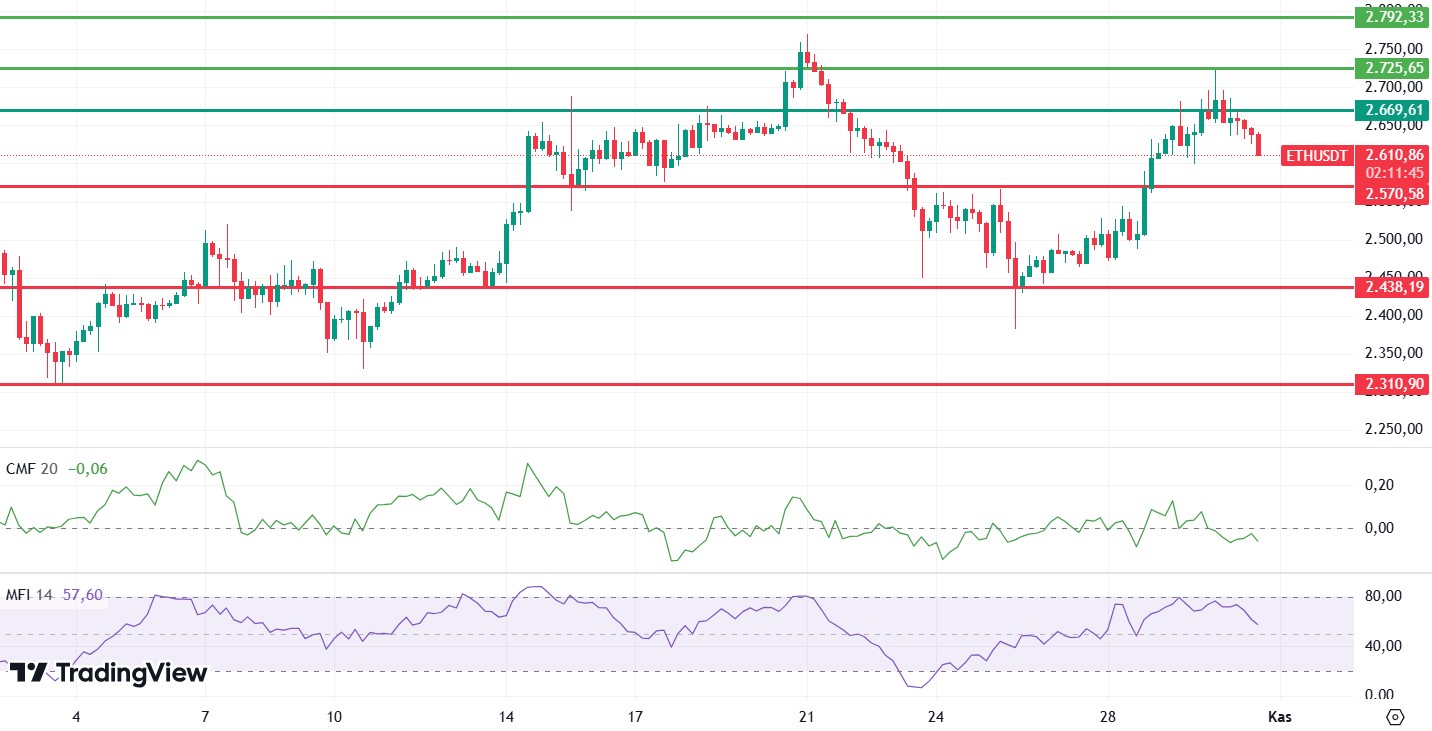
As mentioned en the morning analysis, the decline seems to continue with the Chaikin Money Flow (CMF) turning negative and the negative outlook en the Relative Strength Index (RSI). Looking at the Ichimoku indicator, the loss of the tenkan level may continue the decline until the kijun level of 2.594. There are also negative outlooks el Money Flow Index (MFI) and Commodity channel index (CCI). It can be said that the decline may come down to 2,571, the most important support level. If there is no reaction from here, the decline may deepen. It is important to regain the 2,669 level for the continuation of the positive trend. By exceeding this level, rises up to 2,725 levels can be expected again.
Supports 2,571 – 2,438 – 2,310
Resistances 2,669 – 2,725 – 2,792
 LINK/USDT
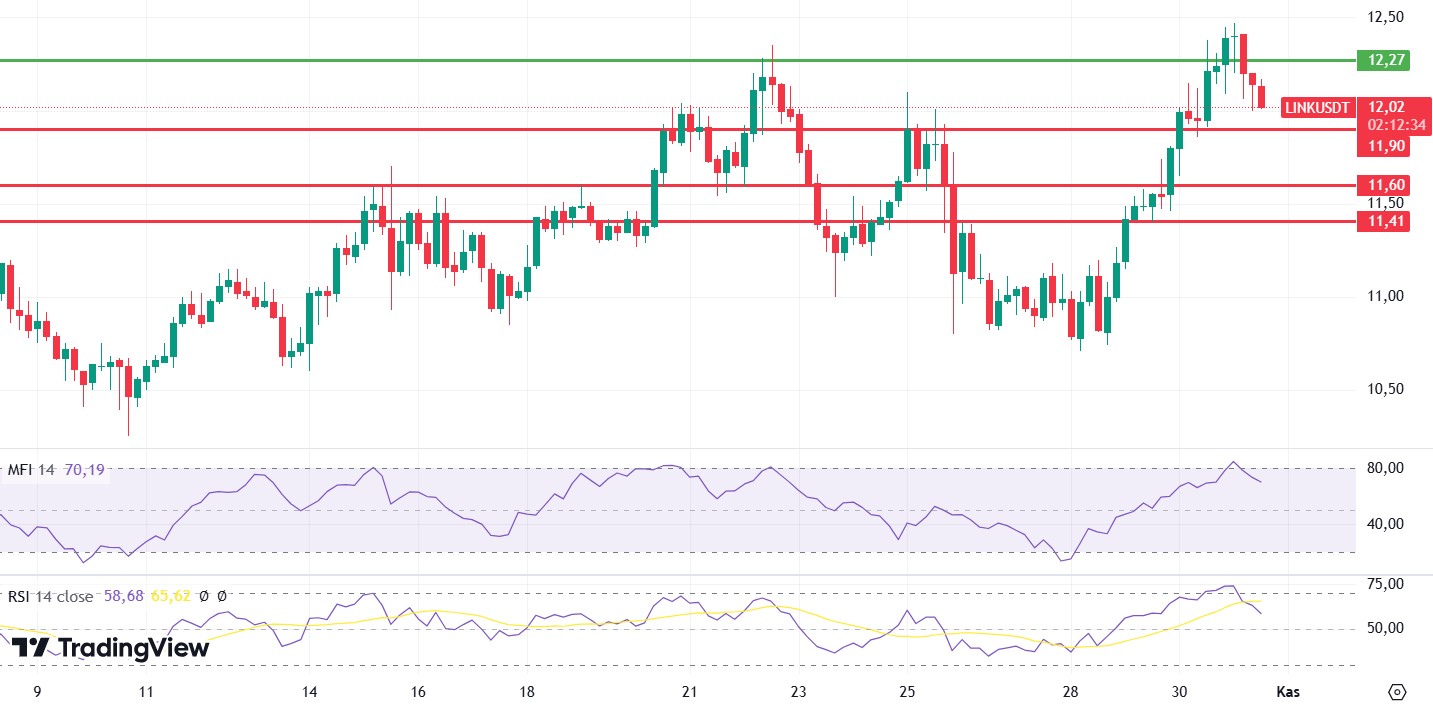
LINK seems to continue its decline as expected and with the sell signals el Relative Strength Index (RSI) and Money Flow Index (MFI). Assuming that the 11.90 level is the main support, the break of this level may deepen the decline and cause it to fall to 11.60. Regaining the 12.27 level may invalidate the negative scenario and allow the positive trend to continue.
Supports 11.90 – 11.60 – 11.41
Resistances 12.27 – 12.98 – 13.77
SOL/USDT
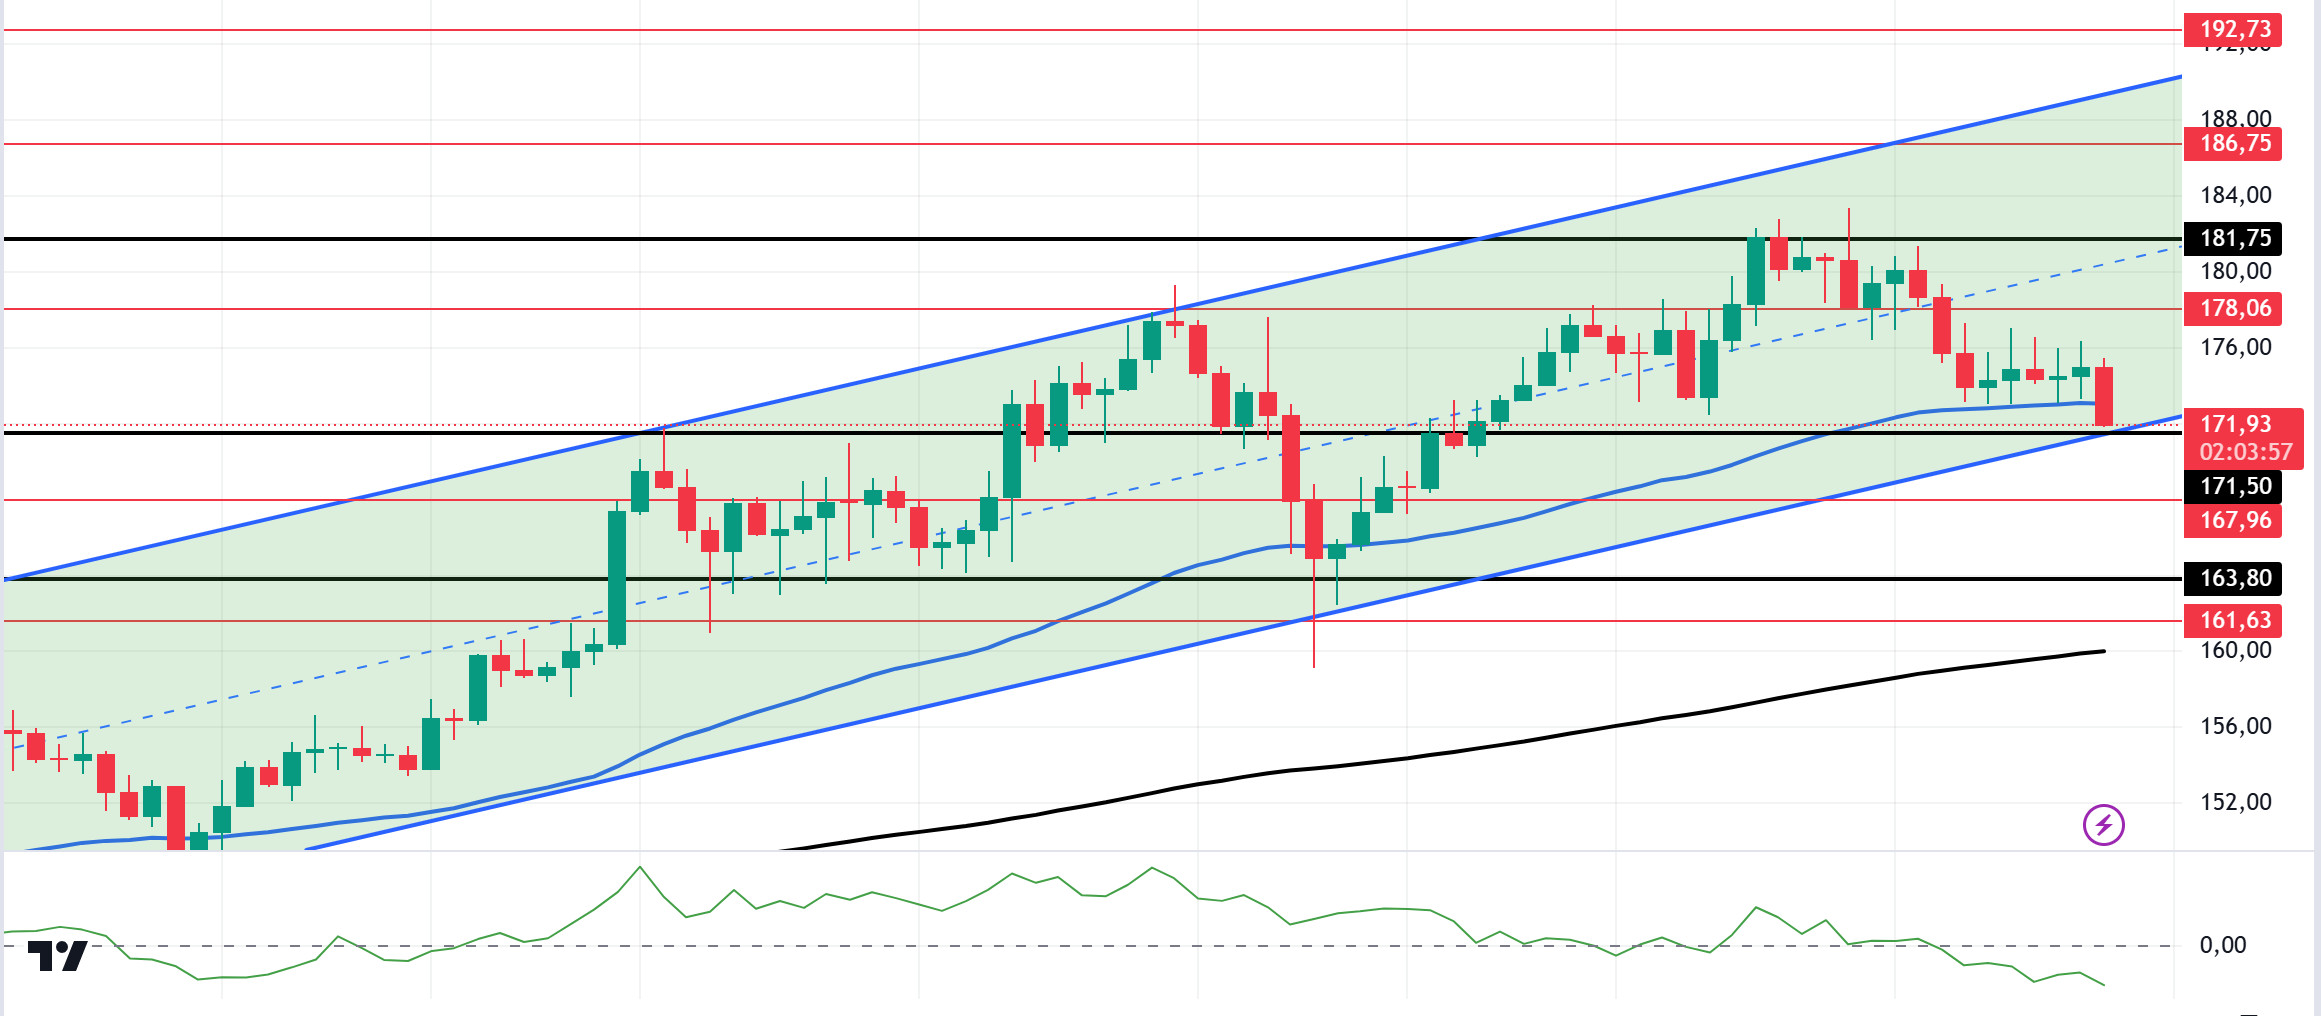
The core PCE price index en the US came en at 0.3% en September compared to the previous month, as expected. In the Solana ecosystem, DEX volume dropped significantly, suggesting less activity. Technically, SOL tested the 181.75 level but failed to turn it into support. On the 4-hora timeframe, the 50 EMA (Blue Line) continues to be above the 200 EMA (Black Line). This means that the uptrend will continue, but the excess distance between them may also bring possible declines. However, the price has taken support from the 50 EMA as it continues to form higher highs and higher lows. The Chaikin Money Flow (CMF)20 indicator crossed into negative territory, confirming money outflows and reduced volume el the DEX. The 181.75 level is a very strong resistance point en the uptrend driven por both macroeconomic conditions and innovations en the Solana ecosystem. If it rises above this level, the rise may continue strongly. In case of possible political reasons or profit sales, the support levels of 171.50 and 163.80 may be triggered again. If the price comes to these support levels, a potential bullish opportunity may arise.
Supports 171.50 – 167.96 – 163.80
Resistances 178.06 – 181.75 – 186.75
ADA/USDT
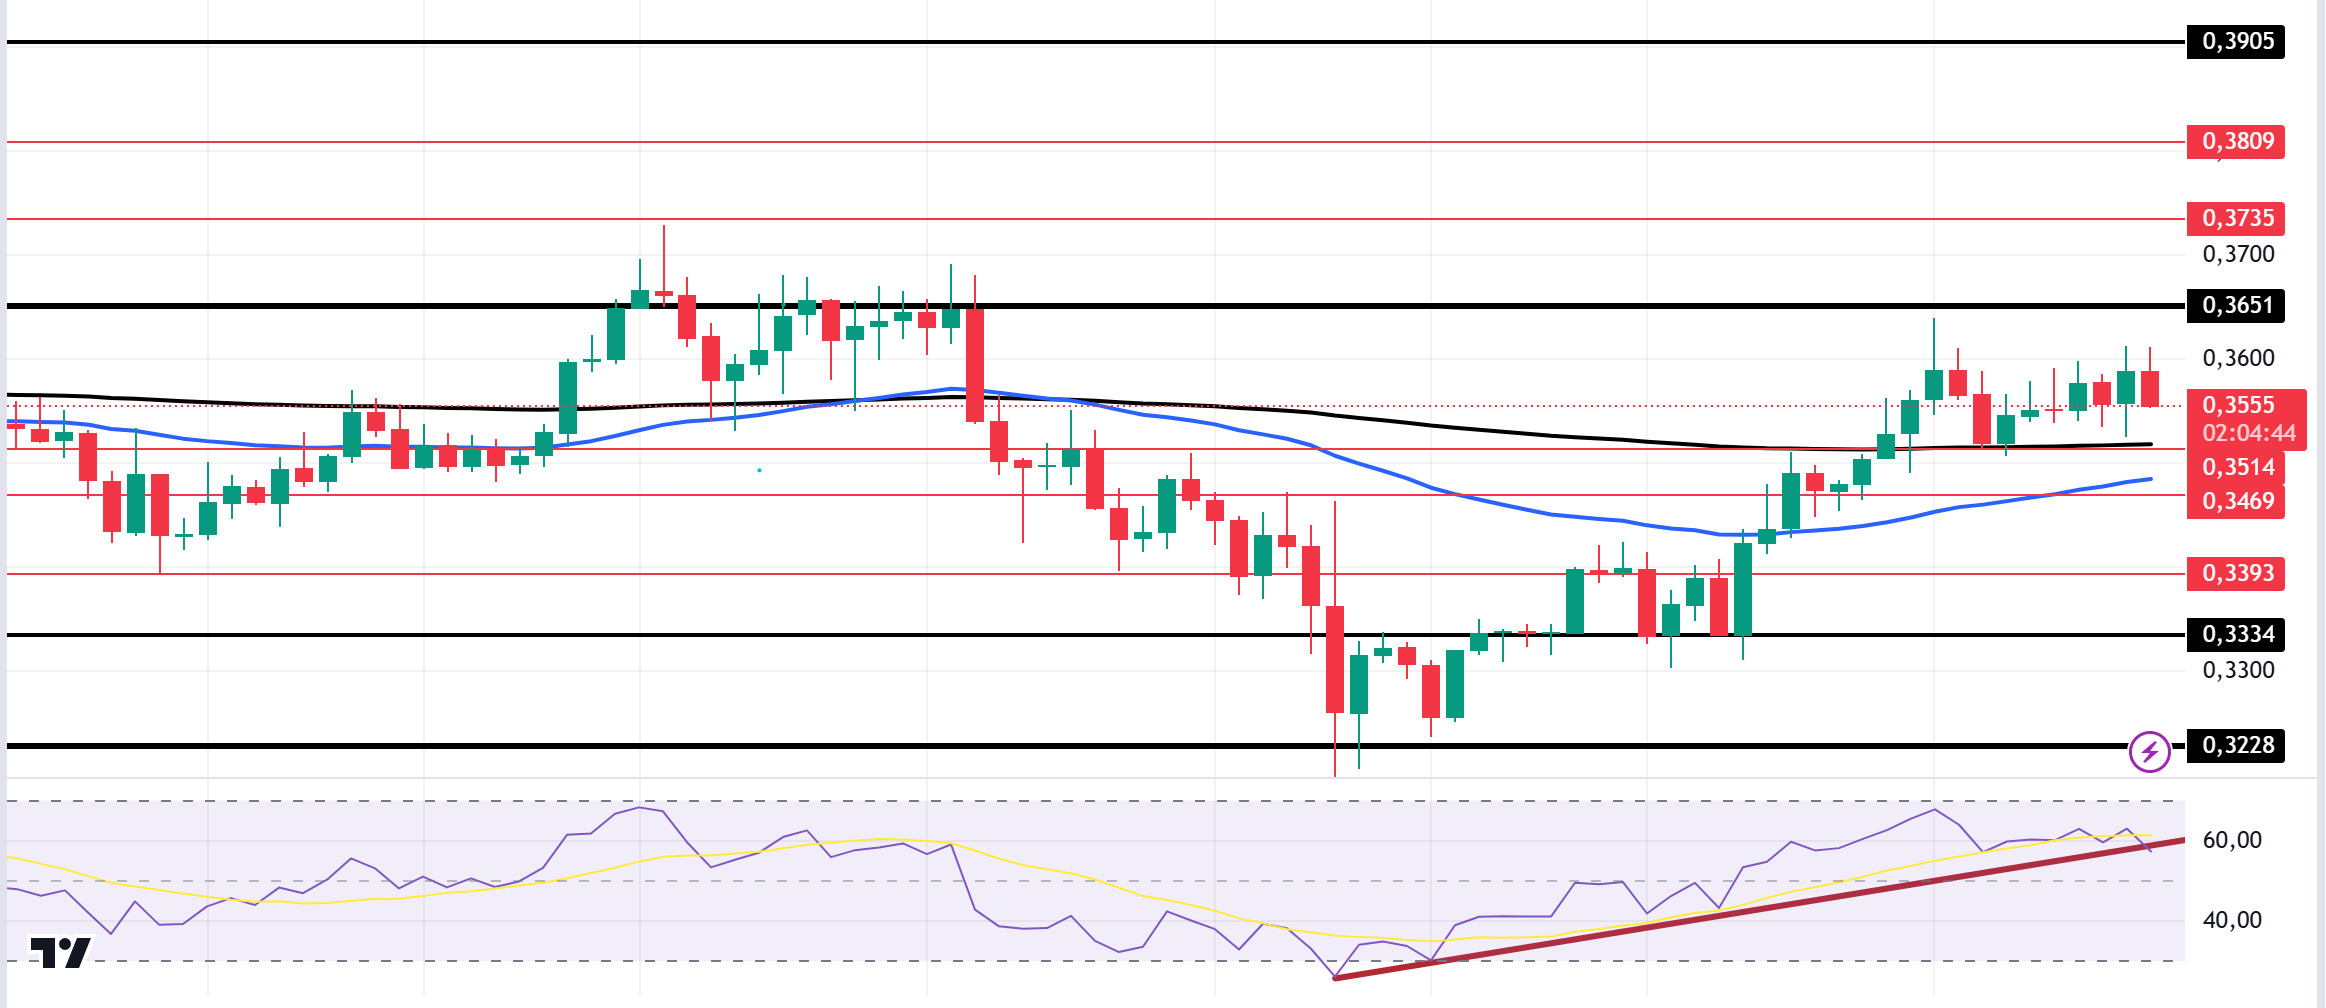
The core PCE price index en the US came en at 0.3% en September compared to the previous month, as expected. In the Cardano ecosystem, the price could indeed go to the moon following speculation involving a potential partnership with ADA, the National Aeronautics and Space Administration (NASA). Official information from Renagh Mooney, Cardano’s director of global communications, suggests that the rumors may have some validity. Mooney writes that en highlights of the two-day Cardano Summit en Dubai, NASA Systems Engineer Matthew Vaerewyck explained how blockchain could be used to “transform space mission design and efficiency por integrating a digital decentralized tracking technology that eliminates intermediaries and reduces costs for multinational companies.” On the 4-hora chart, the price broke the 50 EMA (Blue Line) and the 200 EMA (Black Line) to the upside. However, the 50 EMA remains below the 200 EMA. This shows us that the trend is bearish. At the same time, ADA price is currently stuck en a three-month range after testing resistance twice and support three times. The Relative Strength Index (RSI) remains flat at 14 overbought zones. As a matter of fact, it is forming an uptrend, showing us that moving averages can support the price. However, ADA may test the 0.3651 level once again. In the event of a decline due to the macroeconomic data and the negativity en the ecosystem, the support level of 0.3334 should be followed. It may be appropriate to buy when it comes to this price level. In the rises due to developments en the ecosystem, if the 0.3651 level is broken en volume, the upward acceleration will increase even more and the 0.3905 level should be followed as a retracement place.
Supports 0.3514 – 0.3469 – 0.3393
Resistances 0.3651 – 0.3735 – 0.3809
AVAX/USDT
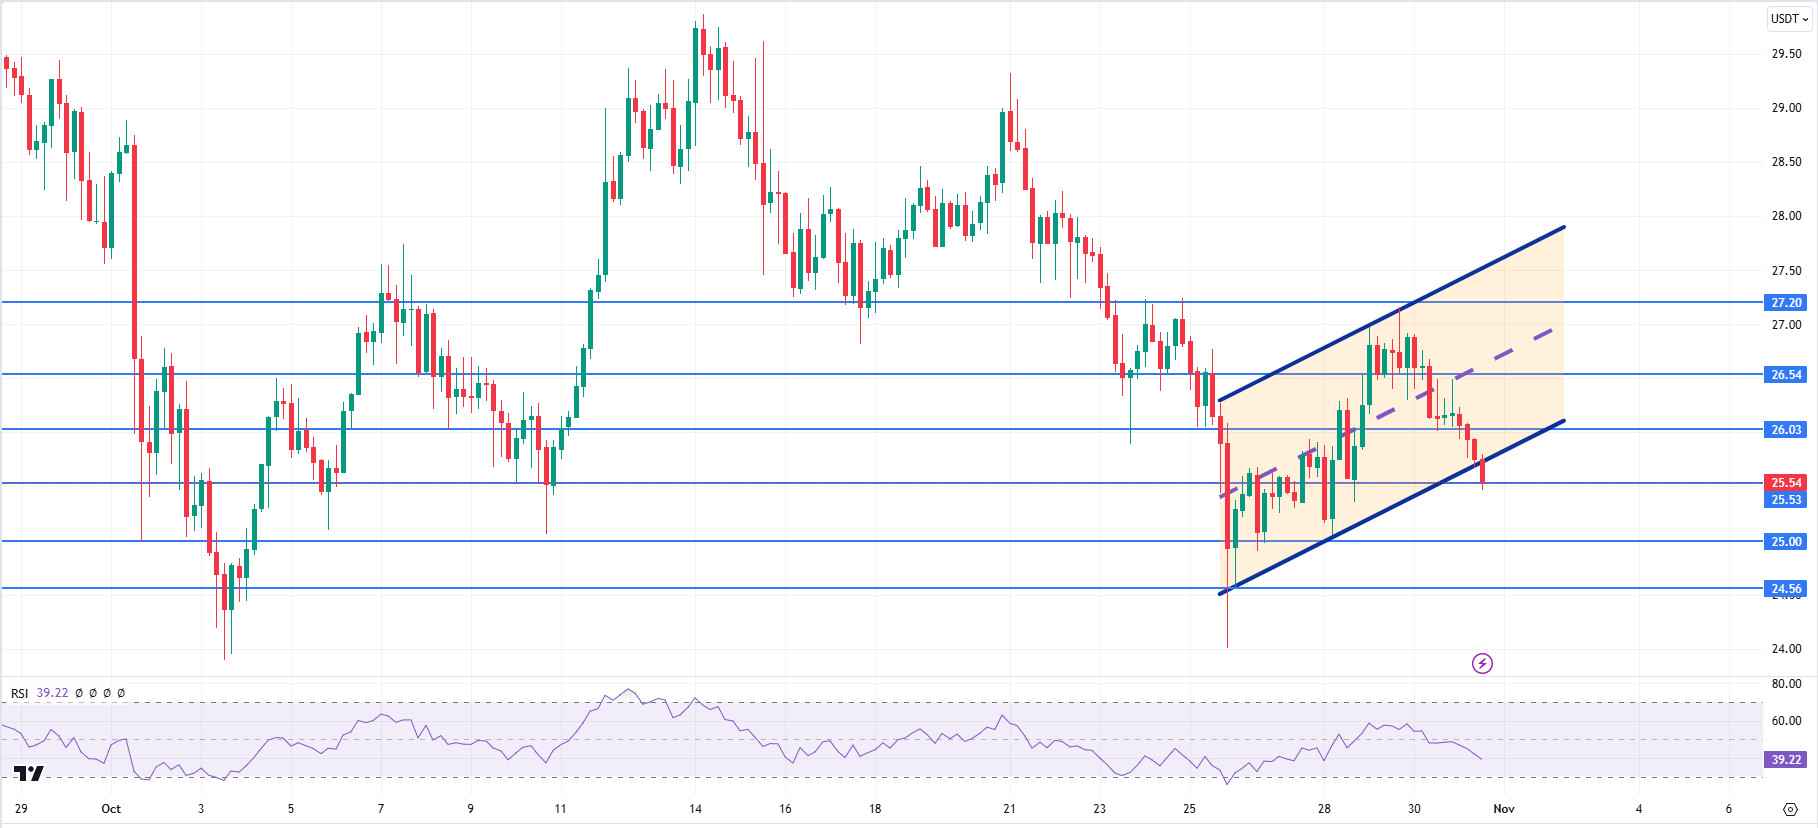
AVAX, which opened today at 26.17, is trading at 25.52, down about 2.5% during the day with the effect of the US stock markets. Today, US core personal consumption expenditures price index and unemployment claims data were announced en line with expectations and did not affect the market much. Noticias flows from the Middle East will be important for the market.
On the 4-hora chart, it moves within the bullish channel. It is en the lower band of the bullish channel and with a Relative Strength Index value of 39, it can be expected to rise slightly from these levels. In such a case, it may test the 26.03 resistance. On the other hand, selling pressure may increase if the declines en the US stock markets deepen or news of increased tension en the Middle East. In such a case, it may test 25.00 support. As long as it stays above 22.80 support during the day, the desire to rise may continue. With the break of 22.80 support, sales may increase.
Supports 25.53 – 25.00 – 24.56
Resistances 26.03 – 26.54 – 27.20
TRX/USDT
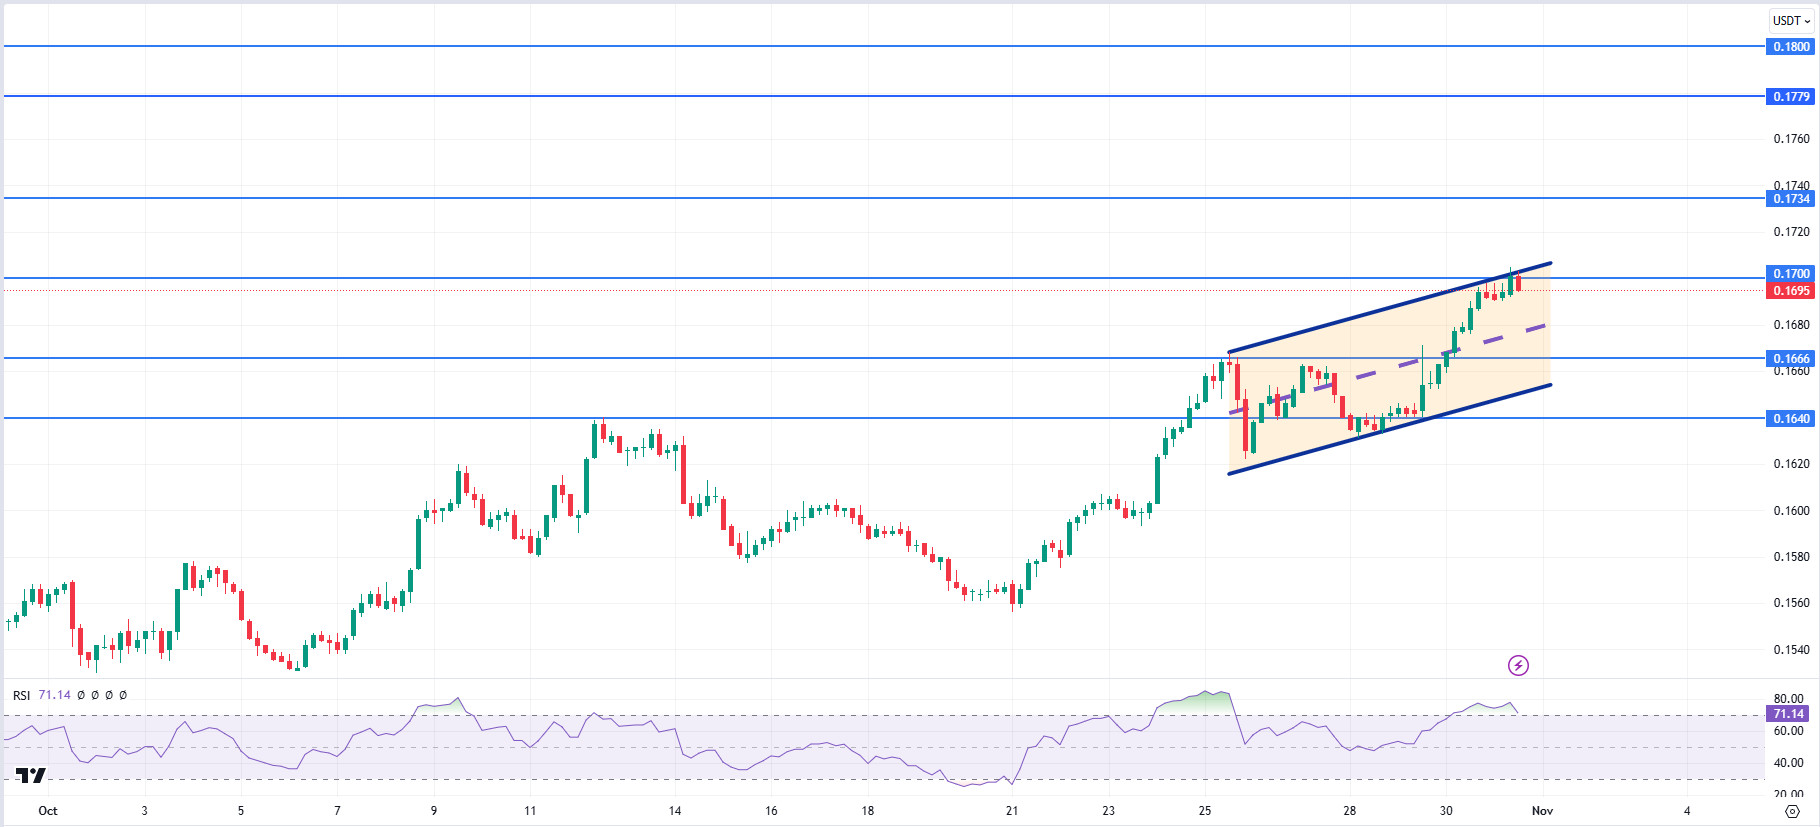
TRX, which started today at 0.1693, is trading at 0.1695, moving horizontally during the day. Today, the US core personal consumption expenditures price index and unemployment benefit applications are the important data followed por the market and these data, which were announced close to expectations, did not have a major impact el the market. The market also closely follows the news flows regarding the tension en the Middle East.
On the 4-hora chart, the bullish channel is en its upper band. The Relative Strength Index value is en the overbought zone with 71 and can be expected to decline slightly from its current level. In such a case, it may move to the middle band of the channel and test the 0.1666 support. However, if it cannot close the candle under 0.1666 support, it may test 0.1734 resistance with the buying reaction that will occur. As long as TRX stays above 0.1482 support, the desire to rise may continue. If this support is broken downwards, sales can be expected to increase.
Supports 0.1700 – 0.1666 – 0.1640
Resistances 0.1734 – 0.1779 – 0.1800
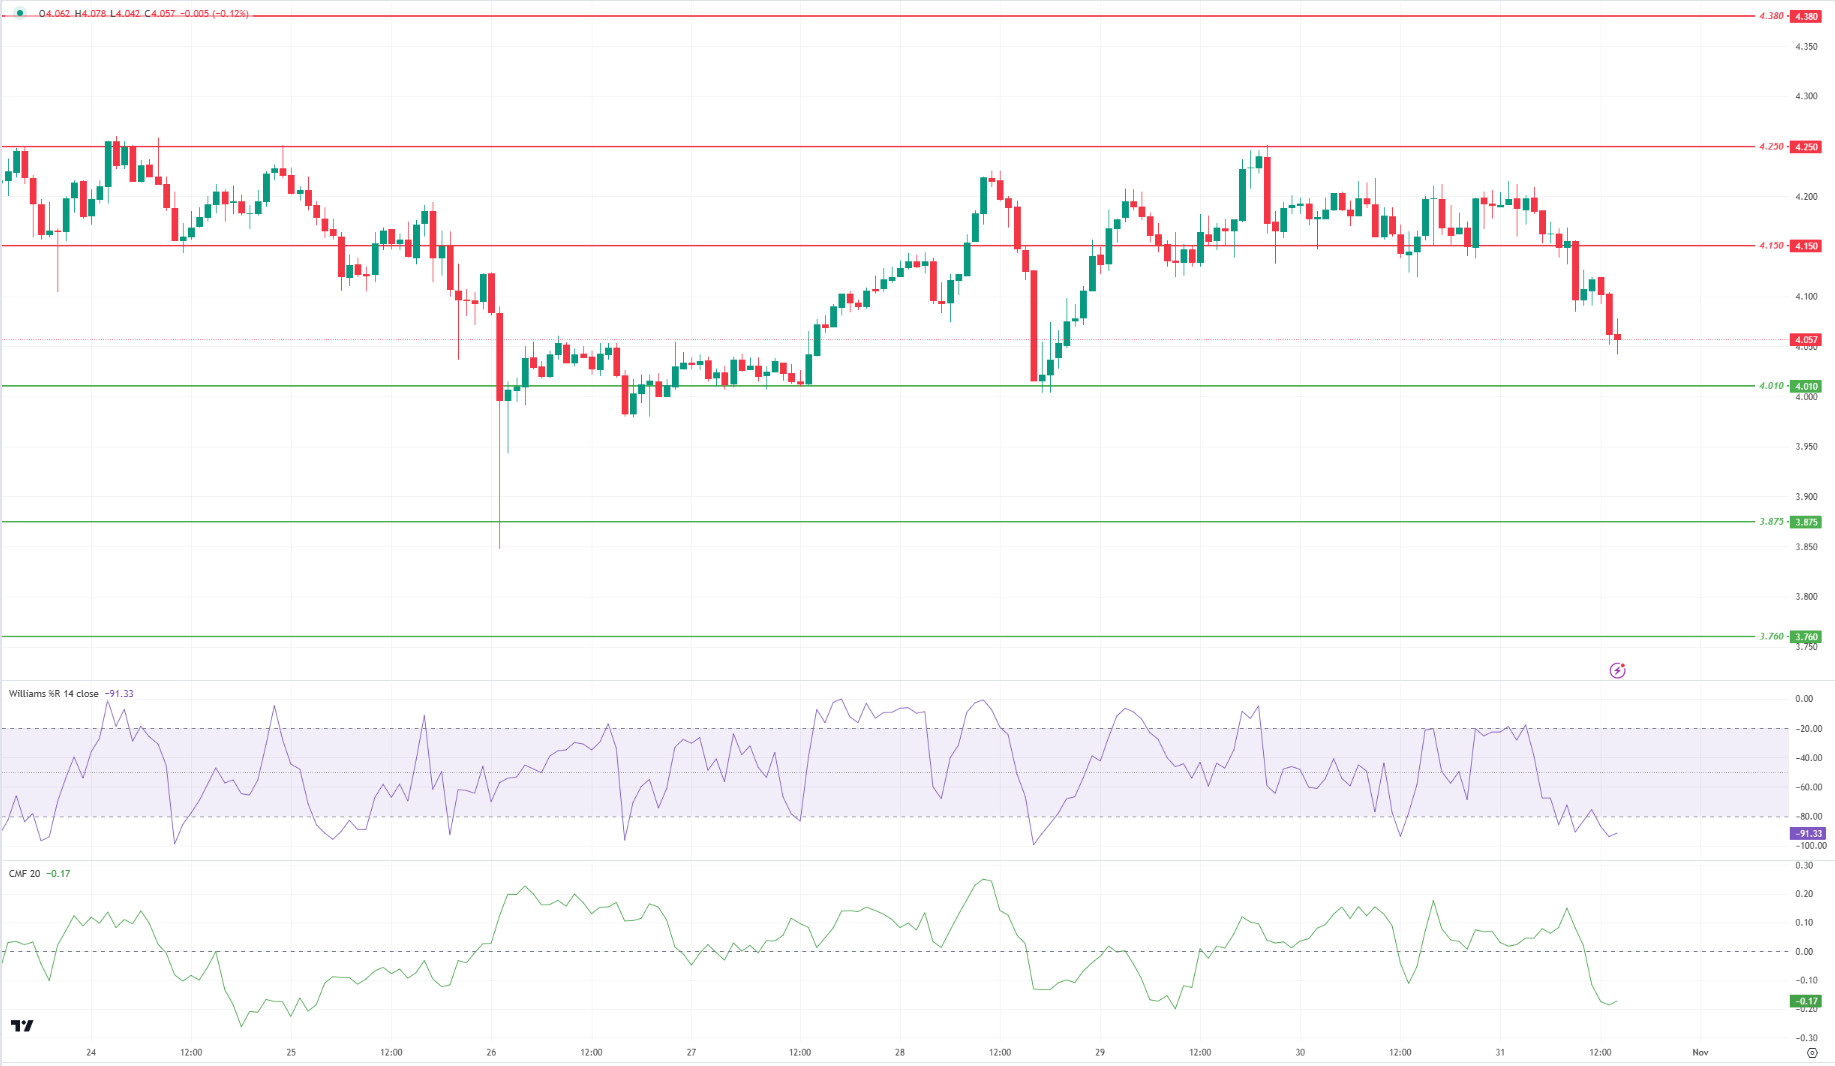
DOT/USDT
When we examine the Polkadot (DOT) chart, the price broke the 4,150 level down with increasing selling pressure. When we examine the Williams %R oscillator, we see that it is below the -80 level. This may mean that the downtrend may continue. When we examine the Chaikin Money Flow (CMF) oscillator, we see that the selling pressure is strong. In this context, the price may decline towards the 4,010 support level. On the other hand, if the buyer pressure increases, the price may want to break the selling pressure at 4.150.
Supports 4.010 – 3.875 – 3.760
Resistances 4.150 – 4.250 – 4.380
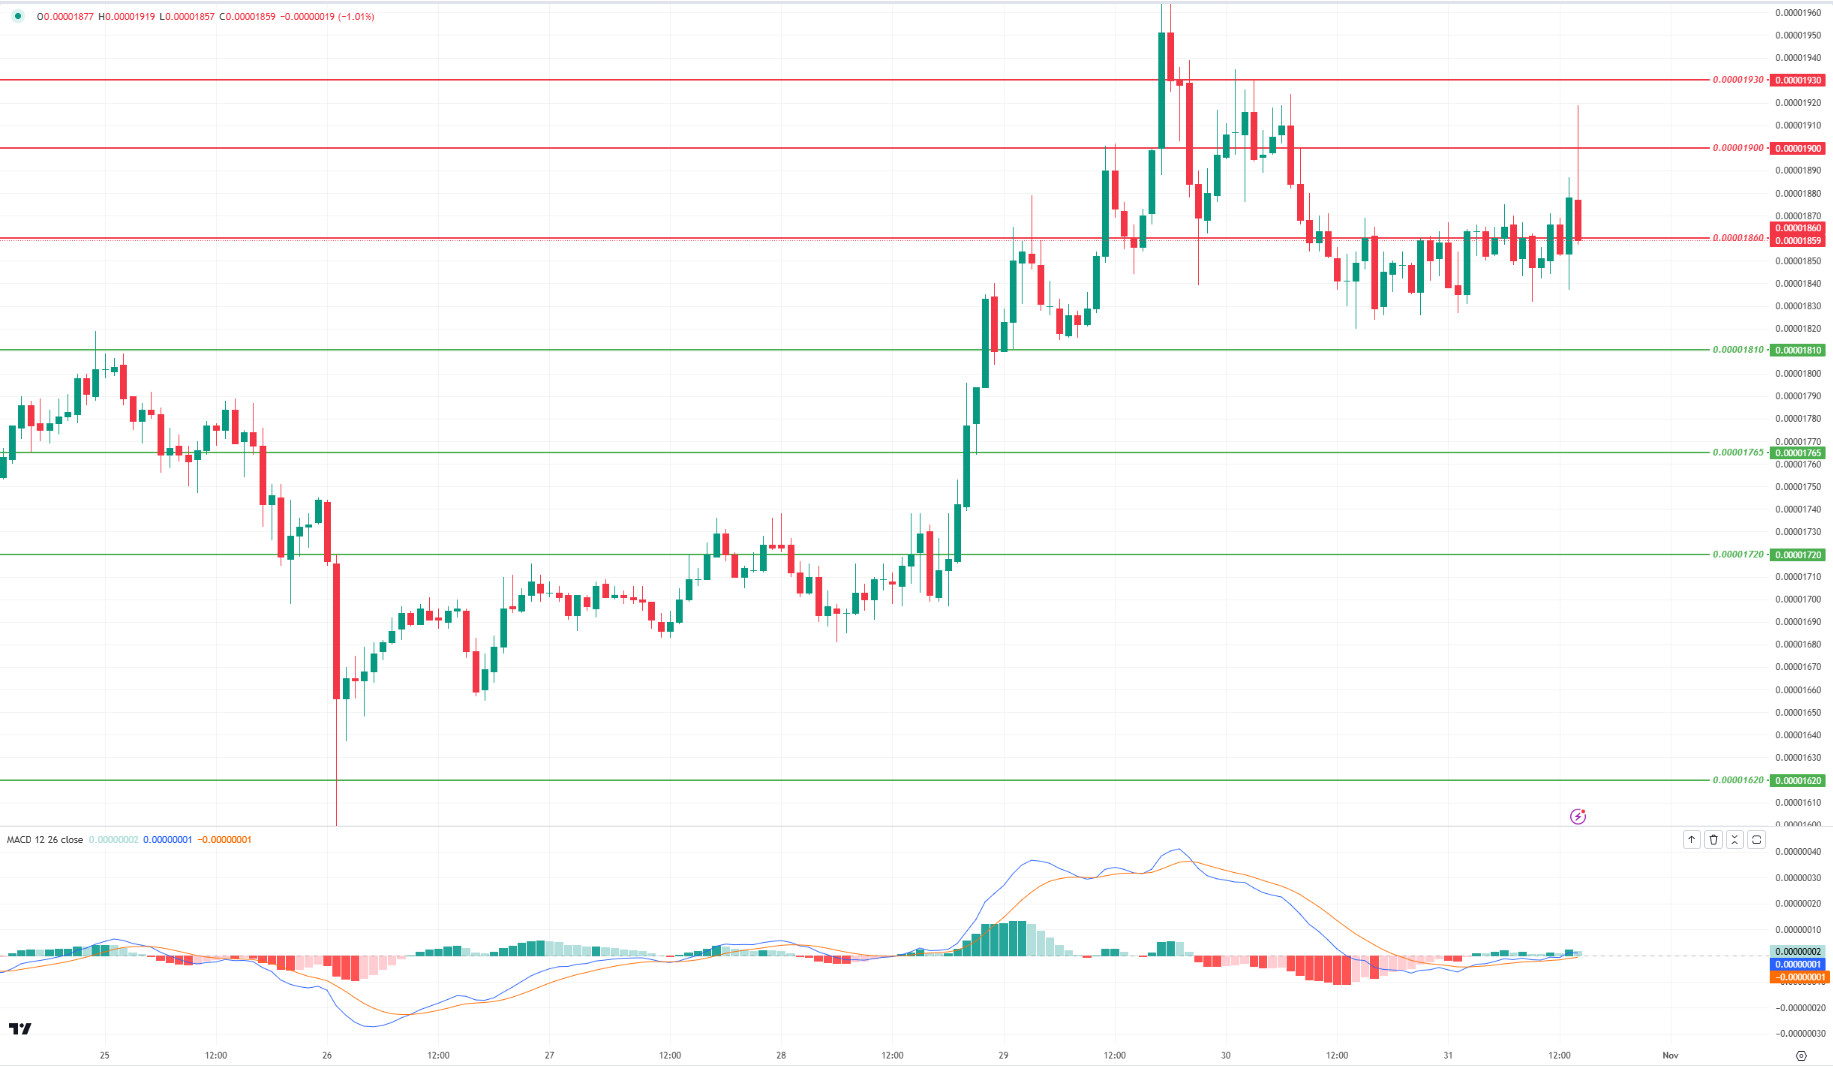
SHIB/USDT
Robinhood noted the history of prominent meme coins such as Shiba Inu (SHIB) and Dogecoin, noting that SHIB ushers en a new era en the meme coin universe with its community-driven nature. This announcement could help promote Shiba Inu to a wider audience and increase SHIB’s popularity. Robinhood’s promotion of SHIB could have a positive impact el the Shiba Inu community and support the token’s strength en the market.
When we examine the SHIB chart, the price stayed above the 0.00001860 level and pinned the 0.00001900 resistance level. When we examine the MACD oscillator, we can say that the buyer pressure continues. In this context, if the price persists above the 0.00001900 level, we may see a movement towards the next resistance level of 0.00001930. On the other hand, if the price fails to break above the 0.00001900 level, it may test the 0.00001860 levels.
Supports 0.00001810 – 0.00001765 – 0.00001720
Resistances 0.00001860 – 0.00001900 – 0.00001930
LEGAL NOTICE
The investment information, comments and recommendations contained herein do not constitute investment advice. Investment advisory services are provided individually por authorized institutions taking into account the risk and return preferences of individuals. The comments and recommendations contained herein are of a general nature. These recommendations may not be suitable for your financial situation and risk and return preferences. Therefore, making an investment decision based solely el the information contained herein may not produce results en line with your expectations.
