RESUMEN DEL MERCADO
Última situación de los criptoactivos
| Activos | Último precio | 24h Cambio | Dominación | Capitalización bursátil |
|---|---|---|---|---|
| BTC | 104,797.47 | -2.40% | 56.67% | 2,07 T |
| ETH | 3,857.46 | -3.75% | 12.70% | 465,12 B |
| XRP | 2.541 | -4.77% | 3.97% | 145,50 B |
| SOLANA | 217.05 | -3.04% | 2.84% | 104,13 B |
| DOGE | 0.3847 | -5.64% | 1.55% | 56,77 B |
| CARDANO | 1.0332 | -6.40% | 0.99% | 36,28 B |
| TRX | 0.2720 | -7.59% | 0.64% | 23,49 B |
| AVAX | 46.30 | -8.59% | 0.52% | 19,07 B |
| ENLACE | 27.07 | -5.22% | 0.46% | 17,00 B |
| SHIB | 0.00002563 | -6.30% | 0.41% | 15,11 B |
| DOT | 8.205 | -7.96% | 0.34% | 12,56 B |
*Preparado el 12.18.2024 a las 14:00 (UTC)
LO QUE QUEDA ATRÁS
MicroStrategy podría suspender las compras de Bitcoin en enero
Se ha sugerido que MicroStrategy podría suspender temporalmente las compras de Bitcoin en enero del próximo año debido a un periodo de control interno de trading . Esto podría causar preocupación entre los inversores a largo plazo que esperan que la empresa compre Bitcoin cada semana.
Las entradas netas en los ETF al contado de Bitcoin y Ethereum alcanzan máximos históricos
Hasta el 17 de diciembre, los ETFs al contado de Bitcoin registraron entradas netas totales de 494 millones de dólares y los ETFs al contado de Ethereum entradas netas de 145 millones de dólares. Los ETF de BlackRock IBIT y ETHA registraron las mayores entradas diarias con 741 millones de dólares y 135 millones de dólares, respectivamente.
LO MÁS DESTACADO DEL DÍA
Datos importantes del calendario económico
| Tiempo | Noticias | Expectativas | Anterior |
|---|---|---|---|
| 19:00 | Proyecciones económicas del FOMC estadounidense | - | - |
| 19:00 | Declaración del FOMC estadounidense | - | - |
| 19:00 | Decisión de la FED estadounidense sobre los tipos de interés | 4.50% | 4.75% |
| 19:30 | Conferencia de prensa del FOMC estadounidense | - | - |
INFORMACIÓN
*El calendario se basa en la zona horaria UTC (Tiempo Universal Coordinado).
El contenido del calendario económico de la página correspondiente se obtiene de proveedores de noticias y datos fiables. Las noticias del contenido del calendario económico, la fecha y hora del anuncio de la noticia, los posibles cambios en las cifras anteriores, las expectativas y las cifras anunciadas son realizadas por las instituciones proveedoras de datos. Darkex no se hace responsable de los posibles cambios que puedan producirse en situaciones similares.
BRÚJULA DE MERCADO
El bitcoin, que ayer renovó su récord durante las transacciones europeas, registró después un retroceso. Hoy hemos visto limitados estos descensos en la sesión europea. Los índices del continente son ligeramente positivos hoy a pesar de la agitación política. Los contratos de futuros estadounidenses están planos a la espera de las decisiones críticas de la Reserva Federal (FED). Es casi seguro que el Banco decidirá recortar los tipos de interés.
Durante el resto de la jornada se seguirán de cerca las decisiones de la FED, que guiarán los precios y determinarán su comportamiento a corto plazo. Pulse aquí para revisar nuestras evaluaciones al respecto.
Desde el corto plazo hasta el panorama general.
La victoria del expresidente Trump el 5 de noviembre, que era uno de los principales pilares de nuestra expectativa alcista para las perspectivas a largo plazo en los activos digitales, produjo un resultado en línea con nuestras predicciones. Posteriormente, los nombramientos realizados por el presidente electo y las expectativas de una mayor regulación del criptoecosistema en EE.UU. siguieron ocupando un lugar en nuestra ecuación como variable positiva. Aunque Powell lanzó mensajes cautelosos en su último discurso, la continuación del ciclo de recortes de tipos de interés de la FED y el volumen en los ETF de BTC que indica un aumento del interés de los inversores institucionales (además de las compras de BTC de MicroStrategy, las opciones de ETF de BTC de BlackRock empezaron a trading...) respaldan por ahora nuestro pronóstico alcista para el panorama general.
A corto plazo, dada la naturaleza del mercado y el comportamiento de los precios, creemos que no sería sorprendente ver pausas o retrocesos ocasionales en los activos digitales. Sin embargo, llegados a este punto, merece la pena subrayar de nuevo que la dinámica fundamental sigue siendo alcista.
ANÁLISIS TÉCNICO
BTC/USDT
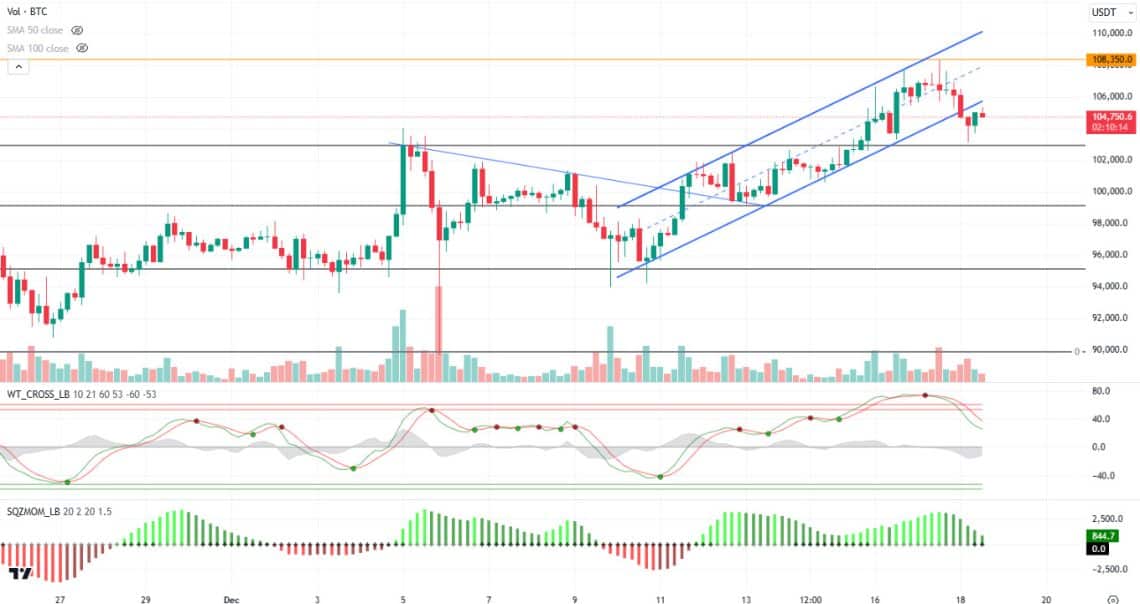
La noticia de que EE.UU. está considerando mantener una reserva estratégica de Bitcoin sigue teniendo un efecto dominó en el mercado. El bitcoin probó nuevos niveles de ATH mientras la senadora estadounidense Cynthia Lummis afirmaba que 2025 será el año del sector de las criptomonedas. "Esta será la administración más favorable a los activos digitales de la historia", dijo Lummis en un post en X.
Si observamos las perspectivas técnicas del BTC antes de la reunión de la FED sobre los tipos de interés con los últimos acontecimientos, el precio, que rompió el canal de tendencia alcista a la baja durante el día, cayó a niveles de 103.200. En estos momentos, el rebote del precio está trading en 104.800. Mientras que nuestro oscilador técnico mantiene su señal de venta, el indicador de impulso muestra una imagen muy débil en la zona positiva. Mientras se vigila el nivel de soporte menor de 103.500 puntos en el retroceso, seguiremos los 102.900 puntos a medida que se profundice el descenso. En la continuación de la subida, se puede apuntar a la línea superior de tendencia, ya que el precio está incluido en el canal de tendencia alcista. Las miradas se volverán hacia la decisión de la FED sobre los tipos de interés esta tarde y después a las declaraciones del presidente Powell. Aunque se da por seguro un recorte de tipos de 25 puntos básicos, el énfasis de Powell en las pausas en los recortes de tipos de interés para 2025 puede destacar como un factor que aumente la volatilidad en el mercado.
Soportes: 103,500 - 102,900 - 101,400
Resistencias 104.500 - 106.600 - 108.350
ETH/USDT
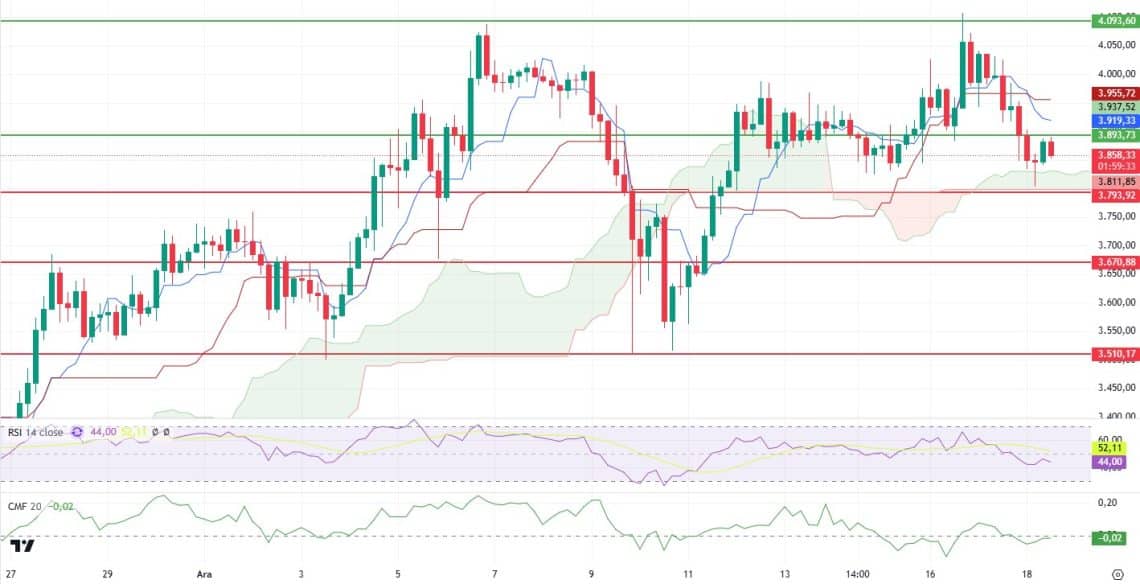
Ethereum consiguió subir hasta el nivel de 3.893 $, tomando la reacción esperada del soporte de la nube Ichimoku durante el día. Sin embargo, la presión vendedora encontrada en este nivel crítico tiró del precio a la baja de nuevo, provocando un retroceso a corto plazo. Durante esta acción del precio, el indicador Chaikin Money Flow (CMF) subió hasta cero, lo que indica un aumento del dinero que entra en el mercado y el inicio de un impulso positivo. El Índice de Fuerza Relativa (RSI), por otro lado, sigue siendo negativo y aún no ha dado señales de un rebote.
Desde una perspectiva técnica, el indicador Ichimoku genera una señal de venta, lo que indica que la tendencia bajista sigue siendo dominante a corto plazo. Para que Ethereum recupere una perspectiva positiva, primero necesita mantenerse por encima del nivel de 3.893 $ y converger hacia el nivel Tenkan-sen. Si no logra mantenerse por encima de este nivel, es probable que ETH se enfrente de nuevo a la presión vendedora y caiga hacia el nivel de 3.793 $.
En concreto, una ruptura del soporte de 3.793 podría profundizar aún más el movimiento bajista, lo que llevaría a probar niveles de soporte más bajos. En tal escenario, sería fundamental que traders vigilaran las zonas de soporte más fuertes. En resumen, a corto plazo, el comportamiento de la cotización de ETH depende de si la resistencia de 3.893 $ puede superarse y mantenerse. En el escenario contrario, parece probable que aumenten los riesgos a la baja y que la búsqueda de nuevos soportes esté a la orden del día.
Soportes 3.793 - 3.670 - 3.510
Resistencias 3.893 - 4.093 - 4.299
XRP/USDT
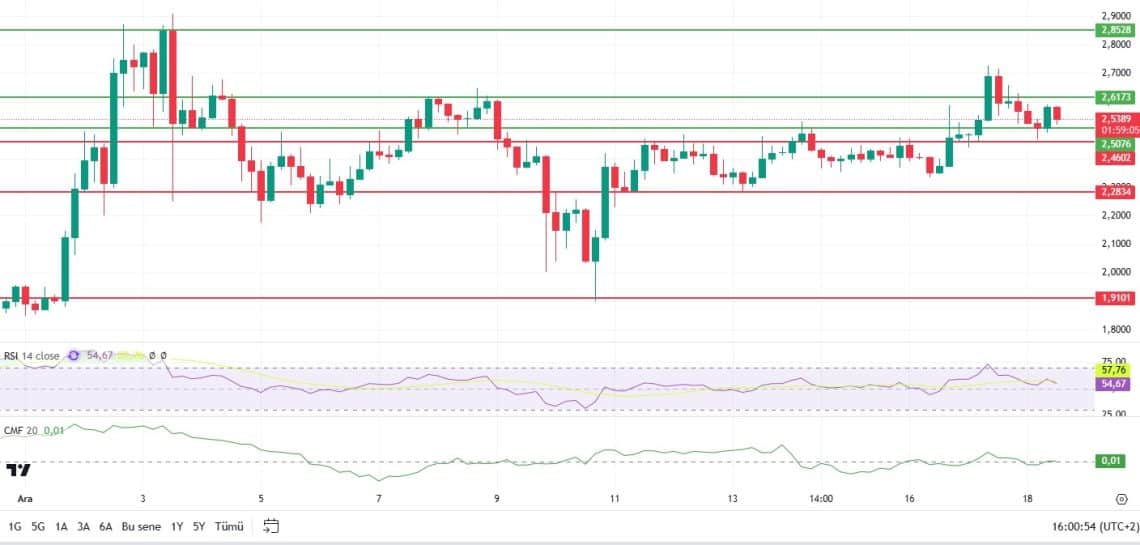
La noticia de que Ripple USD (RLUSD) cotizará en las bolsas mundiales provocó una subida significativa del precio del XRP. Sin embargo, el retroceso del Bitcoin hizo caer la cotización del XRP hasta los 2,46 $. Gracias a las compras desde este nivel, el precio subió por encima de 2,50 $, pero los gráficos de 4 horas indican que el impulso se está debilitando.
Técnicamente, el indicador RSI (Relative Strength Index) continúa su movimiento bajista y aún no señala un rebote. Esto sugiere que la cotización se encuentra en un rango entre neutral y débil. Además, el indicador Chaikin Money Flow (CMF) también se encuentra en territorio negativo, lo que pone de relieve la falta de entradas de efectivo en el mercado. Estas señales negativas sugieren que los compradores están luchando por ganar fuerza en el rango de precios actual.
El nivel de 2,47 dólares es un punto de apoyo crítico para el XRP a corto plazo. Si se mantiene este nivel, es más probable que el precio ponga a prueba el nivel de resistencia de 2,61 $. En particular, una ruptura del nivel de 2,55 $ podría llevar al precio a niveles más altos, lo que permitiría a los compradores ganar fuerza. Sin embargo, si se pierde el soporte de 2,47 $, cabe esperar que el precio caiga hasta 2,43 $ con una mayor presión vendedora. Los cierres por debajo de este nivel podrían hacer bajar el precio hasta la banda de 2,40 $.
En consecuencia, el comportamiento a corto plazo del XRP depende en gran medida del mantenimiento del soporte de 2,47 dólares. Las noticias positivas y la dinámica del mercado pueden mover el precio al alza, mientras que un impulso débil y la pérdida del nivel de soporte pueden hacer que el precio retroceda aún más.
Soportes 2,4710 - 2,2741- 1,1484
Resistencias 2,5076 - 2,6567 - 2,8456
SOL/USDT
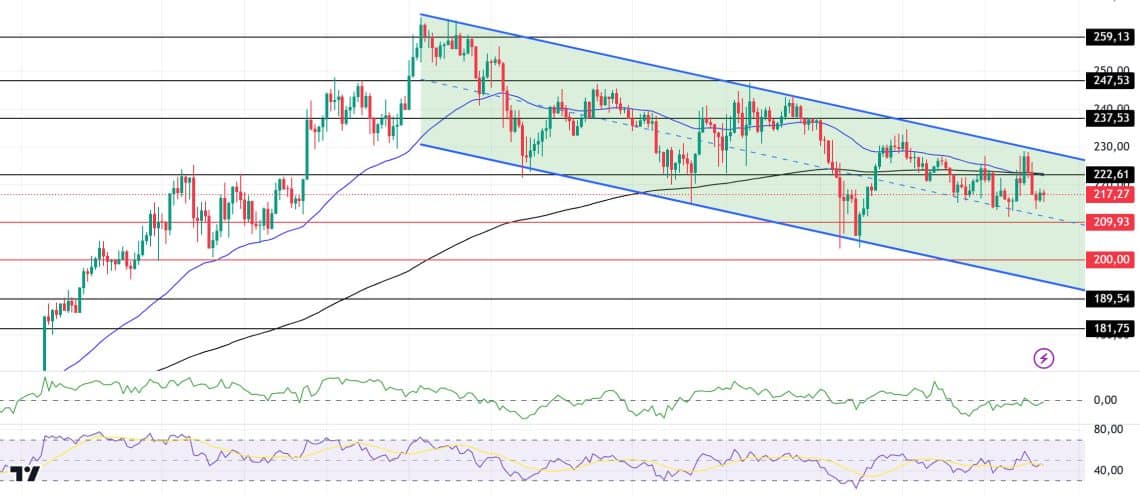
En los avances del ecosistema, Bitwise ha lanzado un ETP de staking de Solana (BSOL) en Europa. Este nuevo producto está diseñado para solucionar la anterior falta de recompensas por staking del ETP Solana de Bitwise, ESOL. BSOL ofrece una tasa de recompensa por estaca del 6,48%.
SOL se ha vuelto bajista, siguiendo el ritmo de caída del mercado. Al mismo tiempo, el volumen de trading ha aumentado casi un 39% con respecto a las últimas 24 horas. El activo, que se encuentra en medio de una amplia tendencia bajista, se está moviendo hacia la parte inferior de la tendencia a medida que disminuye el volumen. En el marco temporal de 4 horas, la EMA de 50 (línea azul) coincidió con la EMA de 200 (línea negra). ¿Acabará esto con la tendencia alcista en este activo? Esto dependerá de la dirección general del mercado y de cómo actúen los inversores y los traders en el futuro, pero las métricas no apuntan a una dirección definitiva por el momento. Aunque existe un impulso bajista desde el nivel de resistencia, el activo sigue cotizando dentro de la tendencia bajista. Si analizamos el indicador Chaikin Money Flow (CMF)20 , el aumento de las salidas de dinero incrementa la presión vendedora. Sin embargo, el Índice de Fuerza Relativa (RSI)14 está pasando de la zona neutral a la zona de sobreventa. El nivel de 237,53 se perfila como un punto de resistencia muy fuerte en las subidas impulsadas tanto por los próximos datos macroeconómicos como por las noticias en el ecosistema de Solana. Si se rompe aquí, la subida puede continuar. En caso de retrocesos por motivos contrarios o debido a ventas de beneficios, los niveles de soporte de 189,54 y 181,75 pueden volver a activarse. Si el precio alcanza estos niveles de soporte, puede surgir una posible oportunidad alcista si aumenta el impulso.
Soportes 209,93 - 200,00 - 189,54
Resistencias 222,61 - 237,53 - 247,53
DOGE/USDT
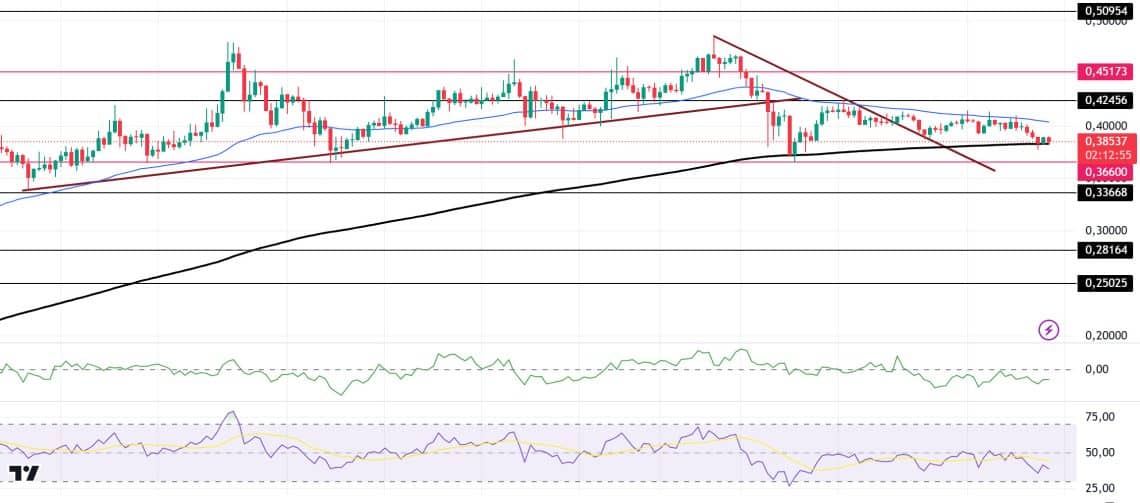
El BTC, que lleva en tendencia bajista desde el 8 de diciembre, se movió horizontalmente cambiando la tendencia bajista debido a las subidas habituales en el mercado, pero no pudo evitar que rompiera a la baja el nivel de 0,42456. Actualmente, el precio está probando la EMA de 200 (línea negra) como soporte. En el marco temporal de 4 horas, la 50 EMA (Línea Azul) está por encima de la 200 EMA (Línea Negra). Sin embargo, si examinamos el indicador Chaikin Money Flow (CMF)20, se observan salidas de dinero que están suprimiendo la cotización. El nivel de 0,50954 destaca como un punto de resistencia muy fuerte en las subidas impulsadas tanto por los próximos datos macroeconómicos como por las novedades en la moneda Doge. Si DOGE mantiene su impulso y supera este nivel, la subida puede continuar con fuerza. En caso de posibles retrocesos debidos a razones macroeconómicas o negatividades en el ecosistema, el nivel de soporte de 0,33668 es un nivel de soporte importante. Si el precio alcanza estos niveles de soporte, puede surgir una posible oportunidad alcista si aumenta el impulso.
Soporta 0,36600 - 0,33668 - 0,28164
Resistencias 0,42456 - 0,45173 - 0,50954
AVISO LEGAL
La información sobre inversiones, los comentarios y las recomendaciones aquí contenidos no constituyen asesoramiento en materia de inversiones. Los servicios de asesoramiento en materia de inversión son prestados individualmente por instituciones autorizadas teniendo en cuenta las preferencias de riesgo y rentabilidad de los particulares. Los comentarios y recomendaciones aquí contenidos son de carácter general. Estas recomendaciones pueden no ser adecuadas para su situación financiera y sus preferencias de riesgo y rentabilidad. Por lo tanto, tomar una decisión de inversión basándose únicamente en la información aquí contenida puede no producir resultados acordes con sus expectativas.