RESUMEN DEL MERCADO
Última situación en activos criptográficos| Activos | Último Precio | Cambio en 24h | Dominancia | Capitalización de mercado. |
|---|---|---|---|---|
| BTC | 95,660.94 | -1.71% | 55.51% | 1,89 T |
| ETH | 3,619.59 | -2.40% | 12.80% | 435,93 B |
| XRP | 2.438 | 27.45% | 4.08% | 138,87 B |
| SOLANA | 225.16 | -5.61% | 3.14% | 107,73 B |
| DOGE | 0.4191 | -1.30% | 1.81% | 61,58 B |
| CARDANO | 1.0999 | 3.04% | 1.13% | 38,54 B |
| AVAX | 48.37 | 8.76% | 0.58% | 19,76 B |
| TRX | 0.2084 | -0.12% | 0.53% | 17,98 B |
| SHIB | 0.00002925 | -8.85% | 0.50% | 17,19 B |
| DOT | 8.824 | -3.16% | 0.39% | 13,43 B |
| LINK | 21.13 | 13.32% | 0.39% | 13,25 B |
¿QUÉ QUEDA ATRÁS?
Marathon Holdings compra otros 6484 BTCLa empresa minera de Bitcoin de EE. UU., Marathon Holdings, compró 6484 BTC entre el 1 de octubre y el 30 de noviembre. La compañía pagó un total de 618.3 millones de dólares por estos Bitcoins. También anunció 700 millones de dólares en financiamiento privado a través de bonos convertibles. Si se completan las ventas de bonos, se ejercerá una opción de compra adicional de 105 millones de dólares y se comprará más Bitcoin con estos fondos.WisdomTree presenta una solicitud para un ETF de XRP al contadoWisdomTree ha presentado una solicitud oficial de ETF spot de XRP ante la Comisión de Bolsa y Valores de EE. UU. (SEC). Si la solicitud es aprobada, el fondo comenzará a cotizar en la bolsa Cboe BZX. El banco BNY Mellon será responsable de la custodia y las transferencias de los tokens XRP.El volumen de comercio de criptomonedas al contado alcanzó los $2.7 billones en noviembre.El volumen de operaciones al contado del mercado de criptomonedas alcanzó los $2.7 billones en noviembre, el nivel más alto desde mayo de 2021. Gran parte de este aumento, que fue más del doble del volumen de operaciones en octubre, provino de Binance. Binance procesó más de $986 mil millones en transacciones en noviembre. Crypto.com, Upbit y Bybit continuaron creciendo con más de $200 mil millones en volumen de operaciones.Microstrategy compra otros 15,400 BTC por 1.5 mil millones de dólares.Microstrategy gastó casi $1.5 mil millones para aumentar sus tenencias de 15,400 BTC. A aproximadamente $95,976 por Bitcoin, la compra resultó en un retorno total trimestral del 38.7% y un retorno total anualizado del 63.3%. A partir del 2 de diciembre de 2024, Microstrategy posee 402,100 BTC, con un valor aproximado de $23.4 mil millones.DESTACADOS DEL DÍA
Datos Importantes del Calendario Económico| Tiempo | Noticias | Expectativa | Anterior |
|---|---|---|---|
| 14:45 | PMI Manufacturero Final de EE. UU. (Nov) | 48.8 | 48.8 |
| 15:00 | US ISM Manufacturing PMI (Nov) | 47.7 | 46.5 |
| 20:15 | Miembro del FOMC de EE. UU. Waller habla | - | - |
| 21:30 | Miembro del FOMC de EE. UU. Williams Habla | - | - |
MARKET COMPASS
While the political instability in Europe centered on France and Trump's threats to increase tariffs on BRICS countries weakened risk appetite, markets are also wondering what the US Federal Reserve's (FED) interest rate decision will be in the last month of the year. In this regard, macro indicators that will shape expectations and be published on the health of the world's largest economy will be monitored throughout the week. Today, both the indicators and the statements of FED officials will be on the radar of the markets. We anticipate that the recent pressure on digital assets will ease somewhat during the US session, but the agenda and future data and statements will be decisive for the short-term direction. From the short term to the big picture. The victory of former President Trump on November 5, which was one of the main pillars of our bullish expectation for the long-term outlook in digital assets, produced a result in line with our forecasts. In the aftermath, the president-elect's appointments to Congress and the increased regulatory expectations for the crypto ecosystem in the US remained in our equation as a positive variable. Although Powell gave cautious messages in his last speech, the fact that the FED continued its interest rate cut cycle and the volume in BTC ETFs indicates an increase in institutional investor interest (in addition, MicroStrategy's BTC purchases, Microsoft's start to evaluate the purchase issue, BlackRock's BTC ETF options start trading ...) supports our upward forecast for the big picture for now. For the short term, given the nature of the market and pricing behavior, we think it would not be surprising to see occasional respite or pullbacks in digital assets. However, at this point, it would be useful to underline again that the fundamental dynamics continue to be bullish.TECHNICAL ANALYSIS
BTC/USDT
MicroStrategy continues its Bitcoin purchases unabated. According to the information shared during the day, the company announced that it purchased 15,400 BTC with a total value of $1.5 billion at an average price of $95,976. With these latest purchases, the total amount of Bitcoin owned by MicroStrategy reached 402,100, with a current value of approximately $23.4 billion. When we look at the BTC technical outlook after the latest development, the price, which tested the 100-day SMA line once again during the day, received a reaction from this level. Currently trading at 95,700, BTC is pushing the 50-day SMA level again. With global markets starting the week positively, the opening of US indices in parallel to the US indices may turn the direction up again in BTC. However, with technical oscillators giving a sell signal on hourly charts, the momentum indicator turning negative emphasizes the critical importance of the 95,000 level. While pricing above this level is perceived positively, closures below it may increase selling pressure. Supports 95,000 - 92,500 - 90,000 Resistances 99,655 - 100,000 - 105,000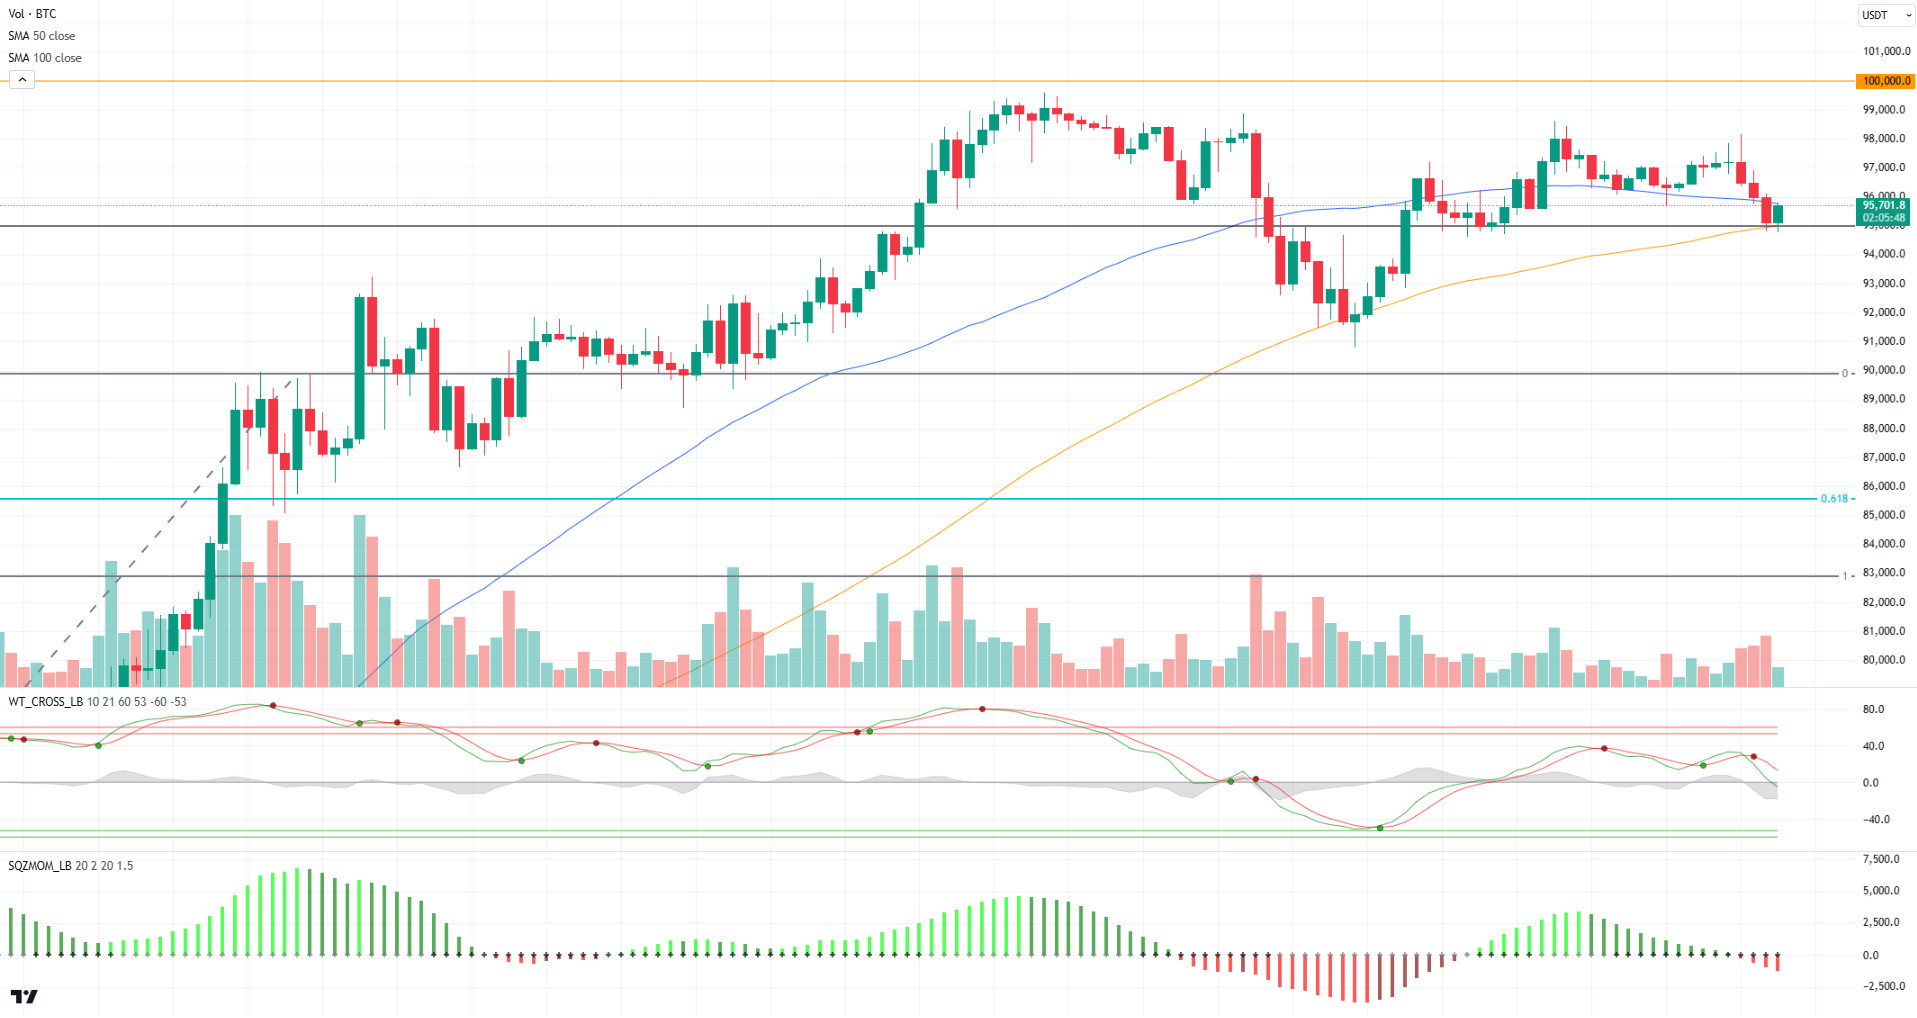
ETH/USDT
ETH could not hold at the level of 3,644 with the decline in BTC in the morning hours and fell to the intermediate support of 3,570 and managed to rise above the 3,600 level again. With this price action, we see that the Relative Strength Index (RSI), which was in a downward trend with this price action, reacted and regained the 48 level. Chaikin Money Flow (CMF), on the other hand, has recovered after falling below the zero zone and has risen to the positive area. Regaining the kijun level of 3,644 during the day can be seen as a healthy correction. In this scenario, the price may retest the 3,744 level. The 3,534 level, on the other hand, remains the main support, and if the price falls below this level, the decline may deepen and pullbacks to 3,459 levels may occur. Supports 3,534 - 3,459 - 3,393 Resistances 3,644- 3,744 - 3,839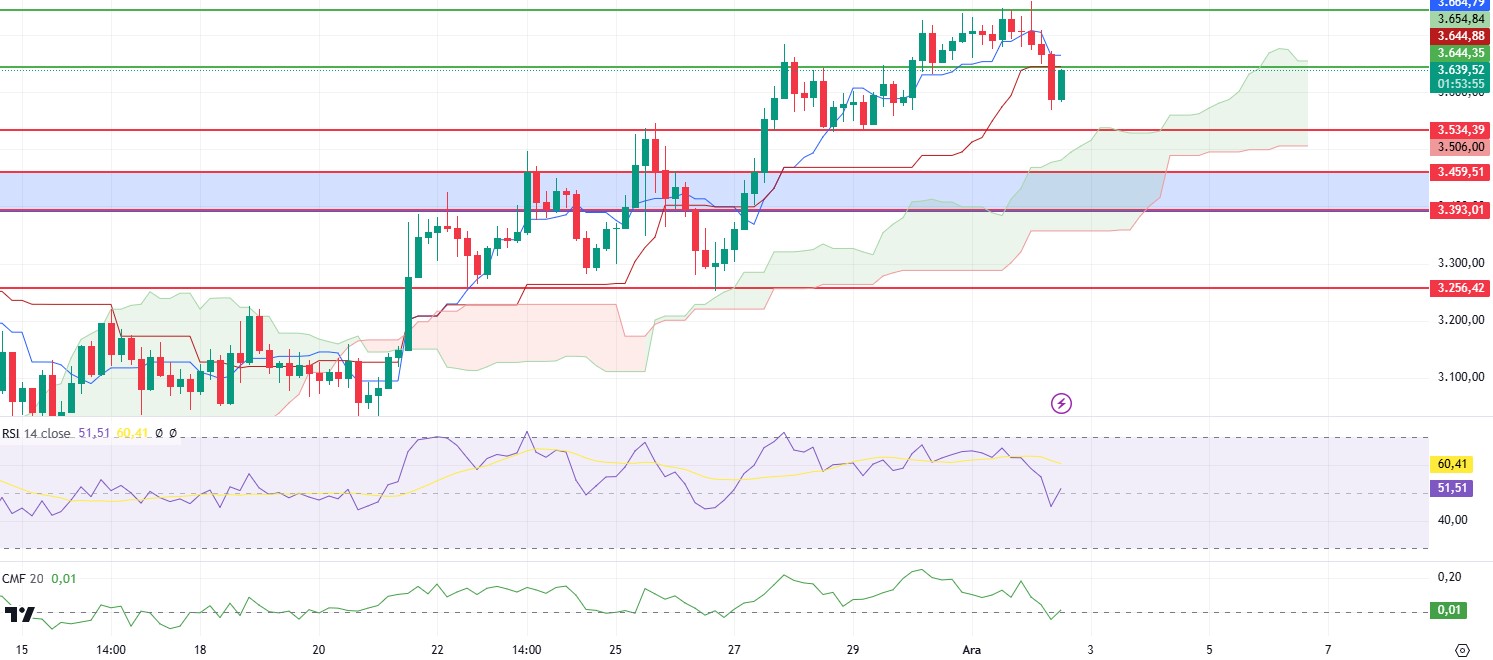
XRP/USDT
XRP corrected to 2.2 levels in the morning hours after its recent rise, but quickly reacted and rose above the 2.4 region again. With this move, the Commodity Channel Index (CCI) and Money Flow Index (MFI) divergences were eliminated and the areas needed to create higher peaks were opened. Chaikin Money Flow (CMF) has turned upwards again. However, the fact that the Relative Strength Index (RSI) is still in overbought territory and the price is close to the 2.5 psychological resistance may be signals that traders should be careful Supports 1.9101 - 1.6309 - 1.2870 Resistances 2.500 - 3.105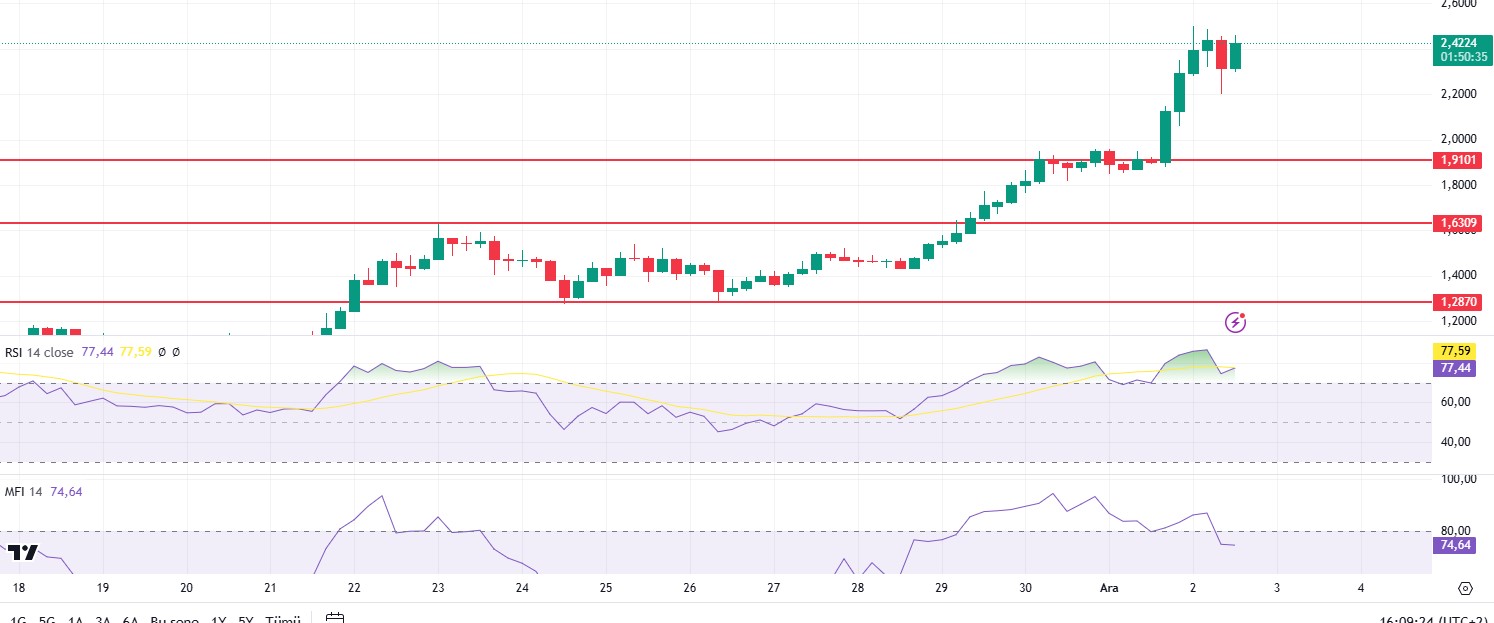
SOL/USDT
On the 4-hour timeframe, the 50 EMA (Blue Line) is above the 200 EMA (Black Line). Since November 22, SOL, which has been in a downtrend since November 22, broke the downtrend last week and moved upwards. However, this did not last long and it rejoined the downtrend. However, when we examine the Chaikin Money Flow (CMF)20 indicator, we see that there is a great decrease in money inflows. At the same time, Relative Strength Index (RSI)14 is in the oversold zone. This can be shown as a bullish signal. Another potential directional indicator on the chart is the head and shoulders pattern. If this pattern works, a decline to 189.54 may occur. On the other hand, the price tends to get support from the 200 EMA. The 247.53 level is a very strong resistance point in the uptrend driven by both macroeconomic conditions and innovations in the Solana ecosystem. If it breaks here, the rise may continue. In case of retracements due to possible macroeconomic reasons or profit sales, the support levels of 209.93 and 189.54 can be triggered again. If the price reaches these support levels, a potential bullish opportunity may arise if momentum increases. Supports 222.61 - 209.93 - 200.00 Resistances 237.53 - 247.53 - 259.13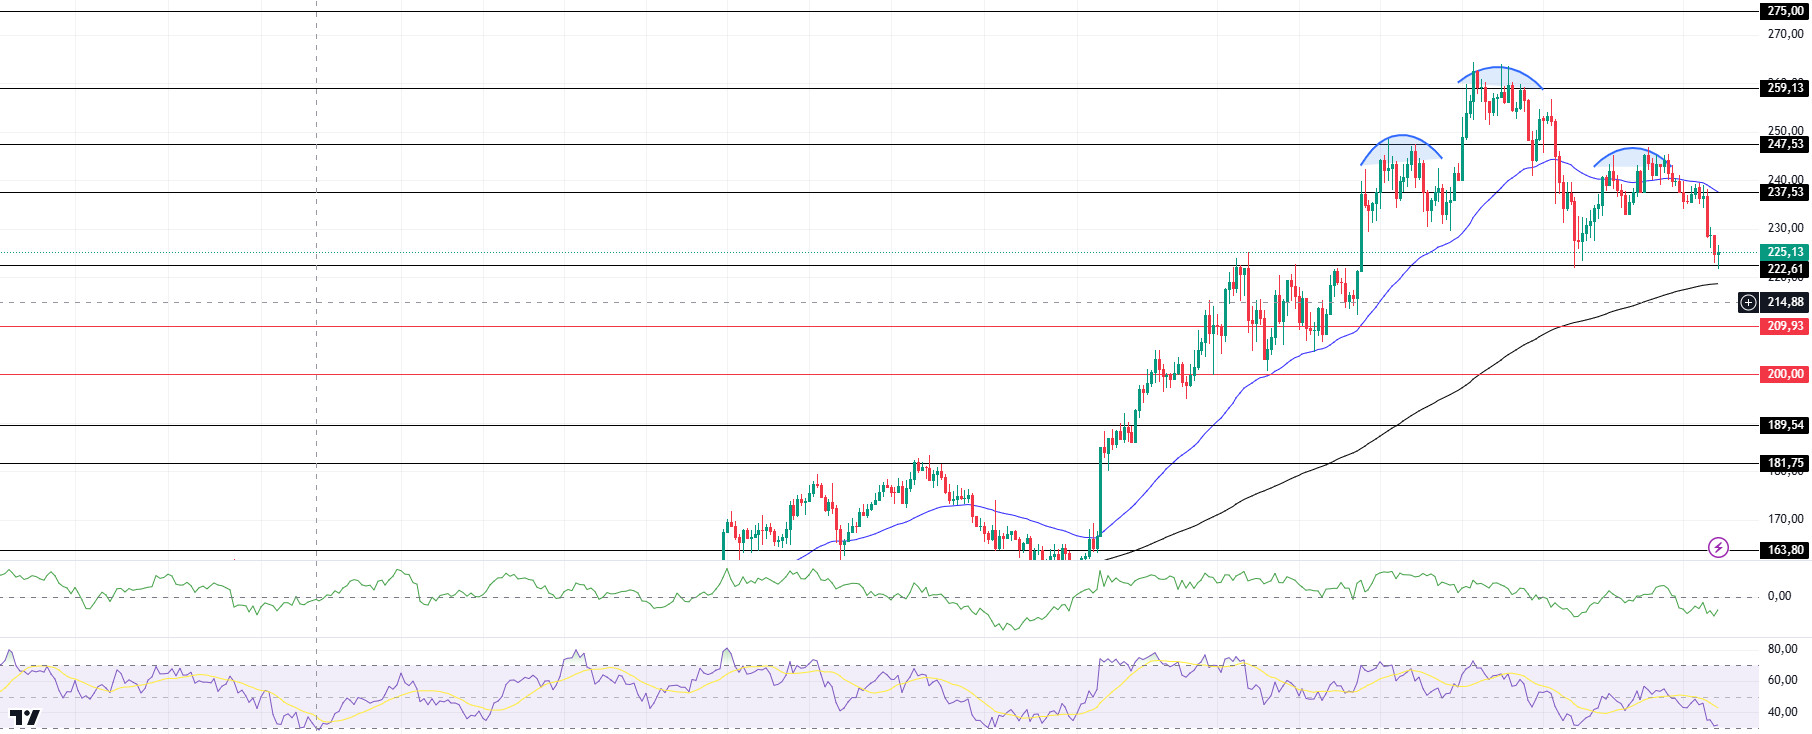
DOGE/USDT
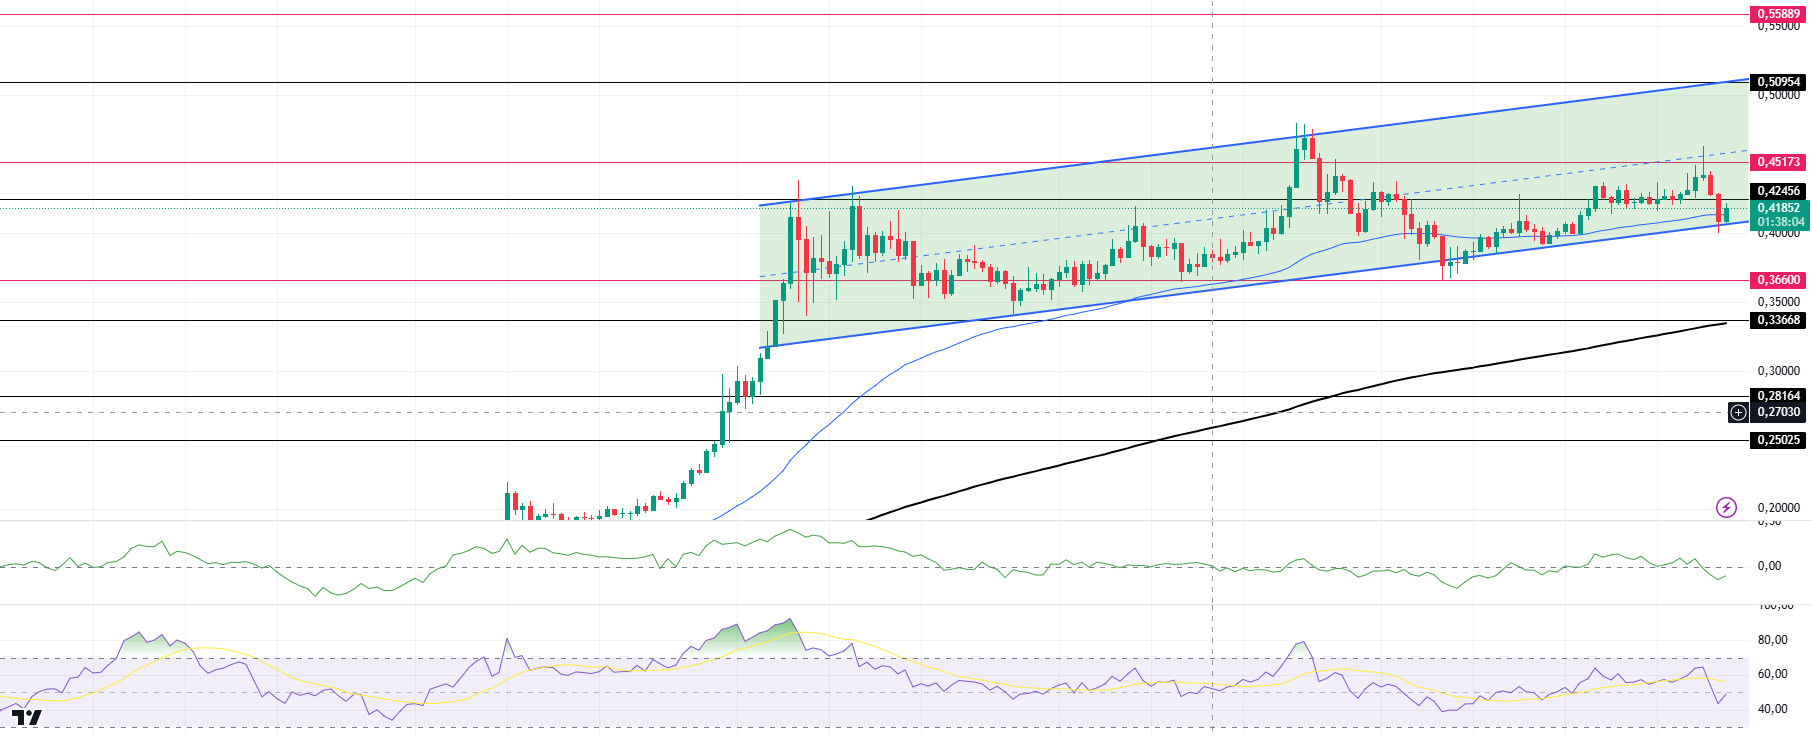
Robinhood transfirió 70 millones de Dogecoins a un intercambio centralizado, lo que generó controversia en el mercado. Bernie Sanders llamó la atención de los inversores al apoyar la iniciativa D.O.G.E de Elon Musk. El precio de Dogecoin cayó un 3% tras la transferencia de Robinhood. Al observar el gráfico, el activo, que ha estado en una tendencia alcista desde el 11 de noviembre, ha comenzado a subir con el apoyo del nivel base de la tendencia. Si la aceleración ascendente es fuerte, el nivel 0.50954 podría ser activado. En el marco de tiempo de 4 horas, la EMA de 50 (Línea Azul) está por encima de la EMA de 200 (Línea Negra). Pero la brecha entre las dos medias aún es demasiado amplia. Esto podría causar retrocesos. Por otro lado, al observar el indicador RSI 14, está a punto de salir de la zona de sobrecompra hacia el nivel neutral. Sin embargo, al examinar el indicador Chaikin Money Flow (CMF)20, vemos que hay salidas de dinero. El nivel 0.50954 parece ser un punto de resistencia muy fuerte en los aumentos impulsados tanto por condiciones macroeconómicas como por innovaciones en Dogecoin. Si DOGE mantiene su impulso y supera este nivel, el aumento podría continuar con fuerza. En caso de retrocesos debido a posibles razones macroeconómicas o ventas de ganancias, el nivel de soporte 0.36600 puede ser activado nuevamente. Si el precio alcanza estos niveles de soporte, podría surgir una oportunidad alcista potencial si el impulso aumenta.Soportes0.36600 - 0.33668 - 0.28164Resistencias0.42456 - 0.45173 - 0.50954