RESUMEN DEL MERCADO
Última situación de los criptoactivos
*Prepared on 12.6.2024 at 14:00 (UTC)
LO QUE QUEDA ATRÁS
Non-farm payrolls and unemployment data in the US
Non-farm employment in the US increased by 227 thousand people in Noviembre, exceeding expectations. The unemployment rate rose from 4.1 percent to 4.2 percent. In the markets, the probability of the US Federal Reserve (Fed) to cut interest rates increased from 67 percent to 85 percent.
Bitcoin will surpass gold in 10 years: Bernstein analysis
While Bitcoin’s surpassing the $100,000 mark had a great repercussion in the financial world, analysts at Bernstein made an ambitious prediction and stated that the largest cryptocurrency will surpass gold as a store of value within 10 years. Analysts called Bitcoin “the store of value of the new era”.
LO MÁS DESTACADO DEL DÍA
Datos importantes del calendario económico
Time News Expectation Previous
15:00 US Michigan Consumer Sentiment (Dec) 73.3 71.8
15:30 US FOMC Member Goolsbee Speaks
17:00 US FOMC Member Hammack Speaks
18:00 US FOMC Member Daly Speaks
INFORMACIÓN
*El calendario se basa en el huso horario UTC (Tiempo Universal Coordinado).
El contenido del calendario económico de la página correspondiente se obtiene de proveedores de noticias y datos fiables. Las noticias del contenido del calendario económico, la fecha y hora del anuncio de la noticia, los posibles cambios en las cifras anteriores, las expectativas y las cifras anunciadas son realizadas por las instituciones proveedoras de datos. Darkex no se hace responsable de los posibles cambios que puedan surgir de situaciones similares.
BRÚJULA DE MERCADO
Global markets turned their eyes to the labor market statistics from the US. According to the data announced, Non-Farm Employment Change (NFP) came in at 227 thousand in Noviembre, above the expectations of 220-218 thousand. Octubre data was revised from 12 thousand to 36 thousand. We can evaluate these data as “not too far from expectations”. The unemployment rate came in at 4.2%, above the expectation of 4.1%. If we take average hourly earnings into account, it seems that the figures in general do not prevent the US Federal Reserve (FED) from another rate cut. The first effect after the release of the data set was the depreciation in the dollar.
Bitcoin, which had a relatively calmer session during European transactions after yesterday’s sharp price changes, rose with the increased risk appetite after the relevant data, which is thought to increase the likelihood of a rate cut by the FED. We think that it will not be easy for digital assets to maintain this mood for the rest of the day. For this, the statements of the Federal Open Market Committee (FOMC) officials later in the day may be decisive as they enter the “quiet period” ahead of the meeting to be held on Diciembre 17-18. We would also like to remind investors to watch out for increases in volatility.
Desde el corto plazo hasta el panorama general.
The victory of former President Trump on Noviembre 5, which was one of the main pillars of our bullish expectation for the long-term outlook in digital assets, produced a result in line with our forecasts. In the aftermath, the president-elect’s appointments to Congress and the increased regulatory expectations for the crypto ecosystem in the US remained in our equation as a positive variable. Although Powell gave cautious messages in his last speech, the fact that the FED continued its interest rate cut cycle and the volume in BTC ETFs indicates an increase in institutional investor interest (addition, MicroStrategy’s BTC purchases, Microsoft’s start to evaluate the purchase issue, BlackRock’s BTC ETF options start trading…) supports our upward forecast for the big picture for now.
In the short term, given the nature of the market and pricing behavior, we think it would not be surprising to see occasional respite or pullbacks in digital assets. However, at this point, it would be useful to underline again that the fundamental dynamics continue to be bullish.
ANÁLISIS TÉCNICO
BTC/USDT
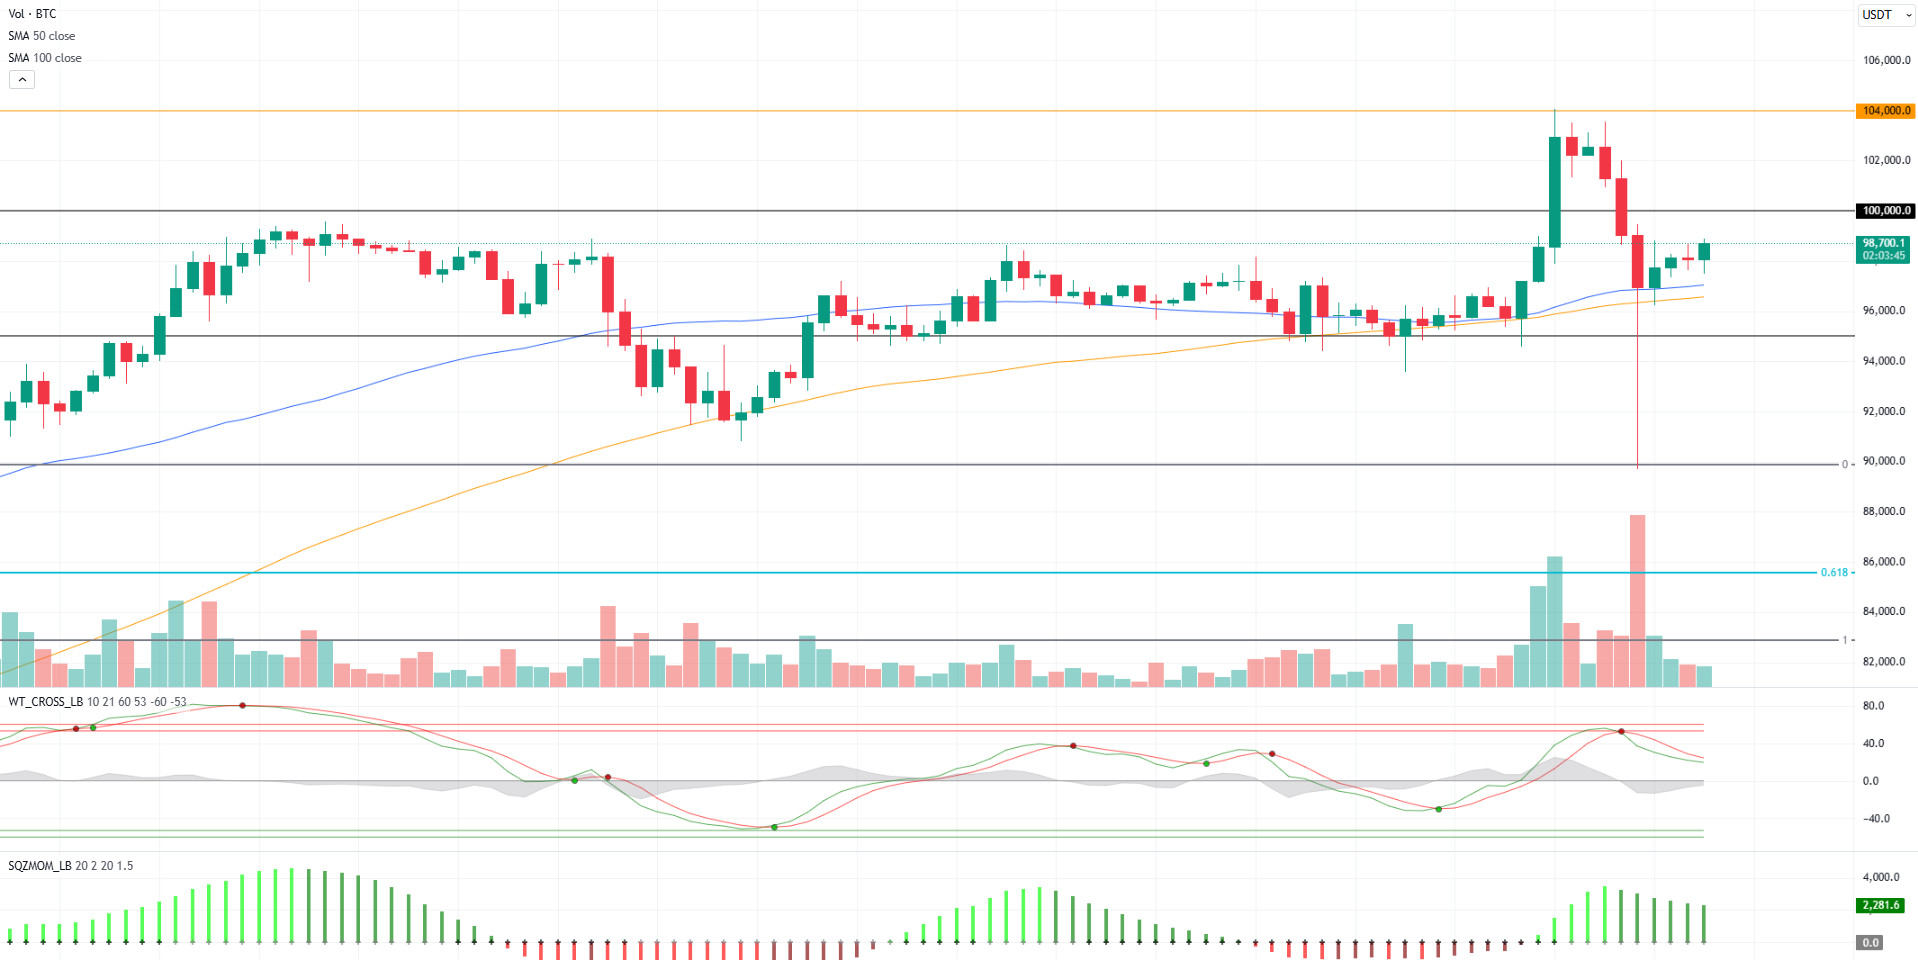
Eyes were on macroeconomic data in the US today. Non-farm employment (227K) and Unemployment data (4.2%), which were announced close to expectations, did not change the expectations in the market. When we look at the CME Group data after the announced data, it is seen that the expectation for a 25 basis point interest rate cut is 89%. Changing market dynamics after D.Trump may continue to overshadow the data.
When we look at the BTC technical outlook after macroeconomic data, the price, which faced selling pressure at 100,000 levels, did not persist at these levels and fell back to the 95,000 and 100,000 band. BTC, which was at 97,700 before the data, is currently trading at 98,700. In the event of a pullback following the impact of the news, the 50- and 100-day SMA levels continue to serve as support, while in the continuation of the rise, exceeding the 100,000 levels again may support the price upwards. Technical oscillators continue to signal a sell signal on the hourly charts, while the momentum indicator continues to show weakness.
Supports 95,000 – 92,500 – 90,000
Resistances 100,000 – 104,000 – 105,000
ETH/USDT
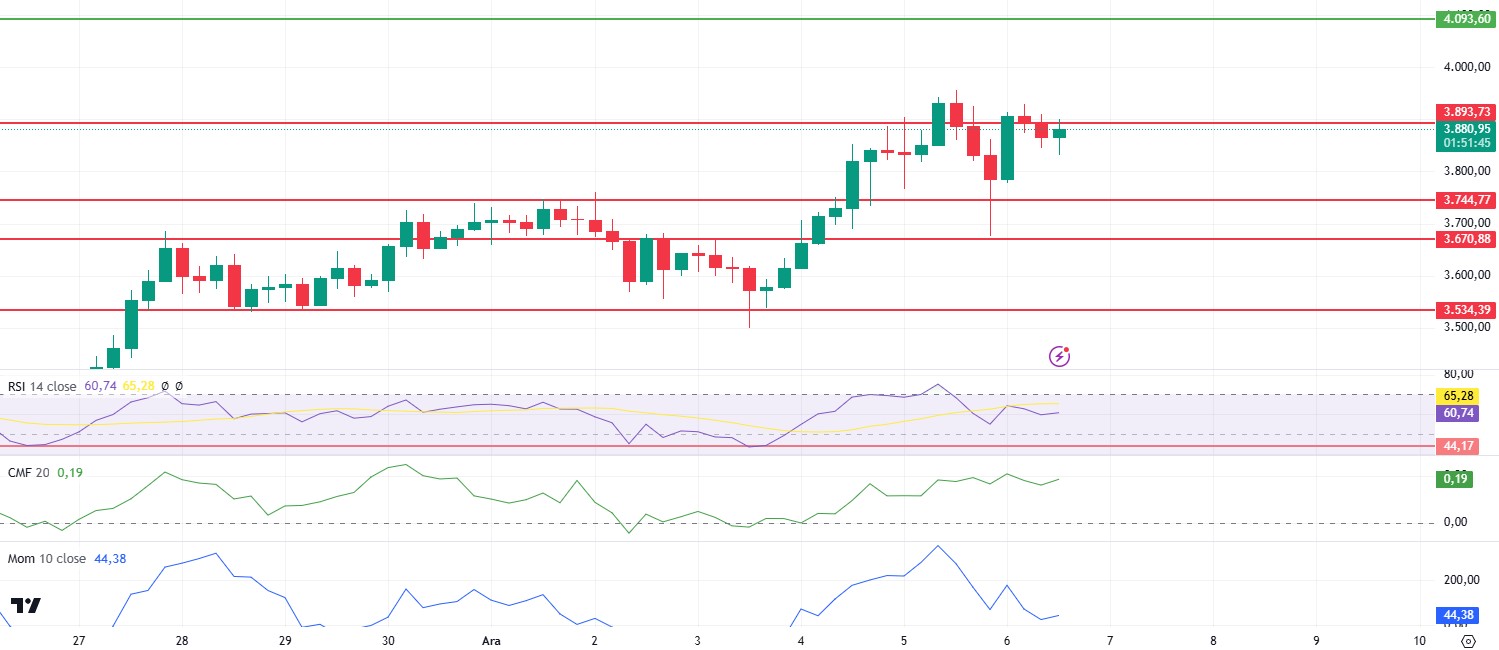
ETH is trying to gain the 3.893 zone with fluctuating price movements during the day after yesterday’s decline. During this price activity, positive structures are seen in Relative Strength Index (RSI) and Chaikin Money Flow (CMF). In Cumulative Volume Delta (CVD), the weighted rise of the spot side can be counted as one of the factors that strengthen the positive picture. In ETH ETFs, it is clearly seen that investor interest has started to shift to the ETH side. With the turn signal in momentum, exceeding the 3,893 level may bring increases up to 4,093. In possible declines, it can be said that the price may receive a strong reaction from the intermediate support level of 3,744.
Supports 3,893 – 3,744 – 3,670
Resistances 4,093 – 4,299 – 4,474
XRP/USDT
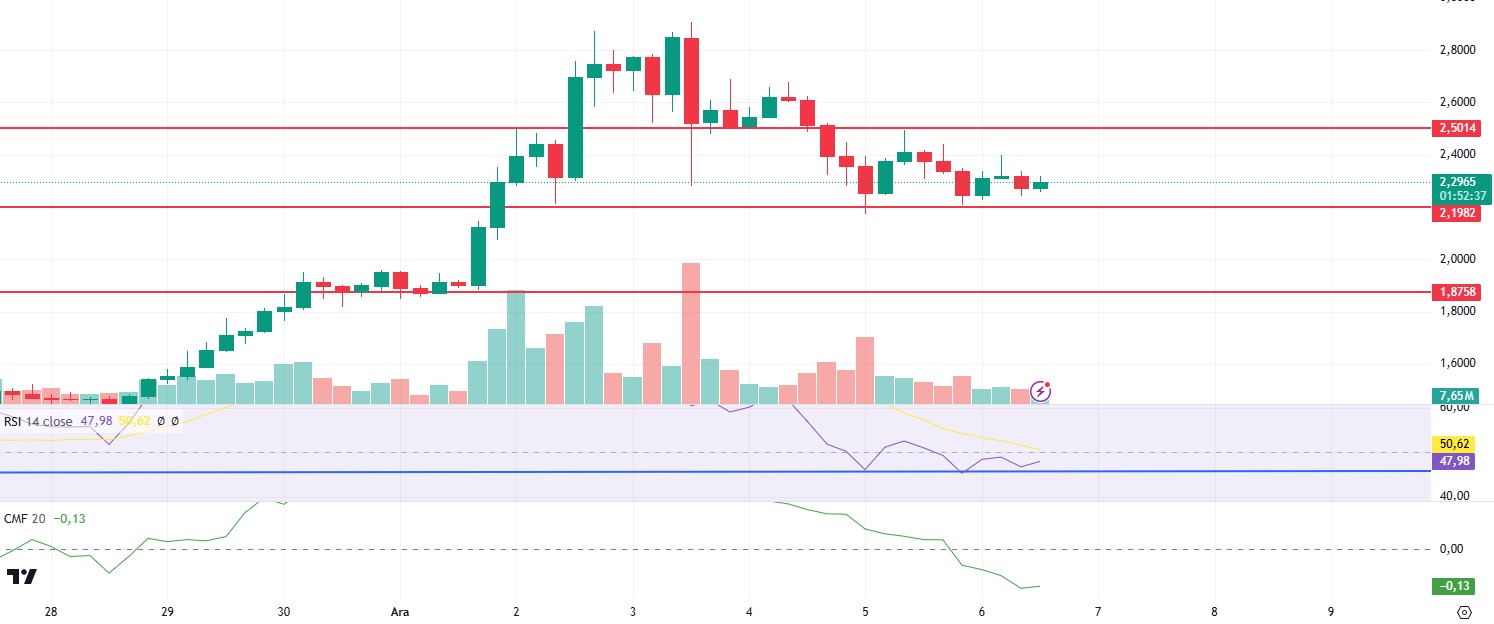
XRP continues to accumulate between 2.5 – 2.19 levels, and the outlook mentioned in the morning analysis continues. Positive divergence stands out on Chaikin Money Flow (CMF), which is heading up under the zero line. Relative Strength Index (RSI) also continues its positive outlook by reacting from the important support point. The 2.19 level remains the critical support level for XRP, where rises up to 2.5 are usual. Closures below this zone may cause deep declines.
Supports 2.1982 – 1.8758- 1.2333
Resistances 2.5014 – 2.6971 – 3.105
SOL/USDT
Today, non-farm payrolls in the US rose above expectations. This was a result that created a positive impact for the dollar. The unemployment rate was 4.2%, in line with expectations. Average hourly earnings increased by 0.4% on a monthly basis. All these data reflected positively on cryptocurrencies.
In the Solana ecosystem, the US SEC reportedly denied 19b-4 applications for two of the five Solana ETF applications. The financial regulator’s consensus announced that President Joe Biden has decided that no more ETF applications will be approved under their administration. Solana’s daily volume rose to $13 billion for the first time since Noviembre 22, indicating increased interaction with cryptocurrency.
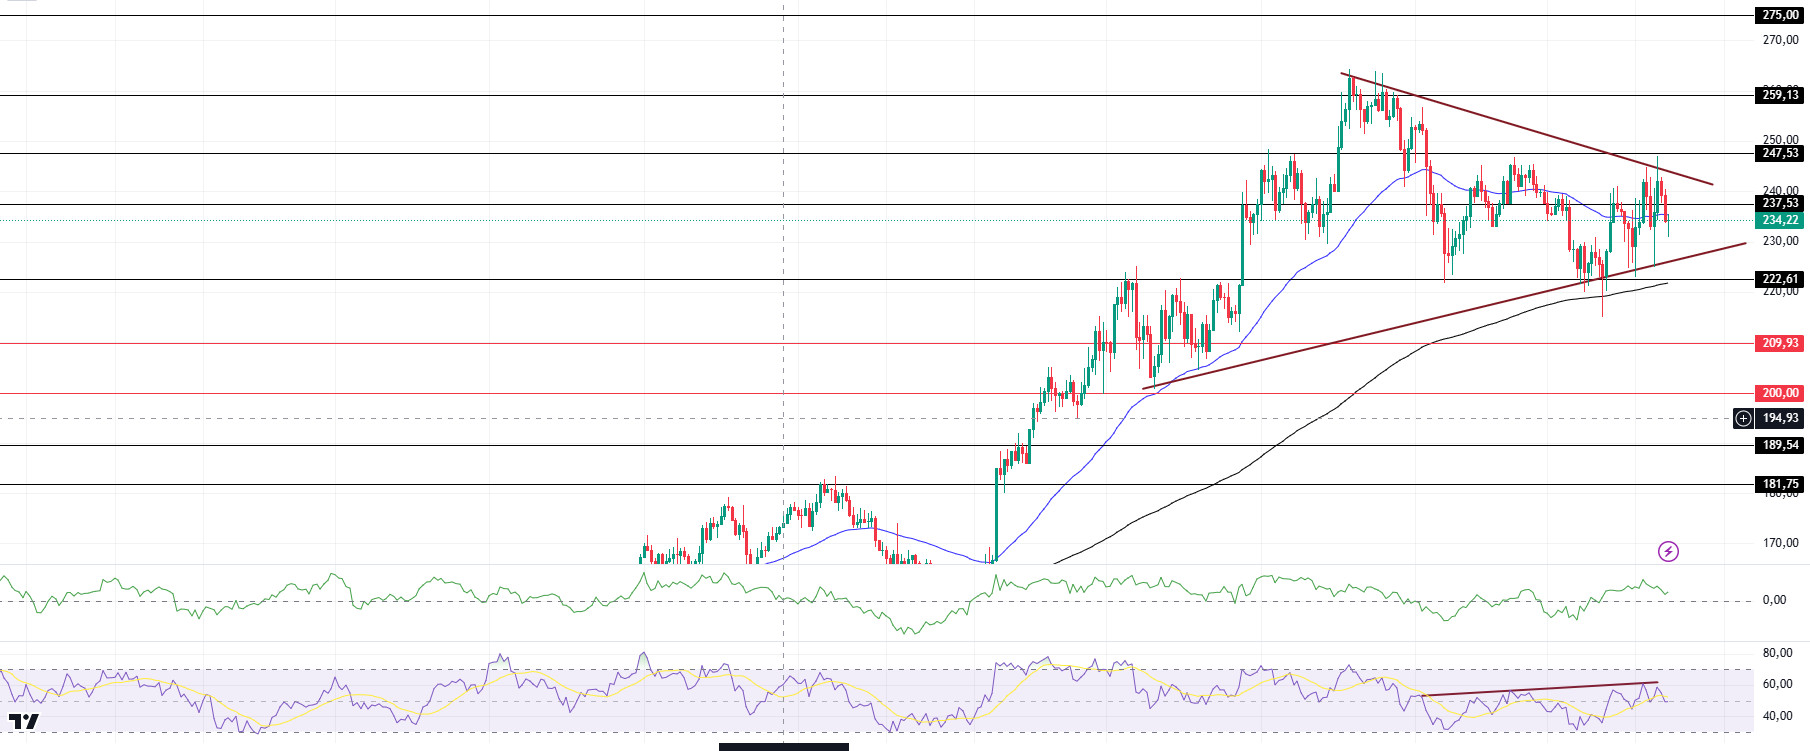
On the 4-hour timeframe, the 50 EMA (Blue Line) is above the 200 EMA (Black Line). Since Noviembre 22, SOL has been in a downtrend and although it broke the downtrend, we can say that this is a rise due to the general market. As a matter of fact, the momentum started to decline even though the price started to rise with support from the 200 EMA. When we examine the Chaikin Money Flow (CMF)20 indicator, we see that money inflows are also declining. This can be shown as a downward signal. However, Relative Strength Index (RSI)14 is at neutral level. At the same time, the bearish mismatch between RSI (14) and the chart should be taken into account. On the other hand, the symmetrical triangle pattern stands out. If it works, the $291.00 level could be the target. The 247.53 level appears as a very strong resistance point in the rises driven by both macroeconomic conditions and innovations in the Solana ecosystem. If it breaks here, the rise may continue. In case of possible retracements due to macroeconomic reasons or profit sales, support levels 222.61 and 189.54 may be triggered again. If the price reaches these support levels, a potential bullish opportunity may arise if momentum increases.
Supports 222.61 – 209.93 – 200.00
Resistances 237.53 – 247.53 – 259.13
DOGE/USDT
Today, non-farm payrolls in the US rose above expectations. This was a result that created a positive impact for the dollar. The unemployment rate was 4.2%, in line with expectations. Average hourly earnings increased by 0.4% on a monthly basis. All these data reflected positively on cryptocurrencies.
DOGE’s volume has also increased significantly as whales continue to accumulate tokens as they did in the immediate aftermath of last month’s elections. Indeed, the volume in the last 24 hours has reached $10.25 billion.
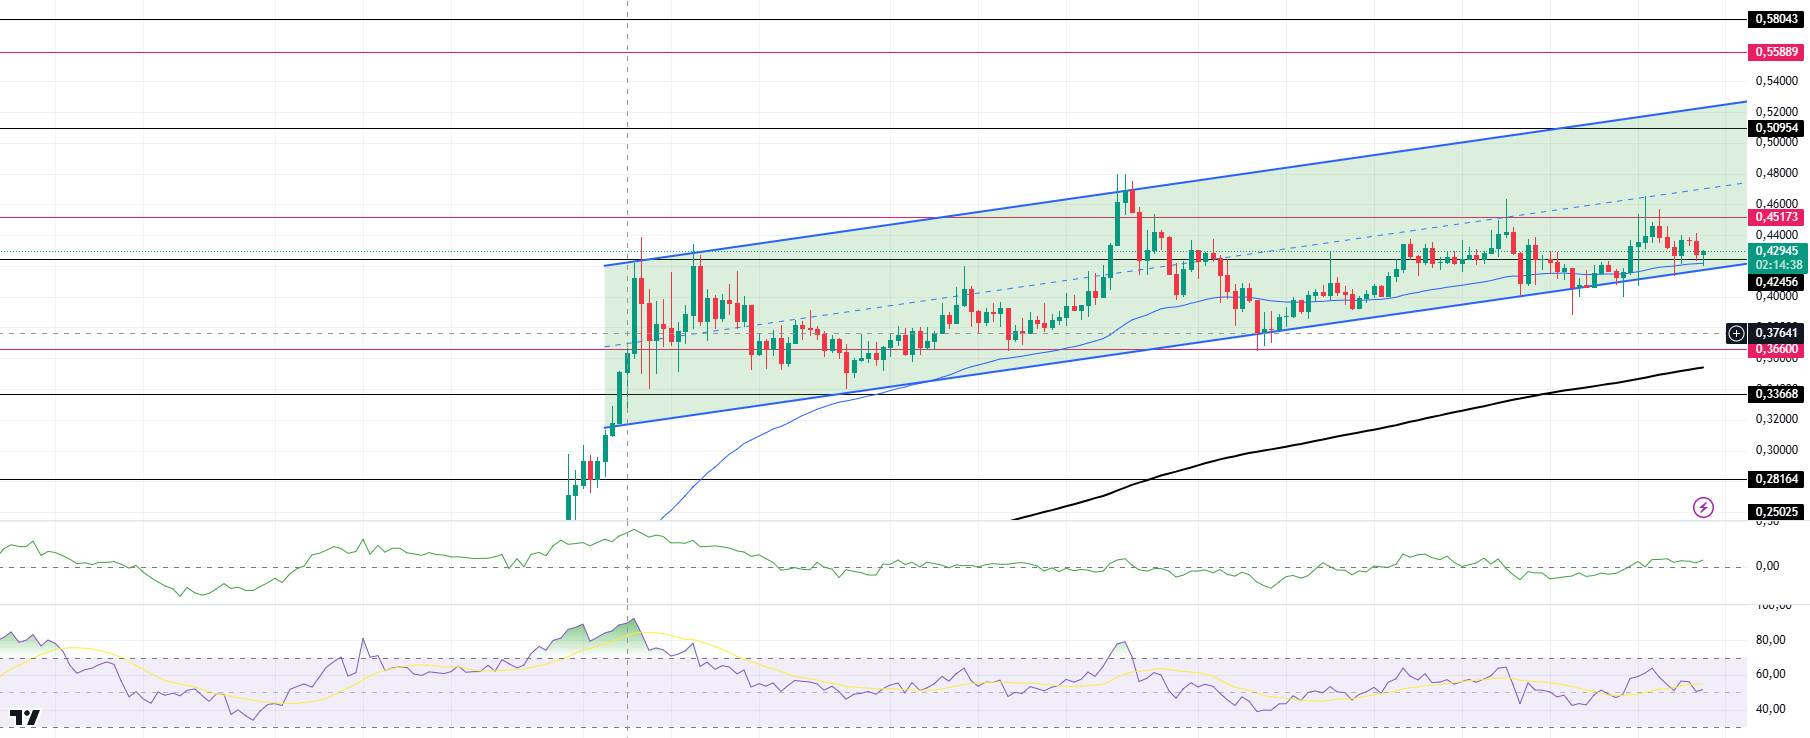
When we look at the chart, the asset, which has been in an uptrend since Noviembre 11, managed to stay in the trend by getting support from both the base level of the trend and the 50 EMA. If the downward acceleration is strong, the 0.36600 level may be triggered. On the 4-hour timeframe, the 50 EMA (Blue Line) is above the 200 EMA (Black Line). But the gap between the two averages is still too wide. This may cause pullbacks. On the other hand, when we look at the RSI 14 indicator, we see that it is moving towards its neutral level. However, when we examine the Chaikin Money Flow (CMF)20 indicator, we see that there is a small amount of money inflows. The 0.50954 level appears to be a very strong resistance level in the rises driven by both macroeconomic conditions and innovations in Doge coin. If DOGE maintains its momentum and rises above this level, the rise may continue strongly. In case of retracements due to possible macroeconomic reasons or profit sales, the 0.36600 support level can be triggered again. If the price reaches these support levels, a potential bullish opportunity may arise if momentum increases.
Supports 0.42456 – 0.36600 – 0.33668
Resistances 0.45173 – 0.50954 – 0.55889
AVISO LEGAL
La información sobre inversiones, los comentarios y las recomendaciones que figuran en este documento no constituyen asesoramiento en materia de inversiones. Los servicios de asesoramiento en materia de inversión son prestados individualmente por instituciones autorizadas teniendo en cuenta las preferencias de riesgo y rentabilidad de los particulares. Los comentarios y recomendaciones aquí contenidos son de carácter general. Estas recomendaciones pueden no ser adecuadas para su situación financiera y sus preferencias de riesgo y rentabilidad. Por lo tanto, tomar una decisión de inversión basándose únicamente en la información aquí contenida puede no producir resultados acordes con sus expectativas.