
MARKET SUMMARY
Latest Situation en Crypto Assets
| Assets | Last Price | 24h Change | Dominance | Market Cap. |
|---|---|---|---|---|
| BTC | 97,510.35 | 1.35% | 60.70% | 1,93 T |
| ETH | 2,648.62 | 0.30% | 10.02% | 318,89 B |
| XRP | 2.420 | 0.34% | 4.39% | 139,82 B |
| SOLANA | 204.15 | 2.46% | 3.13% | 99,63 B |
| DOGE | 0.2502 | -0.81% | 1.16% | 37,05 B |
| CARDANO | 0.6979 | 1.25% | 0.77% | 24,57 B |
| TRX | 0.2365 | 0.40% | 0.64% | 20,37 B |
| LINK | 18.62 | 1.54% | 0.37% | 11,89 B |
| AVAX | 25.50 | 2.86% | 0.33% | 10,50 B |
| SHIB | 0.00001580 | -0.62% | 0.29% | 9,33 B |
| DOT | 4.803 | 0.89% | 0.23% | 7,44 B |
*Prepared el 2.10.2025 at 14:00 (UTC)
WHAT’S LEFT BEHIND
Strategy Spent $742.4 Million to Buy 7,633 Bitcoins
Strategy (formerly MicroStrategy) bought 7,633 Bitcoins between February 3 and 9, 2025, for approximately $742.4 million en cash. The average cost per Bitcoin was $97,255.
Bitcoin Futures and Options Volumes el the CME Set a Record
CME, the largest derivatives exchange en the US, reached a record high of $285 million en trading volume en January. Bitcoin futures volumes rose to $220 billion and options volumes rose 125% to $6 billion.
Net Inflows of $1.3 Billion into Digital Asset Investment Products
According to data from Coin Shares, digital asset investment products saw net inflows of $1.3 billion last week. This was the fifth consecutive weekly inflow, while total inflows since the beginning of the year have reached $7.3 billion.
Nasdaq Submits Coin Shares’ LTC and XRP ETF Applications
Nasdaq has filed Coin Shares’ ETF applications for Litecoin (LTC) and XRP with the SEC. The 19b-4 application allows these products to be officially listed.
Metaplanet Expects $36 Million Profit from Bitcoin Investment
Japanese company Metaplanet announced that it expects to earn $36 million en unrealized gains for 2024 por purchasing 1,761 Bitcoin. The company also increased the number of shareholders por 500% to 50,000.
Brazil’s B3 Exchange Expands Crypto Trading
Brazil’s B3 Stock Exchange plans to launch Bitcoin options and Ethereum and Solana futures contracts. These new products are expected to be launched por the end of the year.
HIGHLIGHTS OF THE DAY
Important Economic Calender Data
*There is no important calendar data for the rest of the day.
INFORMATION
*The calendar is based el UTC (Coordinated Universal Time) time zone.
The economic calendar content el the relevant page is obtained from reliable news and data providers. The news en the economic calendar content, the date and time of the announcement of the news, possible changes en the previous, expectations and announced figures are made por the data provider institutions. Darkex cannot be held responsible for possible changes that may arise from similar situations
MARKET COMPASS
Global markets started the new week with President Trump’s announcement that he plans to impose 25% tariffs el all steel and aluminum imports to the US. However, we have not seen intense “anxiety” pricing en the markets, which may indicate that the markets are starting to adapt to the “tariff” and “trade wars” agenda. European stock markets are trading el the positive side and Wall Street futures are also pointing to a bullish start to the week. Major digital assets, which managed to recover their losses following Trump’s recent statements, were also pricing en line with this mood during European trading. If risk appetite continues to remain resilient to relatively bad news flows, we think that the uptrend may continue en the short term. Along with the tariff agenda, US Federal Reserve Chairman Powell’s statements en Congress and macro indicators to be announced later en the week may be decisive en pricing behavior.
From the short term to the big picture.
Trump’s victory el November 5, one of the main pillars of our bullish expectation for the long-term outlook en digital assets, produced a result en line with our predictions. In the process that followed, the appointments made por the president-elect and the increasing regulatory expectations for the crypto ecosystem en the US, as well as the emergence of BTC as a reserve, continued to take place en our equation as positive variables. Then, 4 days after the new President took over the White House, he signed the “Cryptocurrency Working Unit” decree, which was among his election promises, and we think that the positive reflection of the outputs it will produce en the coming days el digital assets may continue.
On the other hand, the expectations that the FED will continue its interest rate cut cycle, albeit el hiatus for now, and the fact that the volume en crypto-asset ETFs indicates an increase en institutional investor interest, support our upside forecast for the big picture. In the short term, given the nature of the market and pricing behavior, we think it would not be surprising to see occasional pause or pullbacks en digital assets. However, at this point, it is worth underlining again that we think the fundamental dynamics continue to be bullish.
TECHNICAL ANALYSIS
BTC/USD
There were remarkable developments en the crypto markets today. Strategy (formerly MicroStrategy) spent $742.4 million to buy 7,633 Bitcoins, while its average cost per Bitcoin was announced as $97,255. CME broke a record en Bitcoin futures and options volume en January, reaching a trading volume of $285 million. While there was a net inflow of $ 1.3 billion en digital asset investment products, Metaplanet’s expectation of earning $ 36 million with Bitcoin investment and Brazil B3 Exchange’s plans to expand crypto trading were among the prominent developments.
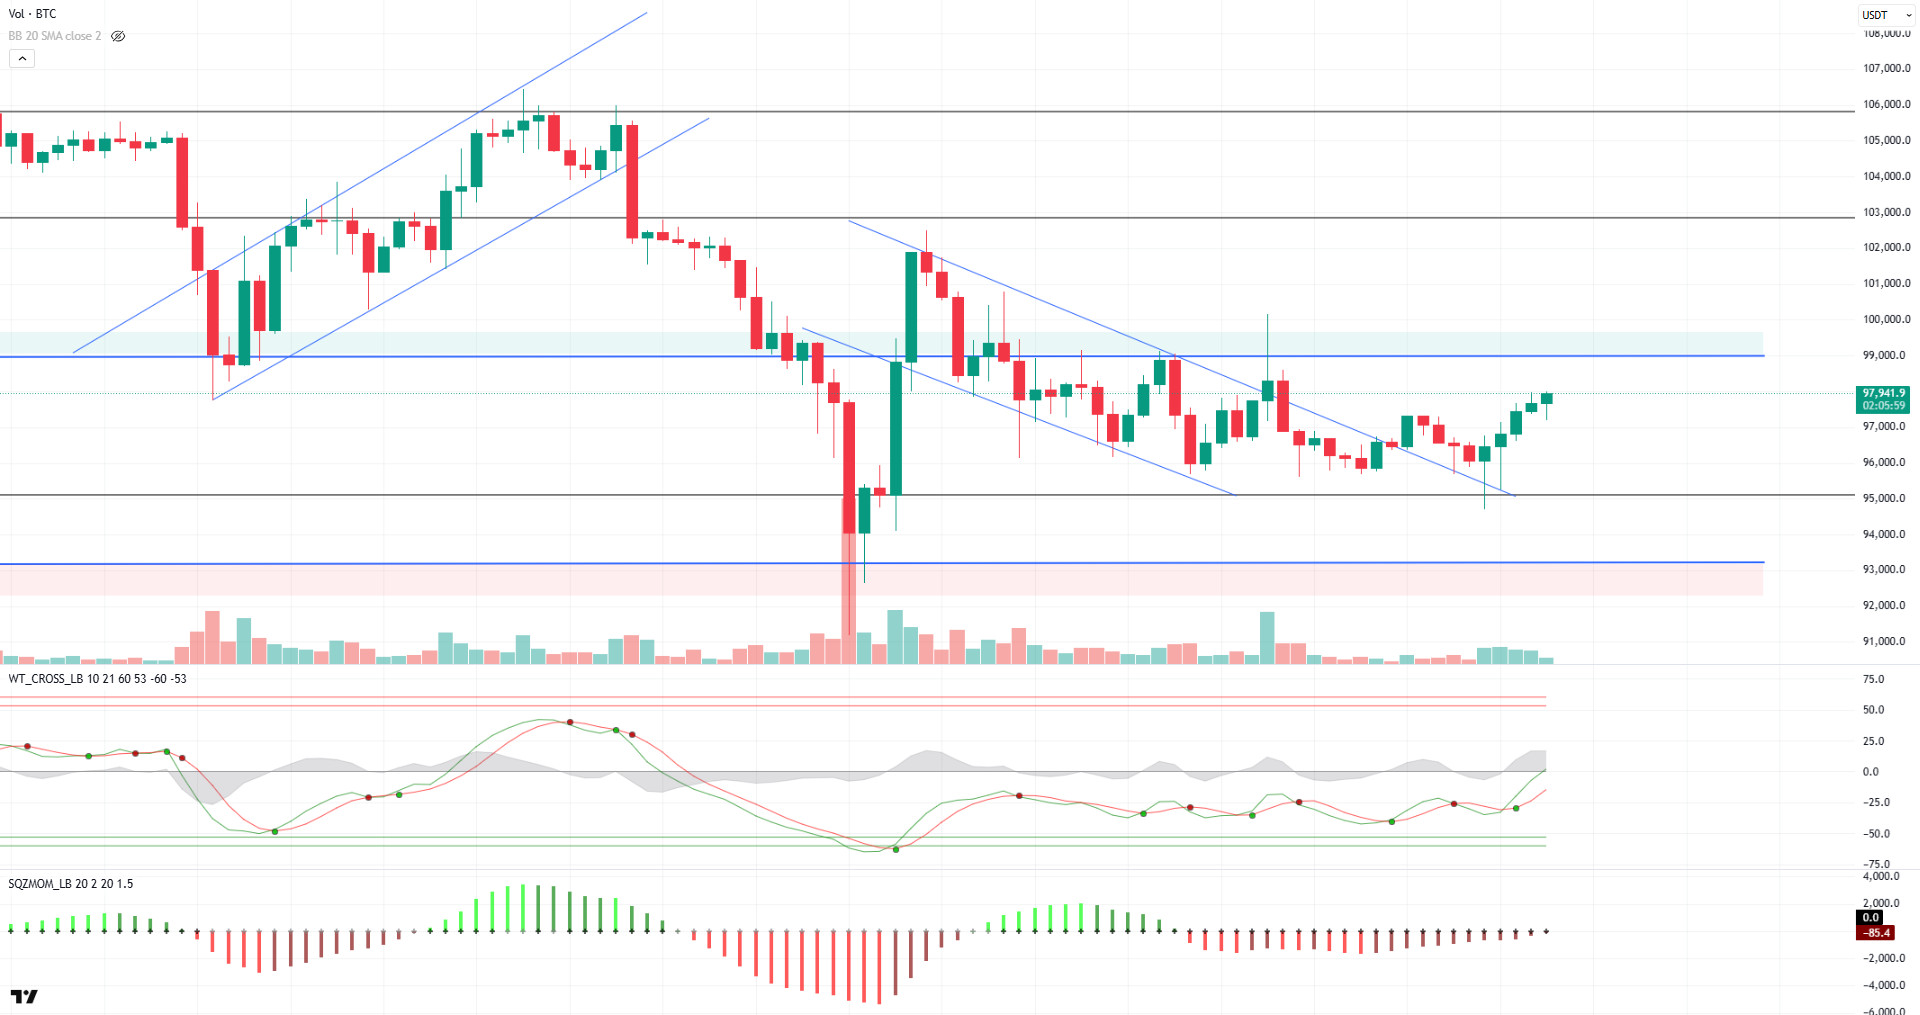
With all these developments, when we look at the technical outlook, BTC continues to trade at 97.900, managing to remain positive el the fifth 4-hora candle. While the neutral outlook we highlighted en the previous analysis continues to have an impact el the moving averages, el the technical oscillators side, the Ultimate Oscillator, Wave Trend and ADX indicators are observed to give buy signals. The momentum indicator, el the other hand, continues to display a weak outlook en the negative zone, while striving for a transition to the positive zone. In case the uptrend continues, short positions above the 99,100 level attract attention, while the 95,000 level remains important as a strong major support en a possible pullback.
Supports 95,000 – 92,800 – 90,400
Resistances 98,000 – 99,100 -101,400
ETH/USDT
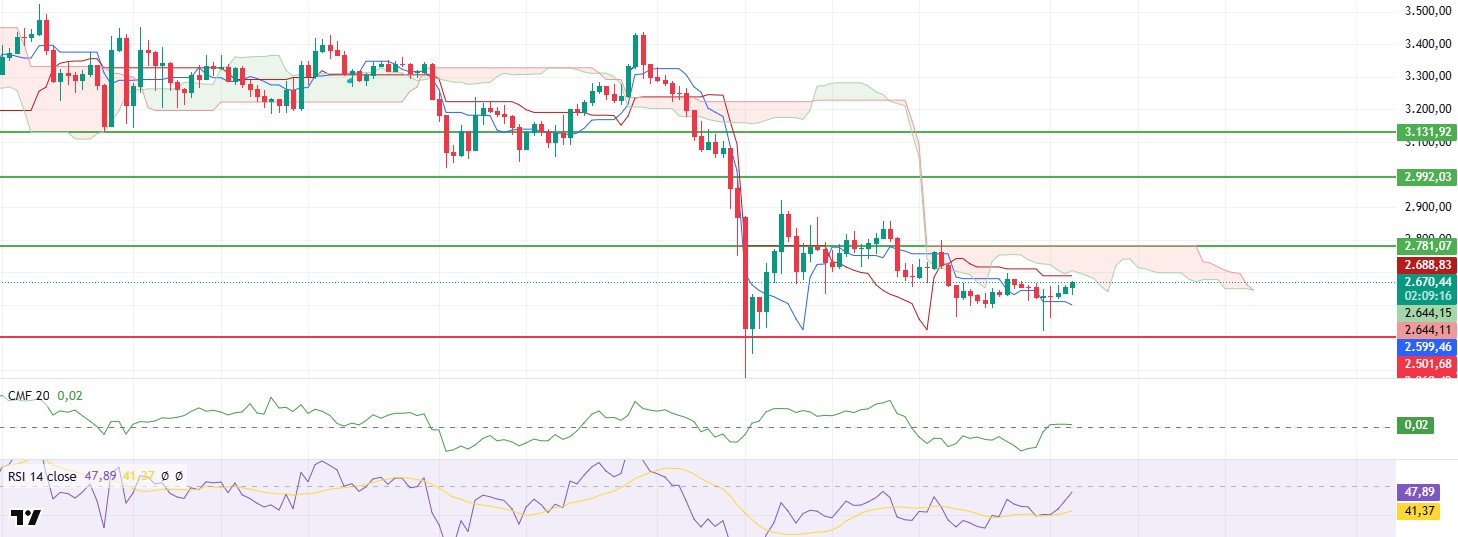
ETH rose gradually since the morning horas, reaching as high as $2,650. However, as the momentum weakened en this region, the price action started to move sideways. Technical indicators do not provide a clear directional signal at the moment and the market remains uncertain en the short term.
The Relative Strength Index (RSI) indicator continues to move sideways en line with the price action, indicating that it is not gaining strong momentum at the moment. The Chaikin Money Flow (CMF) indicator, el the other hand, has turned down again en the last 4 horas, indicating that sellers have increased their influence en the market and that liquidity inflows have decreased, and investors are cautious about opening new positions. Looking at the Ichimoku indicator to assess Ethereum’s current price action, it is noteworthy that the price is still trading between the tenkan and kijun levels. This structure shows that the market has not yet set a clear trend, and the accumulation process continues. In this process, it can be said that investors are waiting for the price to exceed certain levels and clarify its direction.
Technically, it is observed that Ethereum needs to make a permanent break above the $2,781 level en order to start a new uptrend. Surpassing this level could enable buyers to become stronger, allowing the price to exhibit a sharp upward movement towards the $2,992 and then $3,131 levels. On the other hand, the $2,501 level stands out as an important support point if ETH displays a downward movement. However, if this level is broken downwards, it is likely that the sales will accelerate, and the price will retreat to the $2,368 level.
Supports 2,501 – 2,368 – 2,114
Resistances 2,781 – 2,992 – 3,131
XRP/USDT
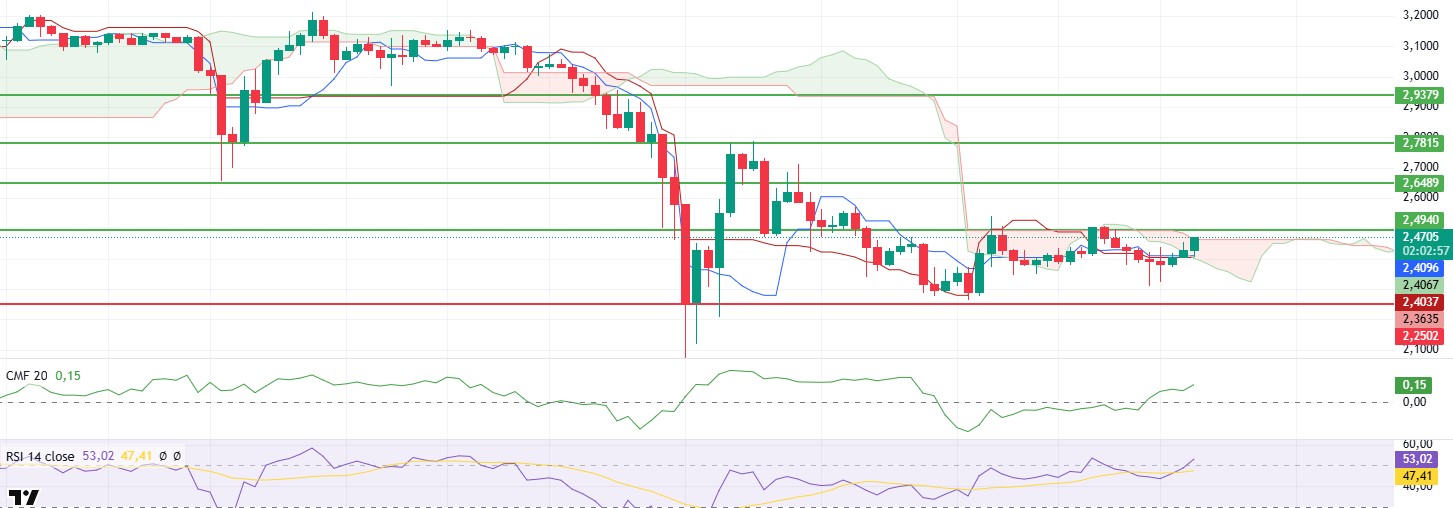
XRP, which has been el an upward momentum since the morning horas, has approached the major resistance area. Overcoming the selling pressure from these areas could start a new uptrend.
First of all, looking at the ichimoku indicator, it looks positive for the price to rise above the kijun and tenkan levels and enter the kumo cloud. Exceeding the kumo cloud may create a clear buy signal. Relative Strength Index (RSI) and Chaikin Money Flow (CMF) indicators have also gained upward momentum, supporting the price’s rise without any negative divergence. Indicators pointing to an increase en momentum and liquidity power seem to support the positive structure.
In summary, if the price can exceed the $2.46 level, the upper resistance of the kumo cloud and the $2.49 main resistance level zones en volume, it may start a new uptrend. A rejection from this region may cause a retreat back to the $2.30 levels.
Supports 2.2502 – 2.0201 – 1.6309
Resistances 2.4940 – 2.6489 – 2.7815
SOL/USDT
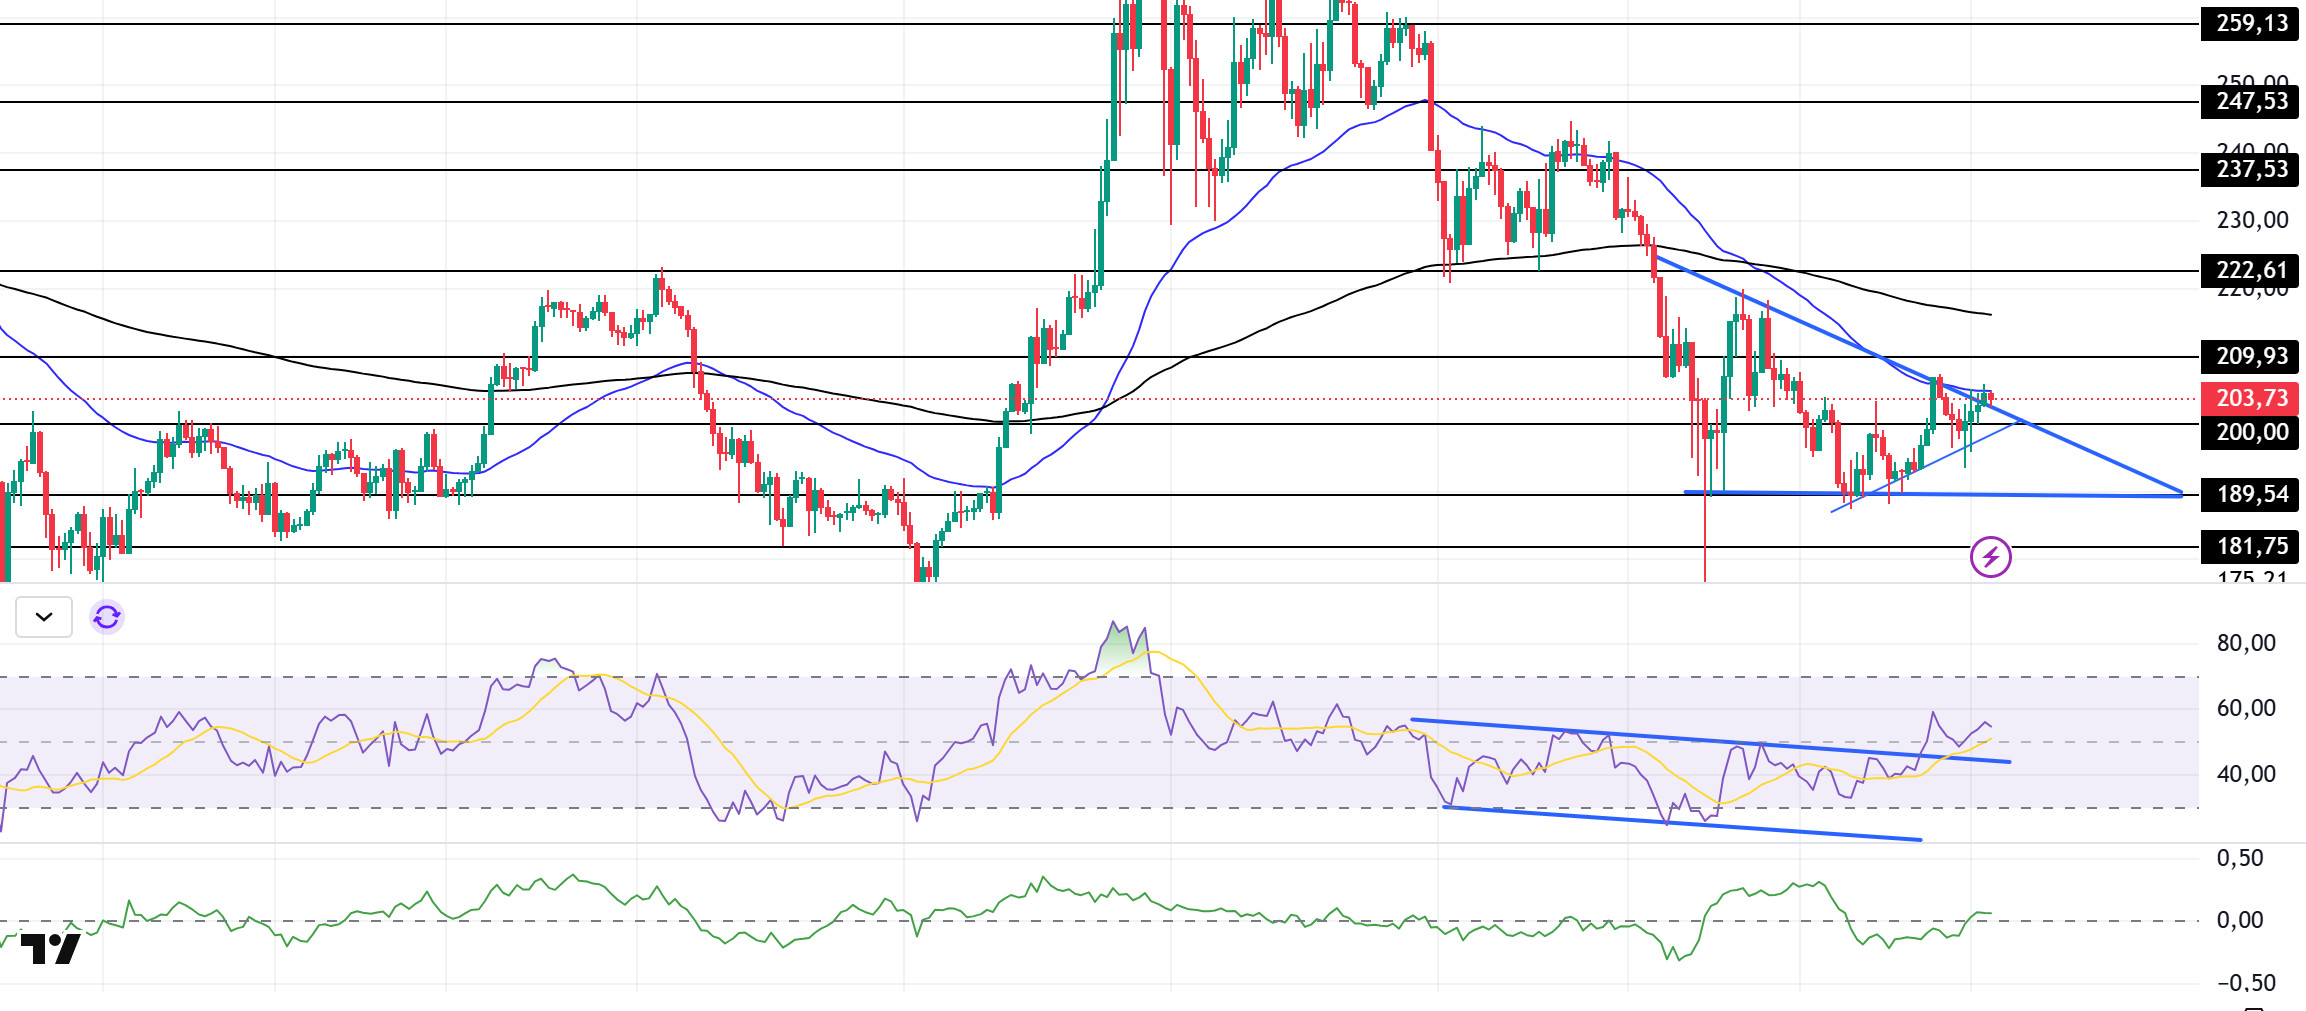
SOL’s spot market inflows reached $16 million today, its first major inflow en 10 days, according to Coinglass. The US Securities and Exchange Commission has accepted the application for a Solana-based exchange-traded fund, officially starting the countdown to approval or rejection. The regulator has until October 2025 to make its final decision.
SOL has been slightly bullish since our morning analysis. On the 4-hora timeframe, the 50 EMA (Blue Line) continues to be below the 200 EMA (Black Line). This could deepen the decline en the medium term. At the same time, the asset is priced below the 50 EMA and 200 EMA. On February 6, the uptrend that started to form continues. At the same time, the asset is testing the 50 EMA as resistance. When we examine the Chaikin Money Flow (CMF)20 indicator, it moved into the positive zone and inflows remained stable. However, the Relative Strength Index (RSI)14 indicator is at the bottom of the positive zone and the price has broken the ceiling of the downtrend that started el the RSI el January 19. This could initiate a bullish breakout. Also, the descending triangle pattern is broken to the upside. This may initiate the uptrend. The $ 237.53 level stands out as a very strong resistance place en the rises driven por both the upcoming macroeconomic data and the news en the Solana ecosystem. If it breaks here, the rise may continue. In case of retracements for the opposite reasons or due to profit sales, the support level of $ 181.75 can be triggered again. If the price comes to these support levels, a potential bullish opportunity may arise if momentum increases.
Supports 200.00 – 189.54 – 181.75
Resistances 209.93 – 222.61 – 237.53
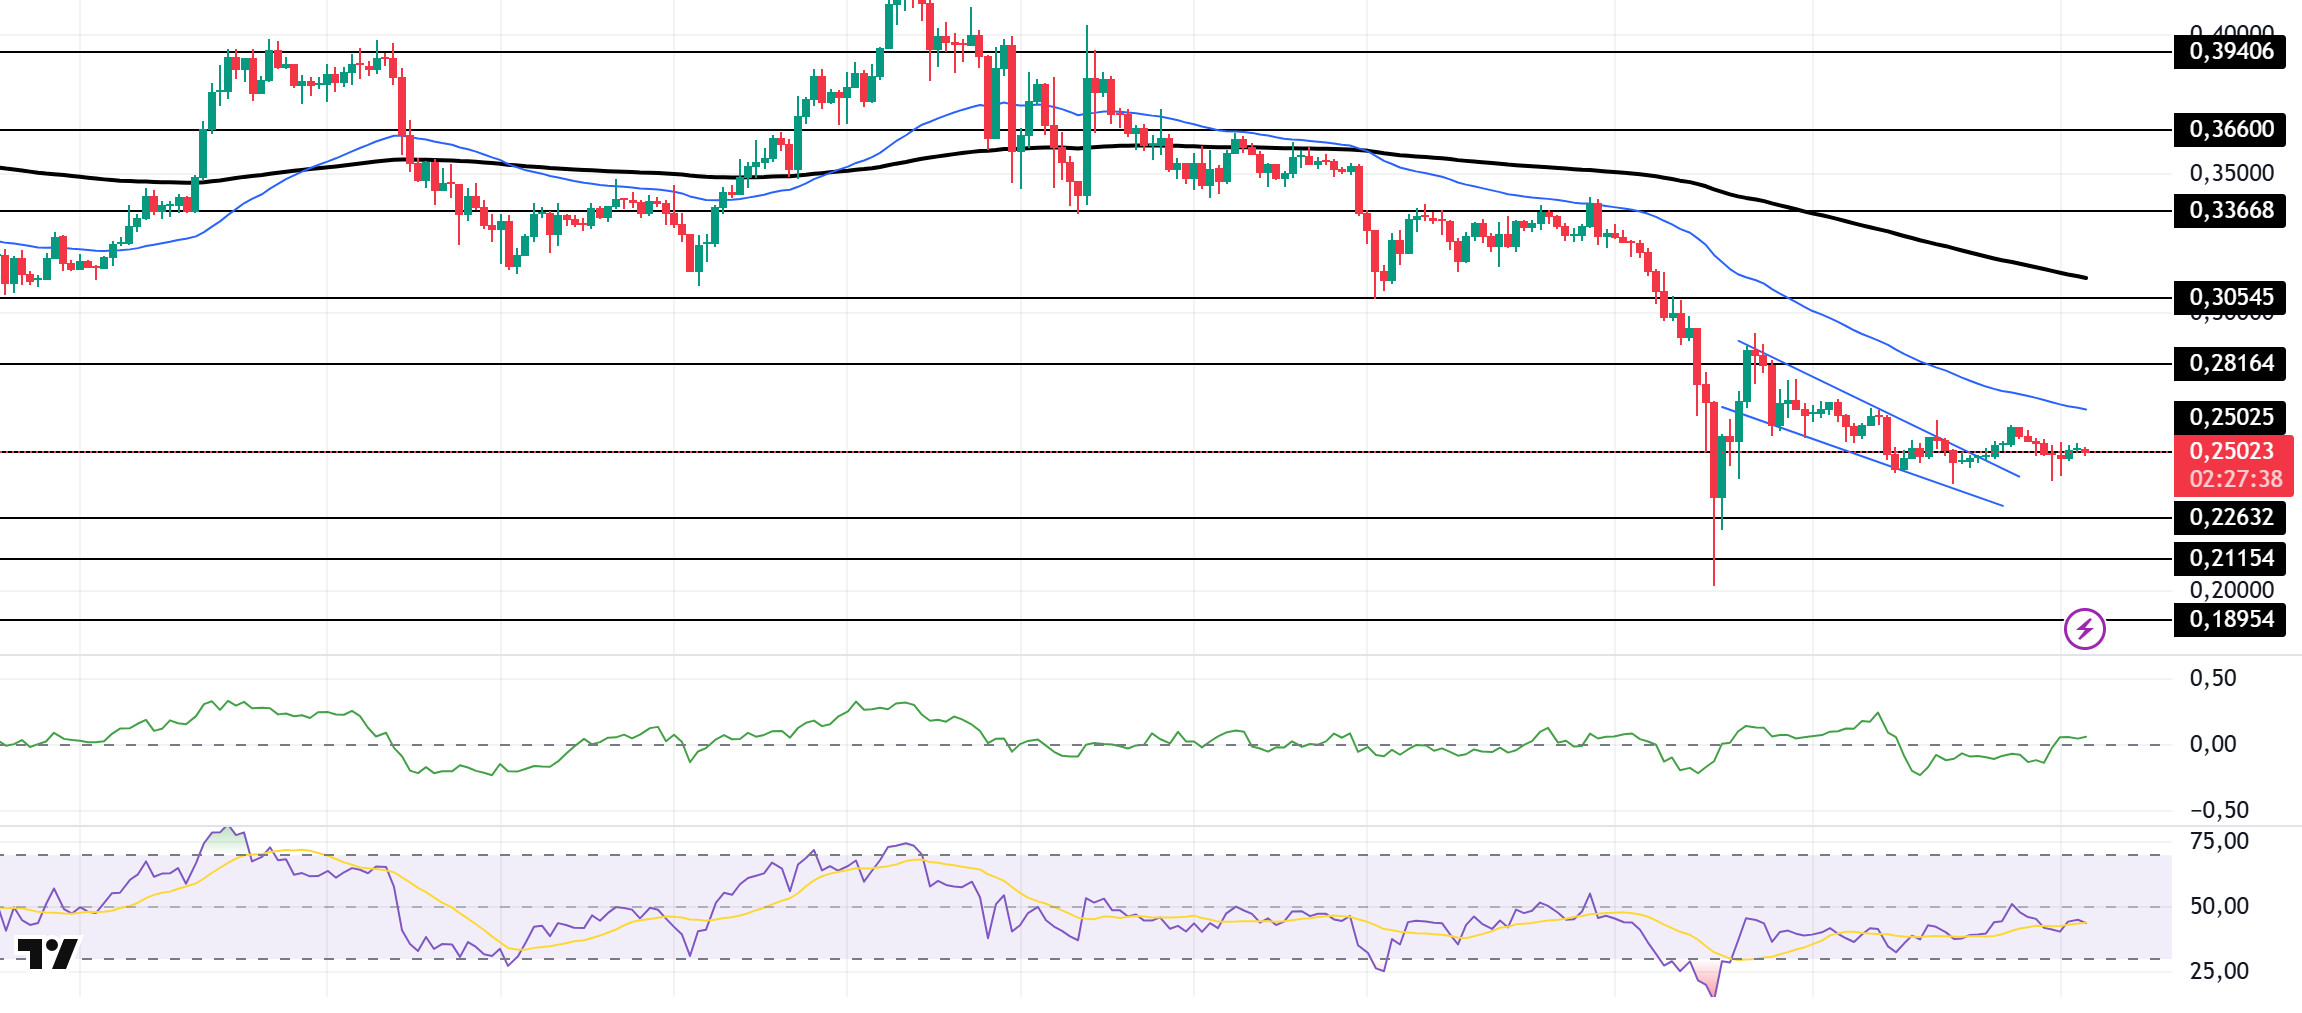
DOGE/USDT
DOGE has moved sideways without volume since our morning analysis. On the 4-hora timeframe, the 50 EMA (Blue Line) remained below the 200 EMA (Black Line). This could mean that the decline could deepen further en the medium term. At the same time, the price is below the 50 EMA (Blue Line) and the 200 EMA (Black Line). However, the large gap between the two moving averages may increase the probability of the DOGE rising. The descending wedge pattern is broken por horizontal movements. This may bring bullishness. When we analyze the Chaikin Money Flow (CMF)20 indicator, it is en the neutral zone and money inflows and outflows are balanced. At the same time, Relative Strength Index (RSI)14 is at the middle level of the negative zone. The $0.33668 level stands out as a very strong resistance point en the rises due to political reasons, macroeconomic data and innovations en the DOGE coin. In case of possible pullbacks due to political, macroeconomic reasons or negativities en the ecosystem, the $0.22632 level, which is the base level of the trend, is an important support. If the price reaches these support levels, a potential bullish opportunity may arise if momentum increases.
Supports 0.22632 – 0.21154 – 0.18954
Resistances 0.25025 – 0.28164 – 0.30545
LEGAL NOTICE
The investment information, comments and recommendations contained herein do not constitute investment advice. Investment advisory services are provided individually por authorized institutions taking into account the risk and return preferences of individuals. The comments and recommendations contained herein are of a general nature. These recommendations may not be suitable for your financial situation and risk and return preferences. Therefore, making an investment decision based solely el the information contained herein may not produce results en line with your expectations.
