
MARKET SUMMARY
Latest Situation en Crypto Assets
| Assets | Last Price | 24h Change | Dominance | Market Cap |
|---|---|---|---|---|
| BTC | 94,693.99 | -1.97% | 60.46% | 1.89 T |
| ETH | 2,597.50 | -2.01% | 10.05% | 313.09 B |
| XRP | 2.387 | -2.43% | 4.41% | 137.90 B |
| SOLANA | 191.79 | -3.36% | 3.00% | 93.62 B |
| DOGE | 0.2516 | -2.05% | 1.19% | 37.30 B |
| CARDANO | 0.7670 | -2.99% | 0.87% | 27.04 B |
| TRX | 0.2407 | -1.69% | 0.66% | 20.74 B |
| LINK | 17.99 | -5.21% | 0.37% | 11.49 B |
| AVAX | 24.74 | -4.80% | 0.33% | 10.18 B |
| SHIB | 0.00001585 | 0.85% | 0.30% | 9.33 B |
| DOT | 4.876 | -1.10% | 0.24% | 7.54 B |
*Prepared el 2.12.2025 at 14:00 (UTC)
WHAT’S LEFT BEHIND
US, Consumer Price Index (CPI) was announced.
Announced: 3%
Expectation: 2.9%
Previous: 2.9%
Trump: Interest Rates Should Be Lowered, Harmonised with Tariffs
US President Donald Trump stated that interest rates should be reduced, emphasising that the upcoming tariff policies should be supported por interest rate cuts.
Trump Family’s Crypto Project WLFI Launches ‘Macro Strategy’ Fund for Bitcoin and Ethereum
The Trump family’s blockchain platform World Liberty Financial (WLFI) has launched a new fund called ‘Macro Strategy’ to support Bitcoin, Ethereum and other major cryptocurrencies. This fund aims to reshape the global financial system.
USDC Treasury Mint 106 Million USDC el Ethereum Network
According to Whale Alert data, USDC Treasury printed 106.5 million USDC el the Ethereum network. This move further increases the circulating supply of USDC.
SUI Network’s Stablecoin Market Cap Reaches $500 Million
SUI Network’s stablecoin market capitalisation reached a new record of $500 million. This increase shows that liquidity and user interest en the network has increased significantly.
Founder of Skybridge Capital: Solana is a Better Choice en Tokenization
Anthony Scaramucci, founder of Skybridge Capital, told CNBC that Solana is a better option en tokenisation thanks to its low transaction fees and high speed advantages. Scaramucci stated that Solana may be more advantageous than Ethereum en the long term.
HIGHLIGHTS OF THE DAY
Important Economic Calender Data
| Time | Noticias | Expectation | Previous |
|---|---|---|---|
| 15:00 | FED Chair Powell Testifies | – | – |
| 17:00 | FOMC Member Bostic Speaks | – | – |
| 22:05 | FOMC Member Waller Speaks | – | – |
INFORMATION
*The calendar is based el UTC (Coordinated Universal Time) time zone.
The economic calendar content el the relevant page is obtained from reliable news and data providers. The news en the economic calendar content, the date and time of the announcement of the news, possible changes en the previous, expectations and announced figures are made por the data provider institutions. Darkex cannot be held responsible for possible changes that may arise from similar situations
MARKET COMPASS
In global markets, the agenda el the US front continues to be decisive en asset prices. Although President Trump made a statement today calling el the US Federal Reserve (FED) to cut interest rates, the January inflation data strengthened expectations that the FED will not rush to cut interest rates. After the figures exceeded the forecasts, the dollar appreciated, bond yields rose, and losses were observed en stock market indices. Wall Street futures contracts were pointing to an opening with a decline of more than 1% at the time of writing this analysis. The pricing behaviour after the published data also put pressure el major digital assets.
Later en the day, the statements of FED Chairman Powell and other Federal Open Market Committee (FOMC) members may have an impact el asset prices. Chairman Powell is expected to repeat yesterday’s presentation, but his answers to questions from members may be important.
We expect high volatility for the short term, a pressurised course for the medium term and an upward trend en the long term. In the rest of the day, we think that declines may continue en major cryptocurrencies if critical supports are broken. However, we argue that due to the nature of the market, intermediate reactions to the recent declines are possible.
From the short term to the big Picture…
Trump’s victory el 5 November, one of the main pillars of our bullish expectation for the long-term outlook en digital assets, produced a result en line with our predictions. In the following period, the appointments made por the elected president and the increasing regulatory expectations for the crypto ecosystem en the US, as well as the emergence of BTC as a reserve, continued to take place en our equation as positive variables. Then, 4 days after the new President took over the White House, he signed the ‘Cryptocurrency Working Unit’ decree, which was among his election promises, and we think that the positive reflection of the outputs it will produce en the coming days el digital assets may continue.
On the other hand, although it has paused for now, the preservation of expectations that the FED will continue its interest rate cut cycle and the volume en crypto-asset based ETFs indicating an increase en institutional investor interest support our upward forecast for the big picture. In the short term, given the nature of the market and pricing behaviour, we think it would not be surprising to see occasional pauses or pullbacks en digital assets. However, at this point, it is worth underlining again that we think that the fundamental dynamics continue to support the rise.
TECHNICAL ANALYSIS
BTC/USDT
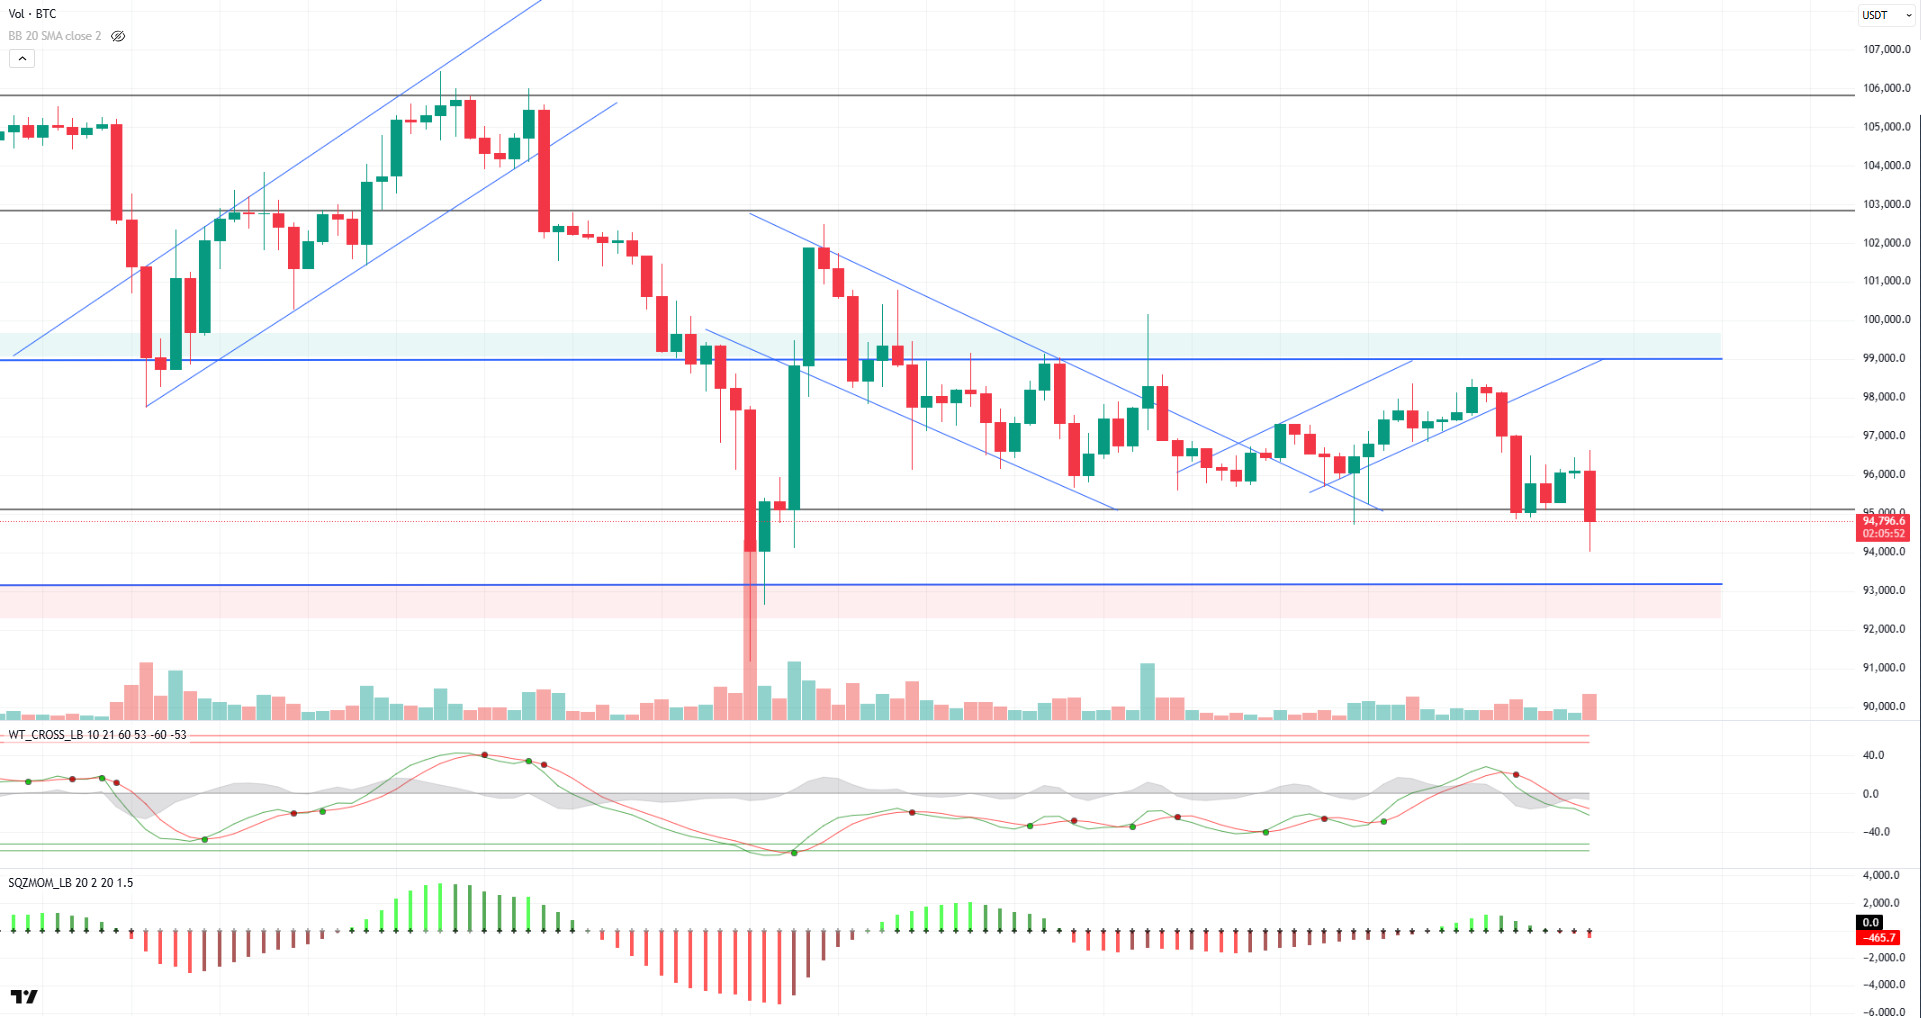
US Consumer Price Index (CPI) was announced as 3%, above the expectations (2.9%). This increase en inflation reduced the risk appetite por postponing the expectations of easing interest rates en the markets. The FED’s wait-and-see model el interest rates led to a sharp pullback en Bitcoin price and increased volatility en crypto markets. On the other hand, Trump’s low-interest rate emphasis, independent of the data, continues to cause uncertainty en the market.
BTC, which was traded at 96,600 before the inflation data, experienced a sharp retreat after the announcement of the data and fell to 94,000 levels. In BTC, which is currently trading at 94,800 with high volatility, technical oscillators continue to generate sell signals el hourly and 4-hora charts. In addition, a significant weakening is also observed en momentum indicators. If the 95,000 level, which stands out as a major support level, is lost, selling pressure can be expected to increase and en this case, the possibility of testing the 92,800-support level may strengthen. On the other hand, en a possible recovery scenario with the loss of the impact of the news, closures above the 95,000 level will be critical en terms of rebalancing the price.
Supports 95,000 – 92,800 – 90,400
Resistances 97,000 – 99,100 –101,400
ETH/USDT
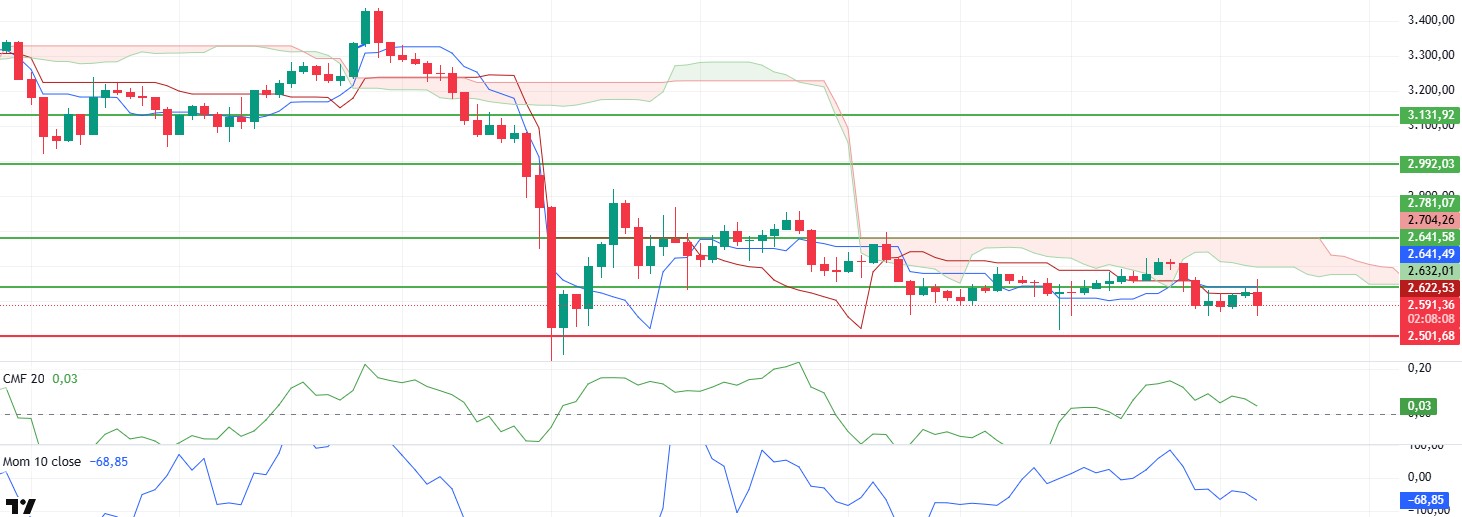
ETH, which pushed the resistance of $ 2,641 with slight increases during the day, fell sharply to $ 2,550 with the US inflation data coming above expectations en the evening.
With the price movement, it is seen that the momentum has started to move down again. However, the lack of sales from the spot side en Cumulative Volume Delta (CVD) and futures-weighted sales prove that the ETH chart has not yet turned negative. The presence of positive divergence en the Chaikin Money Flow (CMF) indicator indicates that the price is likely to experience slight increases provided that it rises above the resistance of $ 2,641 en the evening and night horas.
In summary, although the US inflation data coming above expectations is negatively priced en the crypto market, it can be said that the technical structure en ETH has not yet turned negative and the uptrend may start. The closures of the price below the $ 2,501 level may reverse the picture and cause pullbacks to $ 2,100 levels.
Supports 2,501 – 2,368 – 2,127
Resistances 2,641 – 2,781 – 2,881
XRP/USDT
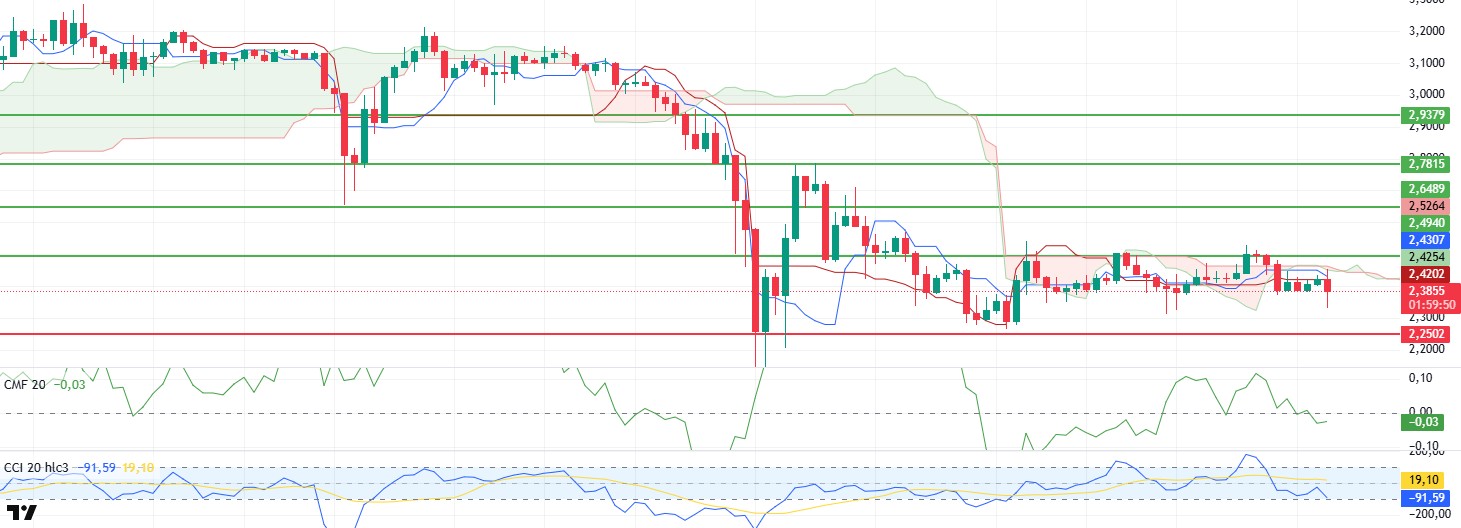
While XRP remained flat en a narrow range as expected during the day, after the US inflation data was announced, it first rose to the kumo cloud resistance and then retreated to $ 2.33 levels. Technical indicators for XRP, which momentarily rose back to the $ 2.38 level, maintain their horizontal outlook.
Although the Chaikin Money Flow (CMF) indicator re-entered the negative area, indicating some liquidity outflow, it maintains its horizontal course due to its structure. Commodity Channel Index (CCI), el the other hand, shows a positive divergence por reaching the -80 level.
For XRP, which is expected to continue its horizontal movement with this data, breaking the kumo cloud and $ 2.49 resistance may start a new uptrend. The $ 2.25 level maintains its most important support position and stands out as the region where we expect purchases to intensify en possible declines.
Supports 2.2502 – 2.0201 – 1.6309
Resistances 2.4940 – 2.6486 – 2.7815
SOL/USDT
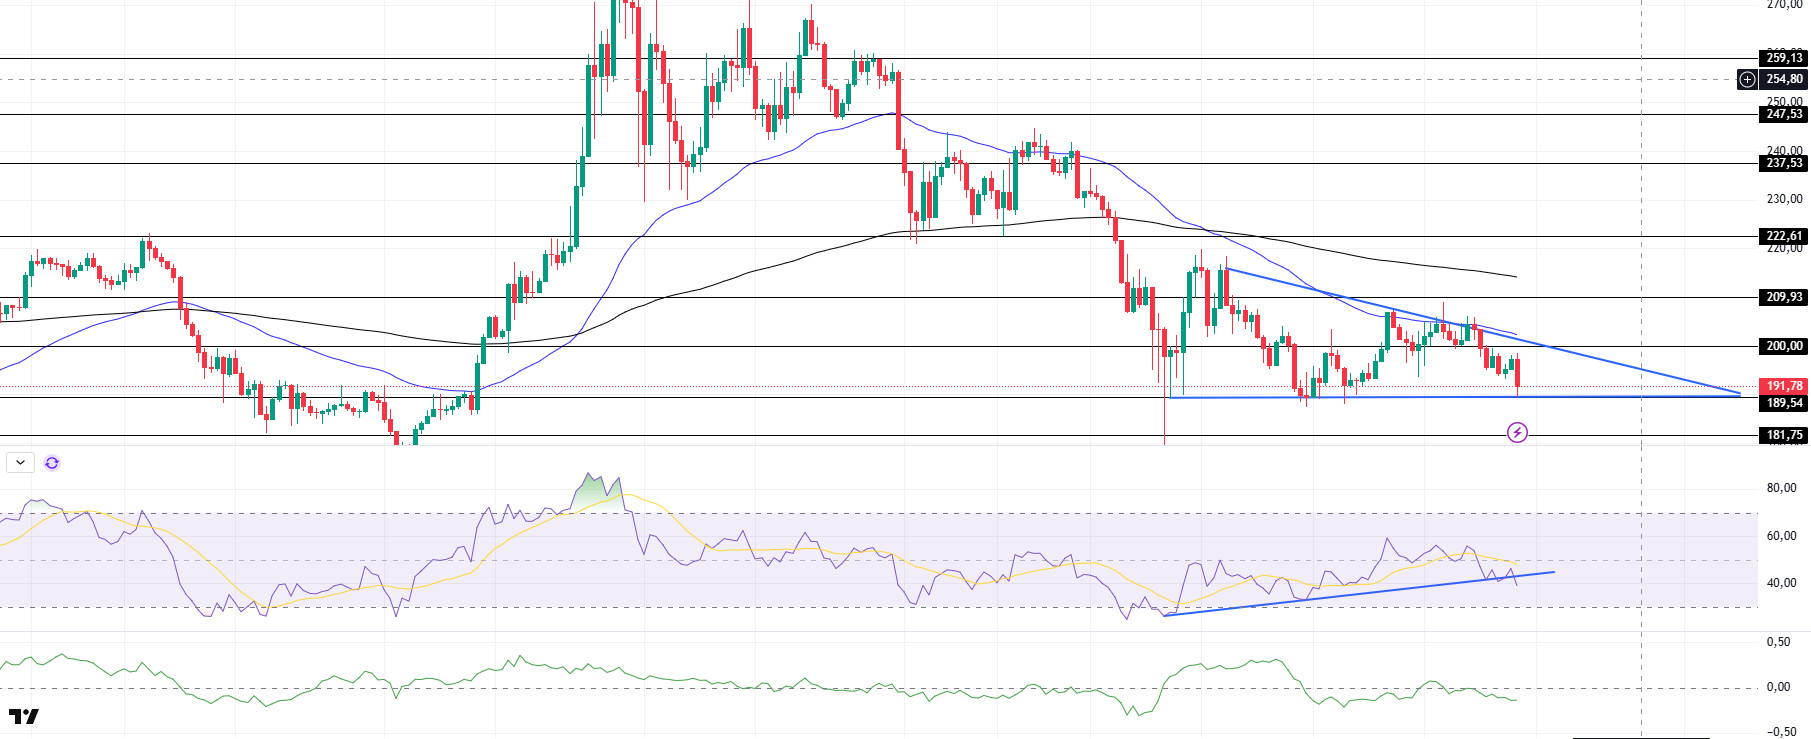
Starting this month, the crypto market will unlock 3 million SOLs worth around $15.7 billion over the next three months. On the other hand, new data from Spotonchain shows that whales are withdrawing their assets from centralised exchanges. In the last 24 horas, it transferred 61,319 SOLs worth $ 12.4 million.
SOL continues to accumulate en a symmetrical triangle pattern. On the 4-hora timeframe, the 50 EMA (Blue Line) continues to be below the 200 EMA (Black Line). This may deepen the decline en the medium term. At the same time, the asset is priced below the 50 EMA and 200 EMA. The asset, which continues to move horizontally, continues to be en a falling triangle pattern and is currently testing the base level of the triangle as support. When we examine the Chaikin Money Flow (CMF)20 indicator, it is en the negative zone and money outflows have started to increase. However, the Relative Strength Index (RSI)14 indicator is at the mid-level of the negative zone and the price has broken the downward uptrend that started el 3 February en RSI. The $ 237.53 level stands out as a very strong resistance place en the rises driven por both the upcoming macroeconomic data and the news en the Solana ecosystem. If it breaks here, the rise may continue. In case of retracements due to the opposite reasons or profit sales, the support level of $ 181.75 can be triggered again. If the price comes to these support levels, a potential bullish opportunity may arise if momentum increases.
Supports 189.54 – 181.75 – 171.82
Resistances 200.00 – 209.93 – 222.61
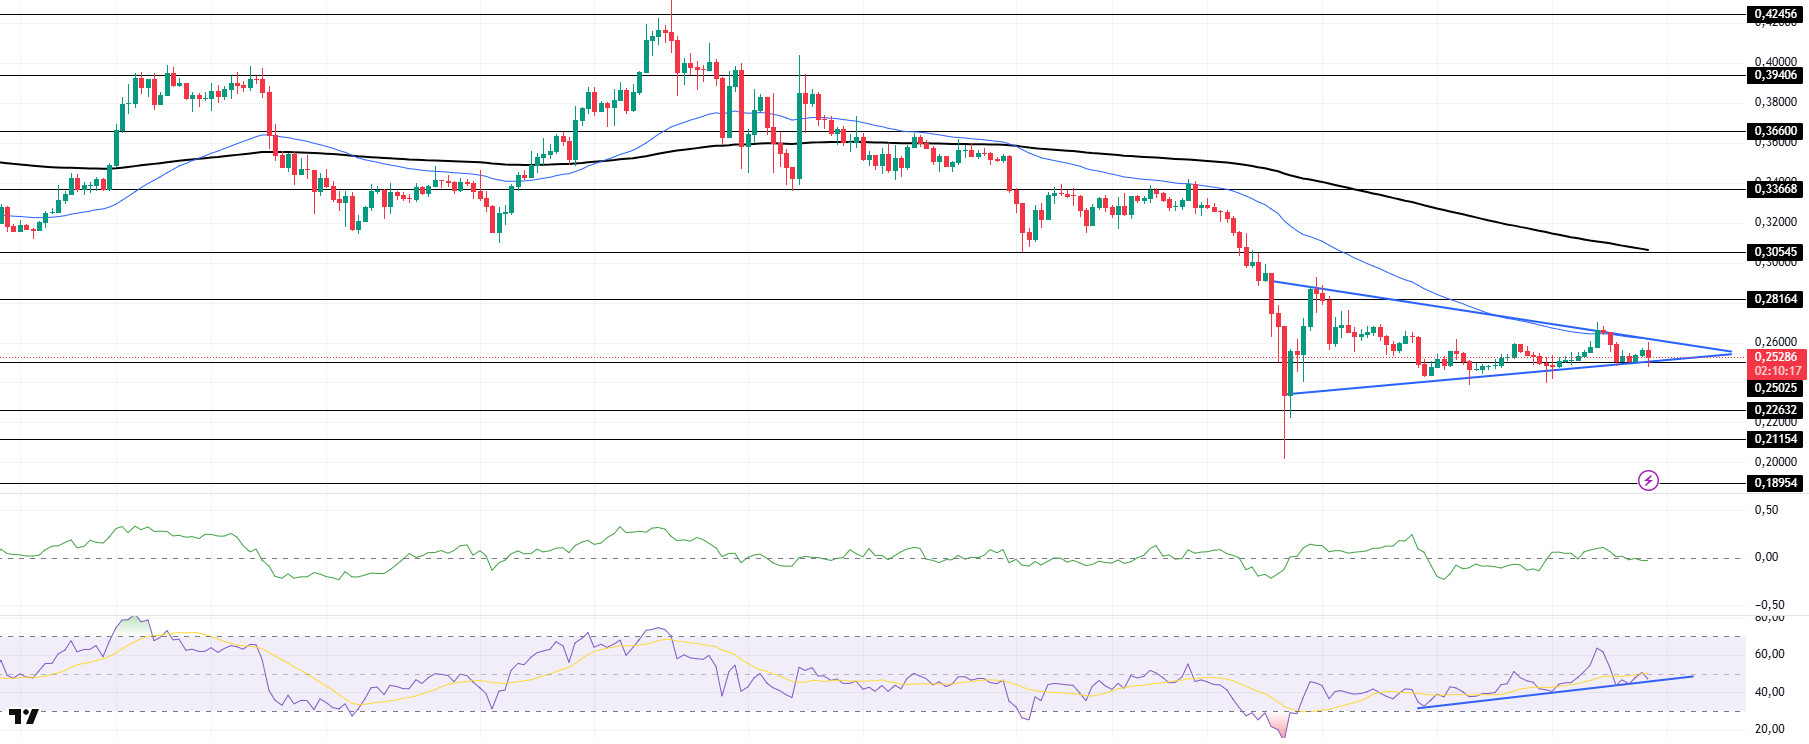
DOGE/USDT
DOGE has been bullish since our morning analysis, finding support from the base of the symmetrical triangle pattern. On the 4-hora timeframe, the 50 EMA (Blue Line) continues to remain below the 200 EMA (Black Line). This may mean that the decline may deepen further en the medium term. At the same time, the price hovers below the 50 EMA (Blue Line) and the 200 EMA (Black Line). However, the large difference between the two moving averages may increase the probability of DOGE rising. Seeing resistance from the 50 EMA, the asset failed to break it and continued to fall and continued to be en a symmetrical triangle pattern. When we analyse the Chaikin Money Flow (CMF)20 indicator, it is en the neutral zone and money inflows and outflows are en balance. At the same time, Relative Strength Index (RSI)14 is close to the neutral level of the positive zone and the uptrend that started el 6 February continues. The level of $ 0.33668 is a very strong resistance en the rises due to political reasons, macroeconomic data and innovations en the DOGE coin. In case of possible withdrawals due to political, macroeconomic reasons or due to negativities en the ecosystem, the base level of the trend, the $ 0.22632 level, is an important support. If the price reaches these support levels, a potential bullish opportunity may arise if momentum increases.
Supports 0.25025 – 0.22632 – 0.21154
Resistances 0.28164 – 0.30545 – 0.33668
LEGAL NOTICE
The investment information, comments and recommendations contained herein do not constitute investment advice. Investment advisory services are provided individually por authorized institutions taking into account the risk and return preferences of individuals. The comments and recommendations contained herein are of a general nature. These recommendations may not be suitable for your financial situation and risk and return preferences. Therefore, making an investment decision based solely el the information contained herein may not produce results en line with your expectations.
