
RESUMEN DEL MERCADO
Última situación de los criptoactivos
| Activos | Último precio | 24h Cambio | Dominación | Capitalización bursátil. |
|---|---|---|---|---|
| BTC | 100,389.95 | -4.24% | 58.20% | 1,99 T |
| ETH | 3,100.33 | -6.19% | 10.89% | 372,58 B |
| XRP | 2.870 | -7.92% | 4.85% | 165,80 B |
| SOLANA | 231.92 | -9.03% | 3.30% | 112,89 B |
| DOGE | 0.3203 | -8.82% | 1.38% | 47,26 B |
| CARDANO | 0.9074 | -8.21% | 0.93% | 31,91 B |
| TRX | 0.2415 | -3.84% | 0.61% | 20,80 B |
| ENLACE | 23.33 | -7.56% | 0.44% | 14,86 B |
| AVAX | 33.53 | -10.81% | 0.40% | 13,78 B |
| SHIB | 0.00001821 | -8.94% | 0.31% | 10,74 B |
| DOT | 5.763 | -9.57% | 0.26% | 8,91 B |
*Prepared on 1.27.2025 at 07:00 (UTC)
LO QUE QUEDA ATRÁS
MicroStrategy Buys Another 10,107 Bitcoin
MicroStrategy announced that it purchased 10,107 Bitcoins for approximately $1.1 billion between Enero 21-26, 2025. The average cost per Bitcoin was $105,596. The purchase was funded with proceeds from the issuance of shares.
Shelf Registration Application for Hybrid Securities from MicroStrategy
MicroStrategy filed a Form S-3 registration statement for hybrid securities with the SEC. The proceeds from these securities will be used to purchase more Bitcoin and for corporate purposes, the company said.
Humanity Protocol Completes $20 Million Funding Round
Identity verification blockchain company Humanity Protocol has raised $20 million in a funding round led by Pantera Capital and Jump Crypto. The company’s valuation reached $1.1 billion.
SEC Vindicated in Kraken Case
In the SEC’s unregistered securities sales case against Kraken, the court rejected a defense argument by Kraken. This case could set an important legal precedent for the cryptocurrency industry.
LO MÁS DESTACADO DEL DÍA
Datos importantes del calendario económico
| Tiempo | Noticias | Expectativa | Anterior |
|---|---|---|---|
| 15:00 | US New Home Sales (Dec) | 669K | 664K |
INFORMACIÓN
*El calendario se basa en el huso horario UTC (Tiempo Universal Coordinado).
The economic calendar content on the relevant page is obtained from reliable news and data providers. The news in the economic calendar content, the date and time of the announcement of the news, possible changes in the previous, expectations and announced figures are made by the data provider institutions. Darkex cannot be held responsible for possible changes that may arise from similar situations
BRÚJULA DE MERCADO
The rise of China’s DeepSeek, which has caused fears in global markets that it could destroy the US dominance in artificial intelligence technology, continues to be effective. The advantages of the application in question, such as the increase in the number of users, its ability to be used with lower chips, its performance and low costs, are being discussed. While investors are waiting for the US Federal Reserve’s (FED) decisions on Miércoles, they are also looking for direction in the stressful environment caused by the new President Trump’s use of tariffs as a policy tool.
Increased “safe haven” demand led to appreciation in fixed income securities such as the Japanese Yen, Swiss Franc and Treasuries. The yield on the US 10-year, which was as high as 4.81% in the previous week, fell as low as 4.54%. US index futures also posted significant losses. In particular, with the impact of the DeepSeek issue, Nasdaq lost around 3.5% and futures contract linked to this index fell by up to 5% during the day. There are also general losses in European stock markets.
After a wave of selling on the digital assets front last night, some recovery was observed with the news of new purchases by MicroStrategy. The company also announced plans to issue preferred stock for further investment. This was also in line with our expectation in our morning analysis that we could see “intermediate rebounds”. Major cryptocurrencies have recovered some of their recent losses. However, we remain of the view that there is a lack of catalysts for bullishness to continue in the short term. Although we remain bullish on the long-term outlook, for the short term, we believe that most of the expected developments have been realized and priced in, and that further news flows can be expected for a bullish continuation.
From the short term to the big picture…
The victory of former President Trump on Noviembre 5, one of the main pillars of our bullish expectation for the long-term outlook in digital assets, produced a result in line with our predictions. In the aftermath, the appointments made by the president-elect and the increasing regulatory expectations for the crypto ecosystem in the US and the emergence of BTC as a reserve continued to be in our equation as positive variables. Then, 4 days after taking over the White House, the new President signed the decree of the Cryptocurrency Work Unit, which was among his election promises, and we think that the outputs it will produce in the coming days will continue to reflect positively on digital assets.
On the other hand, although it is expected to continue at a slower pace, the expectations that the FED will continue its interest rate cut cycle (for now) and the fact that the volume in ETFs based on crypto assets indicates an increase in institutional investor interest support our upward forecast for the big picture for now. In the short term, given the nature of the market and pricing behavior, we think it would not be surprising to see occasional pauses or pullbacks in digital assets. However, at this point, it is worth emphasizing again that we think that the fundamental dynamics continue to be bullish.
ANÁLISIS TÉCNICO
BTC/USD
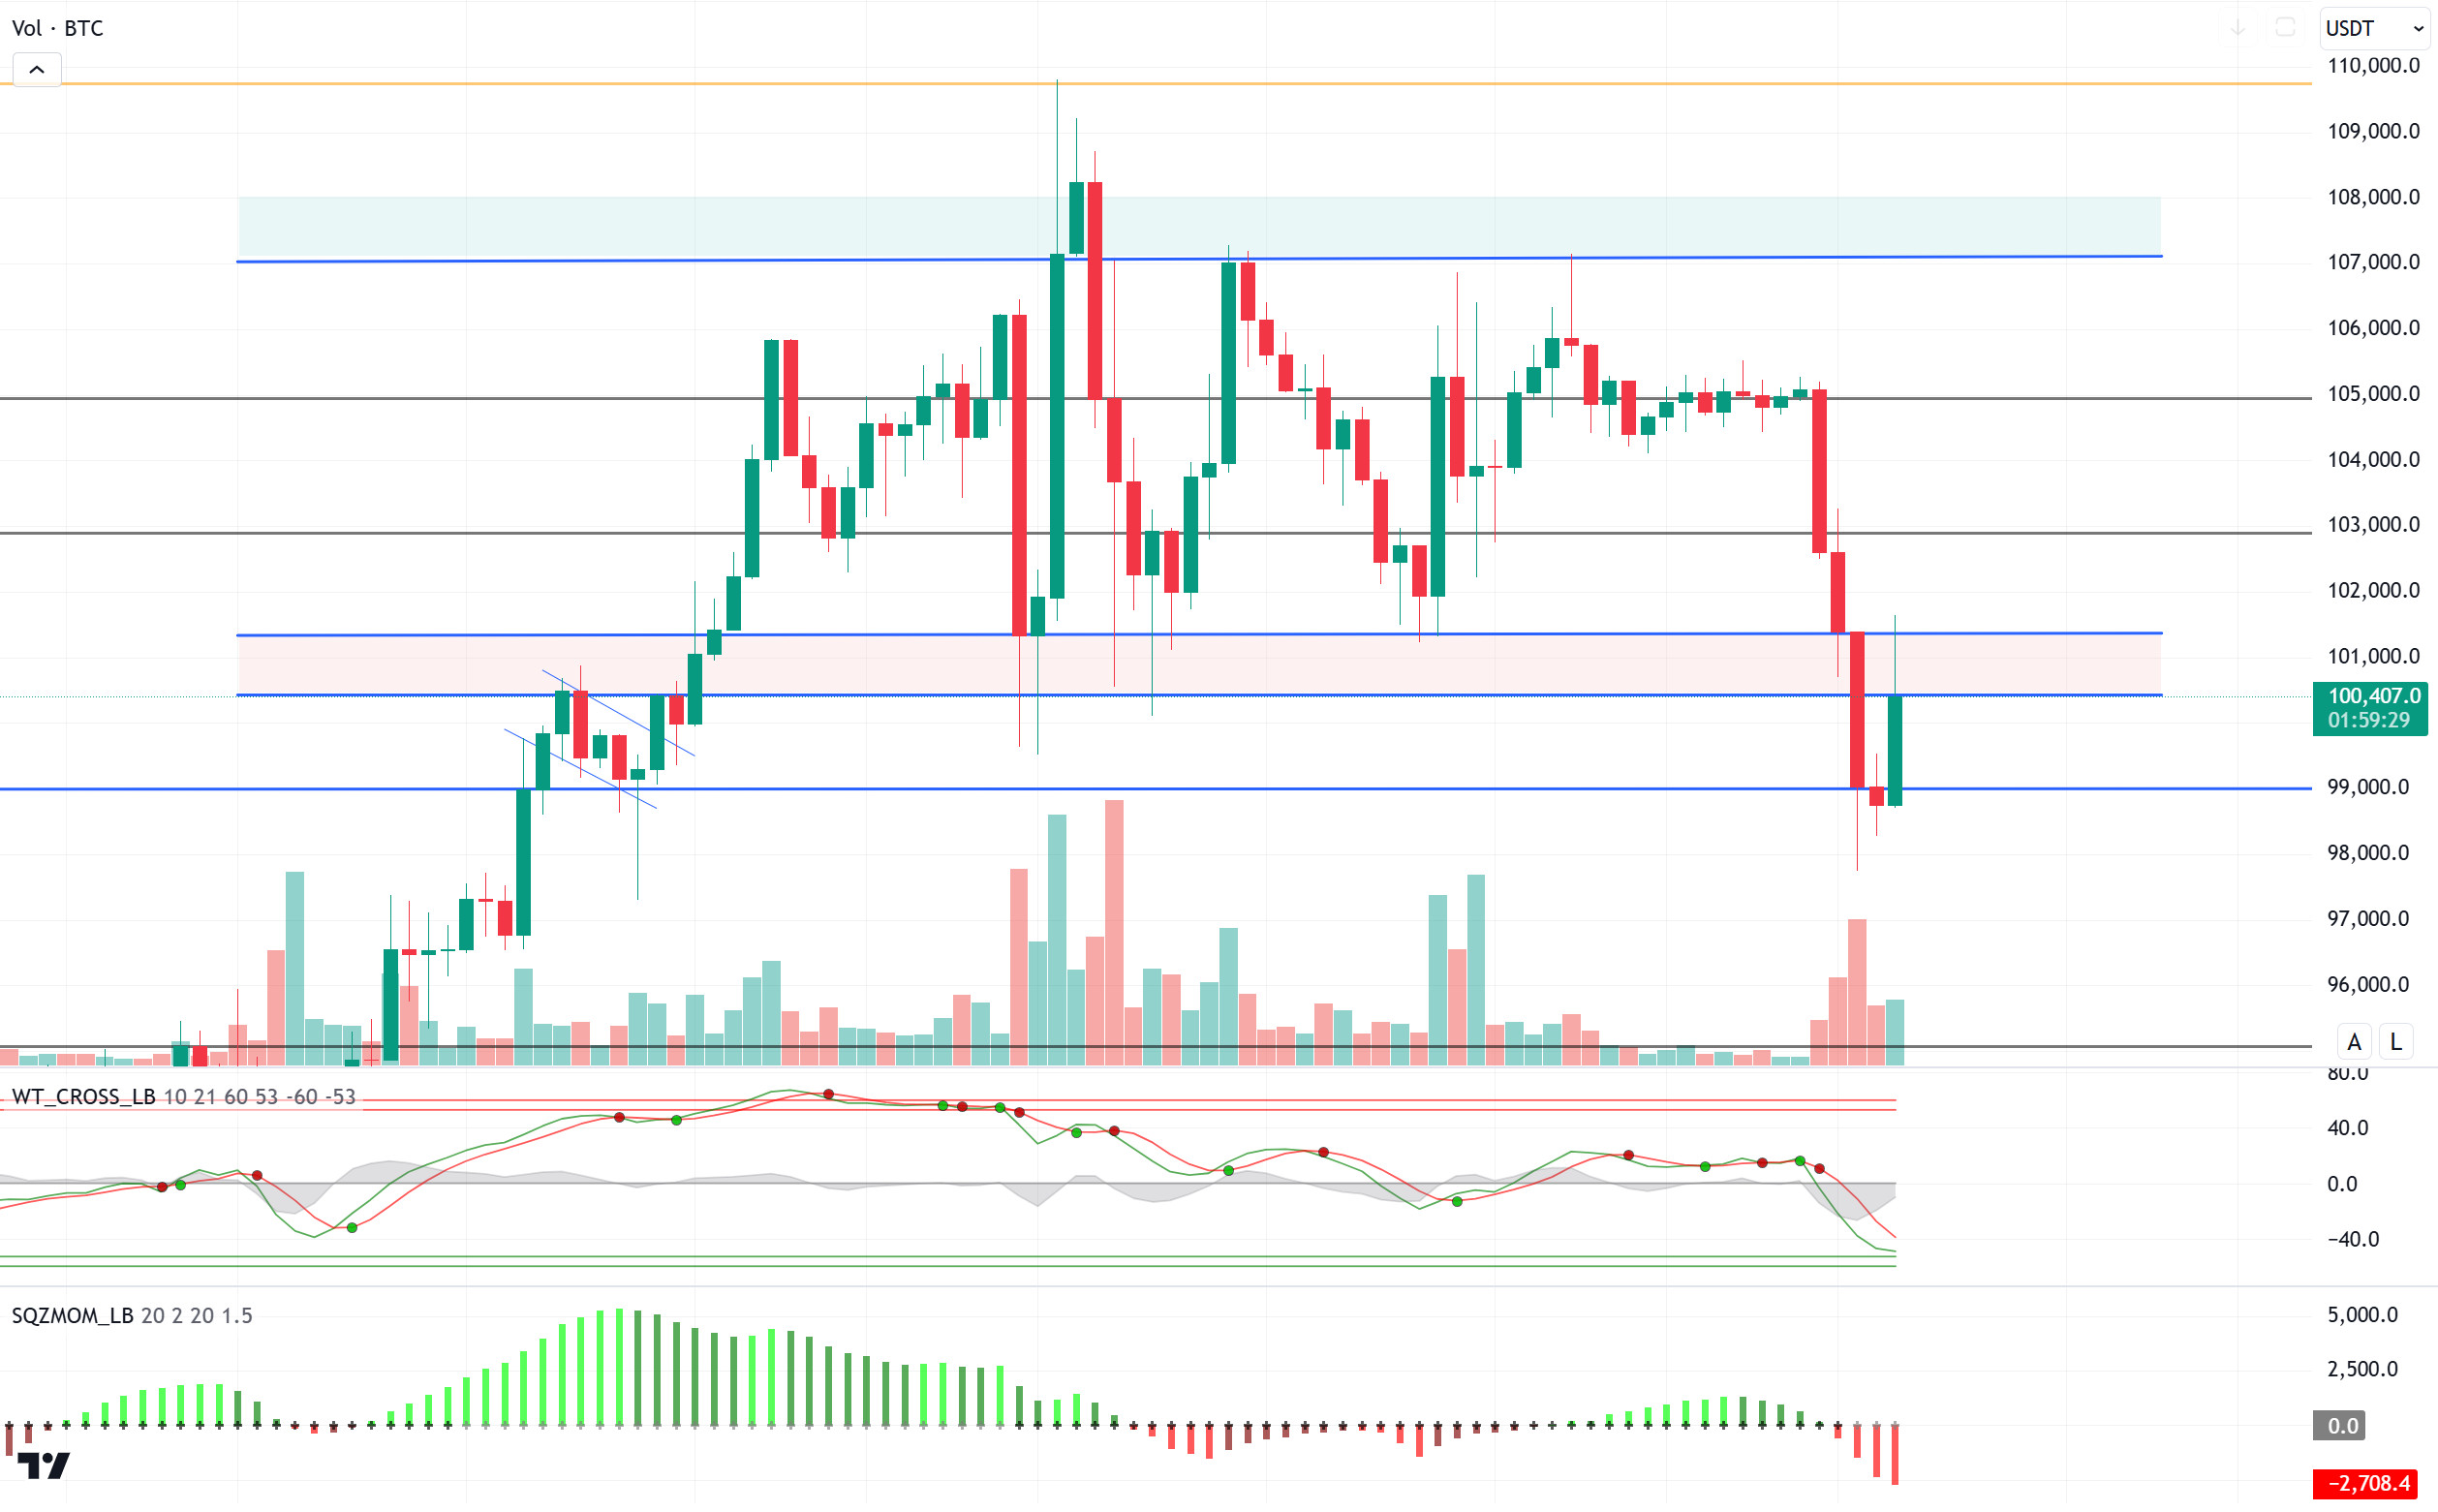
Following Trump’s decrees supporting the crypto sector, crypto funds saw a total net inflow of $1.8 billion last week. However, some of these gains were reversed at the beginning of the week. On the other hand, MicroStrategy continues to buy Bitcoin unabated. According to the company’s 8-K filing, MicroStrategy purchased 10,107 units of Bitcoin at a cost of $105,596 between Enero 21 and 26, 2025 for approximately $1.1 billion.
Looking at the technical outlook, BTC, which fell to 97,700 during the day, recovered again. The price exceeded the resistance level of 99,100 and tested the 101,400-resistance point. In BTC, which is currently trading at 100,500, technical oscillators are moving in the oversold zone, although they have not yet given a buy signal. With the arrival of the buy signal, we can expect the price to reach 103,000 levels again by exceeding the resistance level of 101,400 as a result of the momentum indicator regaining strength. If the selling pressure continues, the 99,100 level is critical for staying in the positive zone.
Supports 99,100 – 98,000 – 97,200
Resistances 101,400 – 102,800 – 105,000
ETH/USDT
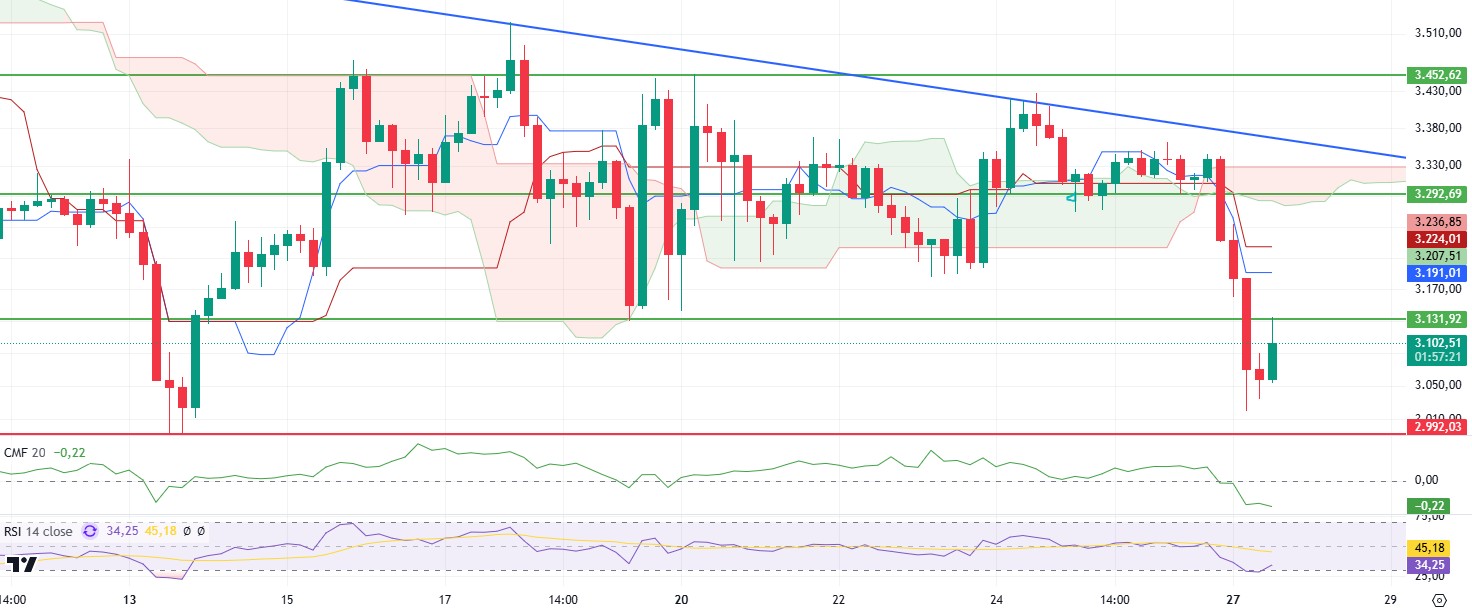
Ethereum (ETH), which fell as low as $ 3,020 during the night, recovered during the day and reached $ 3,131, but the rise was limited with a slight reaction from this level.
Chaikin Money Flow (CMF) has started to move sideways after previous sharp declines. This is a positive signal that the selling pressure is easing and the price may recover. It is possible to say that capital outflows in the market have decreased and the buy side remains strong. Relative Strength Index (RSI), on the other hand, continues its upward movement from the oversold zone. Its rise without divergence indicates that the price has found support at current levels and the decline is slowing down. The momentum indicator has broken the downtrend and turned upwards in line with the RSI.
In line with this technical data, if the price closes above the $3,131 level, it supports that the decline is a correction and the price may continue its upward movement. In this scenario, it is possible for the price to target levels of $3,292 and above. However, closes below the $3,131 level could lead to a re-acceleration of the declines and a decline in the price to the $2,992 support. Below this level, selling pressure is likely to increase.
Supports 2,992 – 2,890 – 2,781
Resistances 3,131 – 3,292 – 3,452
XRP/USDT
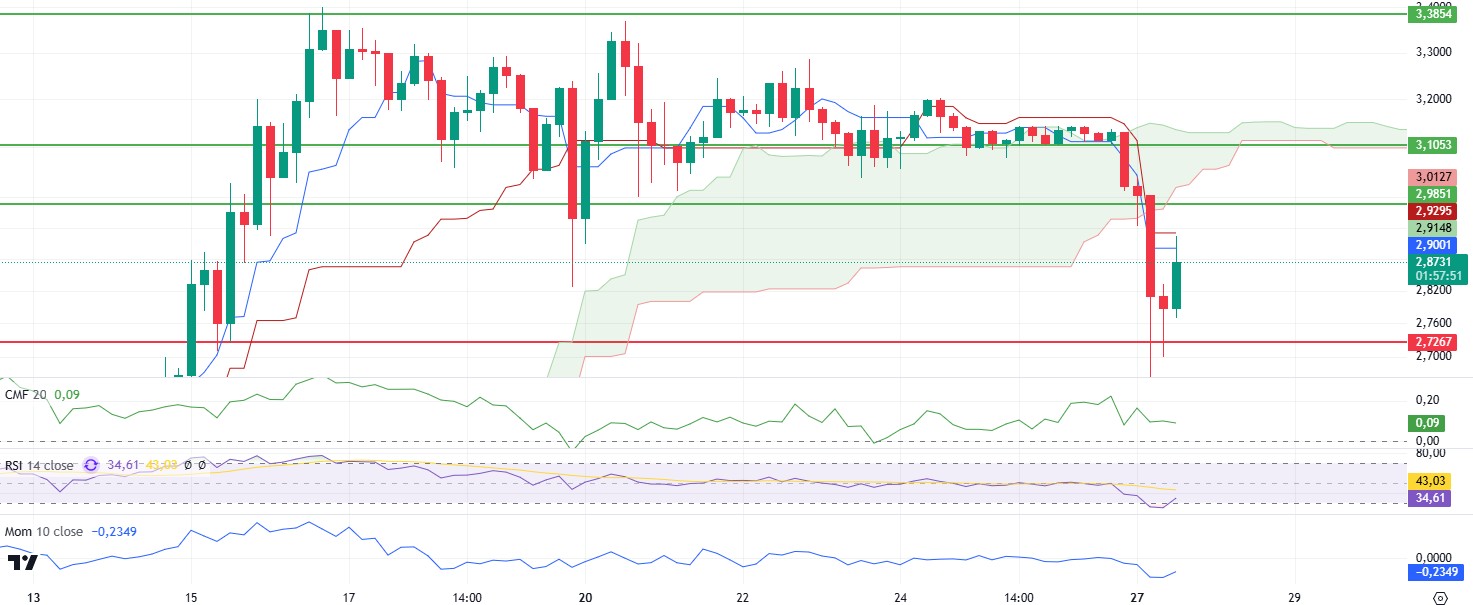
Although XRP momentarily sagged below 2.72 support during the day, it managed to rise up to 2.90 by quickly getting support from this region. It has retreated slightly with the sales pressure it received from this region.
Indicators are on the rise, accompanying the price recovery. Chaikin Money Flow (CMF) is moving horizontally in the positive area, indicating that buyers remain strong. Relative Strength Index (RSI) has turned upwards, leaving the oversold zone. Momentum also seems to be strengthening.
With this data, as stated in the morning analysis, it seems possible that the price may rise to 2.98 levels, provided that the price does not close below the 2.72 level . However, closures below the 2.72 level may start a new downtrend.
Supports 2.7268 – 2.4727 – 2.1800
Resistances 2.9851 – 3.1053- 3.3854
SOL/USDT
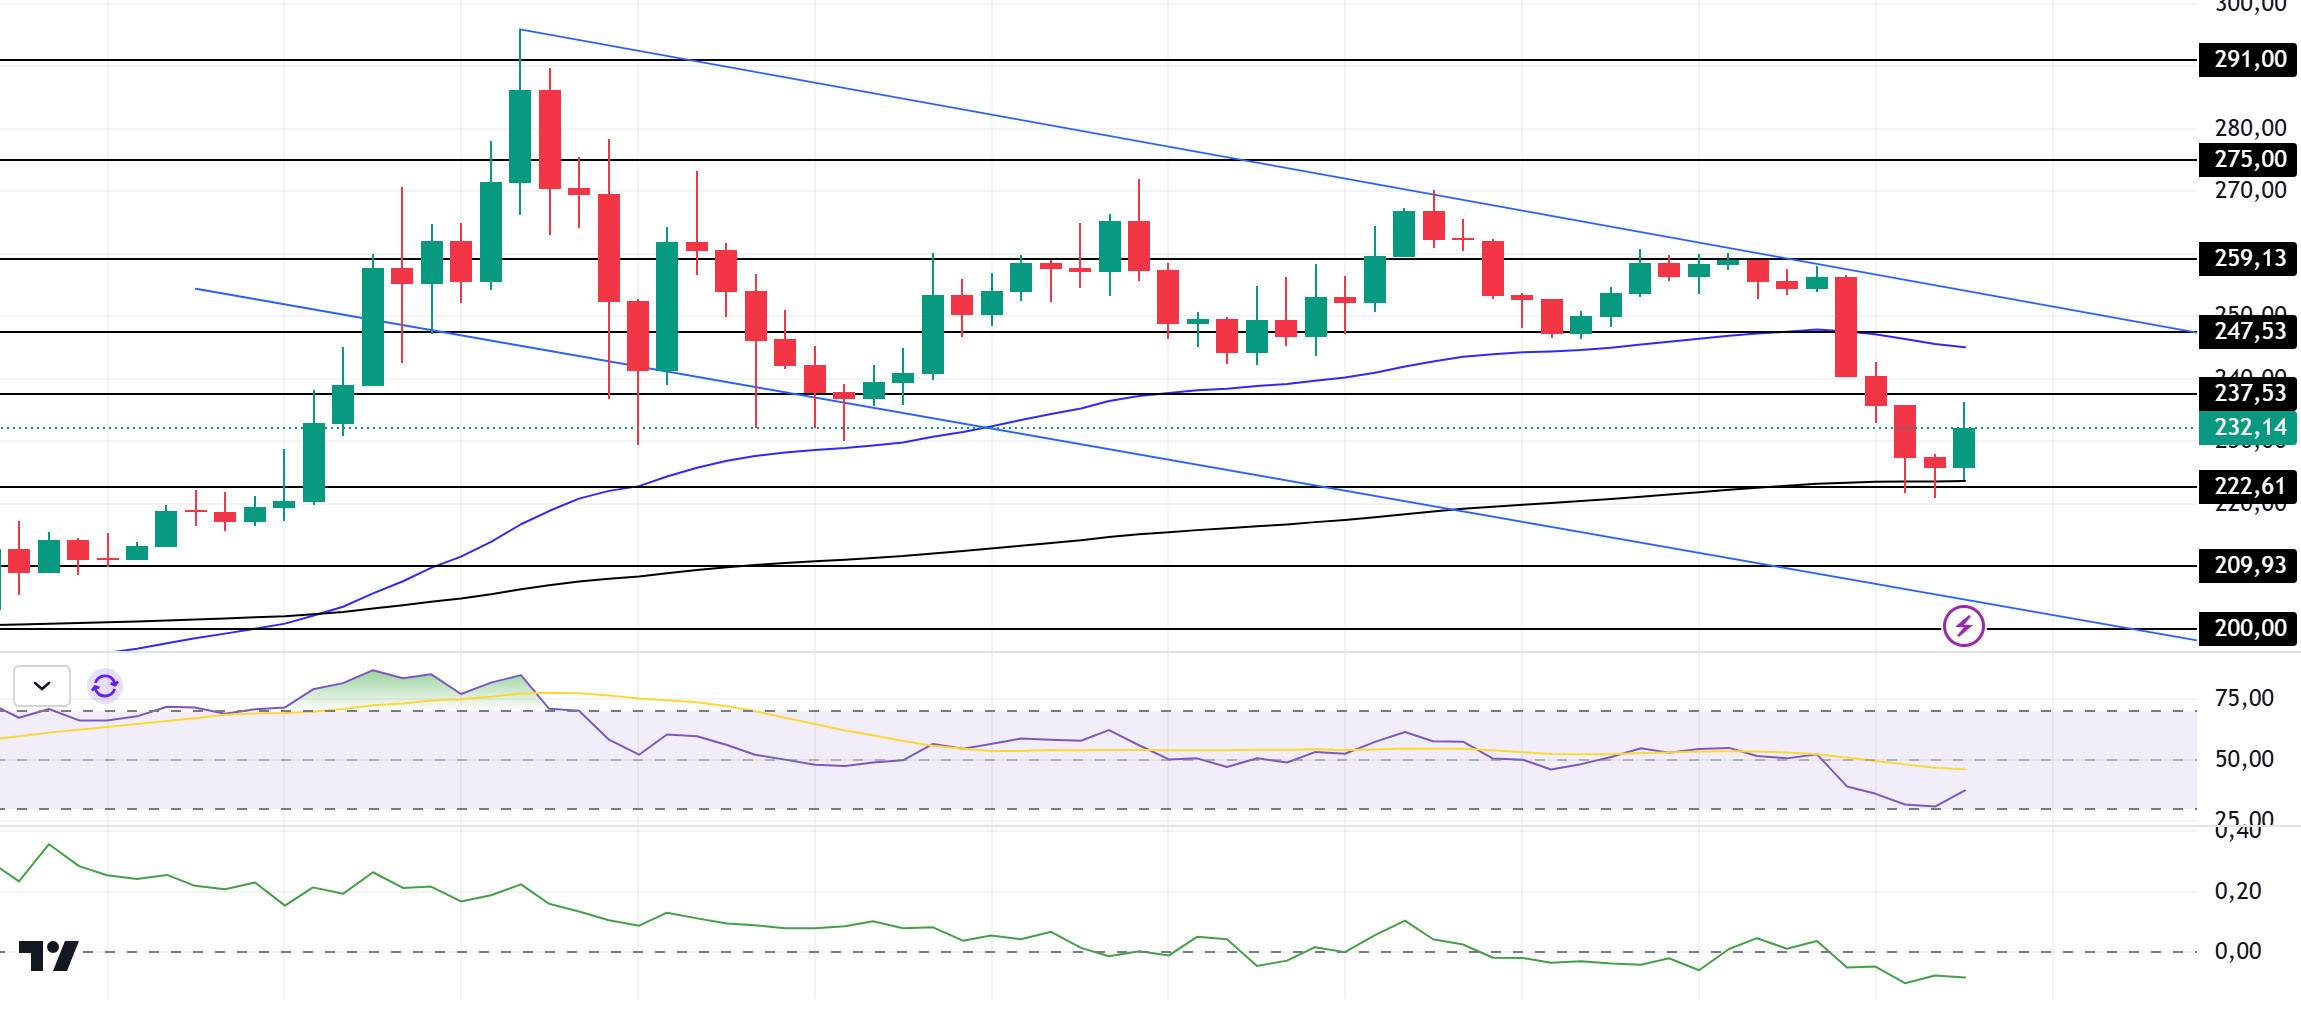
SOL continued to resume the downtrend that started on Enero 19th. This morning’s decline has turned bullish after the price took support from the 200 EMA. On the 4-hour timeframe, the 50 EMA (Blue Line) remains above the 200 EMA (Black Line). This could mean that the uptrend will continue in the medium term. At the same time, the asset is located between the 50 EMA and the 200 EMA. When we examine the Money Flow (CMF)20 indicator, it came from the neutral zone to the middle levels of the negative zone and money outflows are decreasing. However, the Relative Strength Index (RSI)14 indicator has risen from the oversold zone to the mid-levels of the negative zone. This can be seen as a bullish opportunity. The 259.13 level stands out as a very strong resistance point in the rises driven by both the upcoming macroeconomic data and the news in the Solana ecosystem. If it breaks here, the rise may continue. In case of retracements for the opposite reasons or due to profit sales, the 209.93 support level can be triggered. If the price reaches these support levels, a potential bullish opportunity may arise if momentum increases.
Supports 222.61 – 209.93 – 200.00
Resistances 237.53 – 247.43 – 259.13
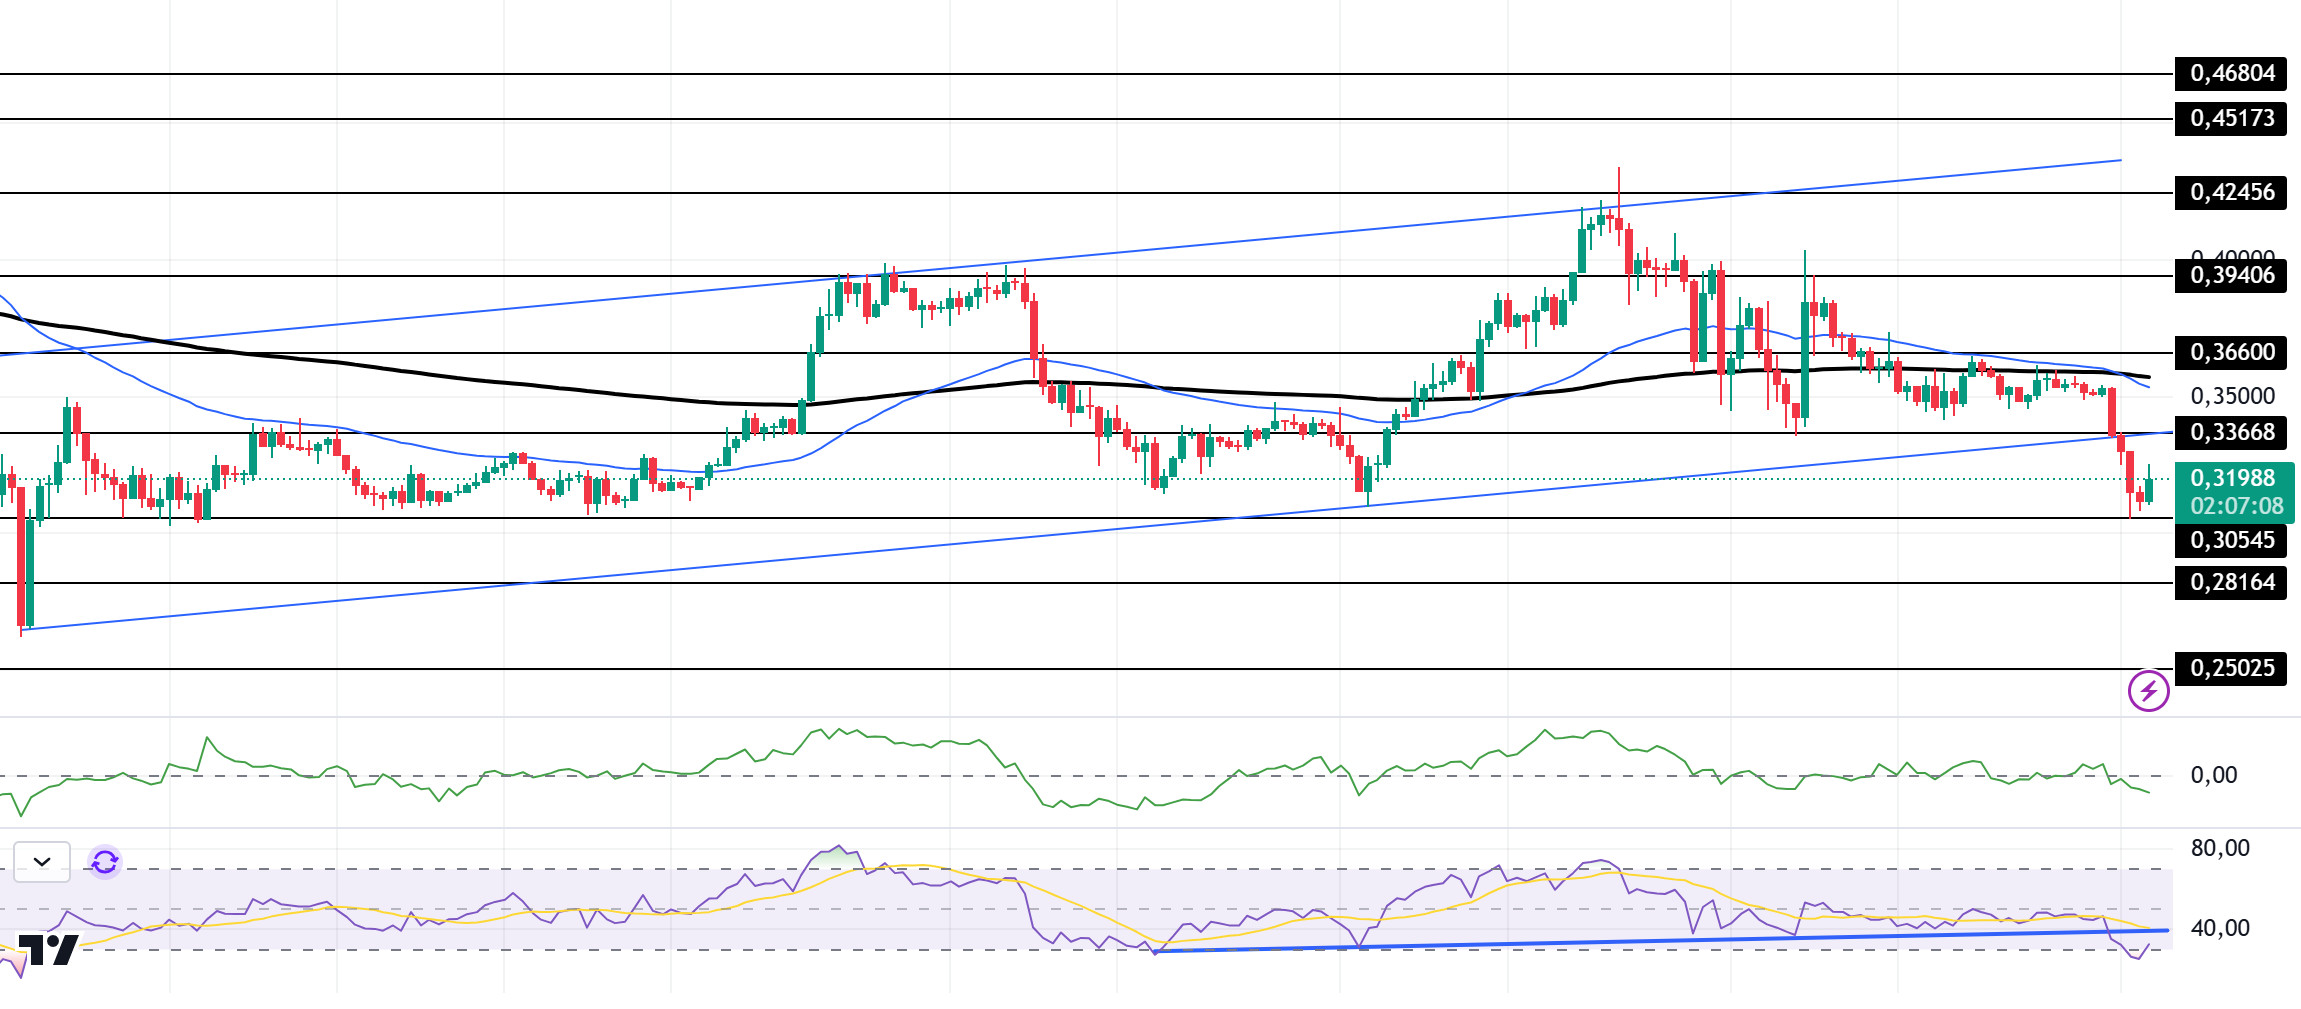
DOGE/USDT
DOGE has moved sideways since our morning analysis. It broke the uptrend it started in the 20% range with a strong downside candle. Facing strong resistance at the 50 EMA (Blue Line) and 200 EMA (Black Line), the asset failed to break it and started to decline. On the 4-hour timeframe, the 50 EMA is now below the 200 EMA. This may mean that the decline may deepen in the medium term. At the same time, the price is below the 50 EMA (Blue Line) and the 200 EMA (Black Line). When we examine the Chaikin Money Flow (CMF)20 indicator, it moved from positive to negative territory and money outflows increased. However, Relative Strength Index (RSI)14 is at the mid-level of the negative zone from the oversold zone. The 0.39406 level is a very strong resistance point in the rises due to political reasons, macroeconomic data and innovations in the DOGE coin. In case of possible pullbacks due to political, macroeconomic reasons or negativities in the ecosystem, the 0.28164 level, which is the base level of the trend, is an important support. If the price reaches these support levels, a potential bullish opportunity may arise if momentum increases.
Supports 0.30545 – 0.28164 – 0.25025
Resistances 0.33668 – 0.36600 – 0.39406
AVISO LEGAL
La información sobre inversiones, los comentarios y las recomendaciones que figuran en este documento no constituyen asesoramiento en materia de inversiones. Los servicios de asesoramiento en materia de inversión son prestados individualmente por instituciones autorizadas teniendo en cuenta las preferencias de riesgo y rentabilidad de los particulares. Los comentarios y recomendaciones aquí contenidos son de carácter general. Estas recomendaciones pueden no ser adecuadas para su situación financiera y sus preferencias de riesgo y rentabilidad. Por lo tanto, tomar una decisión de inversión basándose únicamente en la información aquí contenida puede no producir resultados acordes con sus expectativas.
