
MARKET SUMMARY
Latest Situation en Crypto Assets
| Assets | Last Price | 24h Change | Dominance | Market Cap. |
|---|---|---|---|---|
| BTC | 102,655.82 | 2.14% | 58.06% | 2,03 T |
| ETH | 3,179.57 | 2.36% | 10.94% | 383,22 B |
| XRP | 3.158 | 9.47% | 5.20% | 182,05 B |
| SOLANA | 236.97 | 2.05% | 3.29% | 115,30 B |
| DOGE | 0.3320 | 3.38% | 1.40% | 49,09 B |
| CARDANO | 0.9583 | 5.36% | 0.96% | 33,73 B |
| TRX | 0.2457 | 1.79% | 0.60% | 21,17 B |
| LINK | 23.81 | 2.34% | 0.43% | 15,21 B |
| AVAX | 33.81 | 0.98% | 0.40% | 13,92 B |
| SHIB | 0.00001885 | 3.56% | 0.32% | 11,12 B |
| DOT | 5.886 | 2.12% | 0.26% | 9,09 B |
*Prepared el 1.28.2025 at 14:00 (UTC)
WHAT’S LEFT BEHIND
Trading Volume of Hong Kong Virtual Asset ETFs Reaches HK$18.5 Million
Hong Kong exchange data showed that the total trading volume of virtual asset ETFs today was approximately HK$18,526,710.
Arizona Senate moves forward with Bitcoin Reserve Bill
The Arizona Senate is planning to make a significant change with the Bitcoin reserve bill, which would allow public funds and pensions to invest en Bitcoin. This could be a turning point en cryptocurrency adoption.
Metaplanet Aims to Increase Bitcoin Holdings to 10,000 por the End of 2025
Japanese investment firm Metaplanet plans to increase its Bitcoin holdings por raising a fund of $745.5 million. The company aims to increase its current 1,761 BTC holdings to 10,000 BTC por the end of 2025.
dYdX 2024 Annual Report: Trading Volume Reached $270 Billion
According to dYdX’s 2024 Ecosystem Report, the platform’s annual trading volume reached $270 billion and cumulative trading volume reached $1.46 trillion. DYDX holders increased 290%, total Mega Vault deposits reached $79 million, and the community distributed $63 million en trading rewards.
HIGHLIGHTS OF THE DAY
Important Economic Calender Data
| Time | Noticias | Expectation | Previous |
|---|---|---|---|
| 15:00 | US CB Consumer Confidence (Jan) | 105.7 | 104.7 |
INFORMATION:
*The calendar is based el UTC (Coordinated Universal Time) time zone.
The economic calendar content el the relevant page is obtained from reliable news and data providers. The news en the economic calendar content, the date and time of the announcement of the news, possible changes en the previous, expectations and announced figures are made por the data provider institutions. Darkex cannot be held responsible for possible changes that may arise from similar situations
MARKET COMPASS
After the DeepSeek shock, global markets are struggling to recover. European stock markets are positive and Nasdaq futures, seen as the US technology index, point to a bullish start to the new day. Digital assets, el the other hand, seem to have taken a break from the recovery trend following the recent declines. After today’s macro indicators, markets are waiting for the results of the Federal Open Market Committee (FOMC) meeting, which will be completed tomorrow. For the short term, we think that the recovery trend may continue, albeit weakly.
From the short term to the big picture.
The victory of former President Trump el November 5, one of the main pillars of our bullish expectation for the long-term outlook en digital assets, produced a result en line with our predictions. In the aftermath, the appointments made por the president-elect and the increasing regulatory expectations for the crypto ecosystem en the US and the emergence of BTC as a reserve continued to be en our equation as positive variables. Then, 4 days after taking over the White House, the new President signed the decree of the Cryptocurrency Work Unit, which was among his election promises, and we think that the outputs it will produce en the coming days will continue to reflect positively el digital assets.
On the other hand, although it is expected to continue at a slower pace, the expectations that the FED will continue its interest rate cut cycle (for now) and the fact that the volume en ETFs based el crypto assets indicates an increase en institutional investor interest support our upward forecast for the big picture for now. In the short term, given the nature of the market and pricing behavior, we think it would not be surprising to see occasional pauses or pullbacks en digital assets. However, at this point, it is worth emphasizing again that we think that the fundamental dynamics continue to be bullish.
TECHNICAL ANALYSIS
BTC/USD
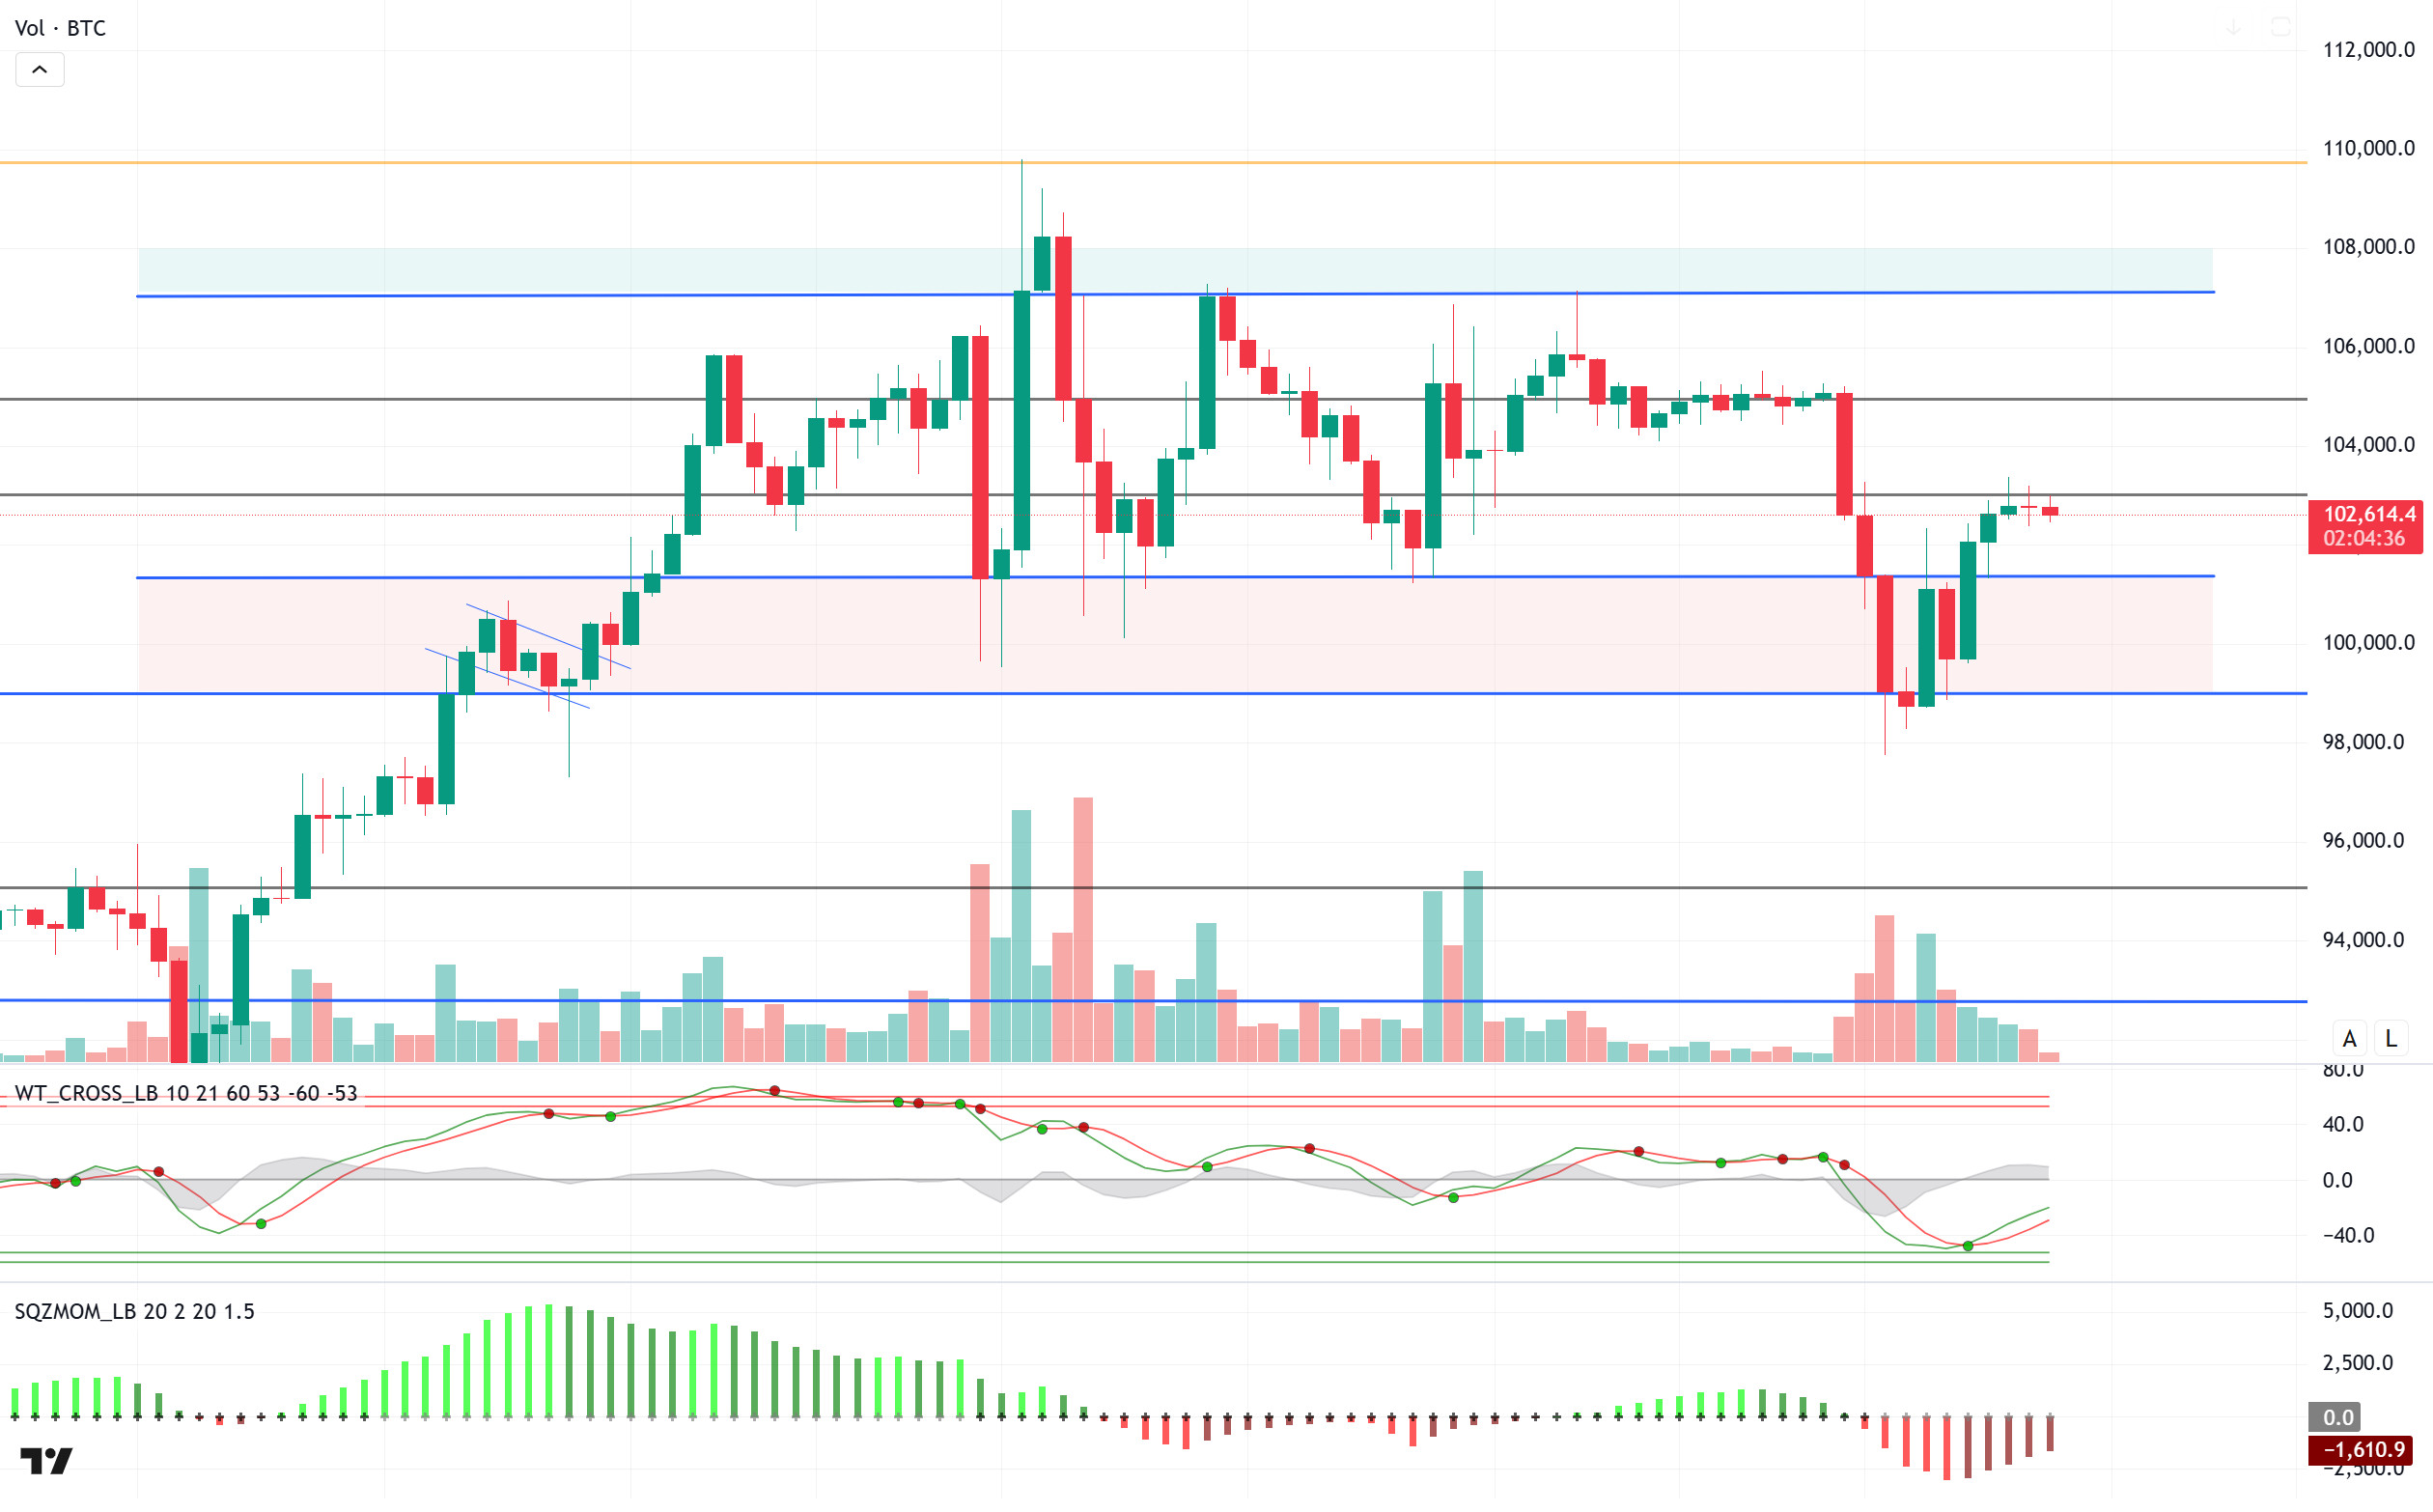
Bitcoin continues to rebound weakly amid macroeconomic factors, Nvidia news and a general sell-off en tech stocks. In the options market, the heavy trading of put options with a strike price of USD 96,000-98,000 indicates that the downtrend may continue ahead of the FED interest rate decision. Moreover, the accumulation of long positions at levels where put options are dominant en the futures market is noteworthy.
Looking at the technical outlook, we observe that the price tested above the resistance level of 103,000 and did not last. In BTC, which is currently trading at 102,600, technical oscillators continue to maintain the weakening buy signal, while the momentum indicator continues to gain some more strength. In the continuation of the rise, closures above the 103,000 level will be followed and the 105,000 level is targeted. In the event of a decline, we will follow the 101,400-support level, and the breakdown may be tested below six-digit levels again.
Supports: 101,400 – 99,100 – 98,000
Resistances 103,000 – 105,000 – 107,000
ETH/USDT
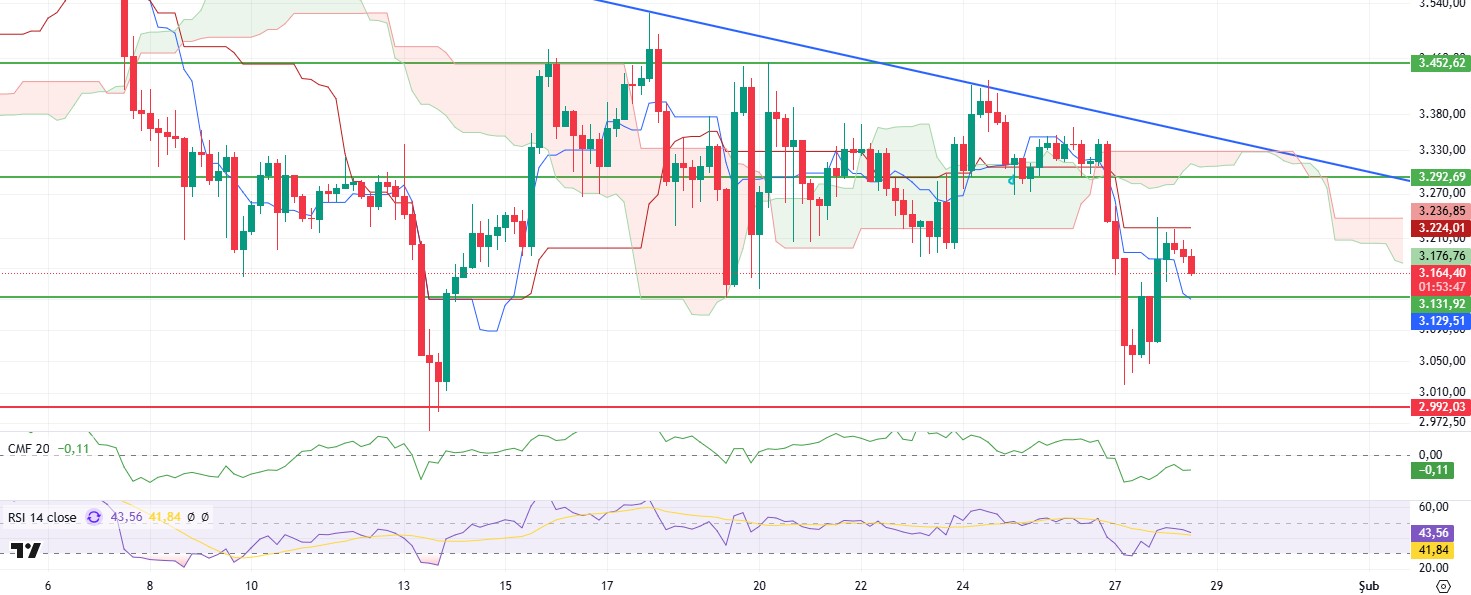
ETH was slightly lower during the day el low trading volume. While selling pressure, especially from the kijun line, dragged price action without volume, technical indicators offer important clues about the overall market situation.
The Chaikin Money Flow (CMF) indicator has gained momentum to the upside, signaling that buyers are starting to regain strength en the market. However, CMF is still en negative territory, suggesting that capital inflows have not yet reached sufficient levels. The Relative Strength Index (RSI), el the other hand, has recovered after breaking out of oversold territory, but is signaling a slight pullback, accompanying the slight decline en price. Nevertheless, the overall trend suggests that the RSI maintains its positive outlook.
In order for the price to re-enter the uptrend, the 3,224 level, where the intermediate resistance point and the kijun level are located, must be exceeded. If it holds above this level, the next target will be 3,292. If this area is crossed, the 3,329 level, the intersection of the kumo cloud and the trend line, is an important resistance area. A break above these levels could trigger a stronger rally. Otherwise, a break below the kijun level could increase the risk of a downside move. In such a scenario, the first support point could be the 3,131 level. If this support is broken, a deeper retracement to 2,992 levels may occur.
Supports 3,131 – 2,992 – 2,890
Resistances 3,292 – 3,350 – 3,452
XRP/USDT
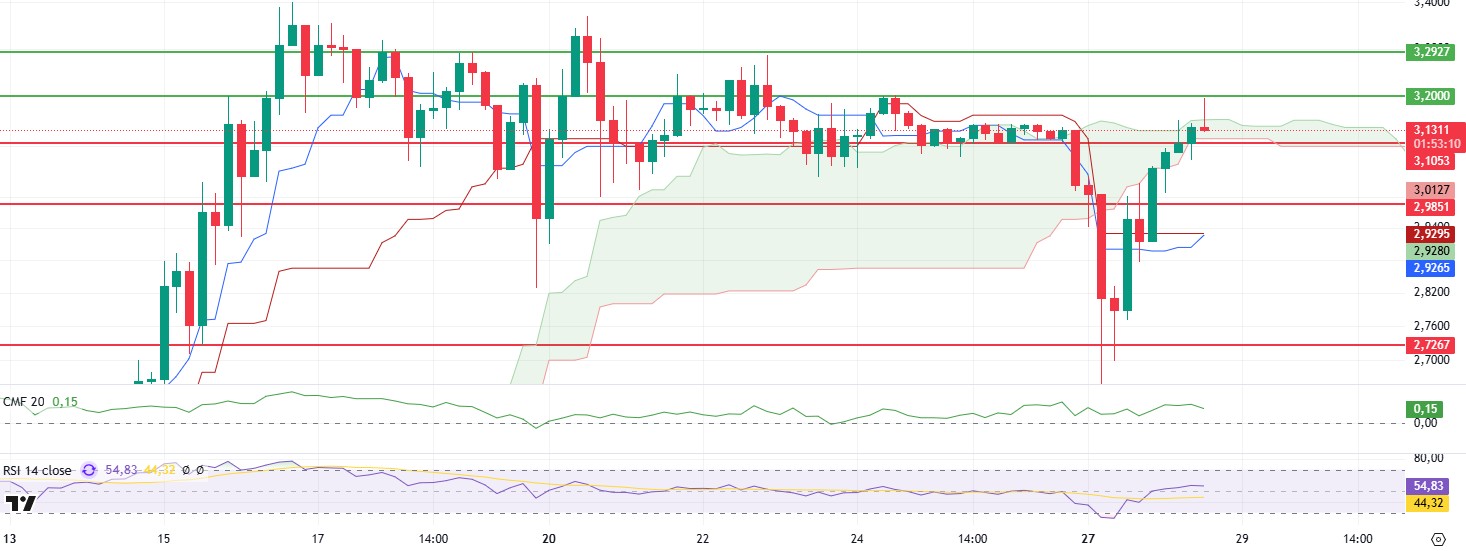
XRP managed to break through the sand cloud resistance during the day, rising as high as 3.20. However, strong selling pressure from this area pulled the price back to the limits of the sand cloud. This move is a sign of market indecision.
The Chaikin Money Flow (CMF) indicator continues to retreat, reflecting the weakness en capital flows. On the other hand, the upward trend en the Relative Strength Index (RSI) and momentum indicators suggest that buyers are still active en the market and the potential for a price rebound remains.
From a technical point of view, a retest of the 3.20 level seems likely en case of a close above the Kumo cloud en the evening horas. If this level can be strongly breached, the next target for the price will be the 3.29 level. A break of this resistance zone could further accelerate the upside movement and take XRP to a new uptrend. In the downside scenario, the 3.10 level stands out as the most critical support point to watch carefully. Pricing below this level could disrupt XRP’s positive outlook and result en a deeper pullback. In such a case, if the price remains under the kumo cloud again, it may increase selling pressure.
Supports 3.1053 – 2.9851 – 2.7267
Resistances 3.2000 – 3.2927- 3.3854
SOL/USDT
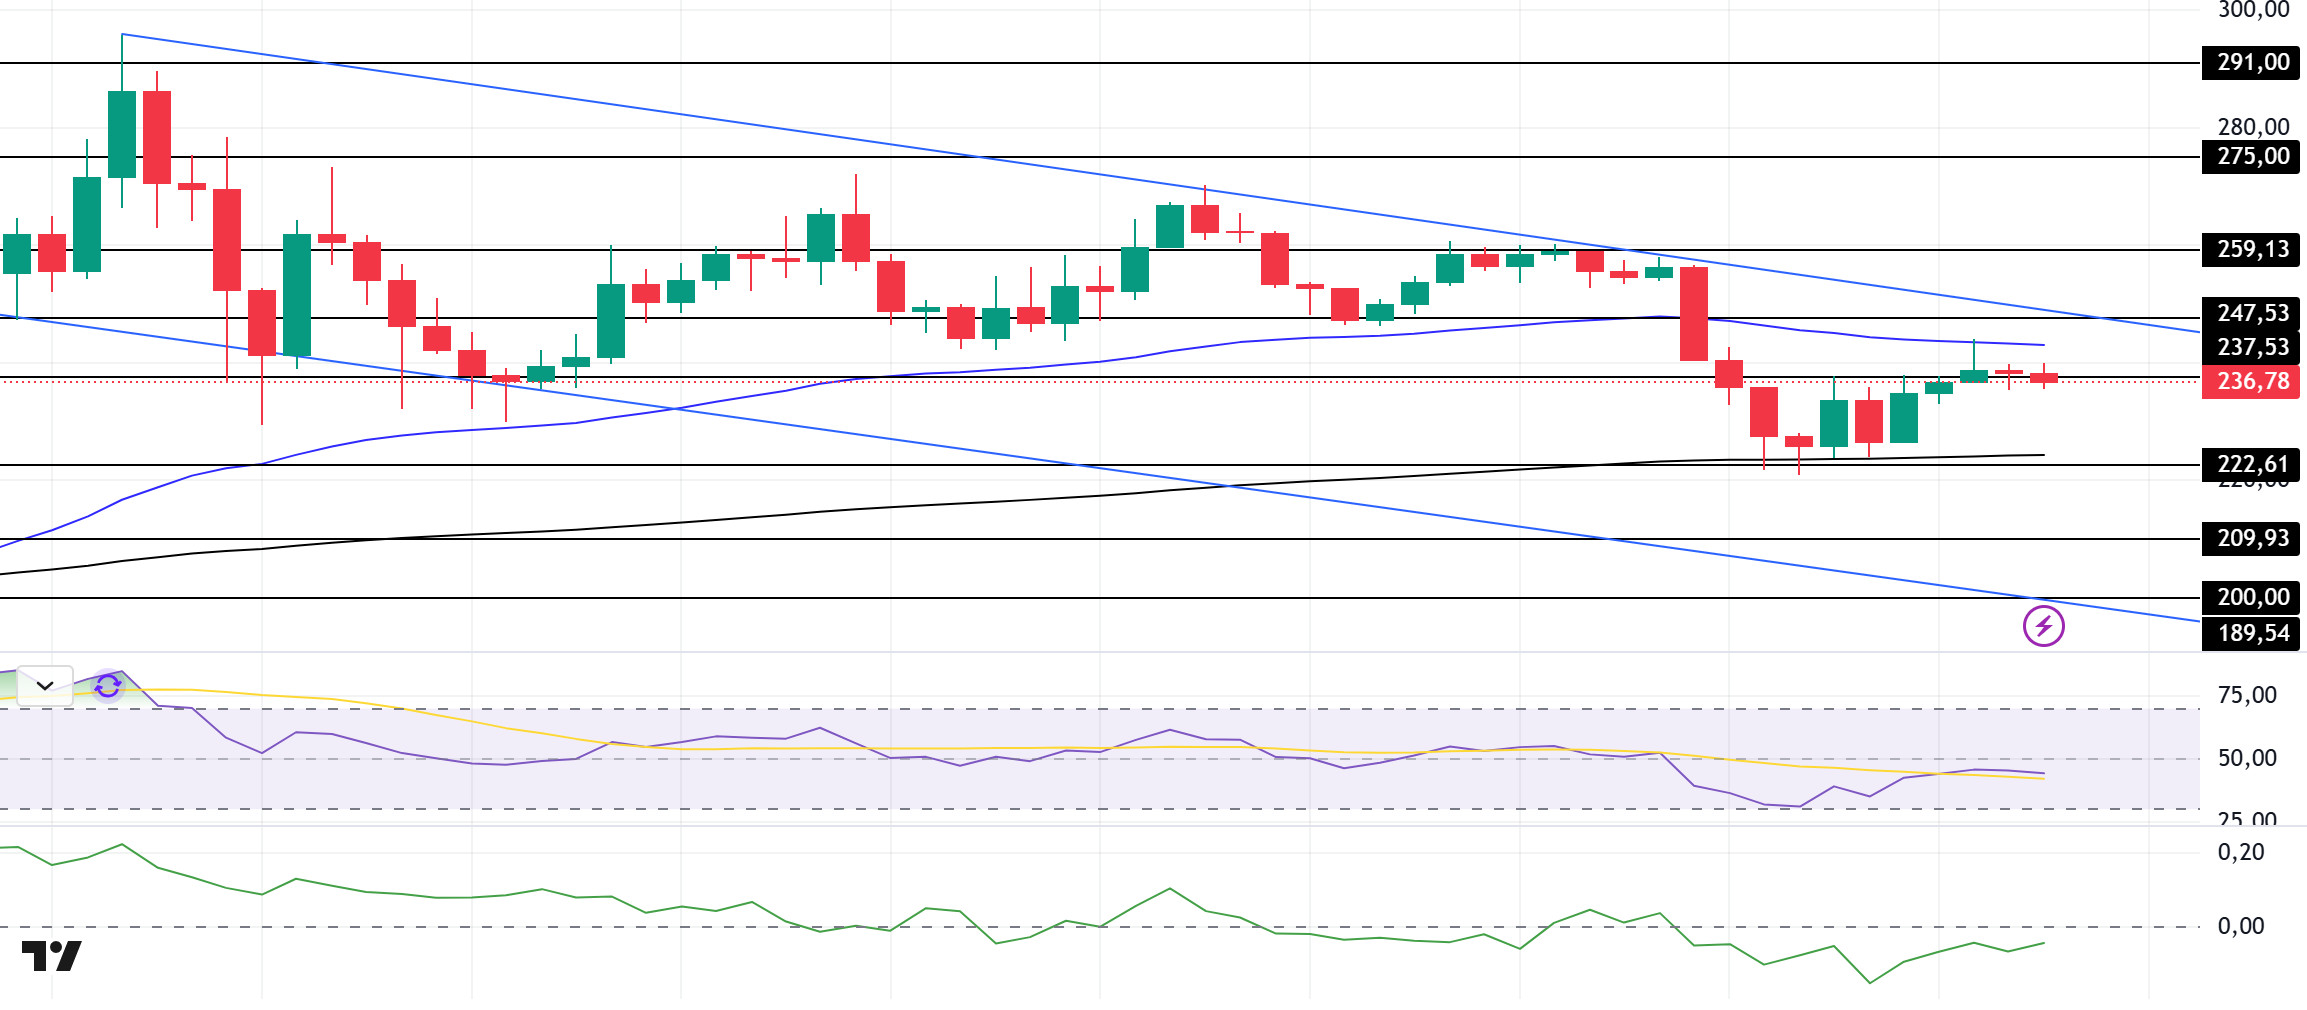
SOL continues to maintain the downtrend that started el January 19, pricing en the near-resistance zone of the downtrend. The asset turned bullish after taking support from the 200 EMA. On the 4-hora timeframe, the 50 EMA (Blue Line) continues to be above the 200 EMA (Black Line). This could mean that the uptrend will continue en the medium term. At the same time, the asset is located between the 50 EMA and the 200 EMA and tested the 50 EMA as resistance but failed to break it and retreated slightly. When we examine the Chaikin Money Flow (CMF)20 indicator, it has approached the neutral zone from the negative zone. However, the Relative Strength Index (RSI)14 indicator has risen from the oversold zone to the neutral zone levels. This can be seen as an opportunity for selling. The 259.13 level stands out as a very strong resistance point en the rises driven por both the upcoming macroeconomic data and the news en the Solana ecosystem. If it breaks here, the rise may continue. In case of retracements for the opposite reasons or due to profit sales, the 209.93 support level can be triggered. If the price reaches these support levels, a potential bullish opportunity may arise if momentum increases.
Supports 237.53 – 222.61 – 209.93
Resistances 247.43 – 259.13 – 275.00
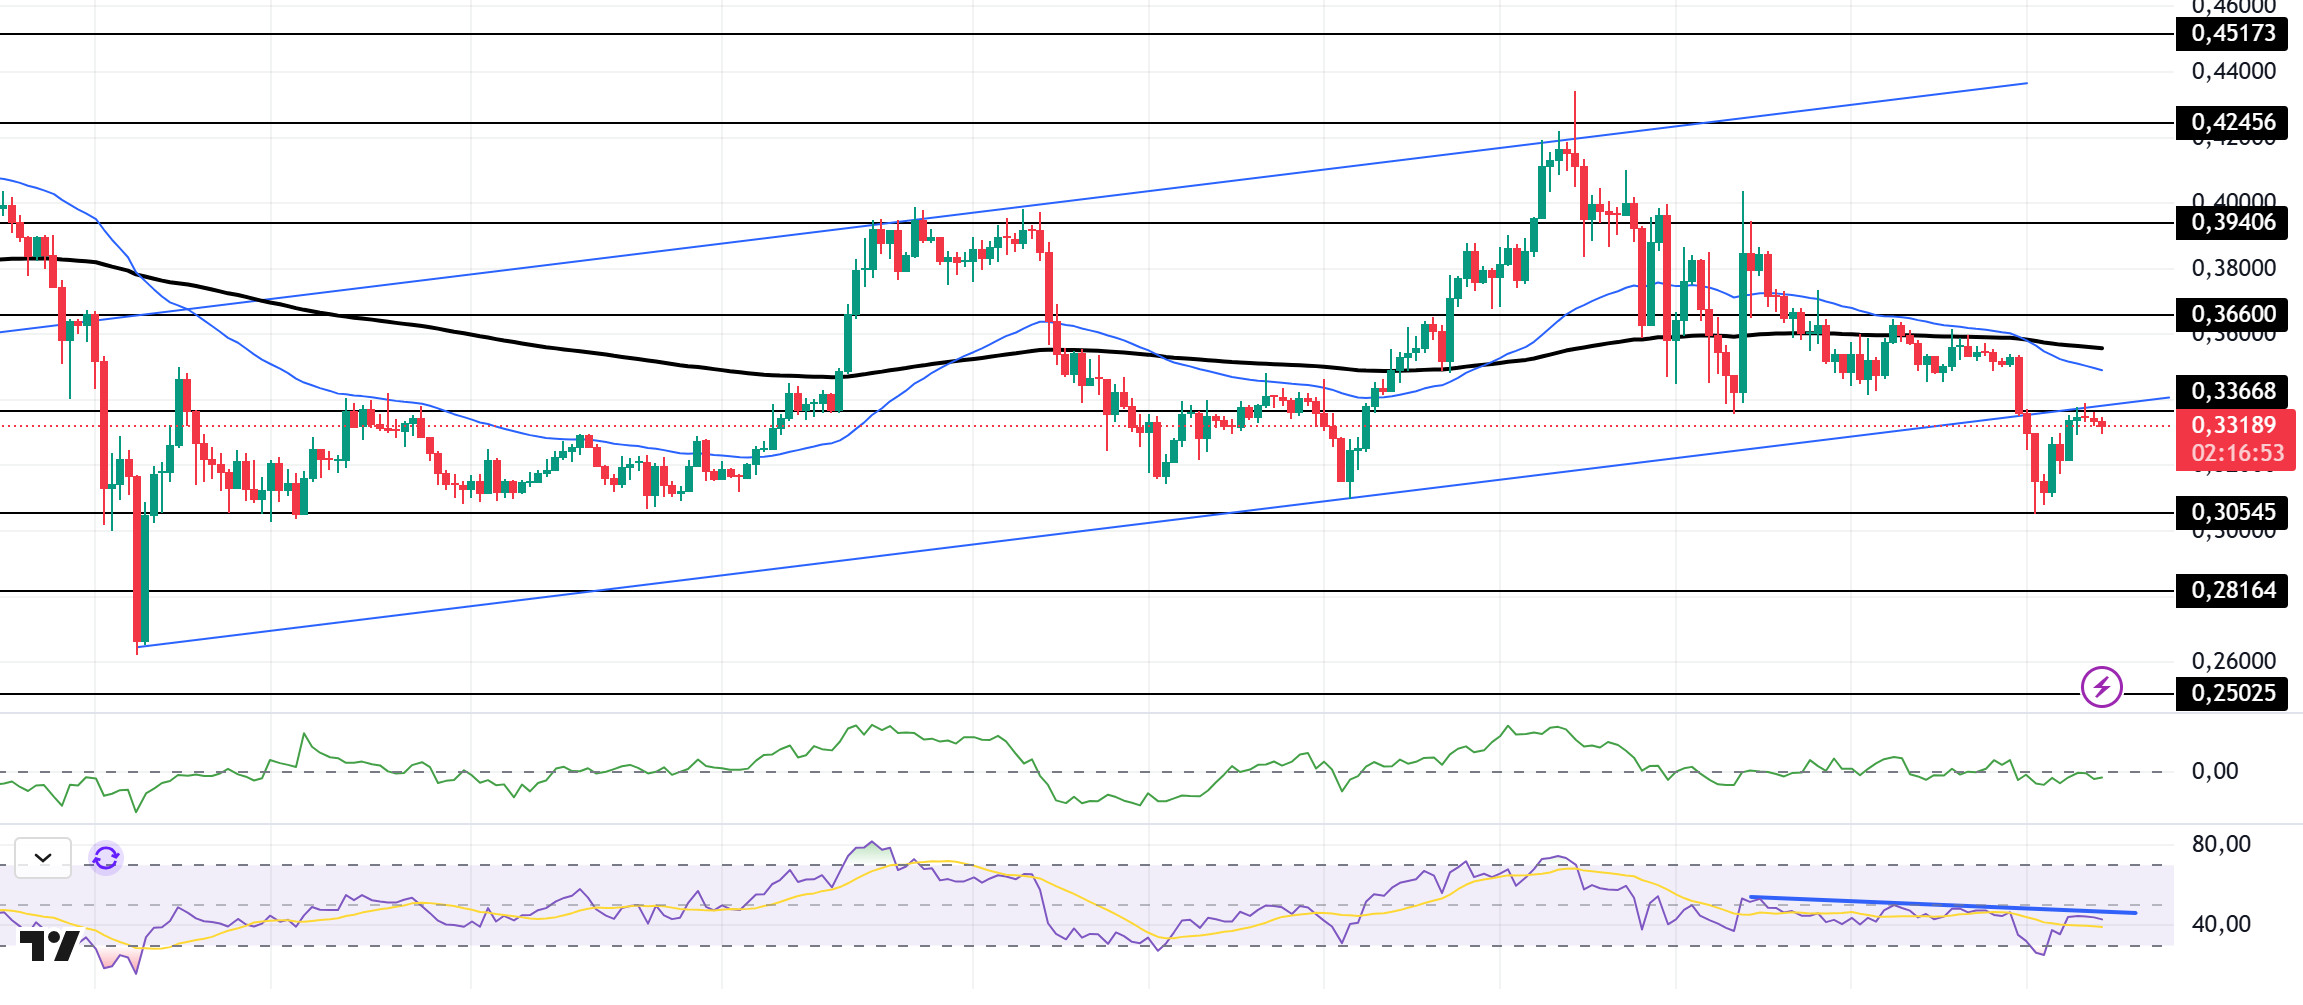
DOGE/USDT
Elon Musk invited Dogecoin founder Shibetoshi Nakamoto to join DOGE (Department of Government Efficiency), creating optimism among the bullish dynamics reflected por the DOGE price.
DOGE has remained sideways since our morning analysis. Having broken the December 20 uptrend with a strong downside candle, at the time of writing, the asset is testing the base level of the uptrend as resistance. On the 4-hora timeframe, the 50 EMA (Blue Line) has started to be below the 200 EMA (Black Line). This could mean that the decline could deepen en the medium term. At the same time, the price is below the 50 EMA (Blue Line) and the 200 EMA (Black Line). When we examine the Chaikin Money Flow (CMF)20 indicator, it is en the negative zone, close to the neutral zone, but money inflows and outflows are en balance. However, the Relative Strength Index (RSI)14 is en the negative zone near the neutral level. At the same time, the RSI indicator is testing the resistance of the downtrend. The 0.39406 level appears to be a very strong resistance point en the rises due to political reasons, macroeconomic data and innovations en the DOGE coin. In case of possible pullbacks due to political, macroeconomic reasons or negativities en the ecosystem, the 0.28164 level, which is the base level of the trend, is an important support. If the price reaches these support levels, a potential bullish opportunity may arise if momentum increases.
Supports 0.30545 – 0.28164 – 0.25025
Resistances 0.33668 – 0.36600 – 0.39406
LEGAL NOTICE
The investment information, comments and recommendations contained herein do not constitute investment advice. Investment advisory services are provided individually por authorized institutions taking into account the risk and return preferences of individuals. The comments and recommendations contained herein are of a general nature. These recommendations may not be suitable for your financial situation and risk and return preferences. Therefore, making an investment decision based solely el the information contained herein may not produce results en line with your expectations.
