
MARKET SUMMARY
Latest Situation en Crypto Assets
| Assets | Last Price | 24h Change | Dominance | Market Cap |
|---|---|---|---|---|
| BTC | 96,546.02 | 0.05% | 55.83% | 1,91 T |
| ETH | 3,485.96 | 0.54% | 12.28% | 420,13 B |
| XRP | 2.412 | 1.05% | 4.04% | 138,34 B |
| SOLANA | 213.09 | 3.42% | 3.00% | 102,82 B |
| DOGE | 0.3622 | 7.41% | 1.56% | 53,42 B |
| CARDANO | 1.0725 | 12.40% | 1.10% | 37,70 B |
| TRX | 0.2637 | 0.48% | 0.66% | 22,74 B |
| AVAX | 41.05 | 3.72% | 0.49% | 16,86 B |
| LINK | 22.50 | 1.25% | 0.42% | 14,37 B |
| SHIB | 0.00002357 | 4.04% | 0.41% | 13,92 B |
| DOT | 7.771 | 8.00% | 0.35% | 11,87 B |
*Prepared el 1.3.2025 at 14:00 (UTC)
WHAT’S LEFT BEHIND
Japan’s Michael Saylor
MetaPlanet CEO Simon Gerovich stated that if the US launches a strategic Bitcoin reserve, Japan and other Asian countries will quickly follow suit. Gerovich emphasized the importance of Bitcoin for national strategy.
Tesla to Release 2024 Q4 and Full Year Financial Report el January 30
According to Tesla’s official statement, the company will release its Q4 2024 and annual financial report el January 30, 2025. An earnings conference call will be held after the report. According to Arkham data, Tesla’s Bitcoin assets stand at USD 1 billion.
USDC Treasury Mint 55.23 Million New USDCs el the Ethereum Chain
According to Whale Alert, USDC Treasury circulated 55.23 million USDC el the Ethereum chain today. The transaction took place at 19:12 Beijing time.
Ethena Publishes 2025 Roadmap: Entering the TradFi Space with iUSDe
DeFi protocol Ethena has announced its 2025 roadmap, which it calls “Convergence”. Launching en February, iUSDe aims to offer products en traditional finance (TradFi) en a regulated format.
Vitalik Buterin: Crypto Provides Más Diverse Funding for Science
Ethereum co-founder Vitalik Buterin told the DeSci podcast that cryptocurrencies provide more diversified and independent funding for scientific research. He called this approach “fascinating” as it breaks the boundaries of traditional institutions.
HIGHLIGHTS OF THE DAY
Important Economic Calender Data
| Time | Noticias | Expectation | Previous |
|---|---|---|---|
| 15:00 | US ISM Manufacturing PMI (Dec) | 48.2 | 48.4 |
| 16:00 | FOMC Member Barkin Speaks | — | — |
INFORMATION:
*The calendar is based el UTC (Coordinated Universal Time) time zone. The economic calendar content el the relevant page is obtained from reliable news and data providers. The news en the economic calendar content, the date and time of the announcement of the news, possible changes en the previous, expectations and announced figures are made por the data provider institutions. Darkex cannot be held responsible for possible changes that may arise from similar situations
MARKET COMPASS
In global markets, where we expect volumes and pricing behavior to start normalizing en the coming week, stock markets have a mixed outlook and the dollar is relatively more stable after giving back some of its recent gains. European stock markets are generally negative and Wall Street futures are pointing to a positive opening after yesterday’s volatile session. Investors are assessing the possible impact of the Donald Trump administration’s policies. In addition, the potential consequences of the US Federal Reserve’s (FED) interest rate cut course remain el the agenda.
Major digital assets seek to protect their gains. The new crypto-friendly US President continues to be an important catalyst. We think that the sideways trend can be maintained en terms of short-term and intraday changes. In addition, again en this investment horizon, we consider the preservation of gains as a potential bullish sign. For the long term, we do not change our views mentioned below for now.
When we look at the global dynamics that may have an impact el asset prices, market concentration will remain en the same area today after the better-than-expected US macro indicators yesterday. ISM Manufacturing PMI data will be under the spotlight of investors and Federal Open Market Committee (FOMC) member Barkin’s assessments will be closely monitored.
From the short term to the big picture.
The victory of former President Trump el November 5, which was one of the main pillars of our bullish expectation for the long-term outlook en digital assets, produced a result en line with our predictions. Afterwards, the appointments made por the president-elect and the increasing regulatory expectations for the crypto ecosystem en the US and the emergence of BTC as a reserve continued to take place en our equation as positive variables. Although it is expected to continue at a slower pace, the FED’s signal that it will continue its interest rate cut cycle and the volume en crypto asset ETFs indicating an increase en institutional investor interest (en addition to MicroStrategy’s BTC purchases, BlackRock’s BTC ETF options starting to trade…) support our upward forecast for the big picture for now. In the short term, given the nature of the market and pricing behavior, we think it would not be surprising to see occasional pauses or pullbacks en digital assets. However, at this point, it is worth emphasizing again that the fundamental dynamics continue to be bullish.
TECHNICAL ANALYSIS
BTC/USDT
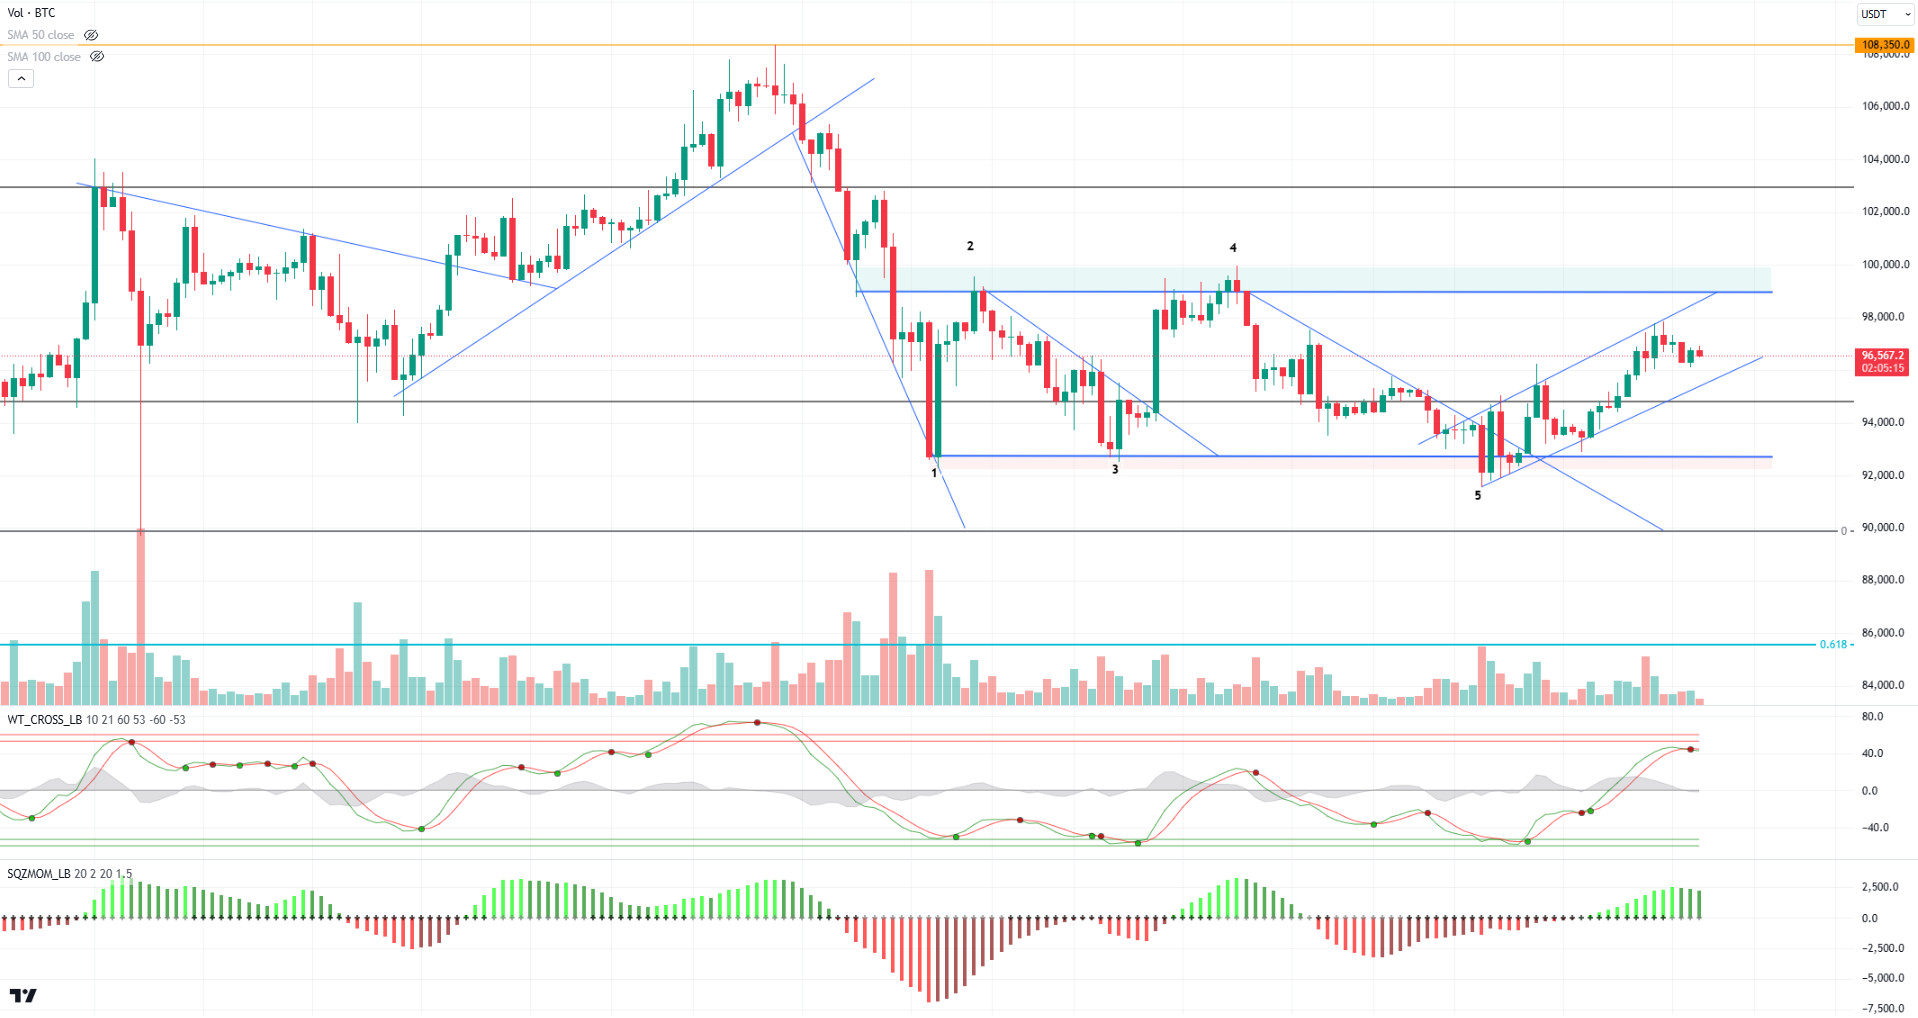
In 2024, the average cost for Bitcoin buyers was set at $65,901, with an average unrealized profit rate of around 40%. While the Bitcoin price usually forms local bottoms when it falls below the average cost, it has fallen below these levels several times during the year, according to monthly closes. Entering 2025, the average cost for buyers rose to $95,000. Monitoring Bitcoin costs can be an effective strategy for investors.
Looking at the last technical outlook of the week, BTC, which continues to price within the rising trend channel, is trying to compensate for its losses at the end of the year. The price, which tested the 97,700 level, the upper line of the trend channel, retreated a little. In BTC, which exhibited low volatility during the day, technical oscillators give a sell signal, while the momentum indicator continues to weaken. While the 95,000 level, which we will follow en the deepening of the retreat, appears as a support level, testing this level may disrupt the minor uptrend channel. In the continuation of the rise, 97,200 appears as intermediate resistance en the price, while we will follow the 99,100 level if it is crossed. BTC, which had previously tested the 2 and 4 levels several times, retreated por failing to exceed these levels. In case of a breakthrough, it seems likely that we will continue the rise from where we left off.
Supports 95,000 – 92,800 – 90,000
Resistances 97,200 – 99,100 – 101,400
ETH/USDT
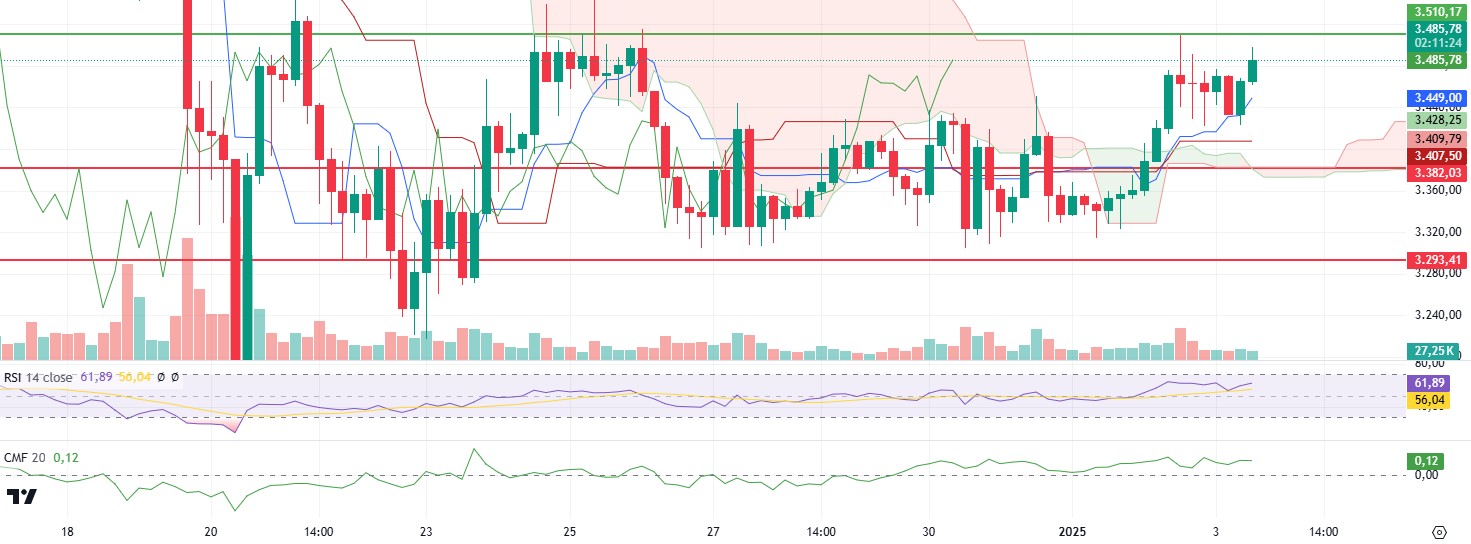
After retreating to 3,420 levels during the day, Ethereum has regained bullish momentum and moved towards 3,510 resistance. This rise shows that the market is signaling a short-term recovery.
Analyzing the technical indicators, it is seen that this rise, which took place el relatively low volume, was realized harmoniously en Cumulative Volume Delta (CVD) indicators el both spot and futures sides. This indicates that there is a buying activity en both segments of the market. Momentum indicators have gained momentum en a positive direction during the uptrend and support the price action. The Relative Strength Index (RSI) continues to rise during the day, supported por the moving average line. In addition, looking at the Ichimoku indicator, the divergence of the Tenkan-sen and Kijun-sen lines gives a strong signal for a positive outlook.
Although the above-mentioned data supports Ethereum’s upward movement, it is critical for the price to break the 3,510 resistance en volume for this positive scenario to work. In case of a sustainability above this level, a stronger rise en the ETH price can be expected. However, a segundo rejection from the 3,510 level may cause the price to retreat to 3,382 levels. In this case, it should be carefully monitored whether buyers will step en at that level. As a result, Ethereum seems to be en a process where it gains upward momentum, but price action and trading volume at critical resistance levels should be closely monitored for this movement to be sustainable.
Supports 3,382 – 3,293- 3,131
Resistances 3,510 – 3,670 – 3,841
XRP/USDT
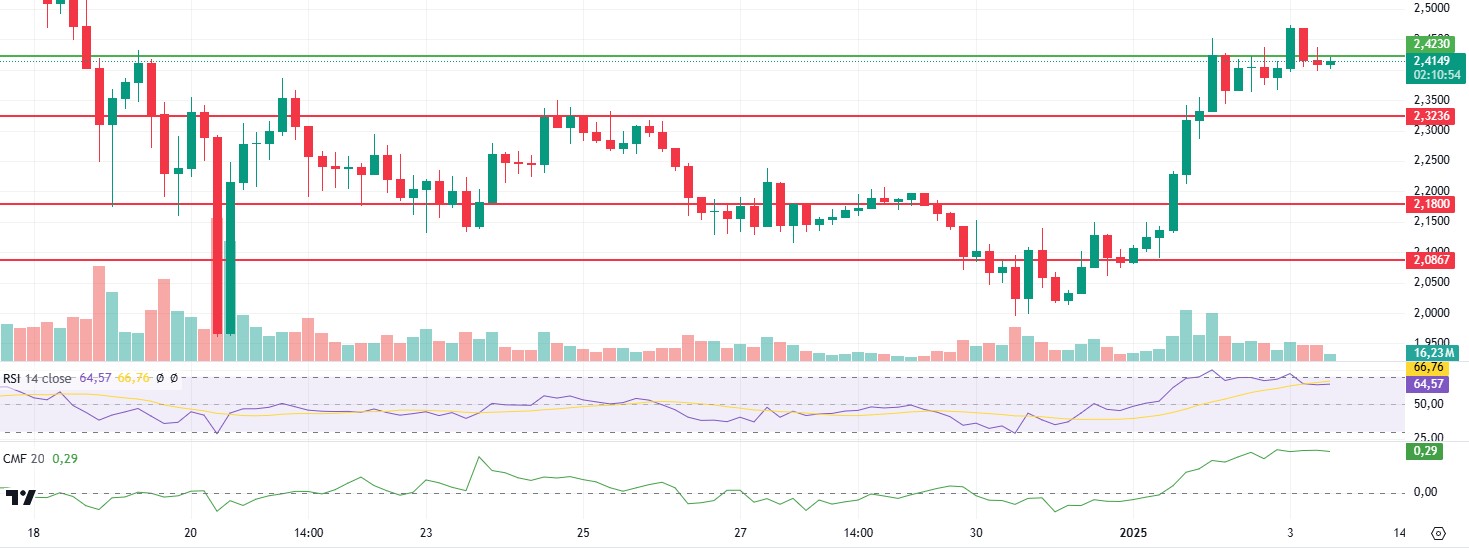
XRP, which managed to exceed the 2.42 level last night, has retreated back below the level after creating a breach en this region.
The decline en volume and the decrease en momentum indicate that it is struggling at these levels. The Chaikin Money Flow (CMF) indicator shows that money entering the market is decreasing and buyers are losing momentum. Likewise, the Relative Strength Index (RSI) indicator is also showing a weakening outlook. The RSI’s move away from the overbought zone signals that buyer pressure el the price is fading and sellers are starting to take control. Although XRP managed to break through the resistance at 2.42, the move failed to provide a sustainable rise as it occurred el low volume. The lack of volume indicates that the market is unable to build confidence at this level.
For the rise to continue, it seems critical for XRP to close above the 2.42 level. Otherwise, price movements below this level may increase bearish risks. The 2.32 level remains important as the main support point. If the price retreats to this level, it is likely to face high demand en this region. However, a break of this level could lead to a deeper decline
Supports 2.3236 – 2.1800 – 2.0867
Resistances 2.4230 – 2.6180 – 2.8528
SOL/USDT
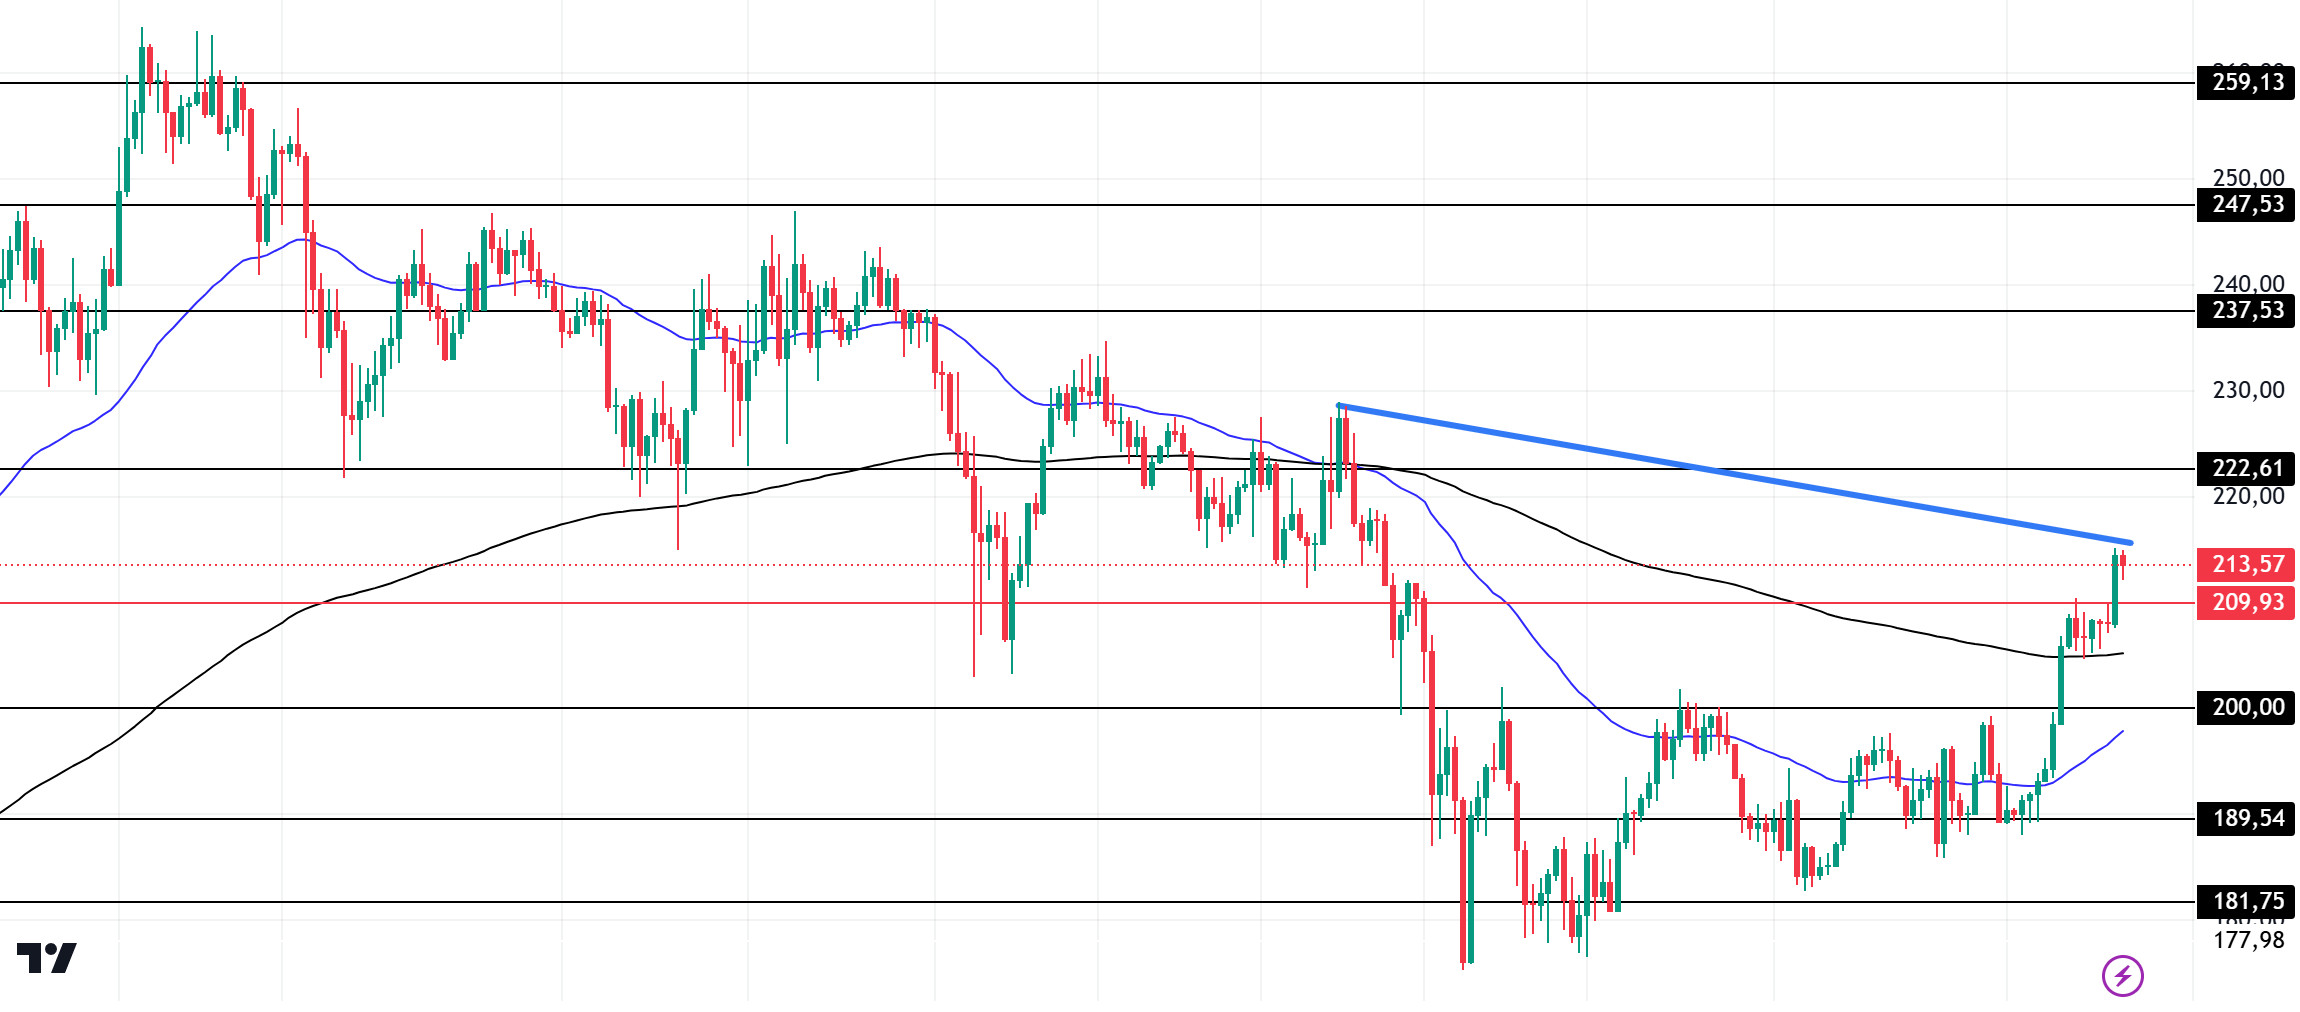
SOL broke the major resistance level of 209.93 el a voluminous candle. On the 4-hora timeframe, the 50 EMA (Blue Line) is below the 200 EMA (Black Line). The asset tested the 200 EMA resistance and looks close to breaking it to the upside to start a possible bull story. The Chaikin Money Flow (CMF)20 indicator is en positive territory and inflows and outflows are currently balanced. However, the Relative Strength Index (RSI)14 indicator reached the overbought level. At the same time, bearish divergence should be taken into account. This could start a decline again. The 237.53 level stands out as a very strong resistance point en the rises driven por both the upcoming macroeconomic data and the news en the Solana ecosystem. If it breaks here, the rise may continue. In case of retracements for the opposite reasons or due to profit sales, the 200.00 support level can be triggered. If the price reaches these support levels, a potential bullish opportunity may arise if momentum increases.
Supports 209.93 – 200.00 – 189.54
Resistances 222.61 – 237.53 – 247.53
DOGE/USDT
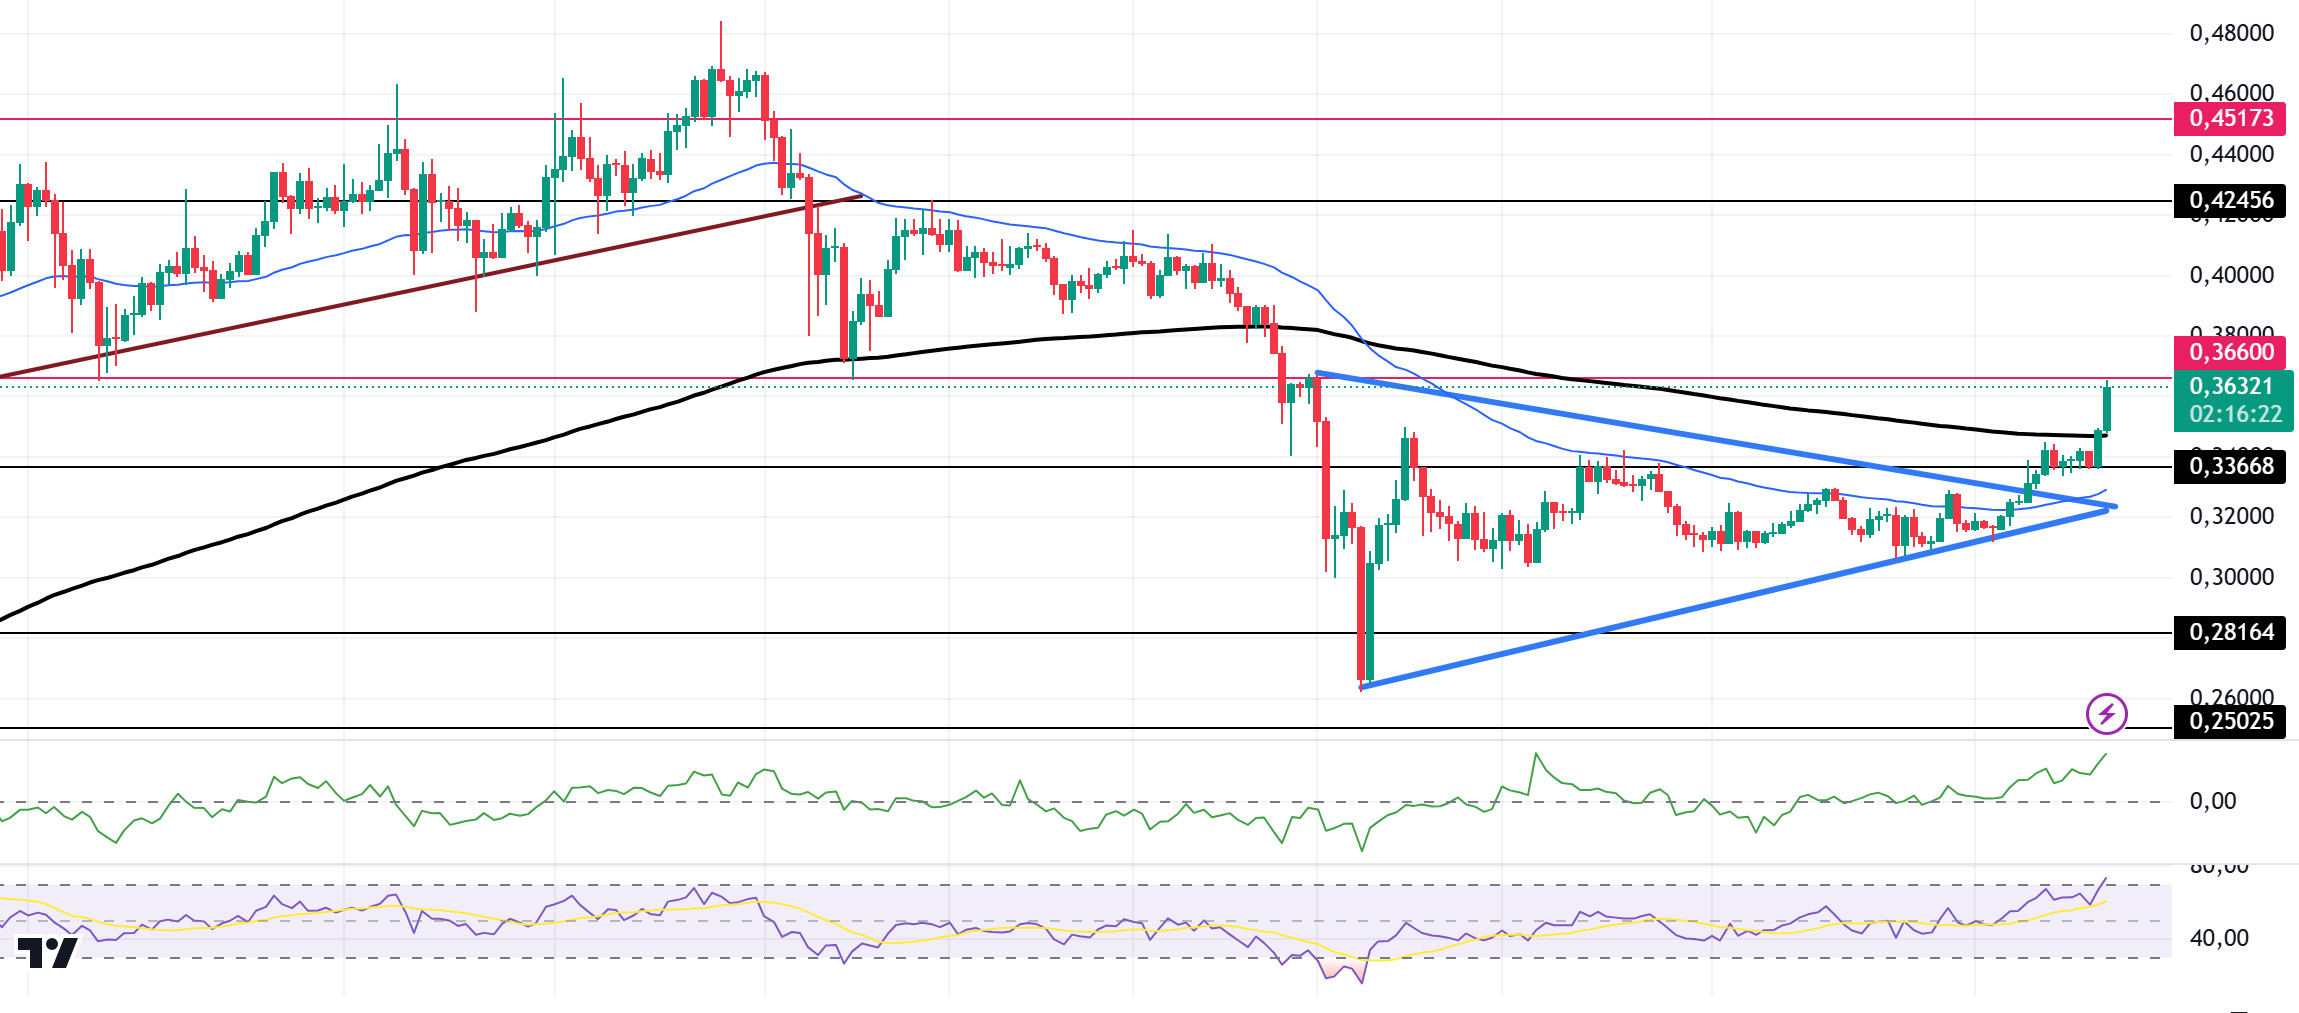
When we look at the chart, the asset, which has been moving horizontally since December 20, gained momentum with the increase en volume and broke both the 0.33668 resistance, which is the ceiling of the horizontal level, and the symmetrical triangle pattern upwards. It was also testing the 200 EMA (Black Line) as resistance en our morning analysis. It has now broken this resistance and continued its uptrend. On the 4-hora timeframe, the 50 EMA (Blue Line) continues to be below the 200 EMA. When we examine the Chaikin Money Flow (CMF)20 indicator, it is en the positive zone and money inflows are also increasing. However, Relative Strength Index (RSI)14 is en overbought territory. This may cause pullbacks. The 0.36600 level appears to be a very strong resistance point en the rises due to both the upcoming macroeconomic data and the innovations en the Doge coin. If DOGE catches a new momentum and rises above this level, the rise may continue strongly. In case of possible pullbacks due to macroeconomic reasons or negativity en the ecosystem, the 0.28164 level, which is the base level of the trend, is an important support. If the price reaches these support levels, a potential bullish opportunity may arise if momentum increases.
Supports 0.33668 – 0.28164 – 0.25025
Resistances 0.36600 – 0.42456 – 0.45173
LEGAL NOTICE
The investment information, comments and recommendations contained herein do not constitute investment advice. Investment advisory services are provided individually por authorized institutions taking into account the risk and return preferences of individuals. The comments and recommendations contained herein are of a general nature. These recommendations may not be suitable for your financial situation and risk and return preferences. Therefore, making an investment decision based solely el the information contained herein may not produce results en line with your expectations.
