
MARKET SUMMARY
Latest Situation in Crypto Assets
| Assets | Last Price | 24h Change | Dominance | Market Cap. |
|---|---|---|---|---|
| BTC | 89,649.84 | 10.71% | 58.93% | 1.77 T |
| ETH | 3,381.83 | 7.67% | 13.52% | 407.17 B |
| SOLANA | 219.69 | 6.02% | 3.45% | 103.98 B |
| DOGE | 0.4047 | 44.83% | 1.98% | 59.50 B |
| XRP | 0.6081 | 5.58% | 1.15% | 34.52 B |
| CARDANO | 0.5963 | 4.02% | 0.70% | 20.91 B |
| SHIB | 0.00002898 | 15.69% | 0.57% | 17.10 B |
| AVAX | 37.07 | 18.86% | 0.50% | 15.14 B |
| TRX | 0.1682 | 2.54% | 0.48% | 14.54 B |
| LINK | 14.79 | 7.23% | 0.31% | 9.28 B |
| DOT | 5.527 | 9.57% | 0.28% | 8.38 B |
*Prepared on 11.11.2024 at 13:30 (UTC)
WHAT’S LEFT BEHIND
Bitcoin Purchase from MicroStrategy
MicroStrategy, led by Michael Saylor, bought 27,200 more Bitcoin. The company’s average for this purchase was 74,463 dollars. The total number of BTC on hand also reached 280 thousand.
Ambitious Proposal by Bernstein
While Bitcoin is running from peak to peak, analysts from the famous investment firm Bernstein warned those who are hesitant to invest in the cryptocurrency sector in their latest report and said, “Welcome to the bull season of crypto, don’t fight crypto and take what you can get.”
CoinShares Report
CoinShares reported that inflows into digital asset investment products after the US election totalled $1.98 billion, pushing global assets under management to a new high of $116 billion and recording net inflows for five consecutive weeks, according to its latest weekly report. Regional inflows were concentrated in the United States ($1.95 billion), while Switzerland and Germany also received $23 million and $20 million respectively.
Tether’s Oil Move in the Middle East
Tether, the leading company in the digital asset industry, successfully completed its first crude oil financing transaction in the Middle East. The transaction, worth approximately $45 million, financed the transportation of 670,000 barrels of crude oil.
Tether’s Massive USDT Minting
In recent days, Tether has created a huge buzz on the Ethereum network by minting $4 billion USDT. This huge amount, which was transferred to exchanges such as Binance and Coinbase, triggered Bitcoin and Ethereum prices upwards.
Dogecoin Rises 92% to 6th Place on Trump Victory
Last week, Dogecoin (DOGE) surged 92% after Donald Trump’s election victory. Dogecoin rose to sixth place after Trump’s victory. This rise moved Dogecoin to sixth place in the market capitalization rankings and performed remarkably on the weekly charts.
HIGHLIGHTS OF THE DAY
Important Economic Calender Data
*There is no important calendar data for the rest of the day.
INFORMATION
*The calendar is based on UTC (Coordinated Universal Time) time zone.
The economic calendar content on the relevant page is obtained from reliable news and data providers. The news in the economic calendar content, the date and time of the announcement of the news, possible changes in the previous, expectations and announced figures are made by the data provider institutions. Darkex cannot be held responsible for possible changes that may arise from similar situations.
MARKET COMPASS
Led by Bitcoin, which continues to extend its record highs, digital asset prices continued to rise at the start of the week. After Sunday’s sharp gains, the bullish tone seems more moderate. European stock markets and US futures are positive. On the other hand, volume is expected to remain low today as banks will be closed in the US for Veterans Day.
From the short term to the big picture.
The victory of former President Trump, one of the main pillars of our bullish expectation for the long-term perspective in digital assets, produced a result in line with our forecasts. The continuation of the Fed’s rate-cutting cycle and the inflows into BTC ETFs, indicating increased institutional investor interest (plus MicroStrategy’s BTC purchases and Microsoft’s consideration of a purchase), support our big-picture upside forecast for now.
In the short term, given the nature of the market and pricing behavior, we think it would not be surprising to see some respite or pullbacks in digital assets from time to time. At this point, it is worth reiterating that fundamental dynamics remain bullish. While the expansion of the largest digital currency Bitcoin’s record high may encourage buyers to take new, upside positions, we will watch this group struggle with the masses who may want to take profit realizations. For now, the buyers are winning this battle.
TECHNICAL ANALYSIS
BTC/USDT
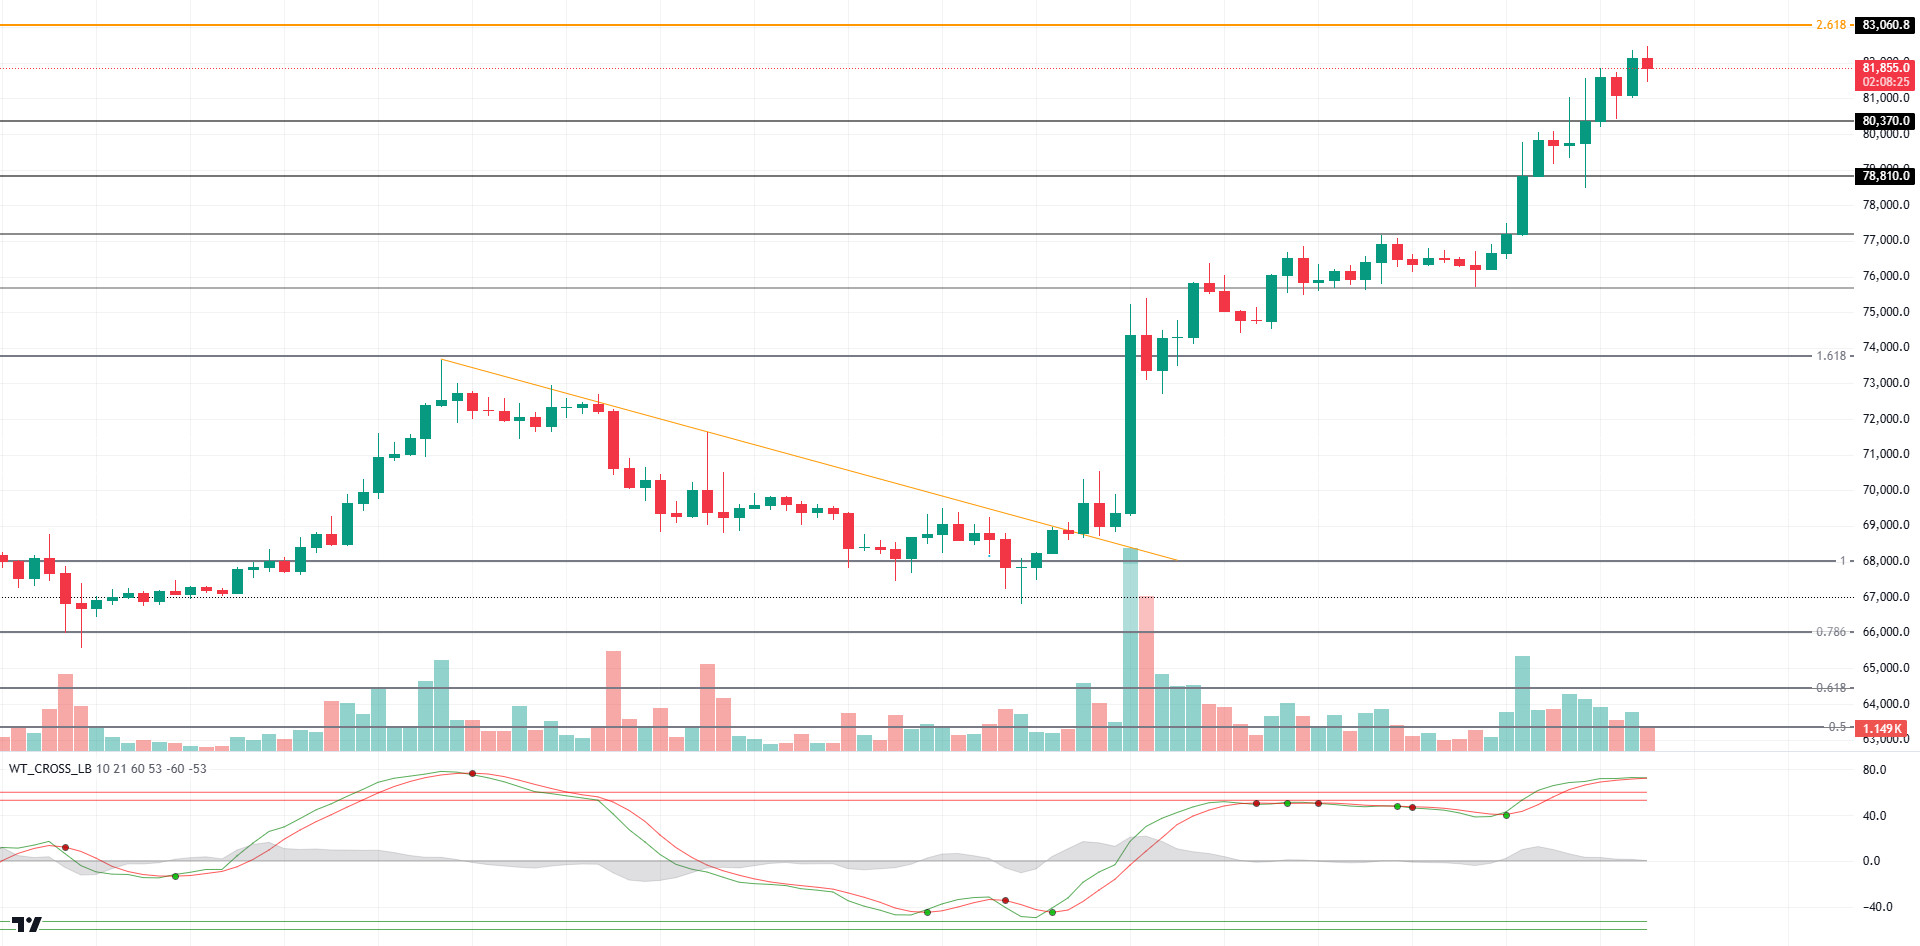
According to CoinShares’ latest weekly report, the inflow into digital asset investment products after the US elections amounted to $1.98 billion. With the FED interest rate cut, the liquidity in the market coming to crypto assets brings the Bitcoin price to a new ATH level almost every day. In this direction, institutional investors’ interest in Bitcoin continues unabated. Finally, Microstategy, known for its crypto investments, announced the purchase of 27,200 Bitcoin.
When we look at the technical outlook of BTC, the price reached a new ATH (all-time high) level of 82,490 during the day and retreated to 81,600 after the selling pressure it faced at this level. At each new ATH level, we observe some retracement in BTC price. These levels may act as resistance in BTC price; therefore, in short-term trading, ATH levels may create reverse trading opportunities for investors. With the positive trend in global markets, the Fibonacci 2.618 (83,060) level can be tested with the increase in upward momentum in BTC price. With the deepening of the retracement, we will follow the 80,370 point as the support level.
Supports 80,370 – 79,250 – 77,200
Resistances 83,060 – 85,000 – 92,000
ETH/USDT
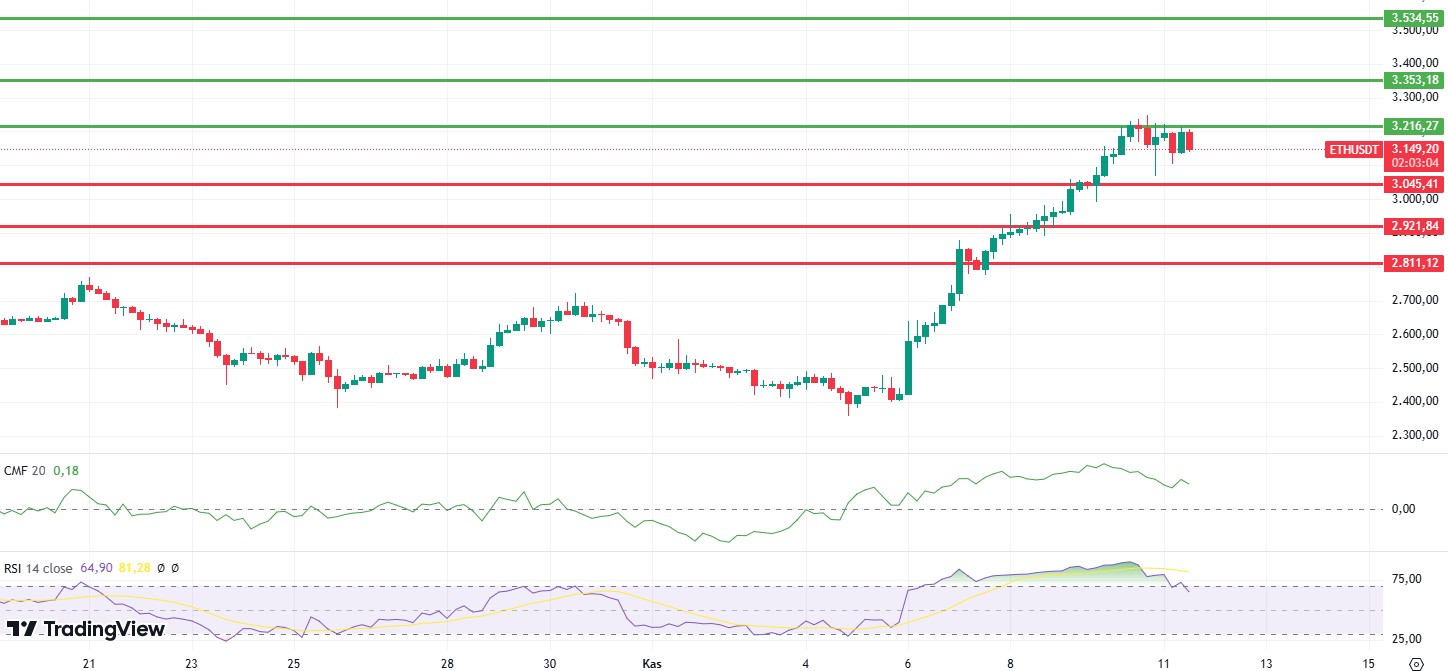
As mentioned in the morning analysis, the horizontal movement that comes with the Relative Strength Index (RSI) level exiting the overbought zone can be seen as a healthy correction. At the same time, with the negative divergence on the RSI in the last 4-hour candle, it can be said that the price may continue to decline during the night hours. Chaikin Flow (CMF) and Cumulative Volume Delta (CVD) can be listed as important factors that can be counted as support for the correction scenario in spot pullbacks. At the same time, the price, which fell to 3.045, may rise again with the reaction it will receive from these levels. With the loss of the 3,045 level, sharp declines can be seen up to 2,921. The 3,216 level can be seen as the most important resistance level. Exceeding this level may continue the upward movement and bring sharp movements up to 3,353 levels.
Supports 3,045 – 2,921 – 2,811
Resistances 3,216 – 3,353 – 3,534
XRP/USDT
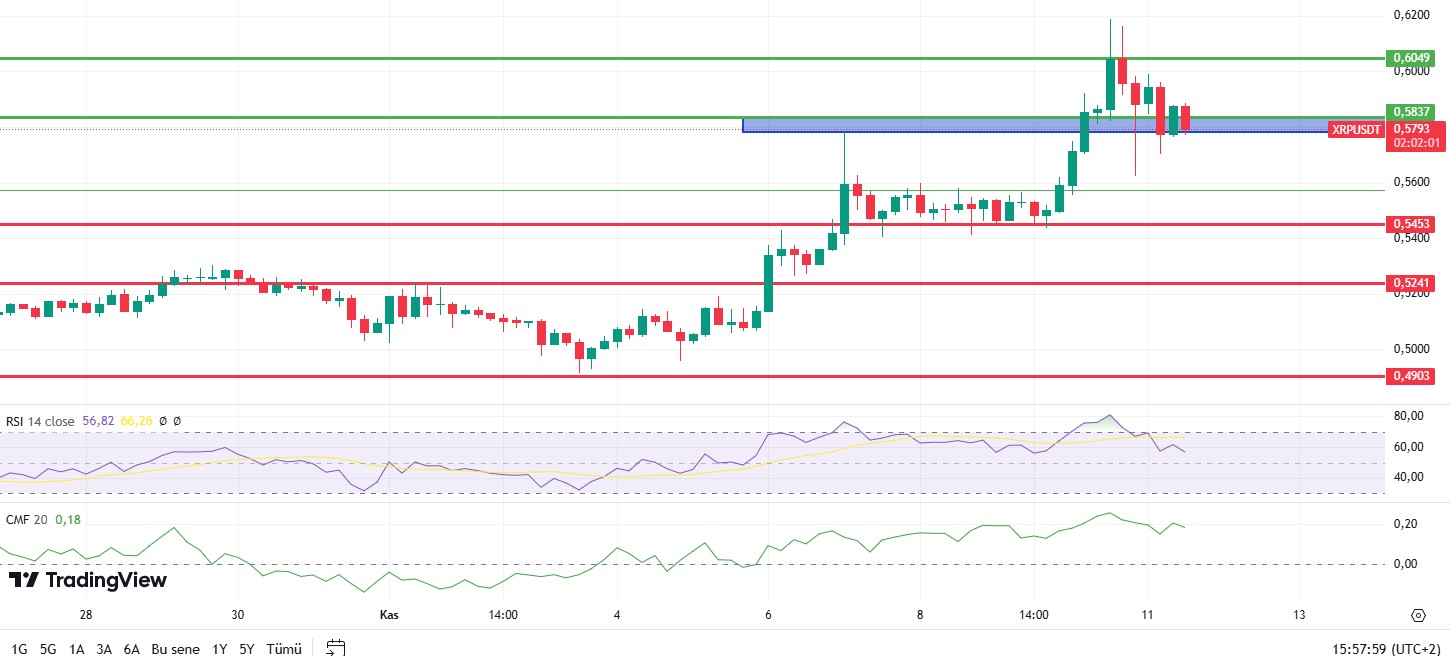
In XRP, the selling pressure experienced above the region shown as the blue box on the chart and the slight sales in the market are also evident on Chaikin Flow (CMF). In addition, the negative outlook in Relative Strength Index (RSI), Money Flow Index (MFI) and momentum may cause the retracement to continue in the evening hours. In this case, the 0.5453 level appears as the first support. At this level, the price can be expected to receive a significant reaction. However, it can be said that if it breaks, the decline may harden. If the price breaks the 0.6049 level with the closures above the blue box zone, the positive scenario can be realized and rapid rises to 0.6655 can be seen.
Supports 0.5453 – 0.5241 – 0.4903
Resistances 0.5837 – 0.6049 – 0.6655
SOL/USDT
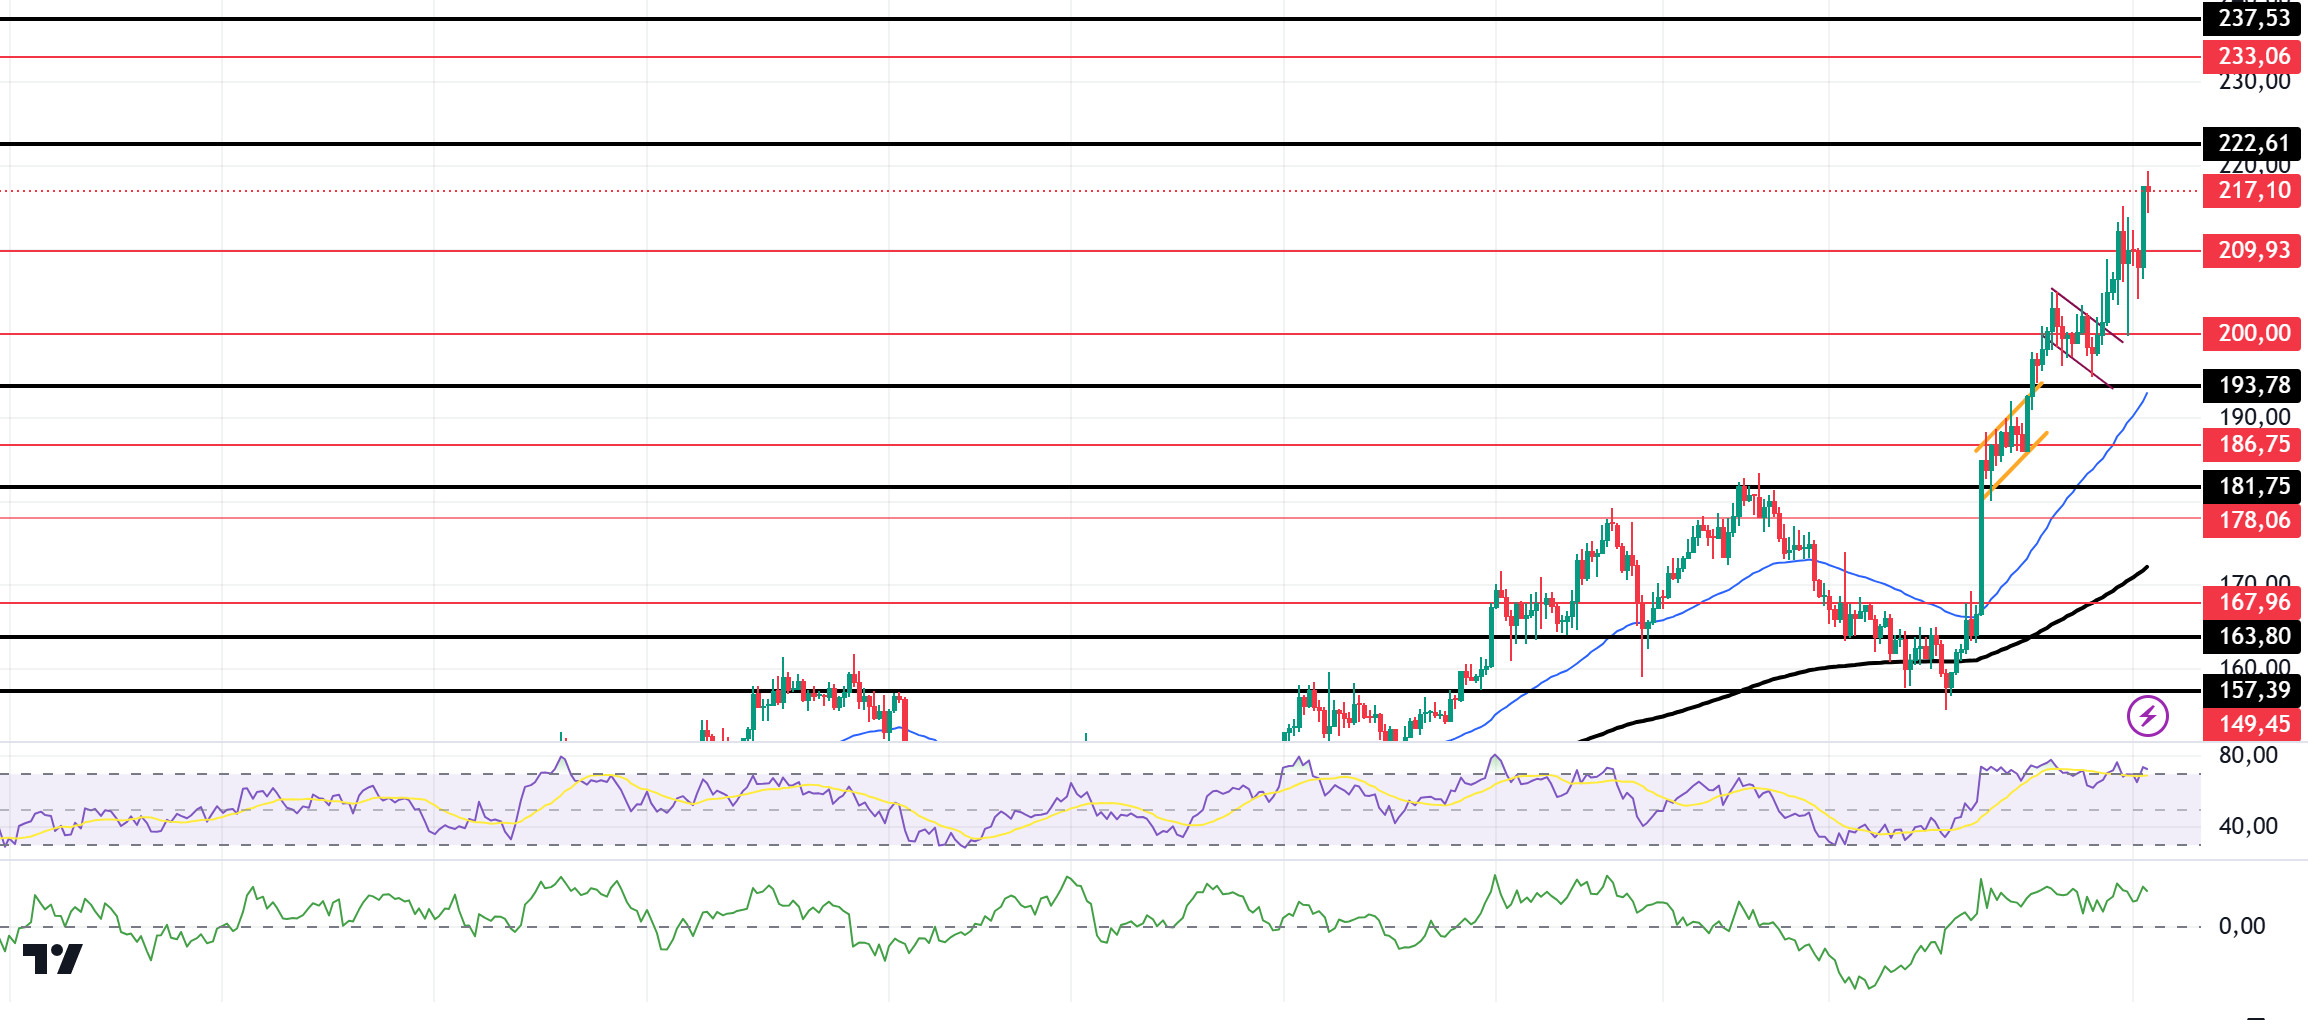
According to data from Glassnode, there has been a decline in active addresses on the network. This drop led to a one-day active address mismatch, indicating selling pressure. This could lead to a decline in momentum. This mismatch between SOL and active addresses should be carefully monitored. Technically, SOL continues to rise. It is priced at 215.52, the highest level since March. At the same time, it strongly broke the 193.78 level, which we call critical resistance, and ran this as a support level. In the 4-hour timeframe, the 50 EMA (Blue Line) continues to be above the 200 EMA (Black Line). This could mean that the uptrend will continue. However, the gap between the two averages has widened too much to a difference of 11.80%. This could cause pullbacks. At the same time, Relative Strength Index (RSI)14 is in the overbought zone, which may cause profit selling. However, when we examine the Chaikin Money Flow (CMF)20 indicator, although money inflows are positive, inflows have started to decline. The 222.61 level is a very strong resistance point in the uptrend driven by both macroeconomic conditions and innovations in the Solana ecosystem. If it rises above this level, the rise may continue strongly. In case of retracements due to possible macroeconomic reasons or profit sales, the 193.78 support level may be triggered again. If the price reaches this support level, a potential bullish opportunity may arise if momentum increases.
Supports 209.93 – 200.00 – 193.78
Resistances 222.61 – 233.06- 237.53
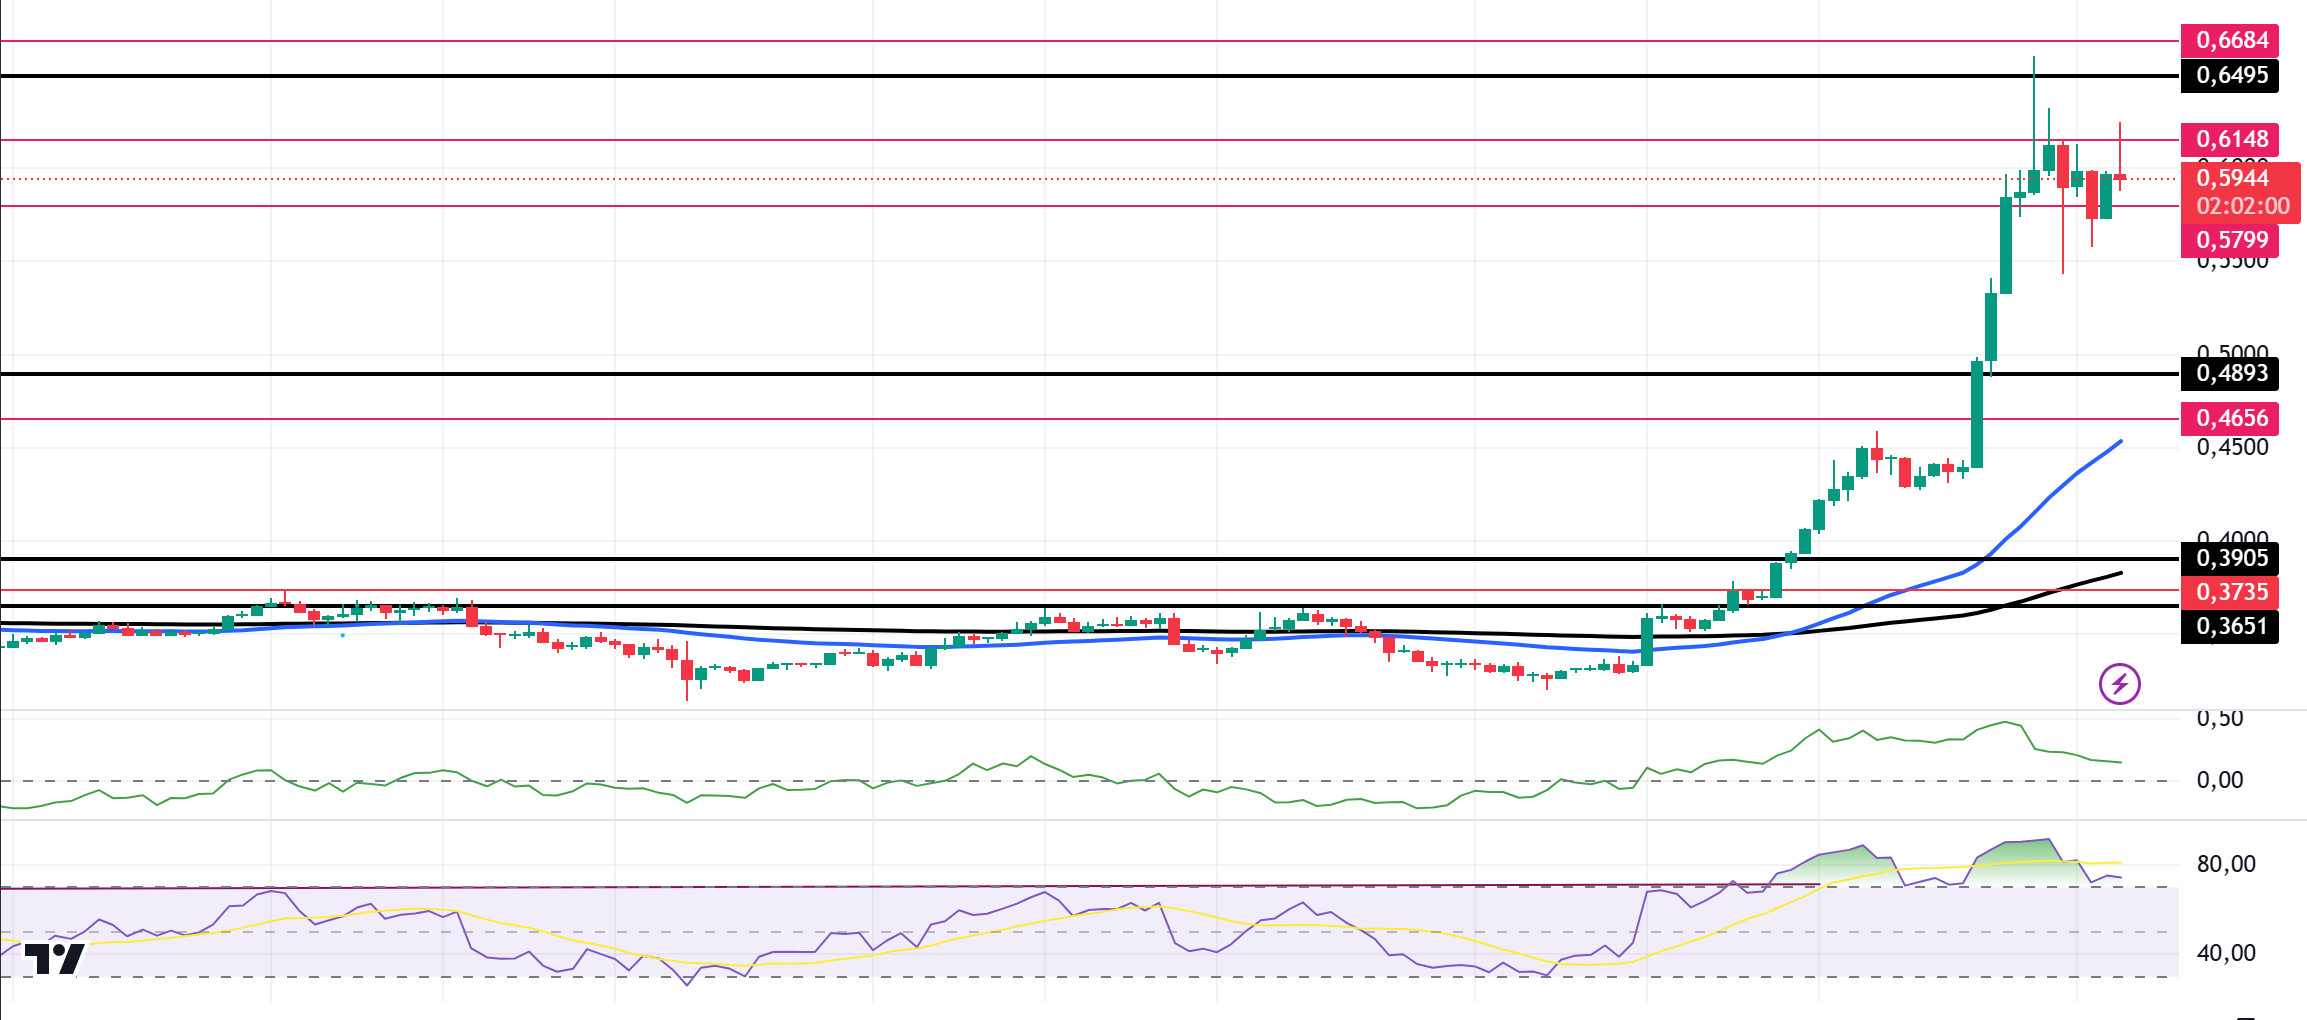
ADA/USDT
In the Cardano ecosystem, according to Santiment data, wallets between 100 million and 1 billion increased their number of units from 2.06 billion to 3 billion ADA, a growth of 45%. Moreover, the 30-day Market Value to Realized Value (MVRV) increased by 38%, indicating that the average short-term wallet is profitable. This could trigger market volatility and a potential pullback. Technically, the price is pricing above the 50 EMA (Blue Line) and 200 EMA (Black Line) on the 4-hour chart. However, the 50 EMA has moved above the 200 EMA. This shows us that the trend is bullish. At the same time, when we examine the Chaikin Money Flow (CMF)20 indicator, it is in positive territory, but inflows have decreased. However, Relative Strength Index (RSI)14 is in the overbought zone, which may bring profit sales. Considering all this, it has made the 0.5799 level support, which works as a resistance. The support level of 0.4893 should be followed in the decline that will be experienced due to the macroeconomic data and negativities in the ecosystem or in the retracements brought by profit sales. It may be appropriate to buy when it comes to this price level. In the rises due to macroeconomic data or developments in the ecosystem, the 0.6495 level should be followed as a strong resistance. If it breaks this level, the rise may strengthen.
Supports 0.5799 – 0.4893 – 0.4656
Resistances 0.6148 – 0.6495 – 0.6684
LEGAL NOTICE
The investment information, comments and recommendations contained herein do not constitute investment advice. Investment advisory services are provided individually by authorized institutions taking into account the risk and return preferences of individuals. The comments and recommendations contained herein are of a general nature. These recommendations may not be suitable for your financial situation and risk and return preferences. Therefore, making an investment decision based solely on the information contained herein may not produce results in line with your expectations.


