RESUMEN DEL MERCADO
Última situación de los criptoactivos
| Activos | Último precio | 24h Cambio | Dominación | Capitalización bursátil |
|---|---|---|---|---|
| BTC | 97,504.37 | 3.09% | 59.62% | 1,93 T |
| ETH | 3,349.19 | 7.67% | 12.45% | 402,67 B |
| SOLANA | 245.98 | 3.23% | 3.61% | 116,69 B |
| XRP | 1.128 | 0.86% | 1.99% | 64,26 B |
| DOGE | 0.3883 | -0.30% | 1.76% | 57,04 B |
| CARDANO | 0.8001 | -3.94% | 0.87% | 28,06 B |
| TRX | 0.2010 | 1.60% | 0.54% | 17,38 B |
| SHIB | 0.00002490 | 1.64% | 0.45% | 14,68 B |
| AVAX | 35.70 | 1.62% | 0.45% | 14,63 B |
| ENLACE | 15.26 | 1.78% | 0.30% | 9,57 B |
| DOT | 5.922 | -1.74% | 0.28% | 9,02 B |
*Preparado el 21.11.2024 a las 13:30 (UTC)
LO QUE QUEDA ATRÁS
MicroStrategy supera al SPY, Nvidia y Tesla, y alcanza su mayor volumen
MicroStrategy está comprando más y más Bitcoin cada día, y la subida del precio del Bitcoin también se ha reflejado en las acciones. Las acciones de MSTR, que han subido casi un 600% desde principios de año, superaron ayer el volumen de empresas muy traded como Nvidia y Tesla. MSTR también duplicó su volumen frente a SPY, uno de los fondos traded más traded .
Michael Saylor puede haber perdido poder de voto en MicroStrategy por la estrategia de Bitcoin
En MicroStrategy, que ha estado comprando Bitcoin regularmente desde 2020, se afirmó que Michael Saylor perdió su poder de voto sobre la empresa. Basándose en las recientes emisiones de bonos para la compra de Bitcoin, es posible que Saylor ya no posea más del 50% del total de los derechos de voto. Esto podría significar que la empresa se ve privada de importantes derechos, incluso en la bolsa Nasdaq, e incluso la estrategia de compra de Bitcoin podría verse en peligro.
La red se detuvo en SUI, la subida del último período, el valor del token cayó un 10 por ciento
Sui informó de que el comunicado oficial de Sui decía que la red Sui se ha reiniciado y procesado transacciones y que la interrupción de 2 horas fue causada por un fallo en la lógica de programación de transacciones, que provocó la caída del validador y que el problema ya se ha resuelto.
LO MÁS DESTACADO DEL DÍA
Datos importantes del calendario económico
| Tiempo | Noticias | Expectativas | Anterior |
|---|---|---|---|
| 15:00 | Ventas de viviendas existentes en EE.UU. (octubre) | 3.95M | 3.84M |
| 17:25 | Discurso de Goolsbee, miembro del FOMC | - | - |
| 17:30 | Intervención de Hammack, miembro del FOMC | - | - |
| 21:40 | Habla Barr, miembro del FOMC | - | - |
INFORMACIÓN
*El calendario se basa en la zona horaria UTC (Tiempo Universal Coordinado).
El contenido del calendario económico de la página correspondiente se obtiene de proveedores de noticias y datos fiables. Las noticias del contenido del calendario económico, la fecha y hora del anuncio de la noticia, los posibles cambios en las cifras anteriores, las expectativas y las cifras anunciadas son realizadas por las instituciones proveedoras de datos. Darkex no se hace responsable de los posibles cambios que puedan producirse en situaciones similares.
BRÚJULA DE MERCADO
Mientras la noticia de que Rusia utilizó armas intercontinentales por primera vez durante el último ataque de Ucrania estaba a la orden del día, el periodo posterior a la "victoria de Trump" en los activos digitales continúa a toda velocidad. Por otro lado, los datos publicados en EE.UU. estuvieron bajo la lupa de los inversores y vimos que las solicitudes de subsidios de desempleo se mantuvieron por debajo de las expectativas. Las declaraciones de los funcionarios de la Reserva Federal estadounidense (FED) seguirán siendo vigiladas por los mercados tradicionales durante el resto del día.
El bitcoin ha vuelto a ampliar hoy su máximo histórico, y esta vez hemos visto cómo las principales criptodivisas acompañaban la subida. ETH realizó el movimiento más notable. Las noticias sobre los planes de reserva de BTC de empresas como Genius Group y Mara Holdings, y las expectativas de que Trump siga construyendo su nuevo gabinete con nombres favorables a las criptodivisas, siguen siendo el motor de la subida de los activos digitales.
Desde el corto plazo hasta el panorama general.
La victoria del expresidente Trump el 5 de noviembre, que era uno de los principales pilares de nuestra expectativa alcista para las perspectivas a largo plazo en los activos digitales, arrojó un resultado en línea con nuestras previsiones. La continuación del ciclo de recortes de tipos de la Fed (aunque con mensajes cautelosos por parte de Powell en su último discurso...) y el volumen en los ETF de BTC, que indican un aumento del interés de los inversores institucionales (además, las compras de BTC por parte de MicroStrategy, el hecho de que Microsoft empiece a evaluar la cuestión de la compra, el inicio de la tradinglas opciones de ETF de BTC de BlackRock...) respaldan por ahora nuestra previsión alcista para el panorama general.
A corto plazo, dada la naturaleza del mercado y el comportamiento de los precios, creemos que no sería sorprendente ver un respiro ocasional o retrocesos en los activos digitales. En este punto, vale la pena reiterar que la dinámica fundamental sigue siendo alcista. Mientras que el Bitcoin, la mayor divisa digital, que amplía cada uno de sus máximos históricos puede seguir despertando el apetito de los compradores para tomar nuevas posiciones alcistas, observaremos cómo este grupo lucha con las masas que pueden estar buscando la realización de beneficios y los especuladores que buscan explotar posibles caídas tras rápidas subidas. En el frente del BTC, podemos decir que los compradores lideran la batalla por ahora.
ANÁLISIS TÉCNICO
BTC/USDT
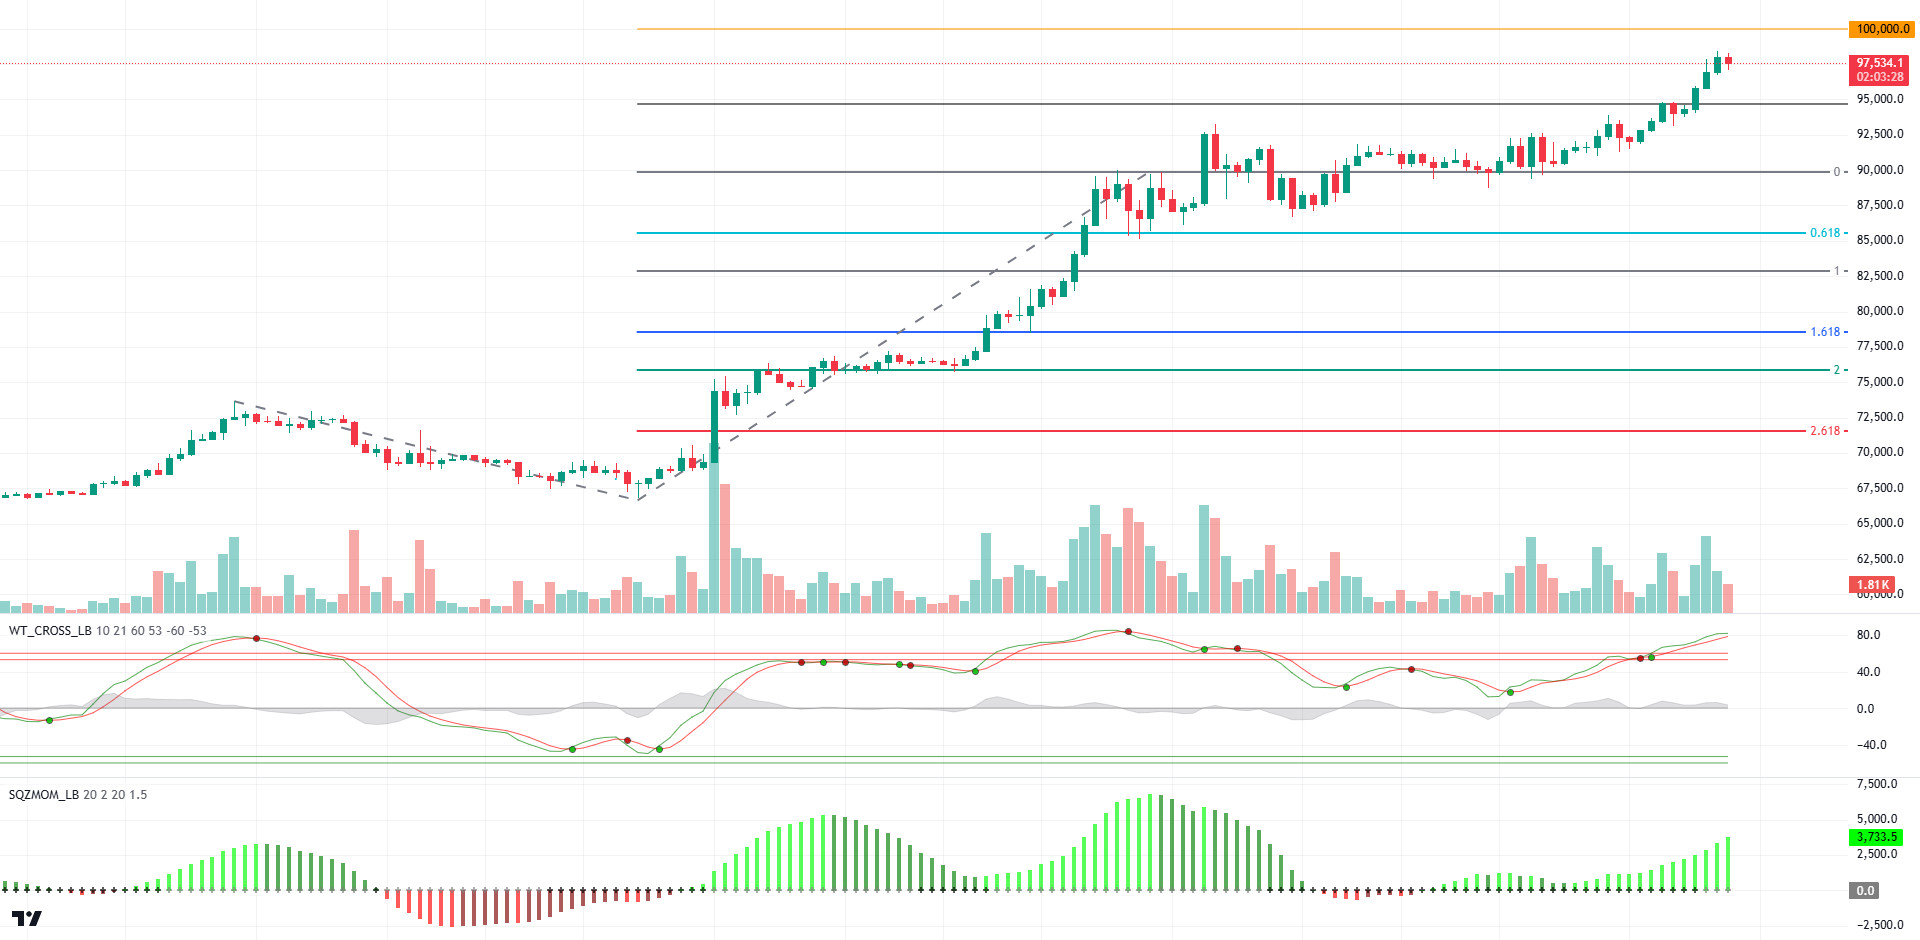
MicroStrategy anunció que ha aumentado su objetivo de emisión de bonos de 1.750 millones de dólares a 2.600 millones para compras adicionales de Bitcoin. La empresa declaró que utilizará parte de los ingresos para comprar Bitcoin. Tras este acontecimiento, el precio del Bitcoin siguió superando su all-time high (ATH) y se mantuvo a un 7% de distancia en su camino hacia niveles de seis dígitos.
Si nos fijamos en las perspectivas técnicas del BTC después de los últimos acontecimientos, alcanzó los 94.589 con intentos de ATH durante el día. A medida que continúan los desarrollos positivos para el BTC, el impulso alcista en su precio sigue fortaleciéndose. El aumento de los volúmenes de opciones al contado del ETF con el mercado estadounidense puede provocar que se vean nuevos niveles ATH en el precio del BTC durante el día. Como mencionamos anteriormente, si se supera el nivel de 95.000, puede que se produzca un movimiento brusco hacia el nivel de 100.000 con un aumento de la presión compradora. En caso de un retroceso, la oportunidad de inversión trading cada nivel de ATH puede hacer que el precio retroceda hasta el nivel de soporte menor de 92.500.
Soportes 92.550 - 91.350 - 90.000
Resistencias 94.430 - 95.000 - 100.000
ETH/USDT
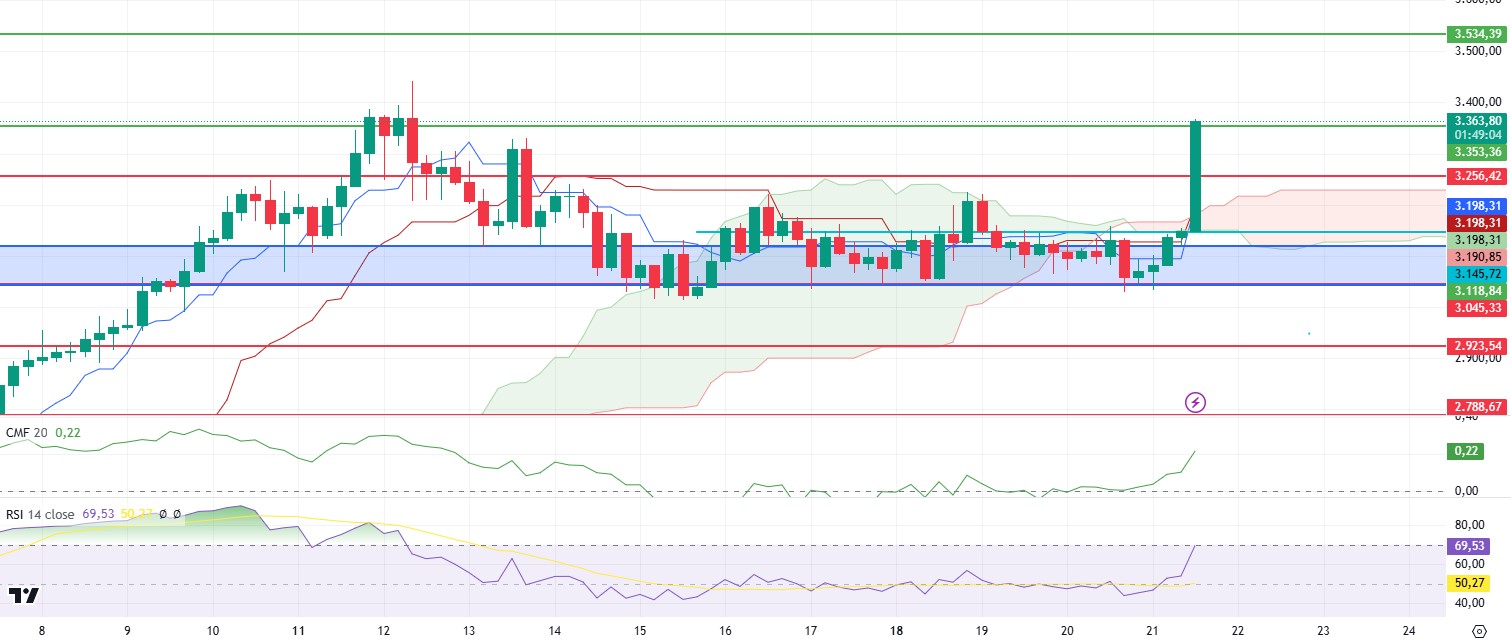
ETH subió hasta el nivel de resistencia de 3.353 al experimentar una subida de gran volumen con la ruptura del nivel de 3.145 durante el día. Si se observa el Interés Abierto, está claro que las posiciones están aumentando, pero cuando se analiza el Delta de Volumen Acumulado (DVA), se ve claramente que la subida viene del lado del contado. El Flujo Monetario Chaikin (CMF) y el Índice de Fuerza Relativa (RSI) se mantienen positivos sin ninguna divergencia. Los cierres por encima de 3,353 pueden mover el precio rápidamente a 3,534 con la aceleración en el impulso y una reacción desde aquí puede venir una nueva prueba a 3,353. Otro escenario es que si el nivel de 3.353 no puede ser superado, la subida puede continuar después de un re-test al nivel de 3.256. Se puede decir que la zona de 3,256 es el nivel de soporte más importante a tener en cuenta. En caso de cierres por debajo de este nivel, los inversores deberían desconfiar de una posible trampa alcista.
Soportes 3.256 - 3.145 - 3.045
Resistencias 3.353 - 3.534 - 3.680
XRP/USDT
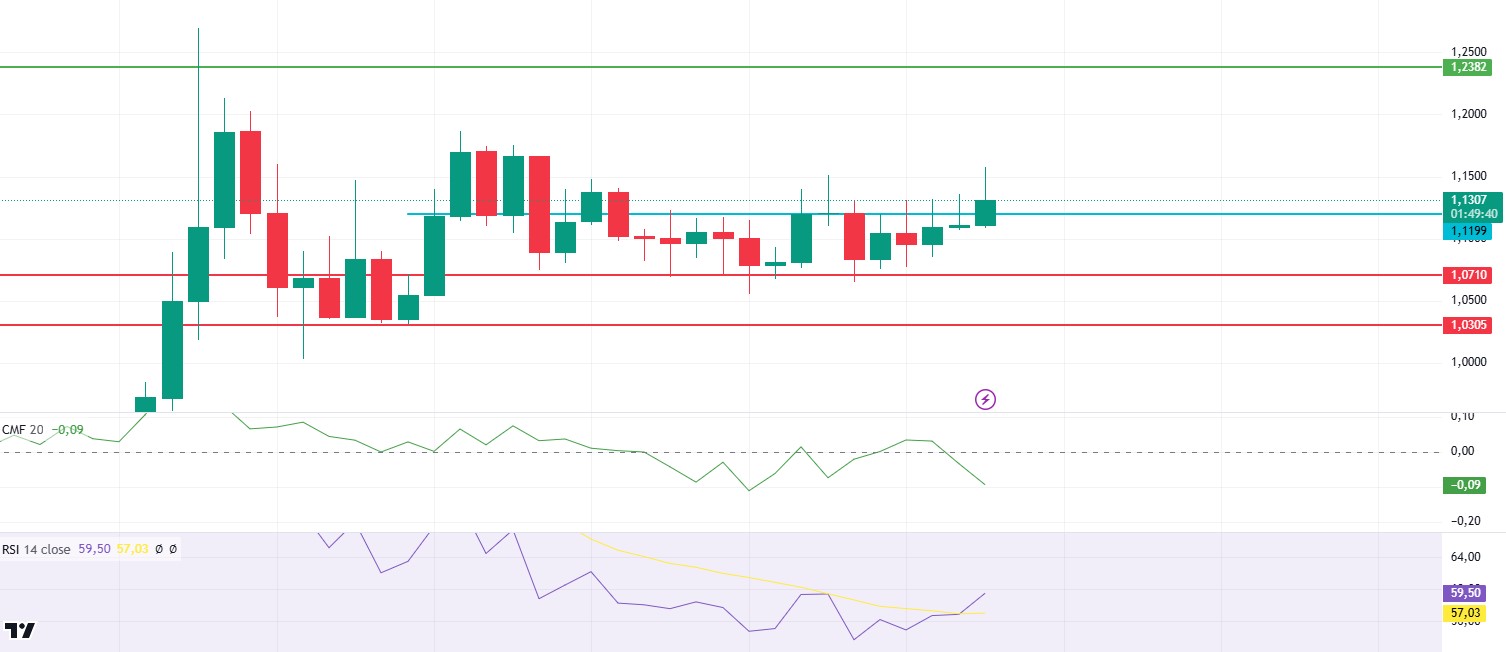
Puede decirse que el XRP, que logró mantenerse por encima del nivel de 1,12 durante la jornada, ha llegado al final de la fase de acumulación. La perspectiva positiva del índice de fuerza relativa (RSI) y el precio rondando por encima de la zona de soporte intermedio de 1,12 indican que el XRP puede volver a atacar el nivel de 1,23. Sin embargo, el Chaikin Money Flow (CMF) volvió a ser negativo y su estructura negativa muestra que los inversores deberían tener cuidado con la pérdida del nivel de 1,12. Con la pérdida de este nivel, se pueden ver descensos rápidamente hasta los niveles de 1,07.
Soporta 1,0709 - 1,0333 - 0,9382
Resistencias 1,2386 - 1,3487 - 1,4463
SOL/USDT
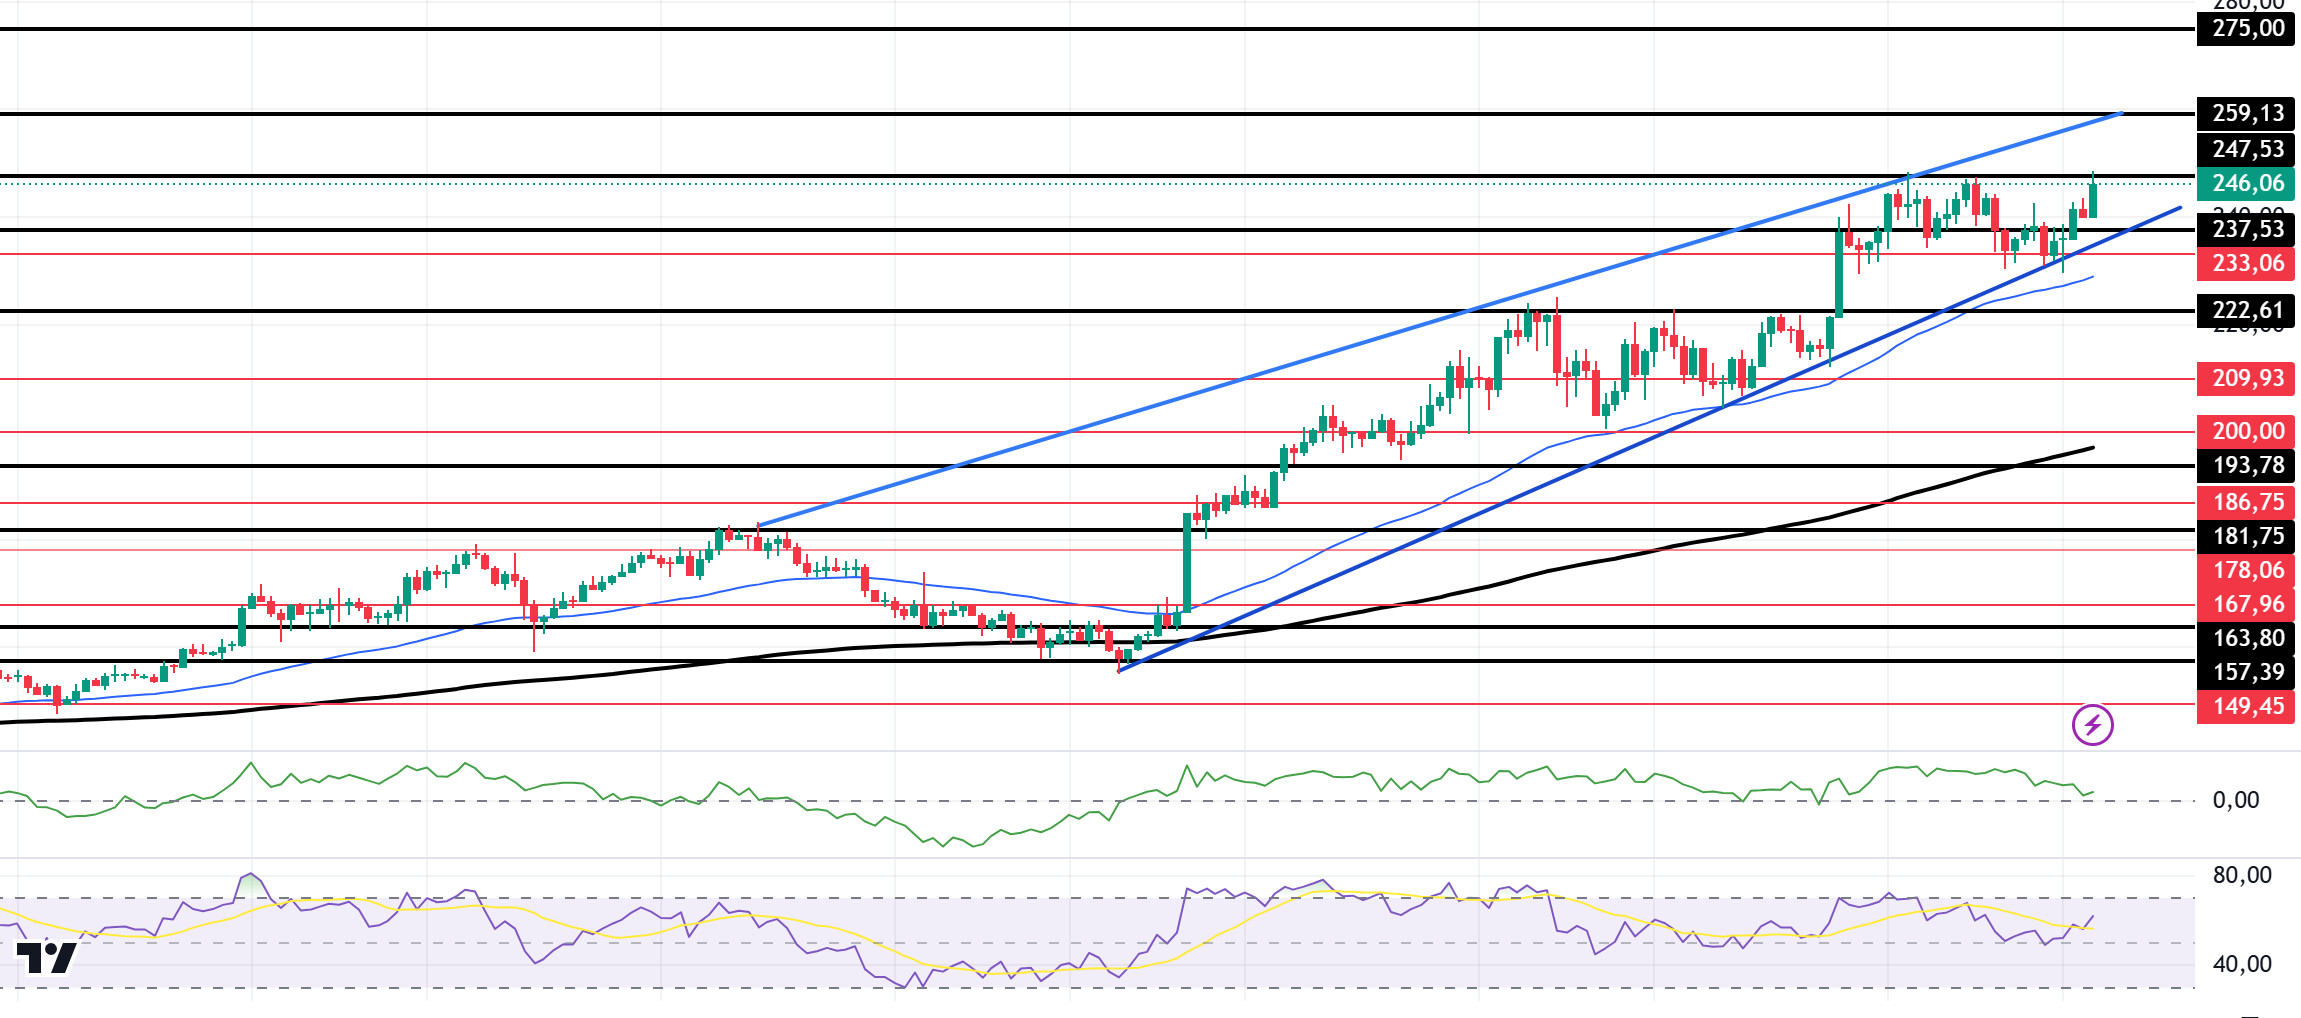
En el marco temporal de 4 horas, la EMA de 50 (línea azul) sigue por encima de la EMA de 200 (línea negra). Desde el 4 de noviembre, SOL sigue cotizando al alza manteniendo esta tendencia. Al mismo tiempo, vemos emerger un patrón de cuña ascendente en el gráfico. Una cuña ascendente suele considerarse una señal bajista. Sin embargo, cuando examinamos el indicador Chaikin Money Flow (CMF)20 , las entradas de dinero son positivas, pero se vuelve a producir un aumento de las entradas. Al mismo tiempo, el Índice de Fuerza Relativa (RSI)14 ha pasado de la zona de sobrecompra a los niveles medios. El nivel de 247,53 parece ser un punto de resistencia muy fuerte en las subidas impulsadas tanto por las condiciones macroeconómicas como por las innovaciones en el ecosistema de Solana. Si se rompe aquí, la subida podría continuar. En caso de posibles retrocesos debidos a razones macroeconómicas o a ventas de beneficios, los niveles de soporte de 222,61 y 193,78 podrían activarse de nuevo. Si el precio alcanza estos niveles de soporte, puede surgir una posible oportunidad alcista si aumenta el impulso.
Soportes 237,53 - 233,06 - 222,61
Resistencias 247,53 - 259,13 - 275,00
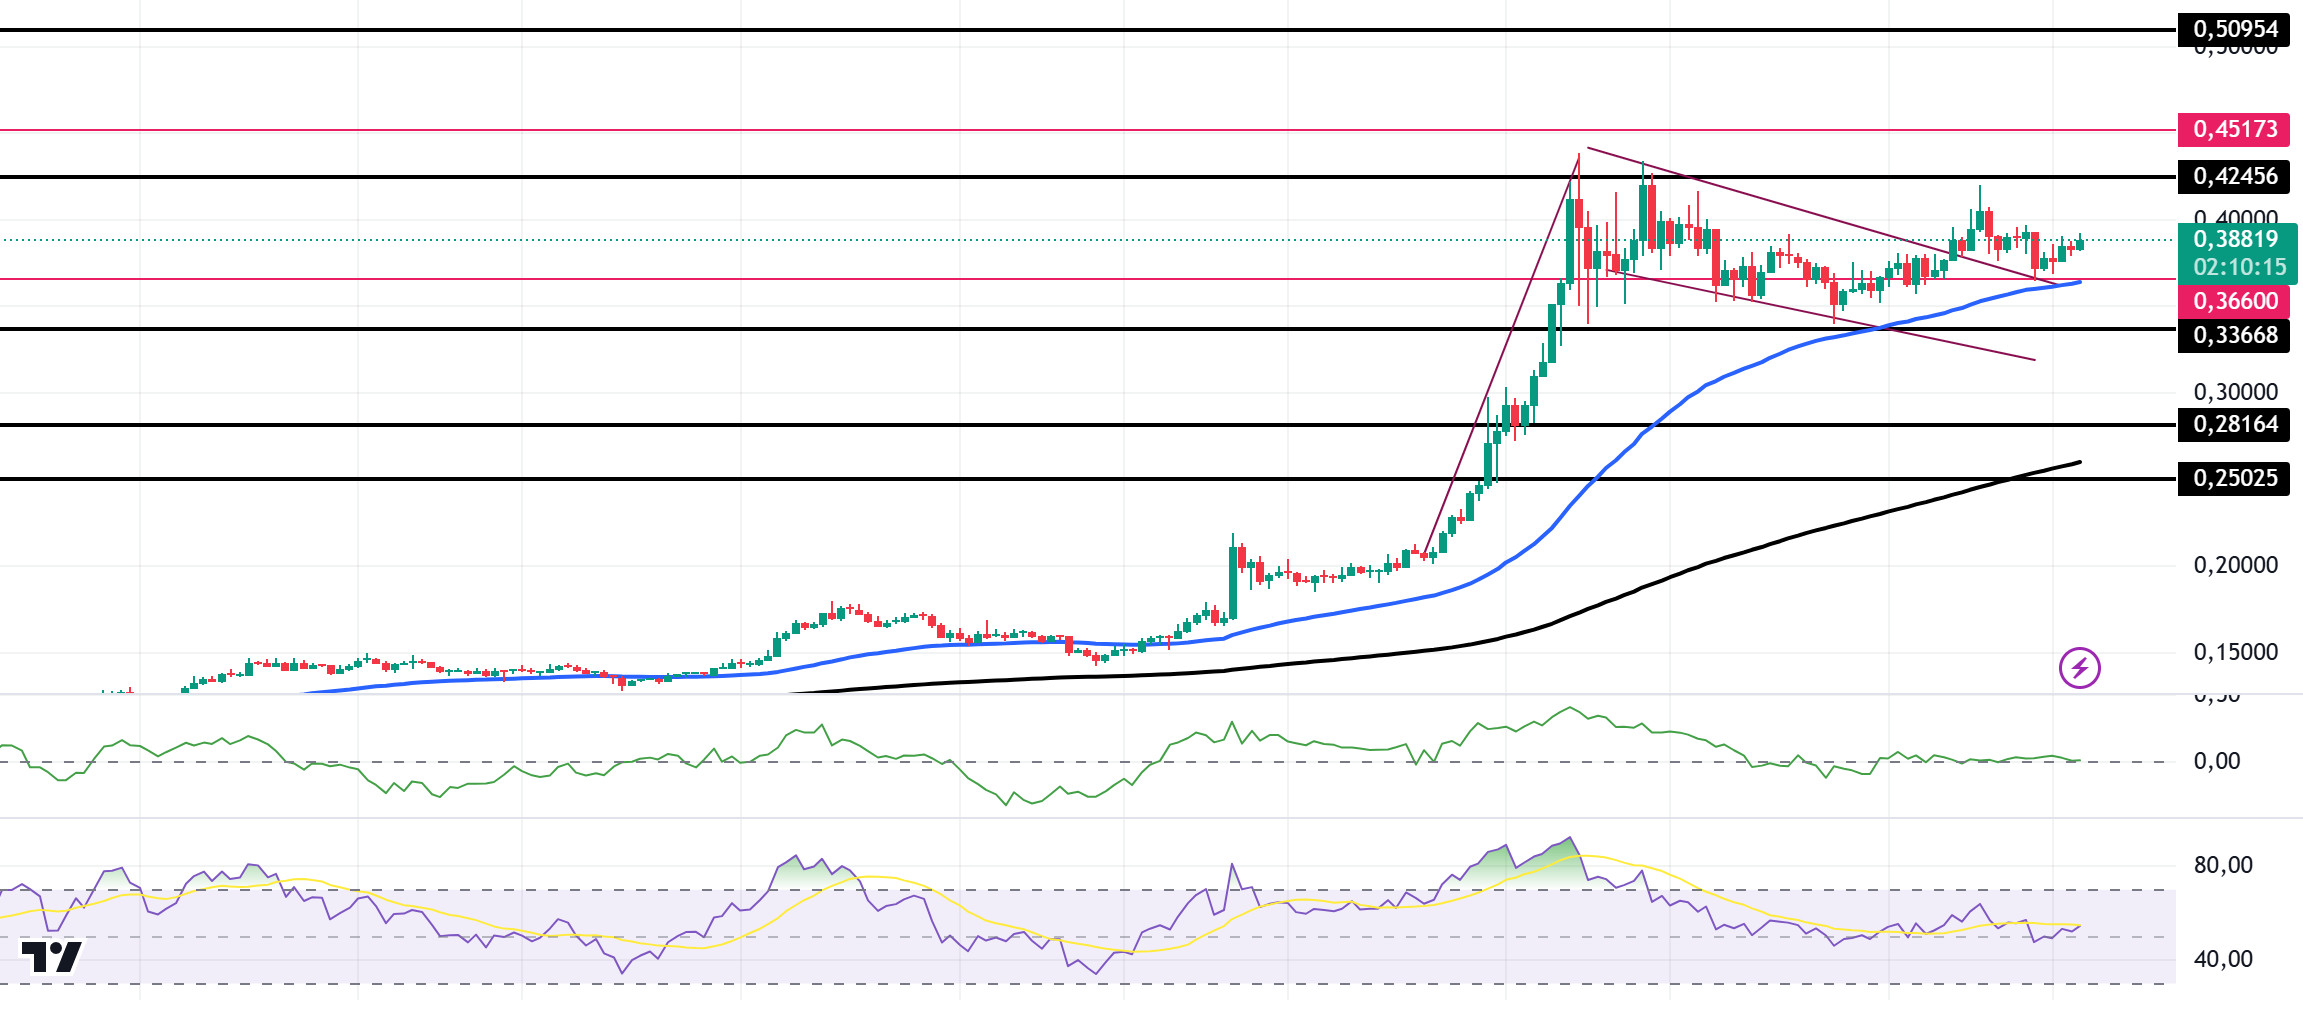
DOGE/USDT
Las direcciones activas de Dogecoin alcanzaron un all-time high, superando los 1,33 millones de participantes diarios. Este aumento refleja la creciente demanda de la red, que es un indicador alcista para la criptodivisa. La expansión del volumen de trading promociona a DOGE como refugio seguro. El aumento de la actividad de la red ha respaldado históricamente las subidas de los precios. La confianza de los inversores, unida a las señales más amplias del mercado, aumenta la probabilidad de que continúe la presión alcista sobre el precio.
Técnicamente, el Dux sigue consolidándose por encima de 0,35 desde nuestro análisis de la mañana. Sin embargo, se ha formado un patrón de bandera alcista. Si el patrón funciona tras un breve retroceso o consolidación, la tendencia alcista podría continuar. En el marco temporal de 4 horas, la EMA de 50 (línea azul) está por encima de la EMA de 200 (línea negra). Esto puede significar que la tendencia alcista continuará. Sin embargo, la diferencia entre ambas medias sigue siendo demasiado amplia. Esto podría provocar retrocesos. Al mismo tiempo, el Índice de Fuerza Relativa (RSI)14 ha pasado de sobrecomprado a neutral. Sin embargo, si examinamos el indicador Chaikin Money Flow (CMF)20, sigue siendo neutral. El nivel de 0,42456 destaca como un punto de resistencia muy fuerte en las subidas impulsadas tanto por las condiciones macroeconómicas como por las innovaciones en la moneda Doge. Si el DOGE, que se puso a prueba aquí, mantiene su impulso y supera este nivel, la subida puede continuar con fuerza. En caso de retrocesos debidos a posibles razones macroeconómicas o ventas de beneficios, los niveles de soporte de 0,33668 y 0,28164 pueden activarse de nuevo. Si el precio alcanza estos niveles de soporte, puede surgir una posible oportunidad alcista si aumenta el impulso.
Soporta 0,36600 - 0,33668 - 0,28164
Resistencias 0,42456 - 0,45173 - 0,50954
AVISO LEGAL
La información sobre inversiones, los comentarios y las recomendaciones aquí contenidos no constituyen asesoramiento en materia de inversiones. Los servicios de asesoramiento en materia de inversión son prestados individualmente por instituciones autorizadas teniendo en cuenta las preferencias de riesgo y rentabilidad de los particulares. Los comentarios y recomendaciones aquí contenidos son de carácter general. Estas recomendaciones pueden no ser adecuadas para su situación financiera y sus preferencias de riesgo y rentabilidad. Por lo tanto, tomar una decisión de inversión basándose únicamente en la información aquí contenida puede no producir resultados acordes con sus expectativas.