
RESUMEN DEL MERCADO
Última situación de los criptoactivos
| Activos | Último precio | 24h Cambio | Dominación | Market Cap |
|---|---|---|---|---|
| BTC | 93,894.27 | 1.71% | 57.18% | 1,86 T |
| ETH | 3,484.81 | 5.08% | 12.92% | 419,65 B |
| SOLANA | 237.13 | 3.73% | 3.46% | 112,45 B |
| XRP | 1.431 | 5.13% | 2.51% | 81,45 B |
| DOGE | 0.3927 | 3.88% | 1.78% | 57,70 B |
| CARDANO | 0.9971 | 9.06% | 1.08% | 34,97 B |
| AVAX | 42.87 | 2.89% | 0.54% | 17,54 B |
| TRX | 0.2013 | 5.87% | 0.54% | 17,39 B |
| SHIB | 0.00002497 | 4.13% | 0.45% | 14,70 B |
| DOT | 8.329 | 5.71% | 0.39% | 12,66 B |
| ENLACE | 17.90 | 6.30% | 0.35% | 11,22 B |
*Prepared on 11.27.2024 at 14:00 (UTC)
LO QUE QUEDA ATRÁS
Pro-Crypto Paul Atkins Possibility for SEC Chairmanship
In the event that Donald Trump is re-elected president, the name that will replace SEC Chairman Gary Gensler is a matter of curiosity. Former SEC executive Paul Atkins, known to be pro-crypto, stands out as the strongest candidate for the new presidency.
728,000 Bitcoins Sold in the Last 1 Month: 7-Month Record
As the price of Bitcoin fell as low as $91,750, CryptoQuant data revealed that long-term investors sold a total of 728,000 BTC in the last month. This sales volume reached the highest level in the last seven months.
China’s Joint Action Plan for Digital Finance
The People’s Bank of China and seven departments have released a comprehensive Action Plan to promote the growth of the digital finance sector. The plan includes priority areas such as supporting digital RMB pilots, green finance, and sci-tech finance. It also aims to improve the quality and efficiency of financial services.
‘CONSENT’ Meme Coin Race from MetaMask Founders
MetaMask co-founder Dan Finlay launched a token called “CONSENT” on the Warpcast platform. Then, a meme coin with the same name appeared on the Solana network. Finlay said he launched this experiment to benchmark the performance of the two tokens. As a result of the competition between the CONSENT tokens on the Warpcast and Solana networks, only one will survive.
LO MÁS DESTACADO DEL DÍA
Datos importantes del calendario económico
| Tiempo | Noticias | Expectativa | Anterior |
|---|---|---|---|
| 14:45 | US Chicago PMI | 44.9 | 41.6 |
| 15:00 | US Core PCE Price Index (YoY) (Oct) | 2.8% | 2.7% |
| 15:00 | US Core PCE Price Index (MoM) (Oct) | 0.3% | 0.3% |
| 15:00 | US PCE Price Index (YoY) (Oct) | 2.3% | 2.1% |
| 15:00 | US Pending Home Sales (MoM) (Oct) | -2.1% | 7.4% |
INFORMACIÓN
*El calendario se basa en el huso horario UTC (Tiempo Universal Coordinado).
El contenido del calendario económico de la página correspondiente se obtiene de proveedores de noticias y datos fiables. Las noticias del contenido del calendario económico, la fecha y hora del anuncio de la noticia, los posibles cambios en las cifras anteriores, las expectativas y las cifras anunciadas son realizadas por las instituciones proveedoras de datos. Darkex no se hace responsable de los posibles cambios que puedan surgir de situaciones similares.
BRÚJULA DE MERCADO
While global markets were in turmoil, digital assets remained relatively strong. While major cryptocurrencies rallied for the rest of the day, Trump’s stance on tariffs dampened risk appetite. European bourses are on the sidelines and Wall Street is expected to start the new day mixed. Markets will continue to monitor US data.
After today’s data releases, markets will turn their attention to the PCE Price Index, which is used by the FED to monitor inflation. Since we think that a more micro perspective is needed, we think that it would be better to consider the core PCE figures on a monthly basis for this month’s data.
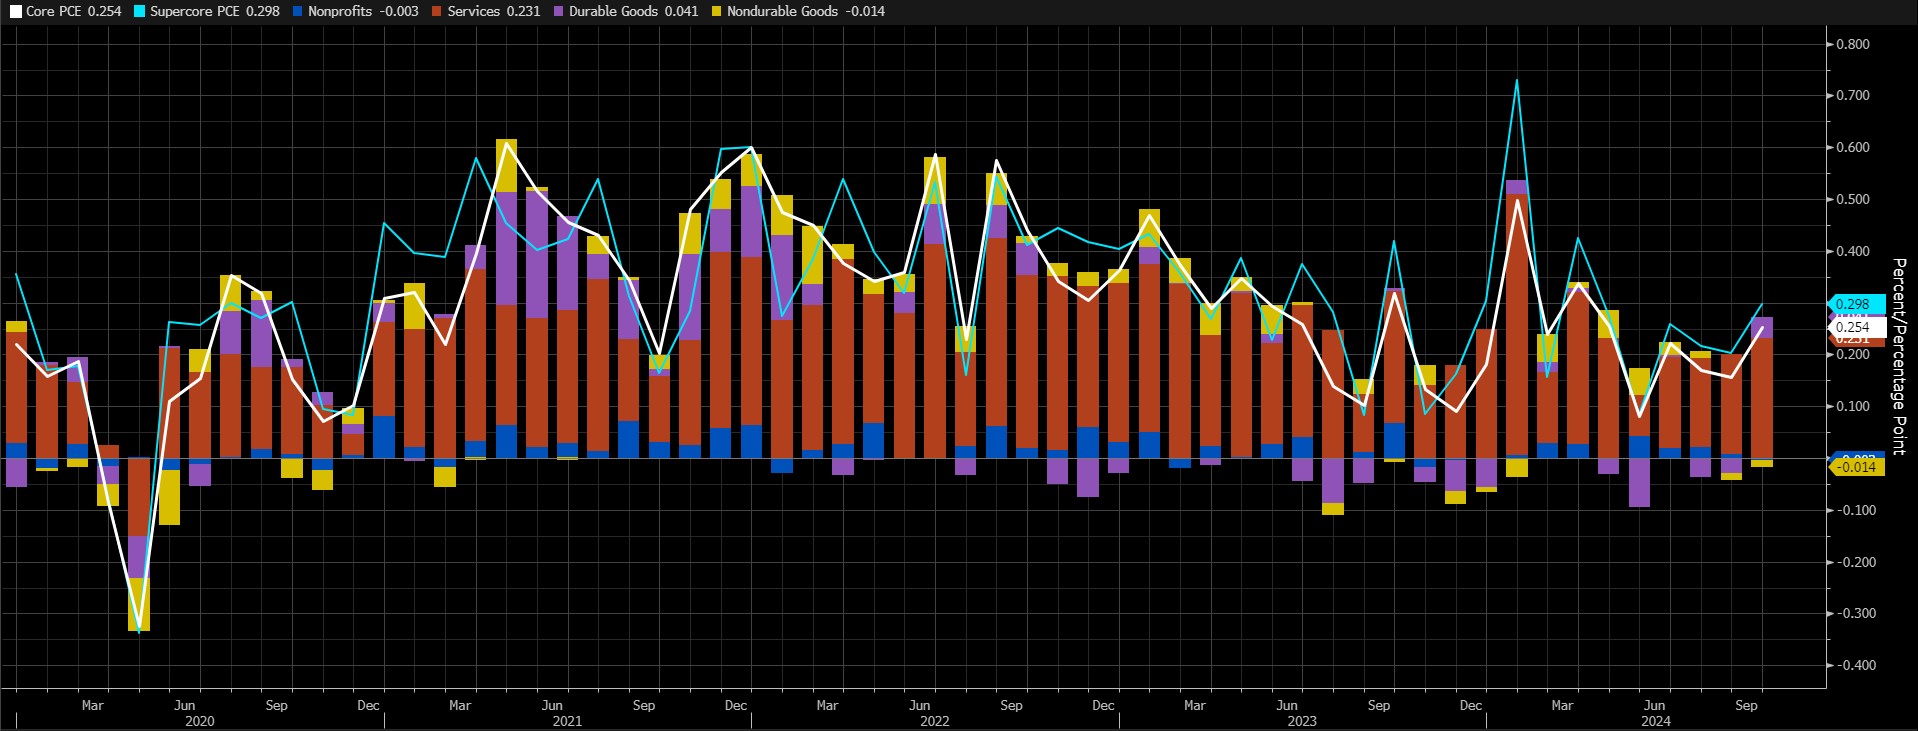
This figure had pointed to an increase of around 0.3% in Septiembre. Expectations are for the same level in Octubre. Services inflation seems to be the item that will make the highest contribution to the index again. A higher-than-expected data may suggest that the FED should put the brakes on interest rate cuts and we think this may reduce risk appetite. A lower-than-expected data, on the other hand, may provide a basis for a rise in digital assets.
From the short term to the big picture…
The victory of former President Trump on Noviembre 5, which was one of the main pillars of our bullish expectation for the long-term outlook in digital assets, produced a result in line with our forecasts. Despite Powell’s cautious messages in his recent speech, the Fed’s continuation of the interest rate cut cycle, and the volume in BTC ETFs indicating an increase in institutional investor interest (in addition to MicroStrategy’s BTC purchases, Microsoft starting to evaluate the purchase issue, BlackRock’s BTC ETF options starting trading…) support our upside forecast for the big picture for now.
For the short term, given the nature of the market and pricing behavior, we think it would not be surprising to see occasional respite or pullbacks in digital assets. We also evaluated the downward movements that occurred after Trump’s statements on tariffs within this framework. Also, at this point, it would be useful to underline again that fundamental dynamics continue to be bullish. We continue to monitor the struggle between buyers whose appetite for taking new, upward positions may revive and the masses who may look for space for profit realization.
ANÁLISIS TÉCNICO
BTC/USDT
The market capitalization of MicroStrategy, which has recently attracted attention with its increased Bitcoin purchases, has been wiped out by $ 30 billion with the recent decline in Bitcoin. The company’s shares fell more than 12% yesterday. In these days of a relatively quieter agenda by institutional investors, the outflows on the Bitcoin spot ETF side in the last two days continue to create selling pressure on the price.
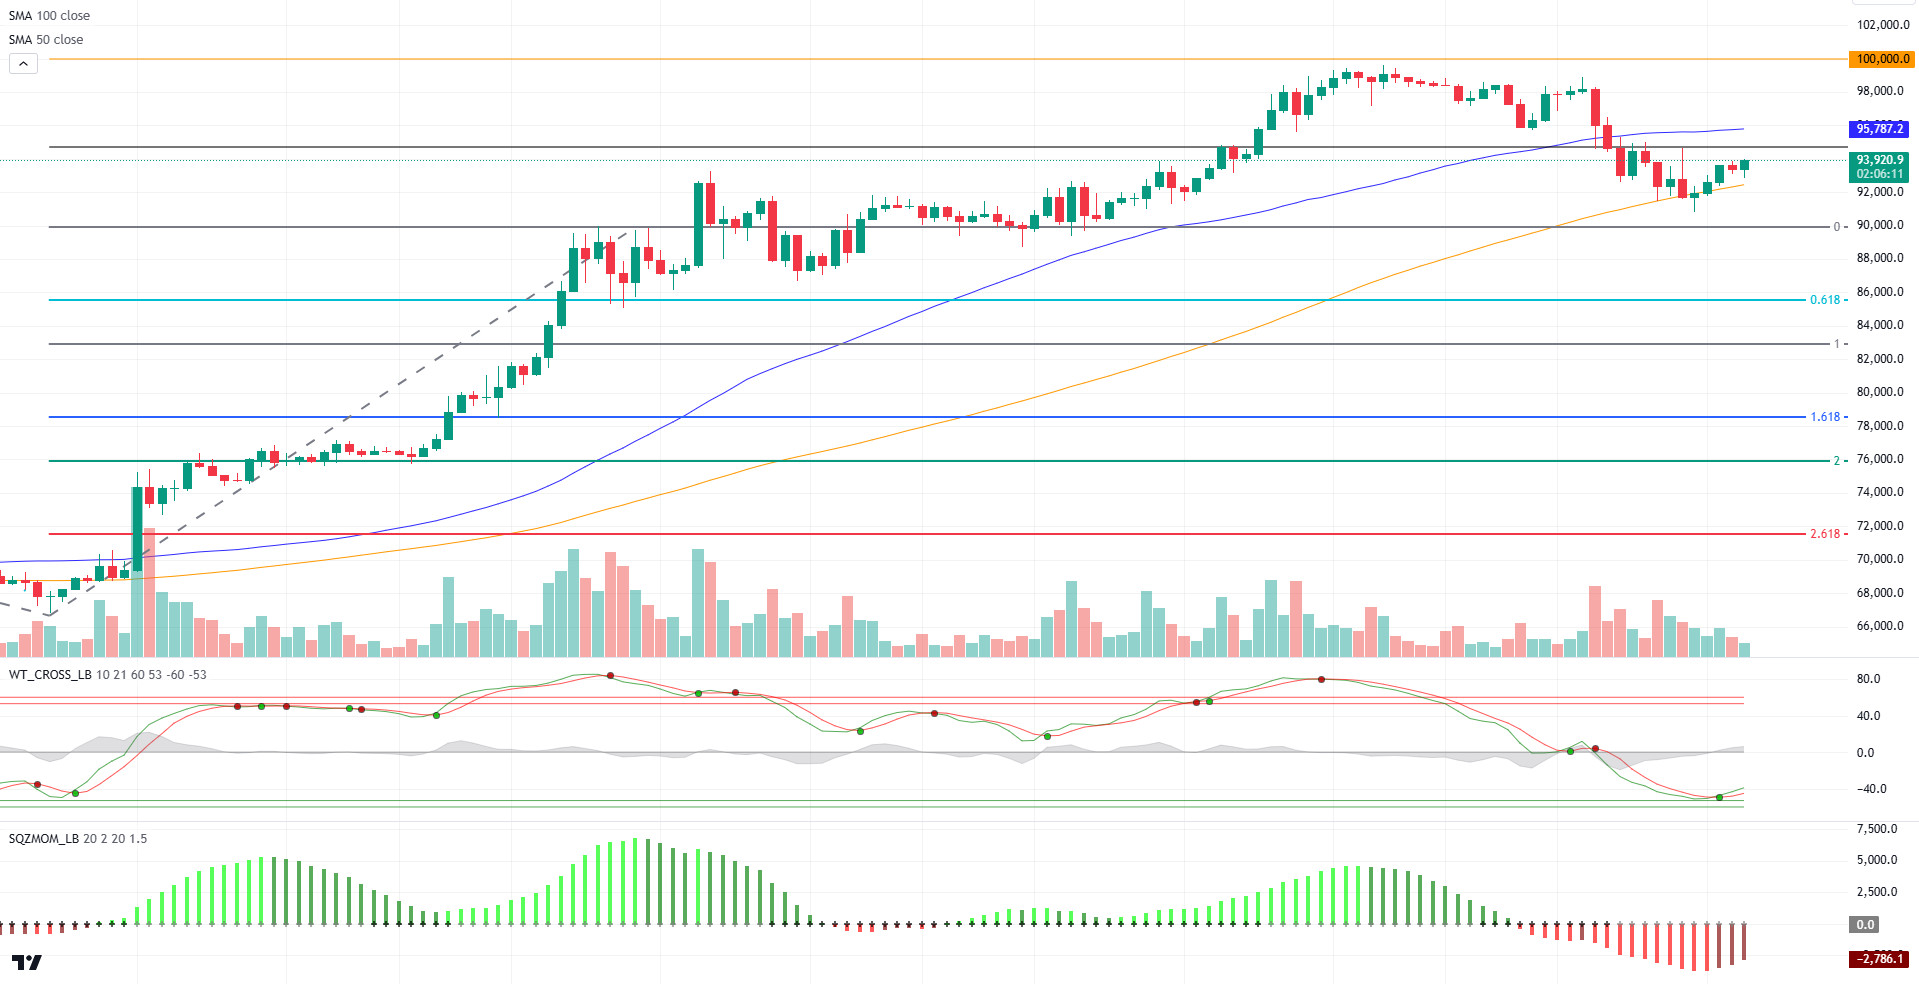
Looking at the technical outlook, selling pressure in the market is causing low momentum on the price. Currently priced at 93,800 on the 100-day SMA, BTC’s 95,000 resistance level is critical for the continuation of the trend. The fact that technical oscillators give a buy signal in the oversold area on hourly charts supports a potential rise. The re-experience of positive inflows on the spot ETF side may push the price back to the psychological resistance level of 100,000 in the medium term with the strengthening of the squeeze momentum indicator. In a possible retracement with increasing selling pressure, we will follow the 92,500-support level.
Supports:92,500 – 90,000 – 87,000
Resistances 95,000 – 99,655 – 100,000
ETH/USDT
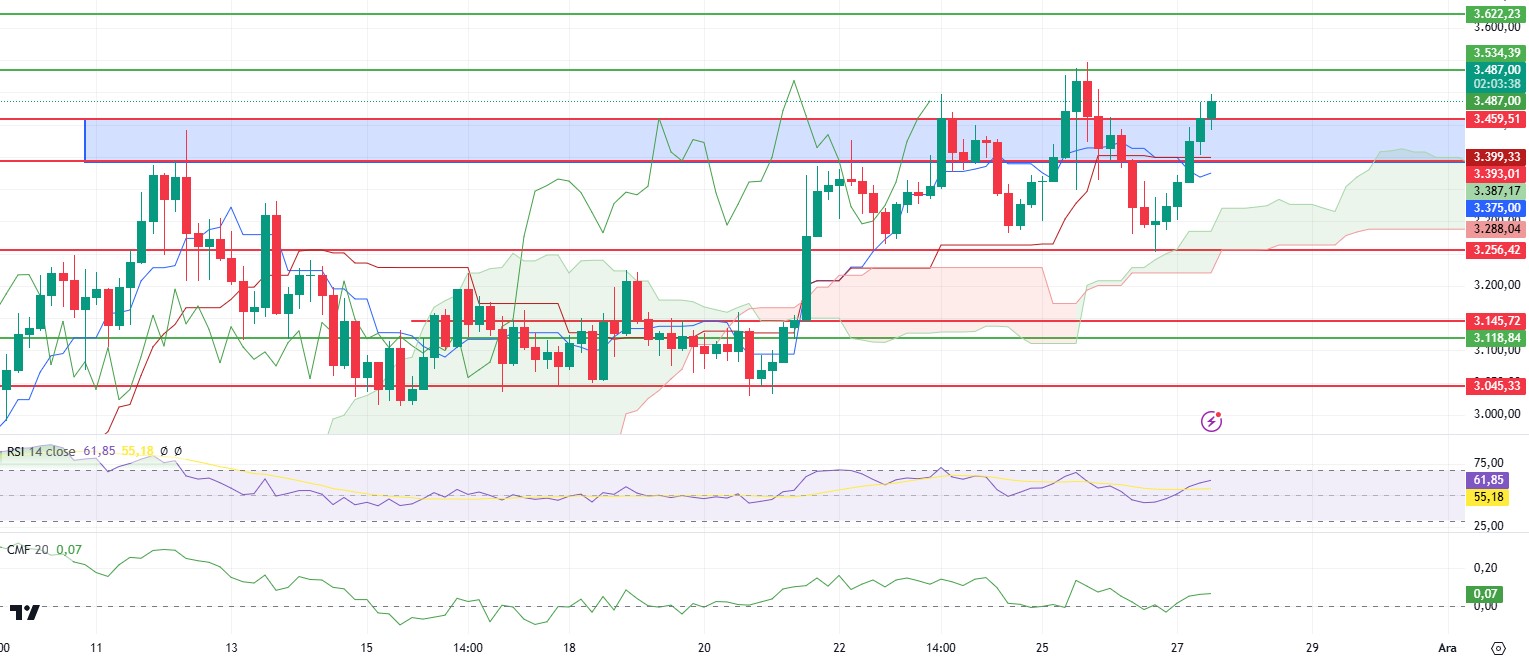
ETH broke the potential Head and Shoulders pattern structure by maintaining the momentum after the morning rally and exceeding the 3.459 area. The positive outlook of Relative Strength Index (RSI) and Chaikin Money Flow (CMF) pricing above the zero zone suggest that price action is likely to move above 3,534. On the Ichimoku indicator, the upward trend of the tenkan line and especially the rise above the kijun level can be expected to continue with momentum. On the other hand, we see that spot purchases continue in Cumulative Volume Delta (CVD). Especially the increasing demand for the High Gain Vault product released by KelpDAO also has a significant impact on this situation. In summary, a continuation of the upward movement above the 3,534 level can be expected. The 3,256 level remains valid as the most important support point to be considered. The loss of this level may bring declines up to 3,045 levels.
Supports 3,459 – 3,393 – 3,256
Resistances 3,534 – 3,622 – 3,717
XRP/USDT
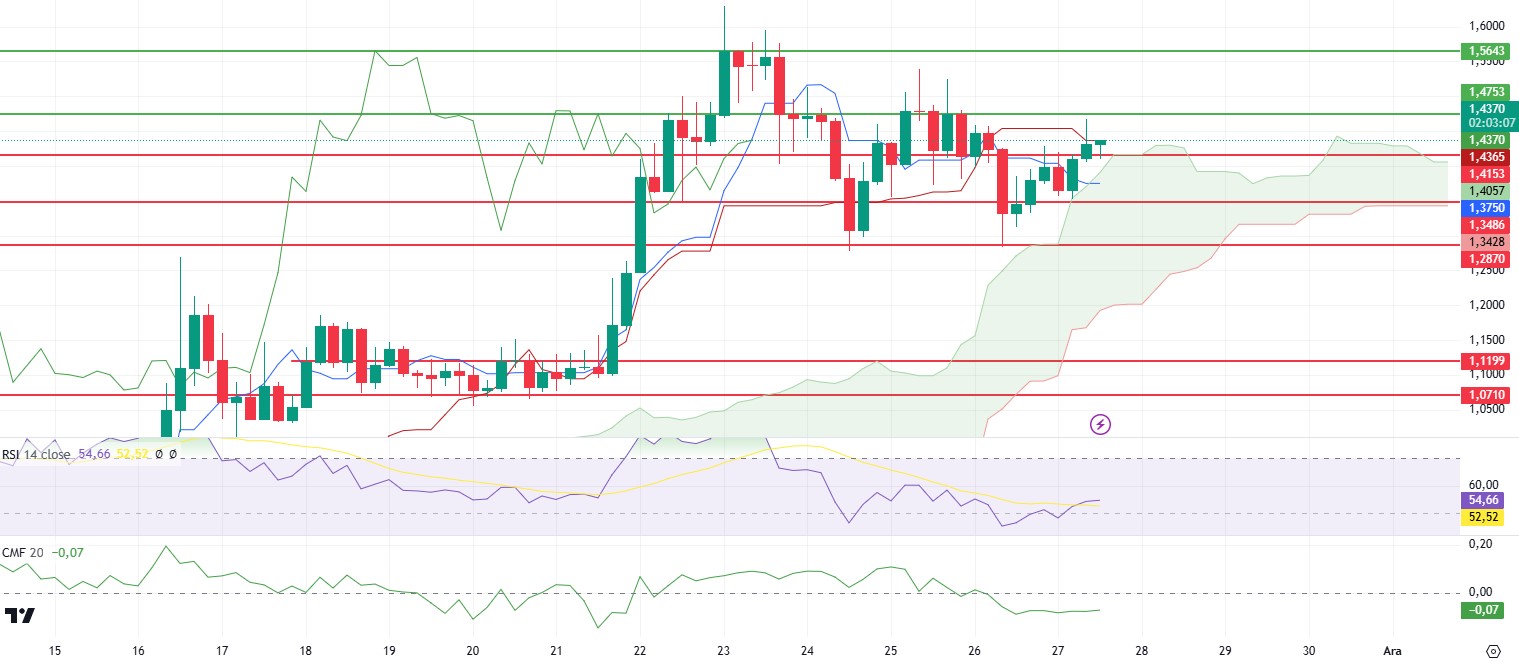
XRP experienced mobility in the morning hours, rising towards the 1.47 level. This region, which coincides with the Kijun line, has been rejected. With this price action, it is clearly seen that the negative outlook of the Relative Strength Index (RSI) has turned positive. Chaikin Money Flow (CMF), on the other hand, creates a structure that can support the rise by moving horizontally despite being in the negative zone. For this time frame, where Kumo cloud support has moved up, the price can be expected to make an upward move, provided that the 1.41 zone is not lost. However, the loss of the mentioned level may initiate a downward movement back to 1.34.
Supports 1.4153 – 1.3486 – 1.2870
Resistances 1.4753 – 1.5643 – 1.7043
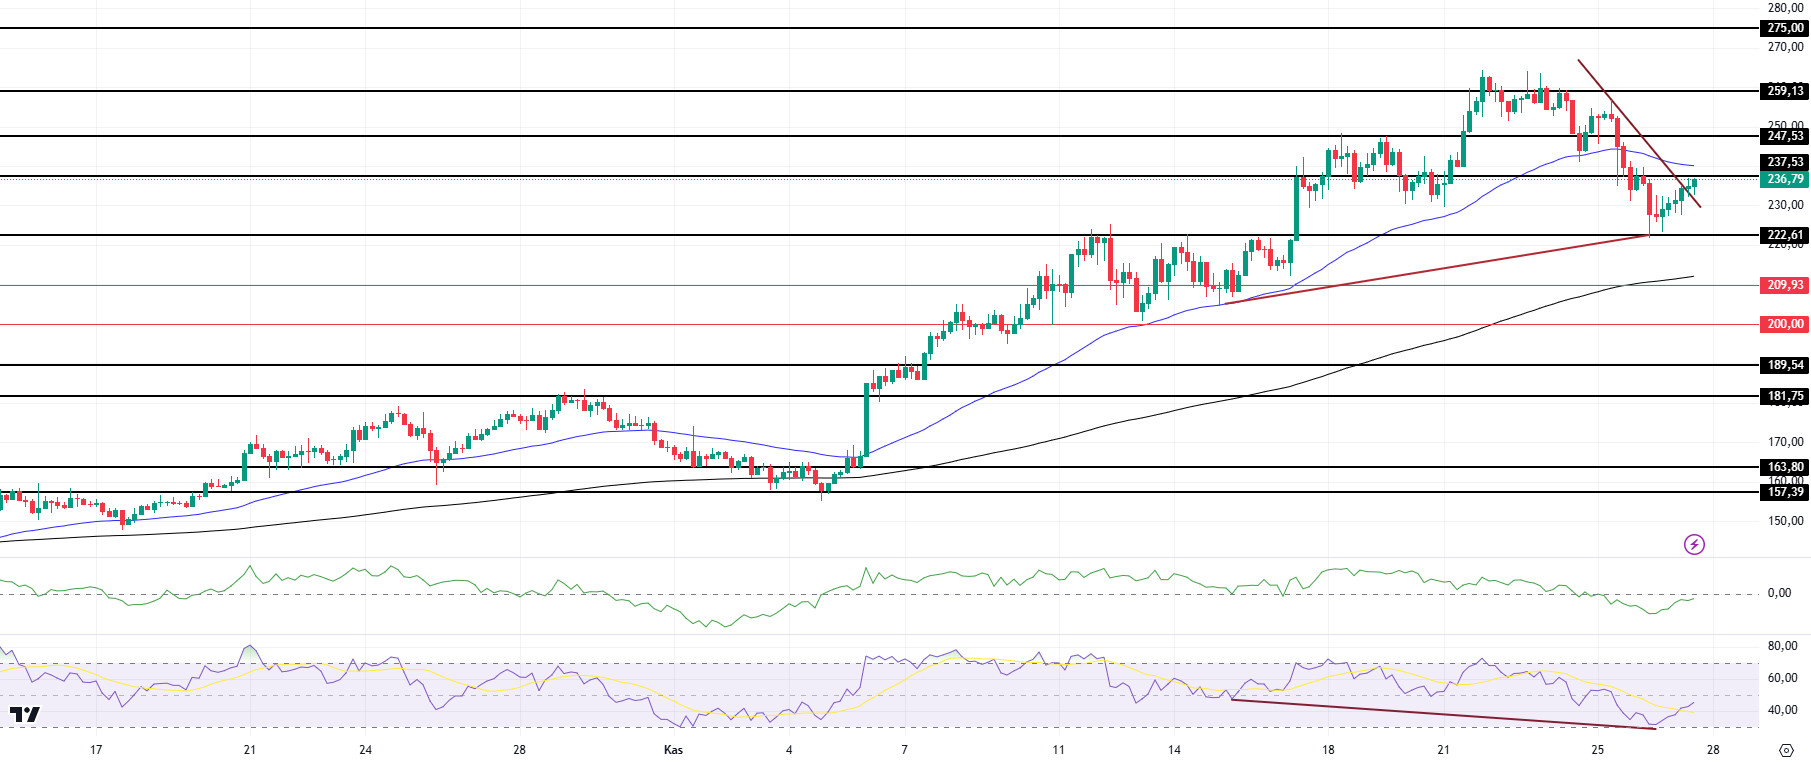
SOL/USDT
On the 4-hour timeframe, the 50 EMA (Blue Line) is above the 200 EMA (Black Line). Since Noviembre 4, SOL, which has been in an uptrend since Noviembre 4, has broken this trend downwards. However, when we examine the Chaikin Money Flow (CMF)20 indicator, money inflows have turned negative after a long time, but there is a horizontal impression in inflows. At the same time, Relative Strength Index (RSI)14 has risen from the overbought zone to the neutral level. However, there is a mismatch. This can be shown as a bullish signal. The 259.13 level stands out as a very strong resistance point in the rises driven by both macroeconomic conditions and innovations in the Solana ecosystem. If it breaks here, the rise may continue. In case of retracements due to possible macroeconomic reasons or profit sales, support levels 222.61 and 189.54 can be triggered again. If the price reaches these support levels, a potential bullish opportunity may arise if momentum increases.
Supports 222.61 – 209.93 – 200.00
Resistances 237.53 – 247.53 – 259.13
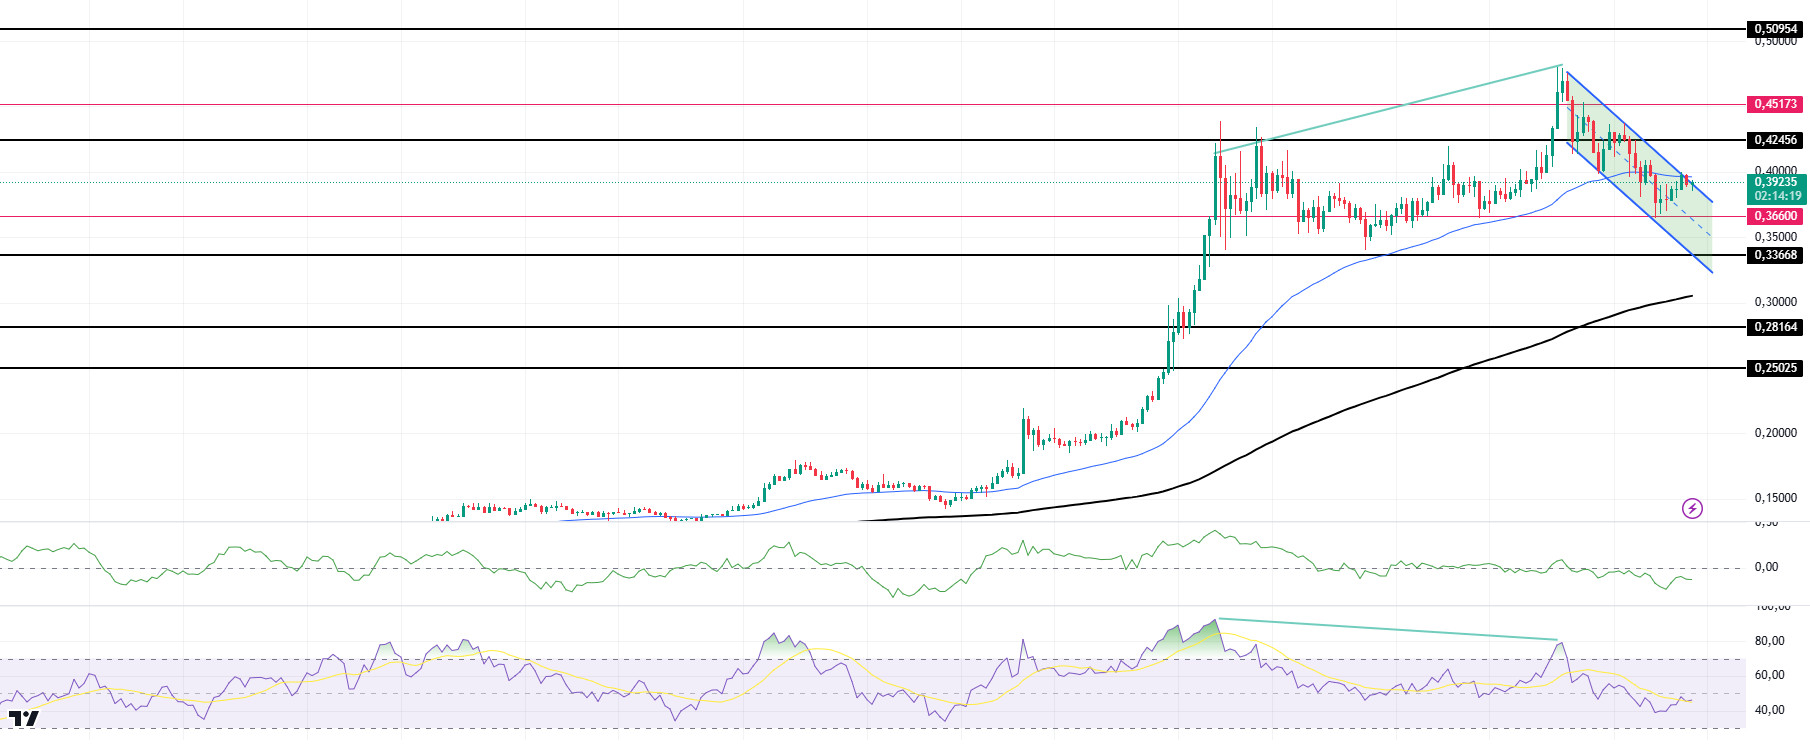
DOGE/USDT
Technically, the Relative Strength Index (RSI) 14 seems to have worked inconsistently with the chart. If the upward momentum is weak, pullbacks may deepen. On the 4-hour timeframe, the 50 EMA (Blue Line) is above the 200 EMA (Black Line). But the gap between the two averages is still too wide. This may cause pullbacks. The price broke the 50 EMA and is using the moving average as resistance. On the other hand, looking at some indicators, the RSI 14 has moved from the overbought zone to the neutral level. However, the Chaikin Money Flow (CMF)20 indicator has also turned negative. This shows us that there are money outflows, indicating that the pullbacks may deepen. The 0.50954 level appears to be a very strong resistance place in the rises driven by both macroeconomic conditions and innovations in Doge coin. If DOGE maintains its momentum and rises above this level, the rise may continue strongly. In case of retracements due to possible macroeconomic reasons or profit sales, the support levels of 0.36600 and 0.33668 can be triggered again. If the price hits these support levels, a potential bullish opportunity may arise if momentum increases.
Supports 0.36600 – 0.33668 – 0.28164
Resistances 0.42456 – 0.45173 – 0.50954
AVISO LEGAL
La información sobre inversiones, los comentarios y las recomendaciones que figuran en este documento no constituyen asesoramiento en materia de inversiones. Los servicios de asesoramiento en materia de inversión son prestados individualmente por instituciones autorizadas teniendo en cuenta las preferencias de riesgo y rentabilidad de los particulares. Los comentarios y recomendaciones aquí contenidos son de carácter general. Estas recomendaciones pueden no ser adecuadas para su situación financiera y sus preferencias de riesgo y rentabilidad. Por lo tanto, tomar una decisión de inversión basándose únicamente en la información aquí contenida puede no producir resultados acordes con sus expectativas.
