RESUMEN DEL MERCADO
Última situación de los criptoactivos
| Activos | Último precio | 24h Cambio | Dominación | Capitalización bursátil. |
|---|---|---|---|---|
| BTC | 97,032.36 | 1.68% | 56.91% | 1,92 T |
| ETH | 3,601.31 | 0.14% | 12.85% | 433,88 B |
| SOLANA | 243.22 | 3.08% | 3.42% | 115,50 B |
| XRP | 1.689 | 15.79% | 2.88% | 96,67 B |
| DOGE | 0.4150 | 3.61% | 1.81% | 61,00 B |
| CARDANO | 1.0603 | 5.58% | 1.10% | 37,21 B |
| AVAX | 43.71 | 3.33% | 0.53% | 17,88 B |
| TRX | 0.2040 | 1.49% | 0.52% | 17,61 B |
| SHIB | 0.00002591 | 2.54% | 0.45% | 15,25 B |
| DOT | 8.648 | 5.88% | 0.39% | 13,17 B |
| ENLACE | 18.04 | 0.73% | 0.33% | 11,30 B |
*Preparado el 29.11.2024 a las 14:00 (UTC)
LO QUE QUEDA ATRÁS
Las criptodivisas estarán disponibles para el comercio internacional en Rusia: Putin Firmado
La nueva ley fiscal aprobada por el Consejo de la Federación en Rusia, que estipula que las criptodivisas están sujetas a derechos de propiedad, fue firmada oficialmente por el presidente Vladimir Putin. Esta normativa allana el camino para el uso de las criptodivisas en el comercio y los pagos internacionales.
Ki Young Ju: El dominio del bitcoin no decaerá
Ki Young Ju, consejero delegado de CryptoQuant, declaró que el aumento del dominio de Bitcoin ha frustrado las expectativas en el mercado de altcoins. Aunque los inversores esperan que las altcoins suban, según Young Ju, el dominio del Bitcoin seguirá aumentando con fuerza.
¿Se desplaza la moneda del bombo a DeFi?
En 2024, mientras las meme coins ganan terreno en el mercado, los tokens de finanzas descentralizadas (DeFi) han experimentado un notable crecimiento recientemente. Según los últimos datos publicados por GMCI, el impulso alcista de las meme coins se ha debilitado, mientras que los tokens DeFi siguen subiendo con fuerza.
LO MÁS DESTACADO DEL DÍA
Datos importantes del calendario económico
| Tiempo | Noticias | Expectativas | Anterior |
|---|---|---|---|
| Media jornada | Día festivo Estados Unidos - Día de Acción de Gracias - Cierre anticipado a las 13:00 |
INFORMACIÓN
*El calendario se basa en la zona horaria UTC (Tiempo Universal Coordinado). El contenido del calendario económico en la página correspondiente se obtiene de proveedores de noticias y datos fiables. Las noticias del contenido del calendario económico, la fecha y hora del anuncio de la noticia, los posibles cambios en las cifras anteriores, las expectativas y las cifras anunciadas son realizadas por las instituciones proveedoras de datos. Darkex no se hace responsable de los posibles cambios que puedan producirse en situaciones similares.
BRÚJULA DE MERCADO
Los mercados estadounidenses, que ayer permanecieron cerrados por la festividad de Acción de Gracias, tendrán hoy una breve sesión de medio día. En Europa, se vigilaron varios indicadores macroeconómicos, incluidos los datos de inflación, y los mercados bursátiles del continente se mantienen planos o mixtos. Se espera que Wall Street comience la nueva jornada con una nota ligeramente positiva. En cuanto a los activos digitales, hemos observado cierta recuperación tras un breve periodo de consolidación. Creemos que este estado de ánimo puede mantenerse al entrar en el nuevo mes. Cabe señalar que la volatilidad en el mercado puede aumentar de vez en cuando debido a la debilidad en el volumen y los derivados que vencen hoy.
Desde el corto plazo hasta el panorama general.
La victoria del expresidente Trump el 5 de noviembre, que era uno de los principales pilares de nuestra expectativa alcista para las perspectivas a largo plazo en los activos digitales, arrojó un resultado en línea con nuestras previsiones. A posteriori, los nombramientos del presidente electo en el Congreso y el aumento de las expectativas regulatorias para el criptoecosistema en EE.UU. se mantuvieron en nuestra ecuación como una variable positiva. Aunque Powell lanzó mensajes cautelosos en su último discurso, el hecho de que la FED continuara su ciclo de recortes de los tipos de interés y el volumen de los ETF de BTC indique un aumento del interés de los inversores institucionales (además, las compras de BTC por parte de MicroStrategy, el inicio de la evaluación de la cuestión de la compra por parte de Microsoft, el inicio de la trading opciones de ETF de BTC por parte de BlackRock...), respaldan por ahora nuestro pronóstico alcista para el panorama general.
A corto plazo, dada la naturaleza del mercado y el comportamiento de los precios, creemos que no sería sorprendente ver un respiro ocasional o retrocesos en los activos digitales. Sin embargo, llegados a este punto, convendría subrayar de nuevo que la dinámica fundamental sigue siendo alcista.
ANÁLISIS TÉCNICO
BTC/USDT
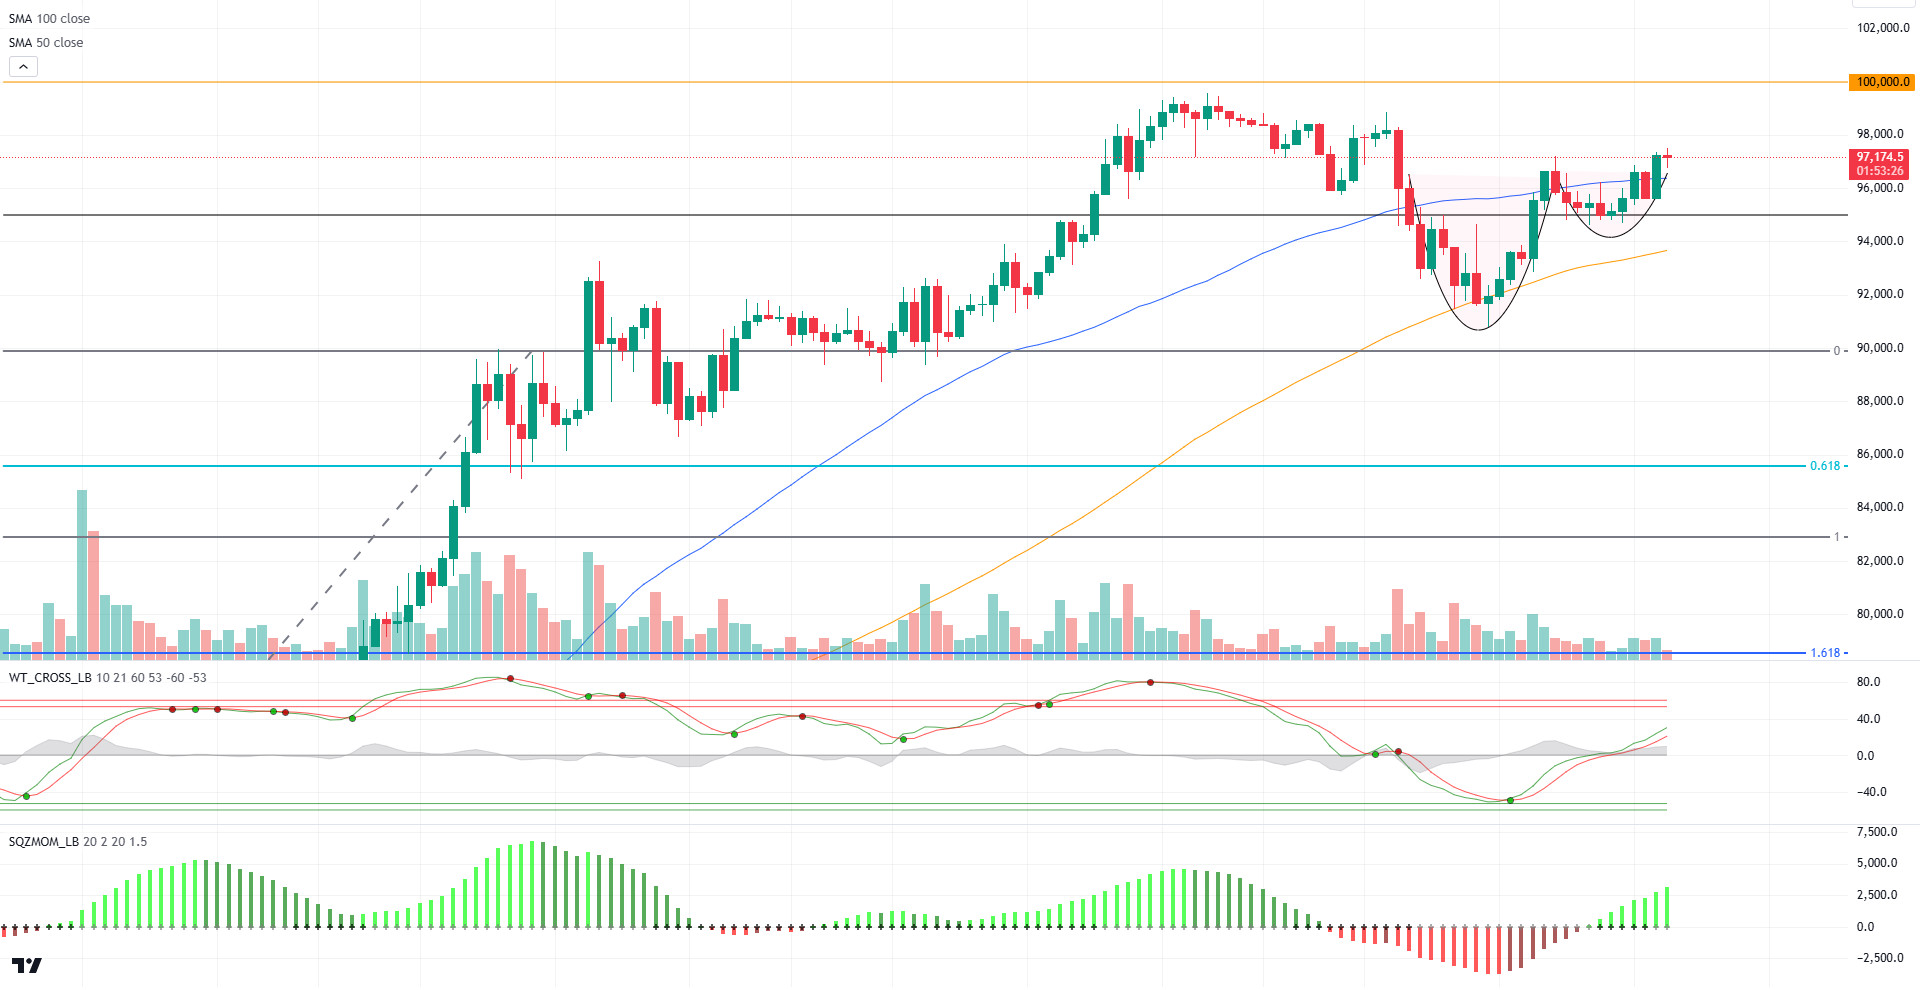
Con la entrada de inversores institucionales en el mercado, se está observando un cambio significativo en el comportamiento de los inversores de Bitcoin. Al contrario que en ciclos anteriores, a pesar de la señal de venta de los indicadores técnicos en gráficos más amplios en sus máximos, está mostrando una fuerte postura en su precio, contraria al sentimiento del mercado, lo que revela que Bitcoin ha empezado a utilizarse como reserva de valor.
De hecho, si nos fijamos en las perspectivas técnicas, está a sólo un 2,60% del nivel ATH de 99,655. Por encima de la línea SMA de 50 días, BTC trading actualmente en 97,000. En el gráfico horario, nuestro oscilador técnico sigue dando señales de compra, mientras que nuestro indicador de impulso está ganando fuerza al volver a territorio positivo. El nivel de resistencia menor que encontraremos en la continuación de la subida parece ser el punto 98.000. En un posible retroceso, volveremos a seguir el punto de soporte de 95.000.
Soportes 95.000 - 92.500 - 90.000
Resistencias 99.655 - 100.000 - 105.000
ETH/USDT
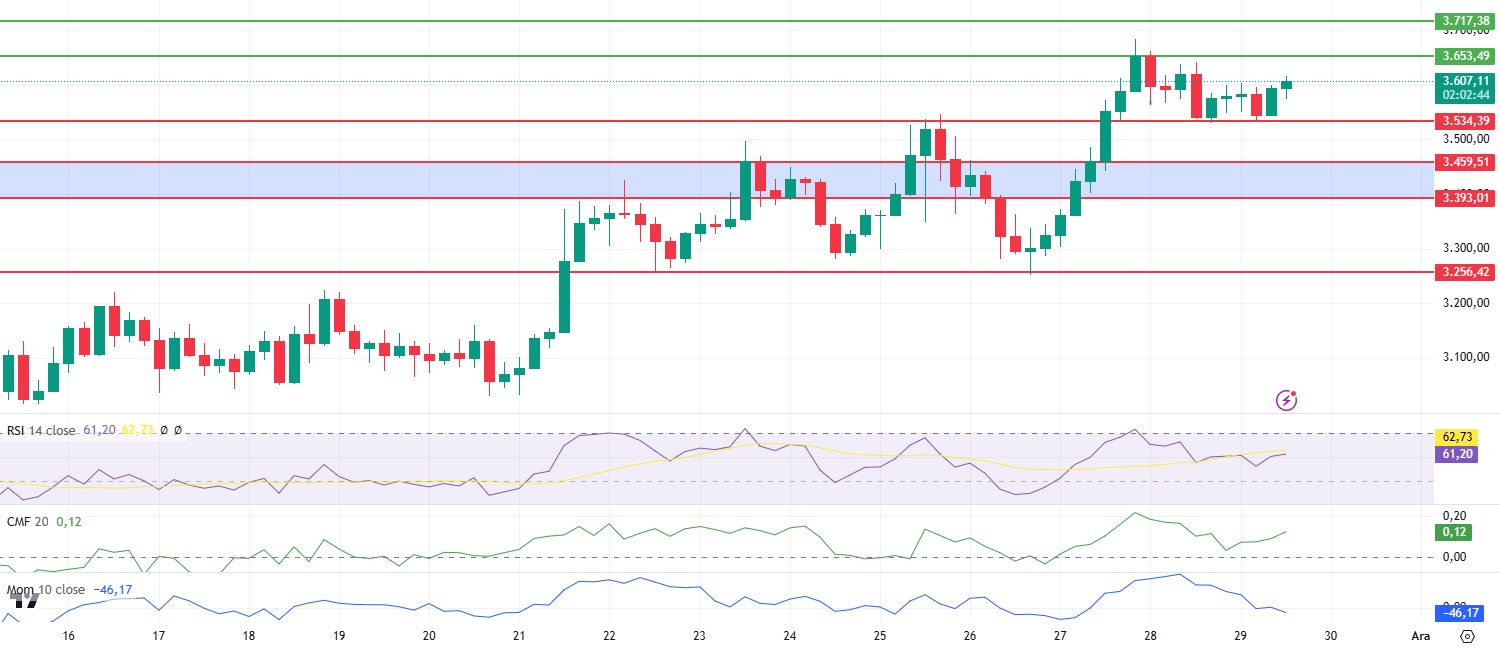
ETH, que probó el nivel de 3.534 una vez más en las horas de la mañana, logró ganar el nivel de 3.600 con la reacción de esta región. Durante este movimiento, se pueden esperar subidas hasta la región de 3.653 en las horas de la tarde debido tanto al doble fondo en 3.534 como al movimiento alcista del Flujo Monetario Chaikin (CMF) con apoyo en la línea cero. Si nos fijamos en el Delta de Volumen Acumulado (CVD), se observa que la aceleración de las compras al contado apoya el escenario positivo. El Índice de Fuerza Relativa (RSI) sigue moviéndose horizontalmente y el impulso continúa debilitándose. En este contexto, puede decirse que en una posible prueba del nivel de 3.534, el precio podría no ser capaz de reaccionar y experimentar descensos más profundos. Se puede decir que la zona marcada en azul en el gráfico sigue siendo una zona de fuerte soporte.
Soportes 3.534 - 3.459 - 3.256
Resistencias 3,653- 3,717 - 3,839
XRP/USDT
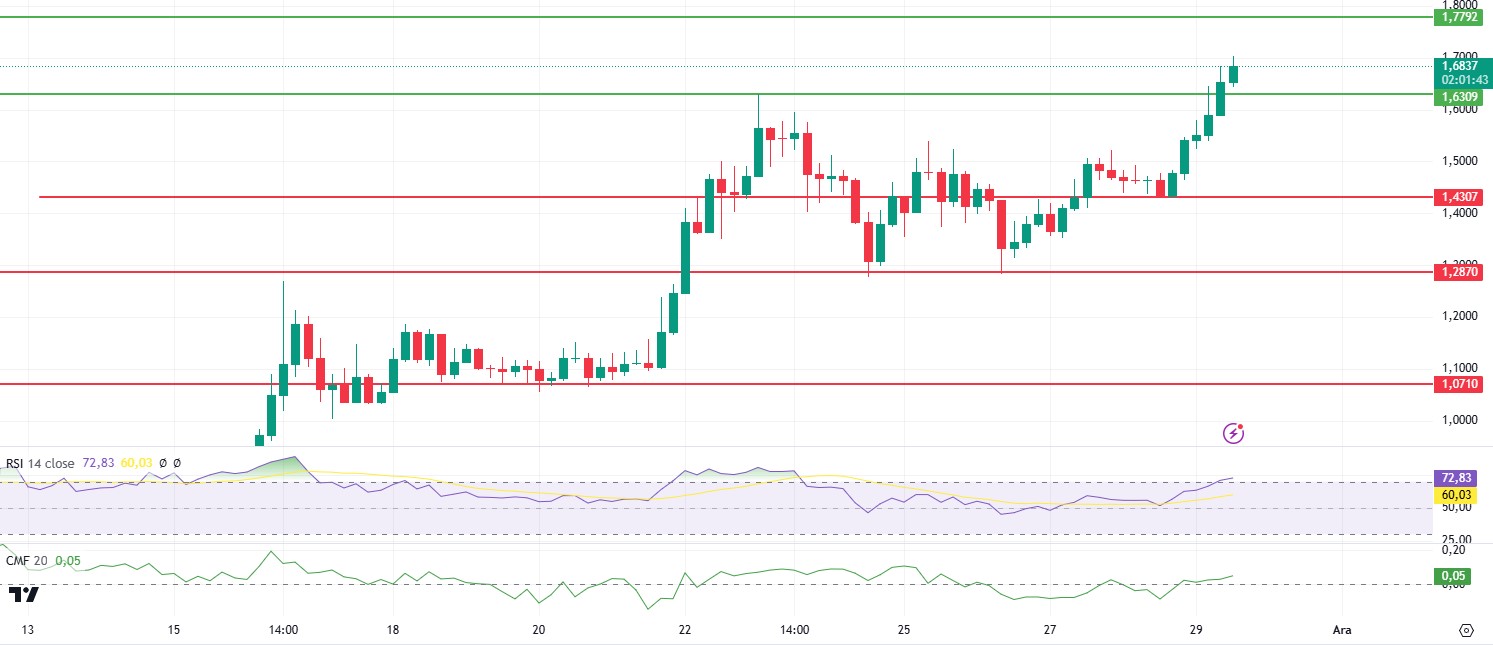
XRP continúa su tendencia alcista, rompiendo la resistencia de 1,63 por la mañana. La ruptura de 1,63, un importante punto de resistencia, y la formación de velas con impulso y gran volumen sugieren que la tendencia puede continuar con fuerza al alza. Mientras continúan las perspectivas positivas en el Chaikin Money Flow (CMF), vemos que el Relative Strength Index (RSI) ha entrado en la zona de sobrecompra. En resumen, puede decirse que la subida puede continuar siempre que no se viole el nivel de 1,63 para el XRP. El nivel de 1,77 sigue siendo la resistencia más importante. La pérdida del nivel de 1,63 puede provocar fuertes caídas.
Soportes 1,6309- 1,4307 - 1,2870
Resistencias 1,7792 - 1,9101 - 1,9890
SOL/USDT
Más de 8.6k monederos Solana vinculados al hackeo de DEXX por valor de 21 millones de dólares Los expertos en seguridad de SlowMist han identificado más de 8.620 monederos Solana vinculados al ataque. Se estima que las pérdidas se acercan a los 30 millones de dólares mientras continúan los esfuerzos de recuperación. Mientras tanto, las posiciones abiertas de Solana en el mercado de derivados cayeron a 3.340 millones de dólares, lo que indica un descenso de la confianza de los inversores.
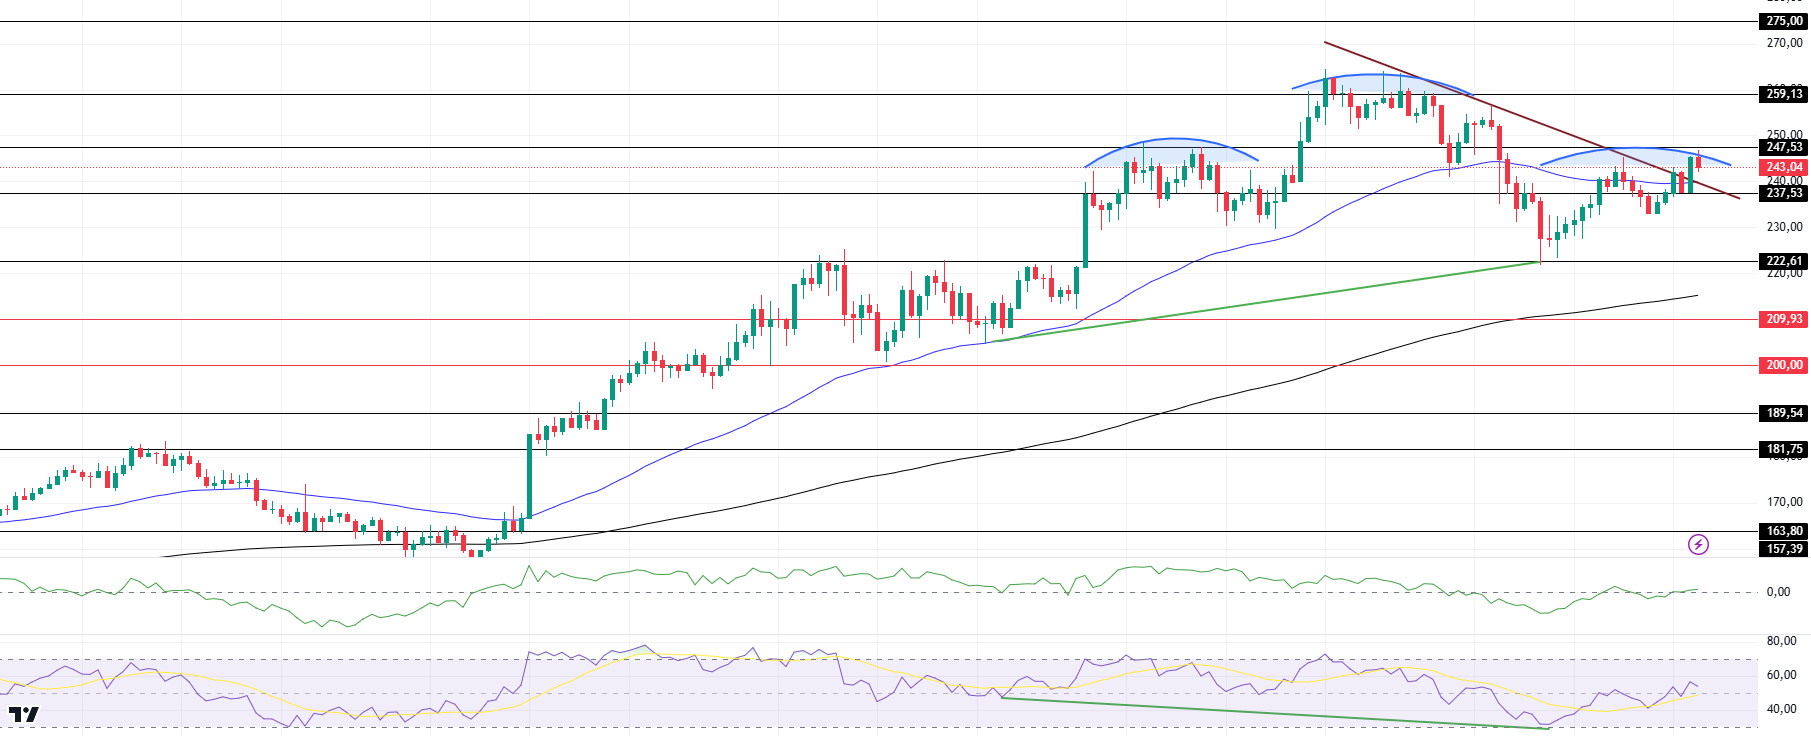
En el marco temporal de 4 horas, la EMA de 50 (línea azul) está por encima de la EMA de 200 (línea negra). Desde el 22 de noviembre, SOL, que ha estado en tendencia bajista desde el 22 de noviembre, rompió la tendencia bajista y se movió al alza. Sin embargo, si examinamos el indicador Chaikin Money Flow (CMF)20 , las entradas de dinero mantienen su equilibrio. Al mismo tiempo, el Índice de Fuerza Relativa (RSI)14 está pasando de la zona de sobrecompra al nivel neutral. Al mismo tiempo, existe un patrón de desajuste denominado divergencia alcista. Esto puede mostrarse como una señal alcista. Otro posible patrón de hombro-cabeza-hombro en el gráfico llama la atención. Si este patrón funciona, podría producirse un retroceso hasta 189,54. El nivel de 259,13 es un punto de resistencia muy fuerte en la tendencia alcista impulsada tanto por las condiciones macroeconómicas como por las innovaciones en el ecosistema de Solana. Si se rompe aquí, la subida puede continuar. En caso de retrocesos debidos a posibles razones macroeconómicas o a ventas de beneficios, los niveles de soporte 222,61 y 189,54 podrían activarse de nuevo. Si el precio alcanza estos niveles de soporte, puede surgir una posible oportunidad alcista si aumenta el impulso.
Soportes 237,53 - 222,61 - 209,93
Resistencias 247,53 - 259,13 - 275,00
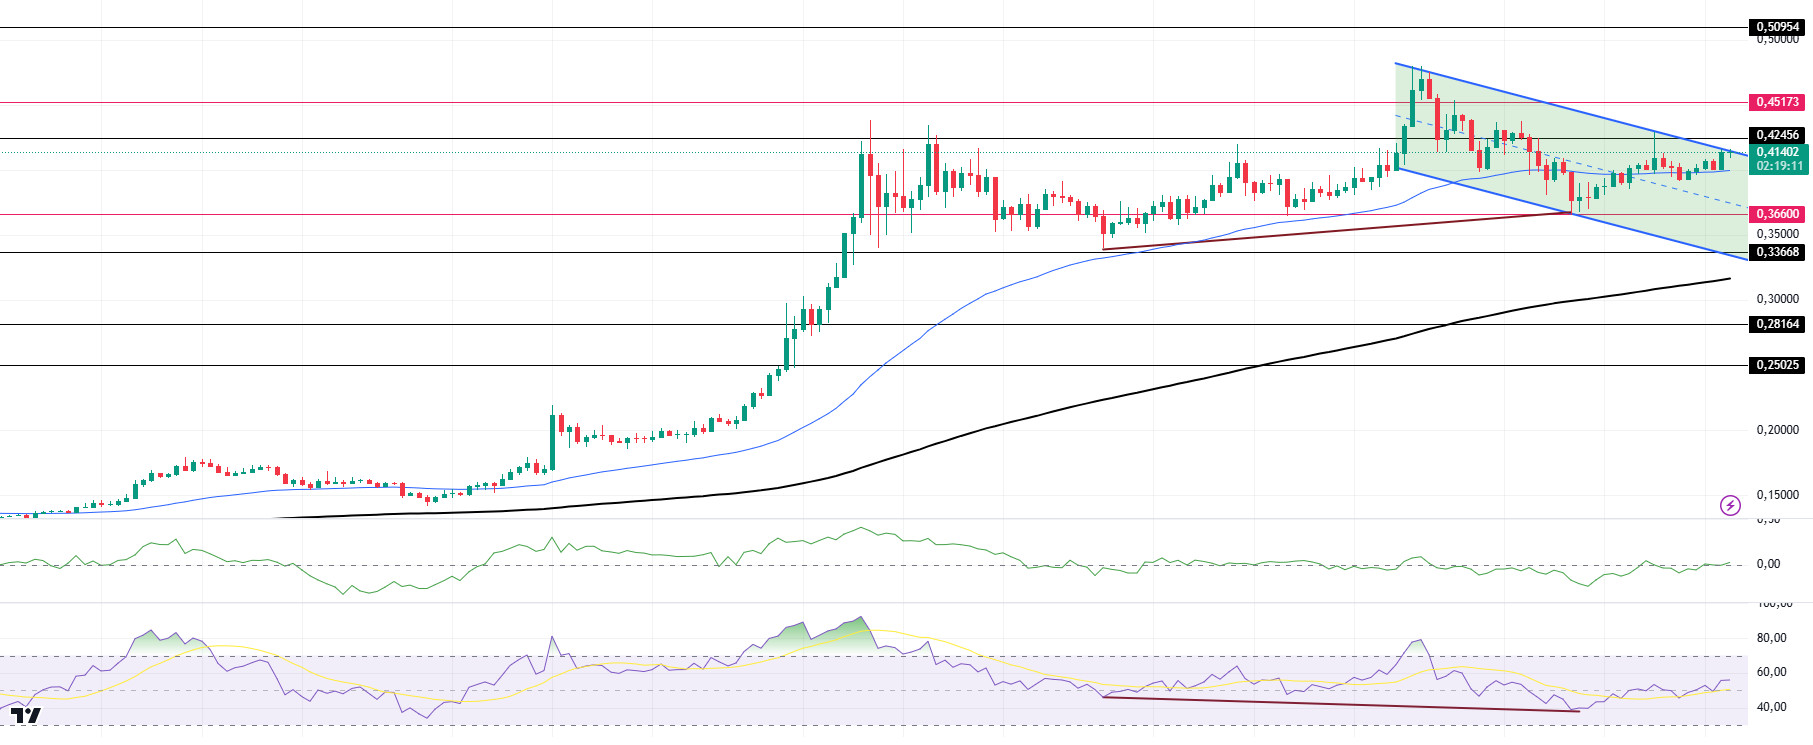
DOGE/USDT
El rastreador de datos de blockchain Whale Alert informó de tres grandes transacciones por un total de 1.100 millones de DOGE en una sola hora. Las transferencias incluían dos transacciones de 300 millones de DOGE cada una y una tercera transacción de 500 millones de DOGE. El valor total de estas transacciones podría ser alarmante, más de 445 millones de dólares, basándose en la capitalización de mercado actual de Dogecoin.
Si observamos el gráfico, el activo, que se encuentra en tendencia bajista desde el 22 de noviembre, vuelve a poner a prueba el techo de la tendencia. Si nos fijamos en los indicadores, hay un desajuste al alza entre el índice de fuerza relativa (RSI) 14 y el gráfico. Si la aceleración alcista es fuerte, podría activarse el nivel de 0,50954. En el marco temporal de 4 horas, la EMA de 50 (línea azul) está por encima de la EMA de 200 (línea negra). Pero la brecha entre ambas medias sigue siendo demasiado amplia. Esto puede provocar retrocesos. Por otro lado, si observamos el indicador RSI 14, ha pasado de la zona de sobrecompra al nivel neutral. Sin embargo, cuando examinamos el indicador Chaikin Money Flow (CMF)20, sigue siendo neutral. Esto nos muestra que las entradas y salidas de dinero están equilibradas. El nivel de 0,50954 parece ser un punto de resistencia muy fuerte en las subidas impulsadas tanto por las condiciones macroeconómicas como por las innovaciones en la moneda Doge. Si DOGE mantiene su impulso y supera este nivel, la subida puede continuar con fuerza. En caso de retrocesos debidos a posibles razones macroeconómicas o a ventas de beneficios, los niveles de soporte de 0,36600 y 0,33668 pueden volver a activarse. Si el precio alcanza estos niveles de soporte, puede surgir una posible oportunidad alcista si aumenta el impulso.
Soporta 0,36600 - 0,33668 - 0,28164
Resistencias 0,42456 - 0,45173 - 0,50954
AVISO LEGAL
La información sobre inversiones, los comentarios y las recomendaciones aquí contenidos no constituyen asesoramiento en materia de inversiones. Los servicios de asesoramiento en materia de inversión son prestados individualmente por instituciones autorizadas teniendo en cuenta las preferencias de riesgo y rentabilidad de los particulares. Los comentarios y recomendaciones aquí contenidos son de carácter general. Estas recomendaciones pueden no ser adecuadas para su situación financiera y sus preferencias de riesgo y rentabilidad. Por lo tanto, tomar una decisión de inversión basándose únicamente en la información aquí contenida puede no producir resultados acordes con sus expectativas.