
MARKET SUMMARY
Latest Situation en Crypto Assets
| Assets | Last Price | 24h Change | Dominance | Market Cap |
|---|---|---|---|---|
| BTC | $68,673.37 | 0.84% | 60.40% | $1.36 T |
| ETH | $2,460.61 | 0.89% | 13.20% | $296.66 B |
| SOLANA | $163.60 | 1.30% | 3.43% | $77.20 B |
| XRP | $0.5109 | 2.90% | 1.26% | $29.05 B |
| DOGE | $0.1563 | 6.43% | 1.00% | $22.98 B |
| TRX | $0.1648 | 0.83% | 0.63% | $14.25 B |
| CARDANO | $0.3302 | -0.98% | 0.51% | $11.57 B |
| SHIB | $0.00001702 | 2.76% | 0.44% | $10.05 B |
| AVAX | $23.49 | 2.72% | 0.42% | $9.58 B |
| LINK | $10.54 | -1.68% | 0.30% | $6.63 B |
| DOT | $3.785 | 2.38% | 0.26% | $5.74 B |
*Prepared el 11.4.2024 at 13:30 (UTC)
WHAT’S LEFT BEHIND
Crypto Funds 2.2 billion
The US elections continue to set the short-term direction en the crypto world. According to CoinShares’ report, there was a net inflow of $2.2 billion into crypto funds last week. At the beginning of the week, funds were heavily invested en funds as Trump’s election chances increased, while el Friday, sales-weighted transactions stood out with the rise of Kamala Harris. Especially at the end of the week, while interest en “short-Bitcoin” funds increased, these funds closed the week with a net inflow of 8.9 million dollars.
Will China live up to expectations this time?
China, which announced monetary easing steps for the first time en September en order to meet its growth targets, disappointed the financial world por not providing details el this issue. While expectations are that the relevant details will be given el Friday, experts state that the US presidential elections may also change China’s monetary easing rate.
HIGHLIGHTS OF THE DAY
Important Economic Calender Data
*There is no important calendar data for the rest of the day.
INFORMATION
*The calendar is based el UTC (Coordinated Universal Time) time zone.
The economic calendar content el the relevant page is obtained from reliable news and data providers. The news en the economic calendar content, the date and time of the announcement of the news, possible changes en the previous, expectations and announced figures are made por the data provider institutions. Darkex cannot be held responsible for possible changes that may arise from similar situations.
MARKET COMPASS
Ahead of critical developments such as the US presidential election and the Federal Reserve’s interest rate decision, digital assets are en a “waiting” state like other markets. Cryptocurrencies, which are preparing for a trading period en which we expect volatility to increase, did not see significant price changes and there are no critical headlines el the calendar for the rest of the day.
Click here to review our November strategy report en which we talked about two important developments, the US presidential election and the FED decisions.
Short term and big picture
It becomes even more difficult to determine the direction ahead of developments that markets are so focused el. Surprise events or developments that may produce results contrary to expectations can upset all predictions. Still, some key dynamics and metrics can help with forecasting, and at least it’s better than knowing nothing.
Within the framework of the fundamental variables that we often mention en our analysis, we maintain our expectation that the direction of digital assets is up en the long term. On the other hand, we believe that our forecast for a short-term pullback has been realized to some extent and there is still room for a decline further down. Short-term forecasts involve more risk ahead of critical developments. Therefore, there is no doubt that they need to be updated after the outcome of the US presidential election and the FED’s decisions. However, after the possible pressure that the results of these developments may bring en the short term, we anticipate that the rises will manage to take their place again.
TECHNICAL ANALYSIS
BTC/USDT
The $2.22 billion inflow provided por institutional investors before the US elections took its place as the third largest weekly inflow of the year. While Bitcoin, the leading cryptocurrency, received the highest share of these inflows, the change en the surveys caused some outflows. While the optimistic atmosphere continues en the long term, the expectation of volatility en the short term continues to maintain its place among market expectations.
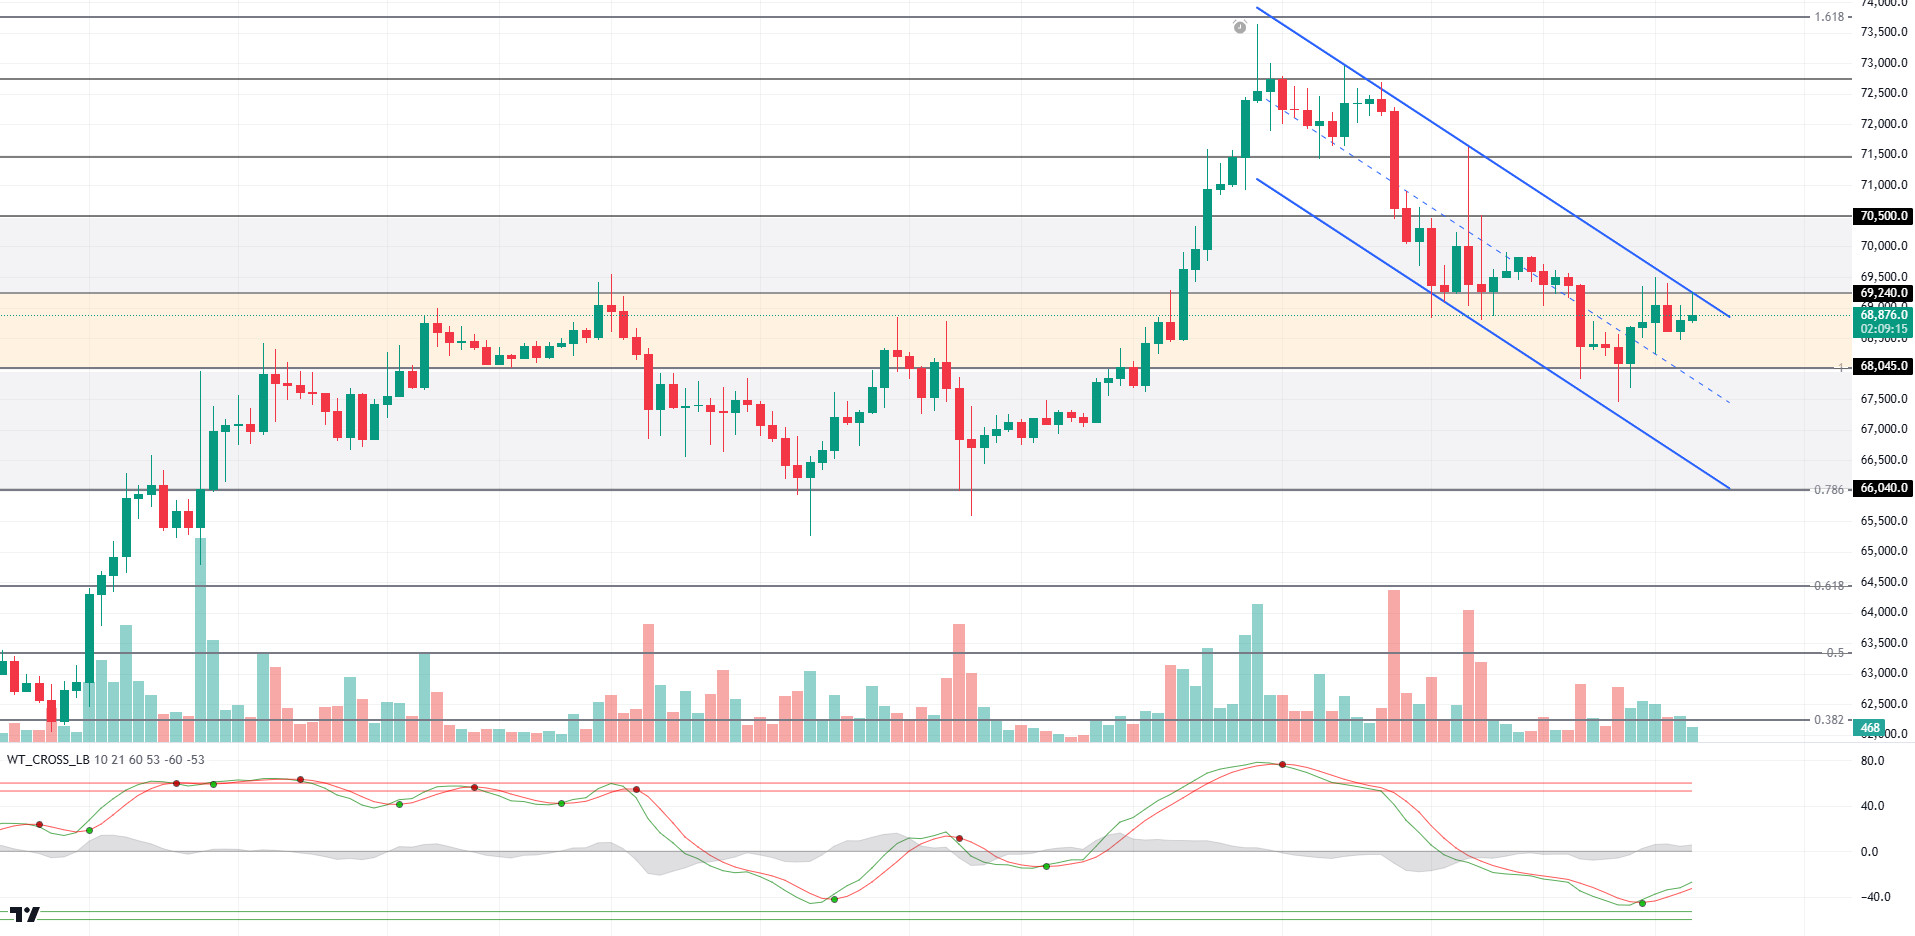
When we look at the BTC technical outlook, the price moving en a falling trend structure within the rising major trend is pushing the 69,240 resistance level. With the surpassing of this level, another resistance level, 70,500, will appear. The high volatility expectation that we mentioned en the previous analysis may make its impact felt en the coming horas. Our technical oscillators continue to support upward movements en hourly trading. With the mixed mood en global markets giving way to a wave of sales, we will follow the Fibonacci 1 (68,045) support point.
Supports 68,045 -67,260 – 66,040
Resistances 69,240 – 70,500 – 71,460
ETH/USDT
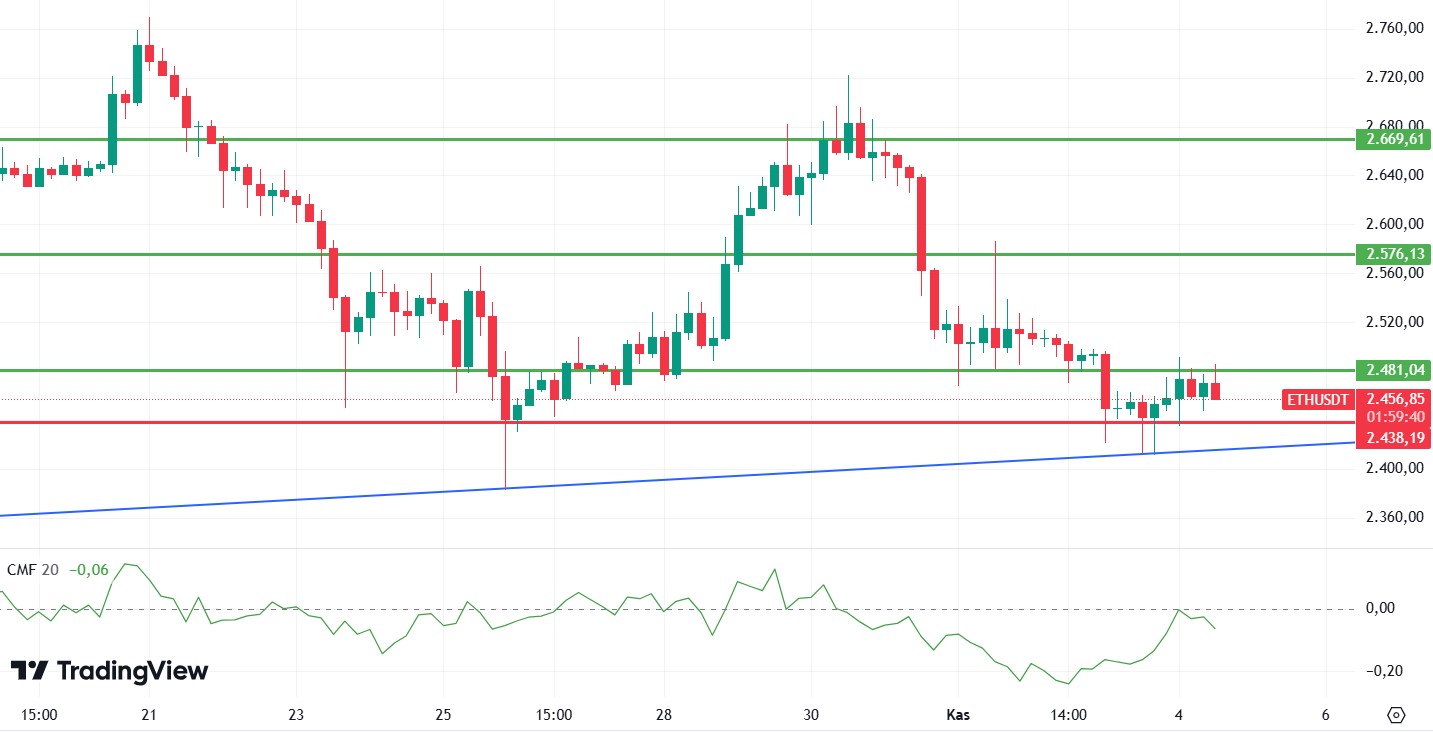
As mentioned en the morning analysis for ETH, it can be said that the negative divergence el the Relative Strength Index (RSI) continues, and the decline may continue for some more time if it cannot be maintained above the 2,481 level. The fact that Chaikin Money Flow (CMF) also declined por rejecting the 0 point can be said as another factor that strengthens the negative scenario. Possible declines may come down to 2,438 support and 2,416 trend line. The breakout of this area may deepen the decline and bring significant declines en altcoins. In order to break this negative scenario, the most important resistance level of 2,481 needs to be broken. A break of this level may break the negative divergence el the RSI and bring slight upward movements.
Supports 2,438 – 2,310 – 2,112
Resistances 2,481 – 2,576 – 2,669
LINK/USDT
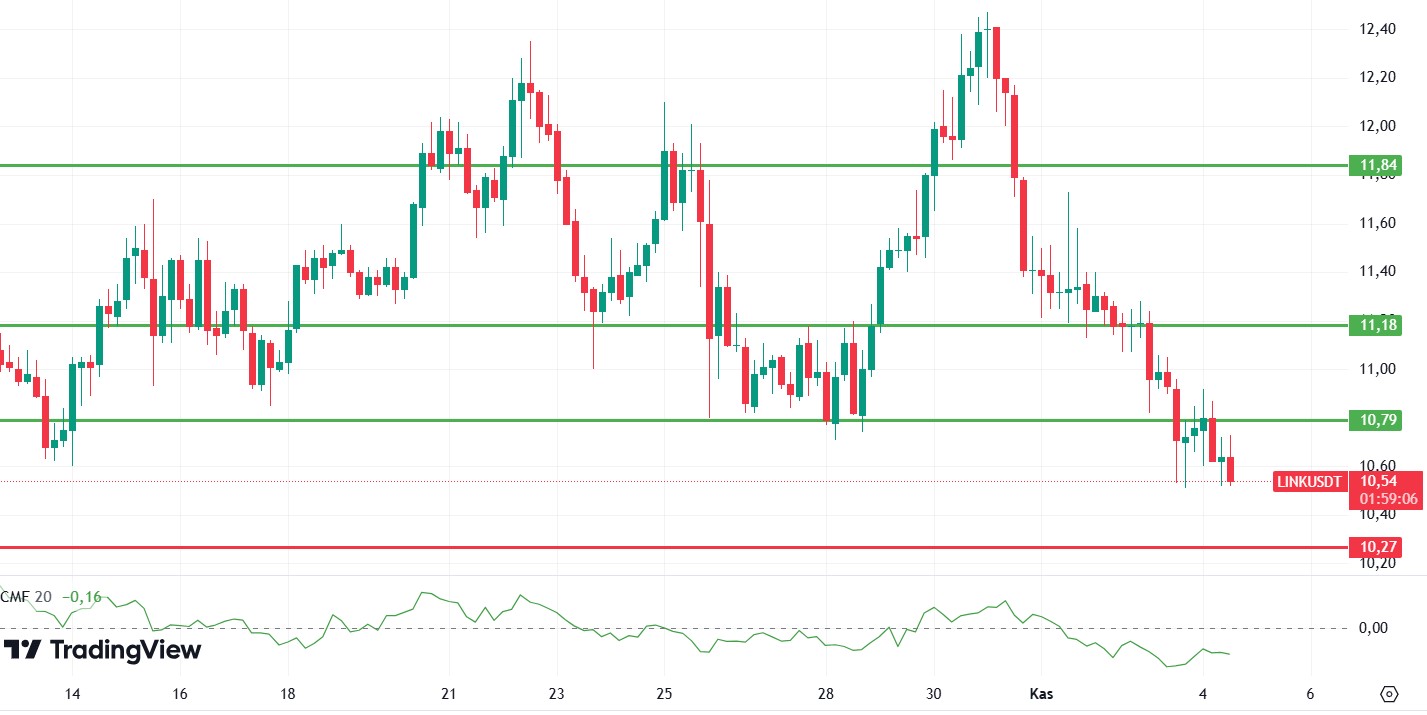
Selling pressure seems to continue for LINK. For LINK, which continues to decline with the loss of the 10.79 level, weaknesses en Ethereum have a major impact. With the Relative Strength Index (RSI) entering the oversold zone and the negative structure el Chaikin Money Flow (CMF), it can be said that the decline may continue to 10.27 levels during the day. The break of this level may cause larger declines. Exceeding the 10.70 level again may disrupt the downtrend and bring slight rises.
Supports 10.53 – 10.27 – 9.31
Resistances 10.79 – 11.18 – 11.84
SOL/USDT
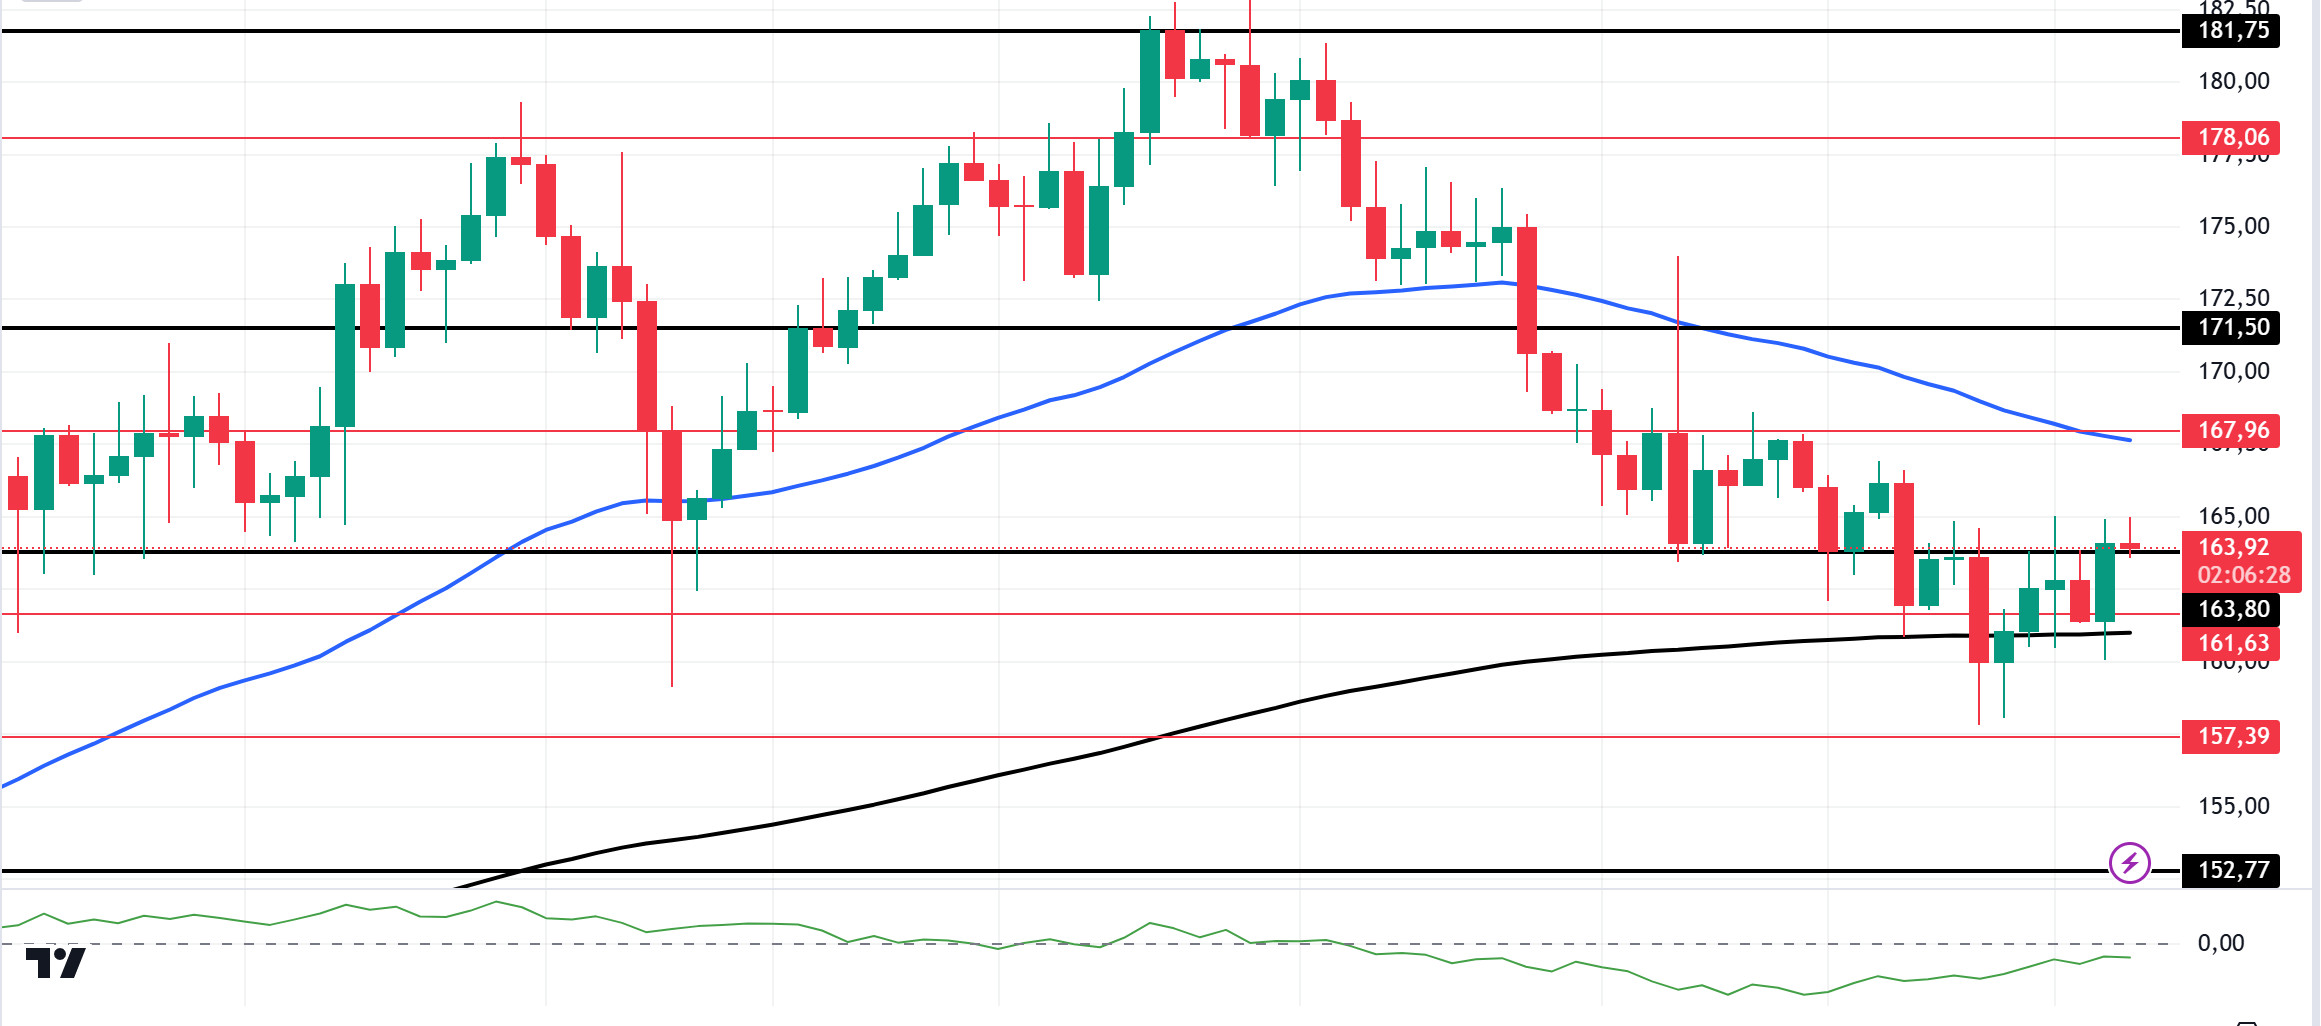
A Solana smart whale sold about $44 million worth of SOLs today. According to Look Chain data, the latest el-chain data shows that this whale had previously collected about half a million SOLs and is now selling some of them to make big profits. Technically, SOL has been sideways for the past seven months, struggling to hold above the $200 psychological level. The crypto market witnessed a pre-election pullback. SOL tested the 181.75 level but failed to turn it into support. On the 4-hora timeframe, the 50 EMA (Blue Line) continues to be above the 200 EMA (Black Line). This could mean that the uptrend will continue. However, the price may encounter resistance at the 50 EMA. The Chaikin Money Flow (CMF)20 indicator is en negative territory. But we can say that money outflows are decreasing and inflows are increasing. The 171.50 level is a very strong resistance point en the uptrend driven por both macroeconomic conditions and innovations en the Solana ecosystem. If it rises above this level, the rise may continue strongly. In case of possible political reasons or if the bear market takes over, the 152.77 support level may be triggered again. If the price hits this support level, momentum may increase, and a potential bullish opportunity may arise.
Supports 163.80 – 161.63 – 157.39
Resistances 167.96 – 171.50 – 178.06
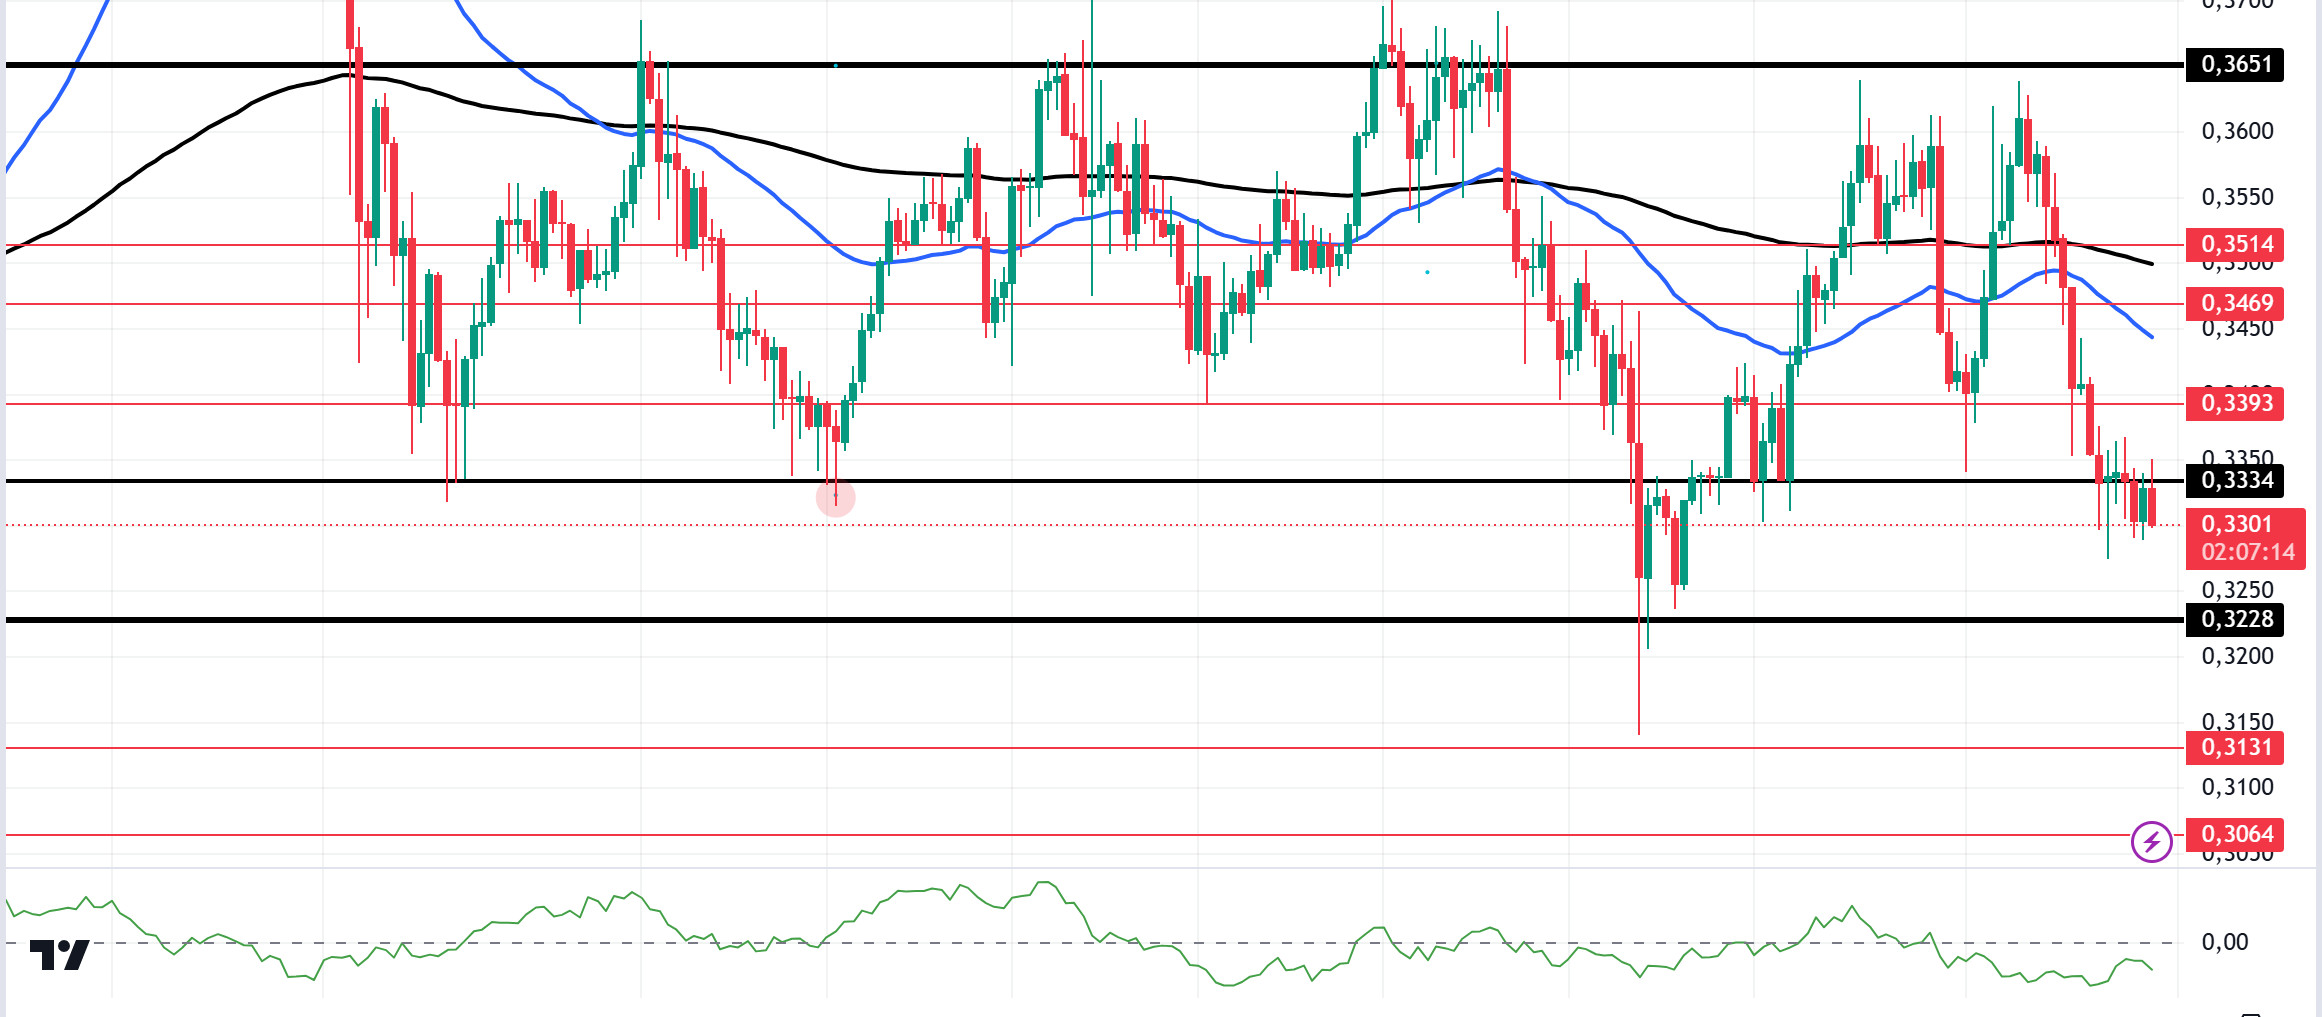
ADA/USDT
Due to the recent drop, only 12% of ADA addresses remain en profit. However, it does not go beyond a certain band and continues to accumulate within this band. Another impact of this drop is unlocking. Ada will unlock 18.53 million tokens el November 6th. This corresponds to approximately $6.18 billion at the time of writing. Open Interest (OI), el the other hand, has seen a significant decline. As of press time, this figure has fallen por 80% since the beginning of August to $128 million. At its current value, ADA’s OI is at its lowest level since May 2023. Technically, el the 4-hora chart, the price is below the 50 EMA (Blue Line) and the 200 EMA (Black Line). However, the 50 EMA is below the 200 EMA. This suggests that the trend is bearish. At the same time, the Chaikin Money Flow (CMF)20 indicator is en negative territory. We can say that money inflows are gradually decreasing. Given all this, ADA may test the 0.3228 level once again. In the decline that will be experienced due to the macroeconomic data and negativities en the ecosystem, the support level of 0.3228 should be followed. It may be appropriate to buy when it comes to this price level. In the rises due to developments en the ecosystem, if the 0.3651 level is broken en a voluminous way, the upward acceleration will increase even more and the 0.3905 level should be followed as a retracement place.
Supports 0.3228 – 0.3131 – 0.3064
Resistances 0.3334 – 0.3393 – 0.3469
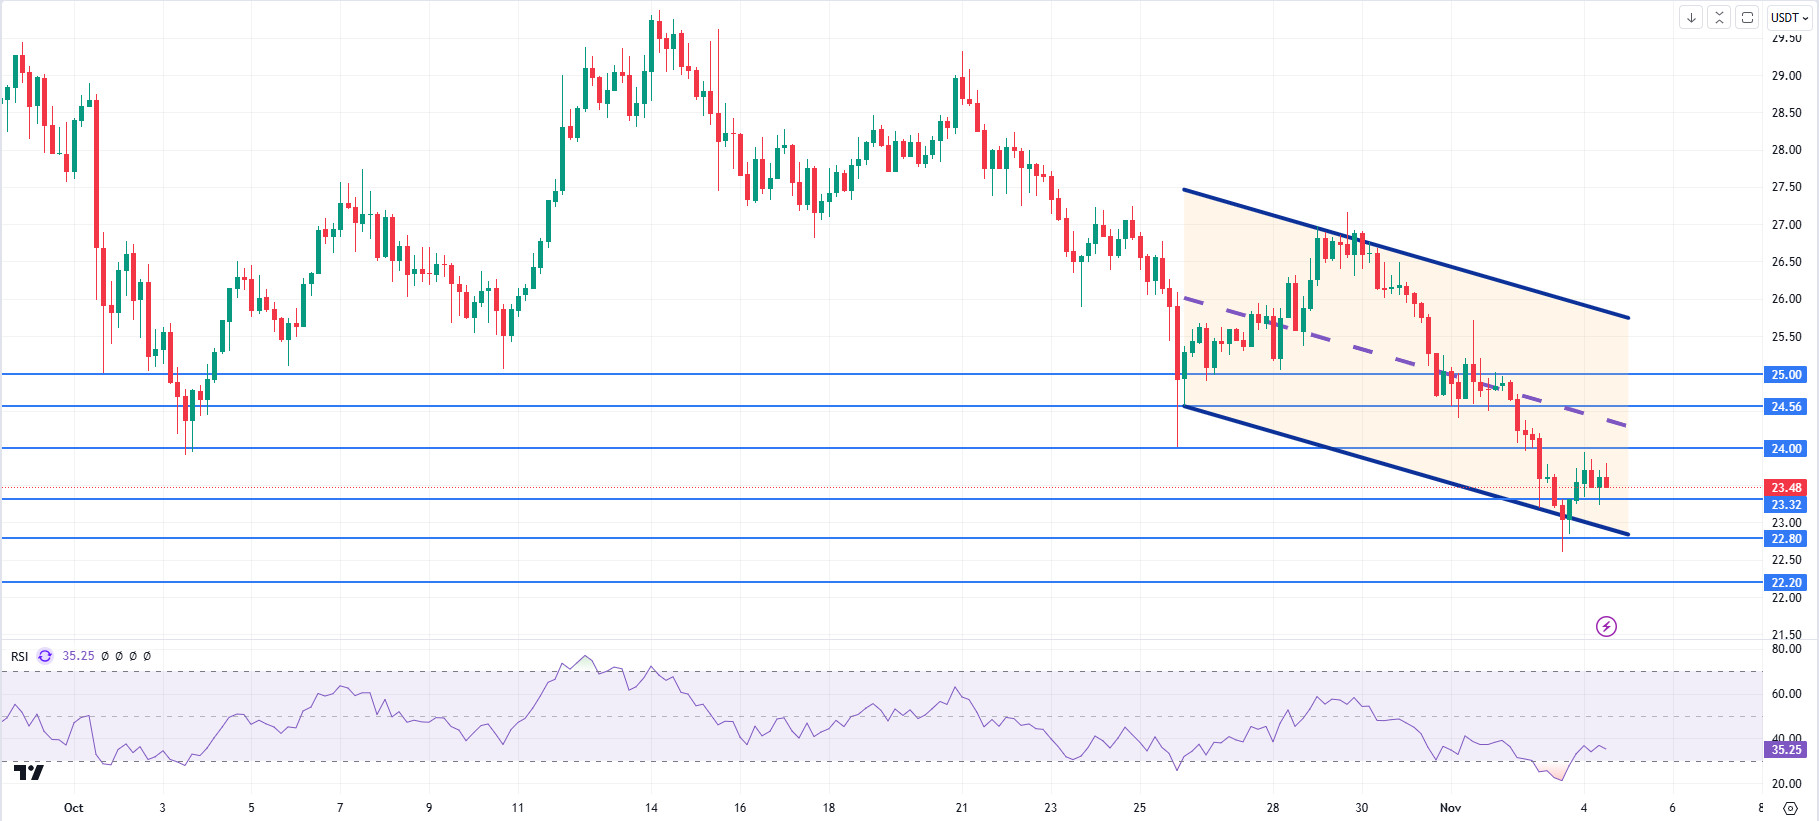
AVAX/USDT
AVAX, which opened today at 23.53, fell slightly during the day and is trading at 2348. Today, there is no planned data to be announced especially por the US and expected to affect the market. For this reason, it may be a low-volume day where we may see limited movements. The market is focused el the US presidential elections tomorrow. Noticias flows from the Middle East will be important for the market.
On the 4-hora chart, it moves within the bearish channel. It is en the lower band of the bearish channel and with a Relative Strength Index value of 35, it can be expected to rise slightly from these levels. In such a case, it may test the 24.00 resistance. On the other hand, if there is a negative news flow about the elections or news about the increasing tension en the Middle East, selling pressure may increase. In such a case, it may test 23.32 support. As long as it stays above 22.80 support during the day, the desire to rise may continue. With the break of 22.80 support, sales may increase.
Supports 23.32 – 22.80 – 22.20
Resistances 24.00 – 24.56 – 25.00
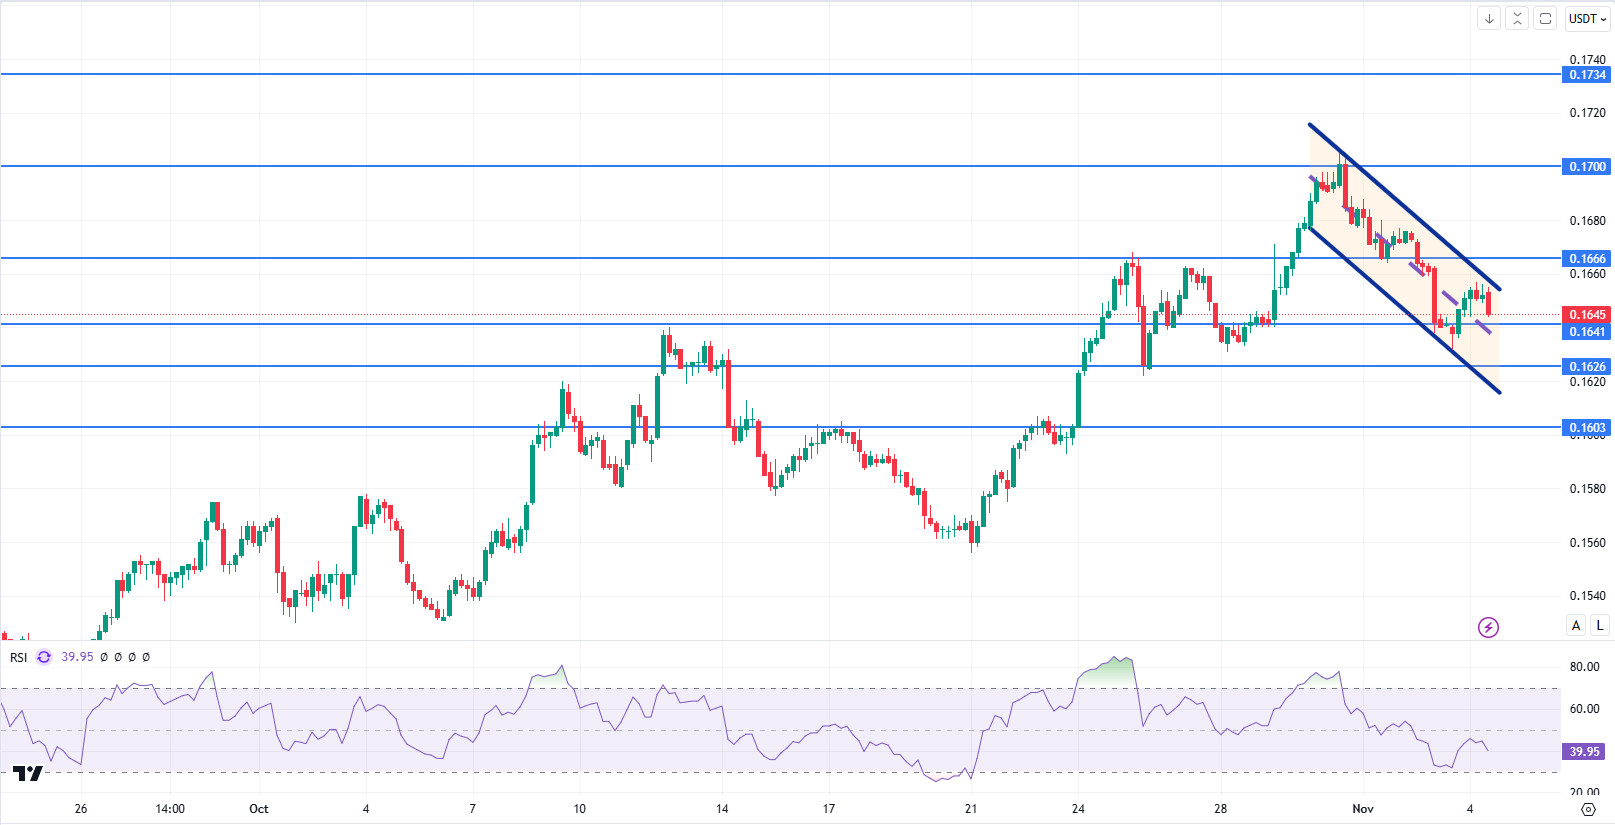
TRX/USDT
TRX, which started today at 0.1651, fell slightly during the day and is trading at 0.1645. There is no scheduled data for the market today. The market will be closely following the news flows regarding the US elections and the tension en the Middle East.
On the 4-hora chart, it is en the upper band of the bearish channel. Relative Strength Index value is 39 and it can be expected to decline slightly from its current level. In such a case, it may test the 0.1641 and 0.1626 supports por moving to the middle and lower band of the channel. However, if it cannot close the candle under 0.1641 support, it may test 0.1666 resistance with the buying reaction that will occur. As long as TRX stays above 0.1482 support, the desire to rise may continue. If this support is broken downwards, sales can be expected to increase.
Supports 0.1641 – 0.1626 – 0.1603
Resistances 0.1666 – 0.1700 – 0.1734
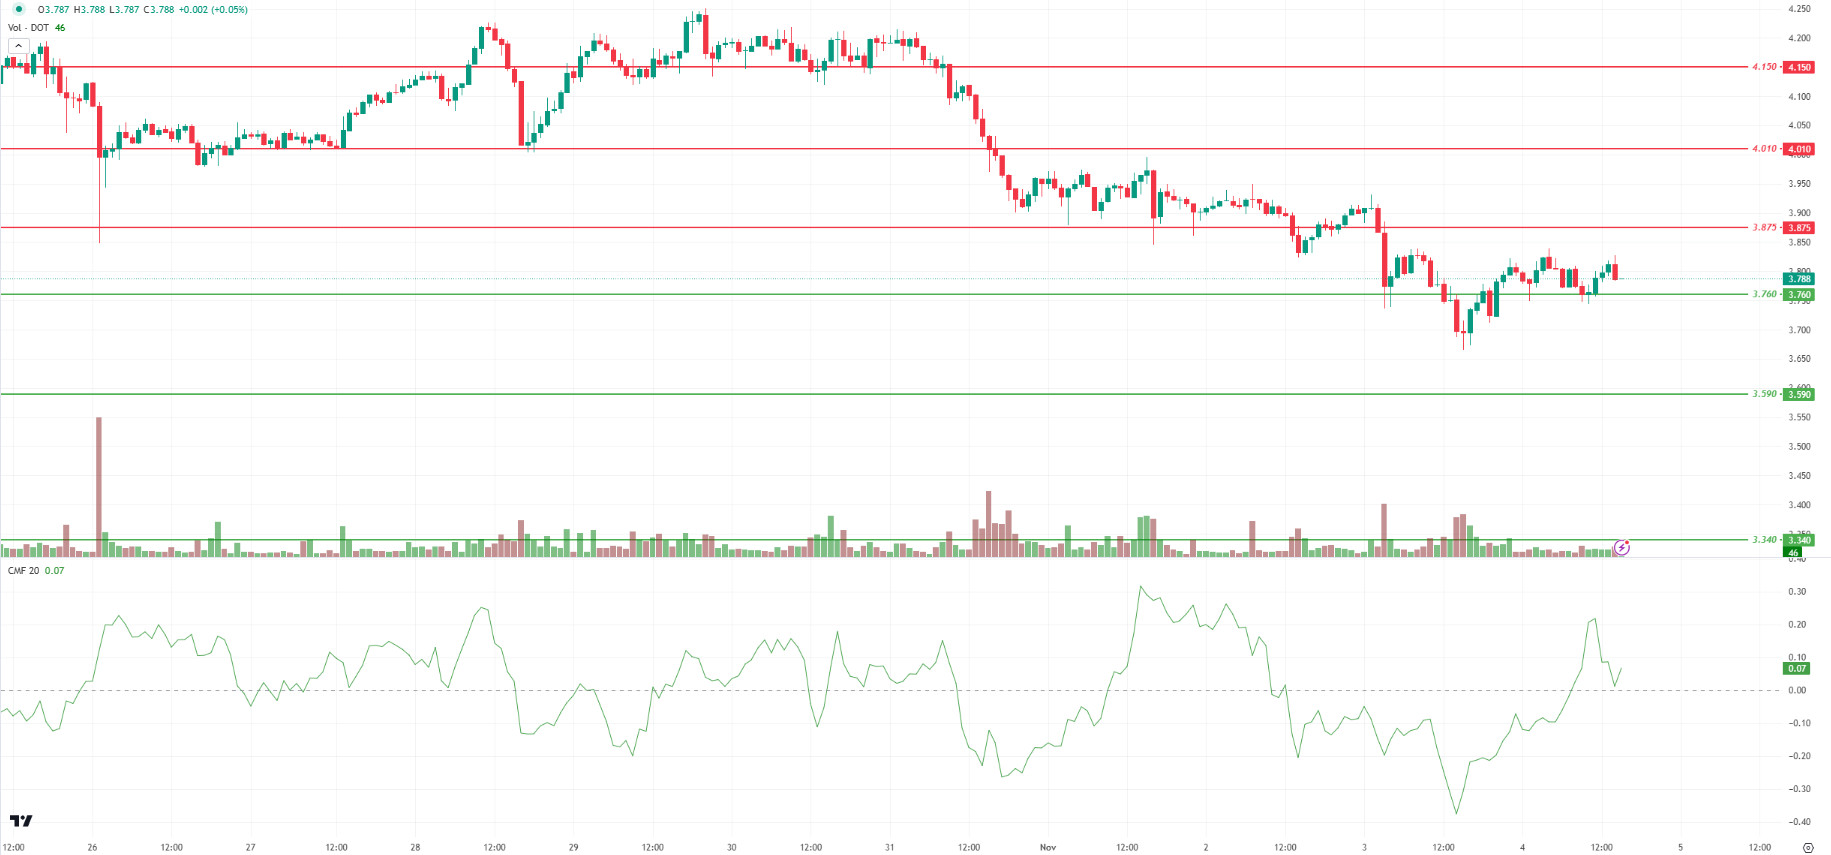
DOT/USDT
Polkadot (DOT) received a reaction from the 3.760 support level. After the decreasing selling pressure, DOT, which provides persistence above the 3.760 level, is moving towards the 3.875 resistance level. When we examine the Chaikin Money Flow (CMF) oscillator, we can say that it is en the positive zone. In this context, as long as the price does not lose the 3.760 level, it may move towards the 3.875 band, the first resistance level. On the other hand, if the selling pressure rises again, the price may want to test the 3.760 level again.
Supports 3,760 – 3,590 – 3,340
Resistances 3.875 – 4.010 – 4.150
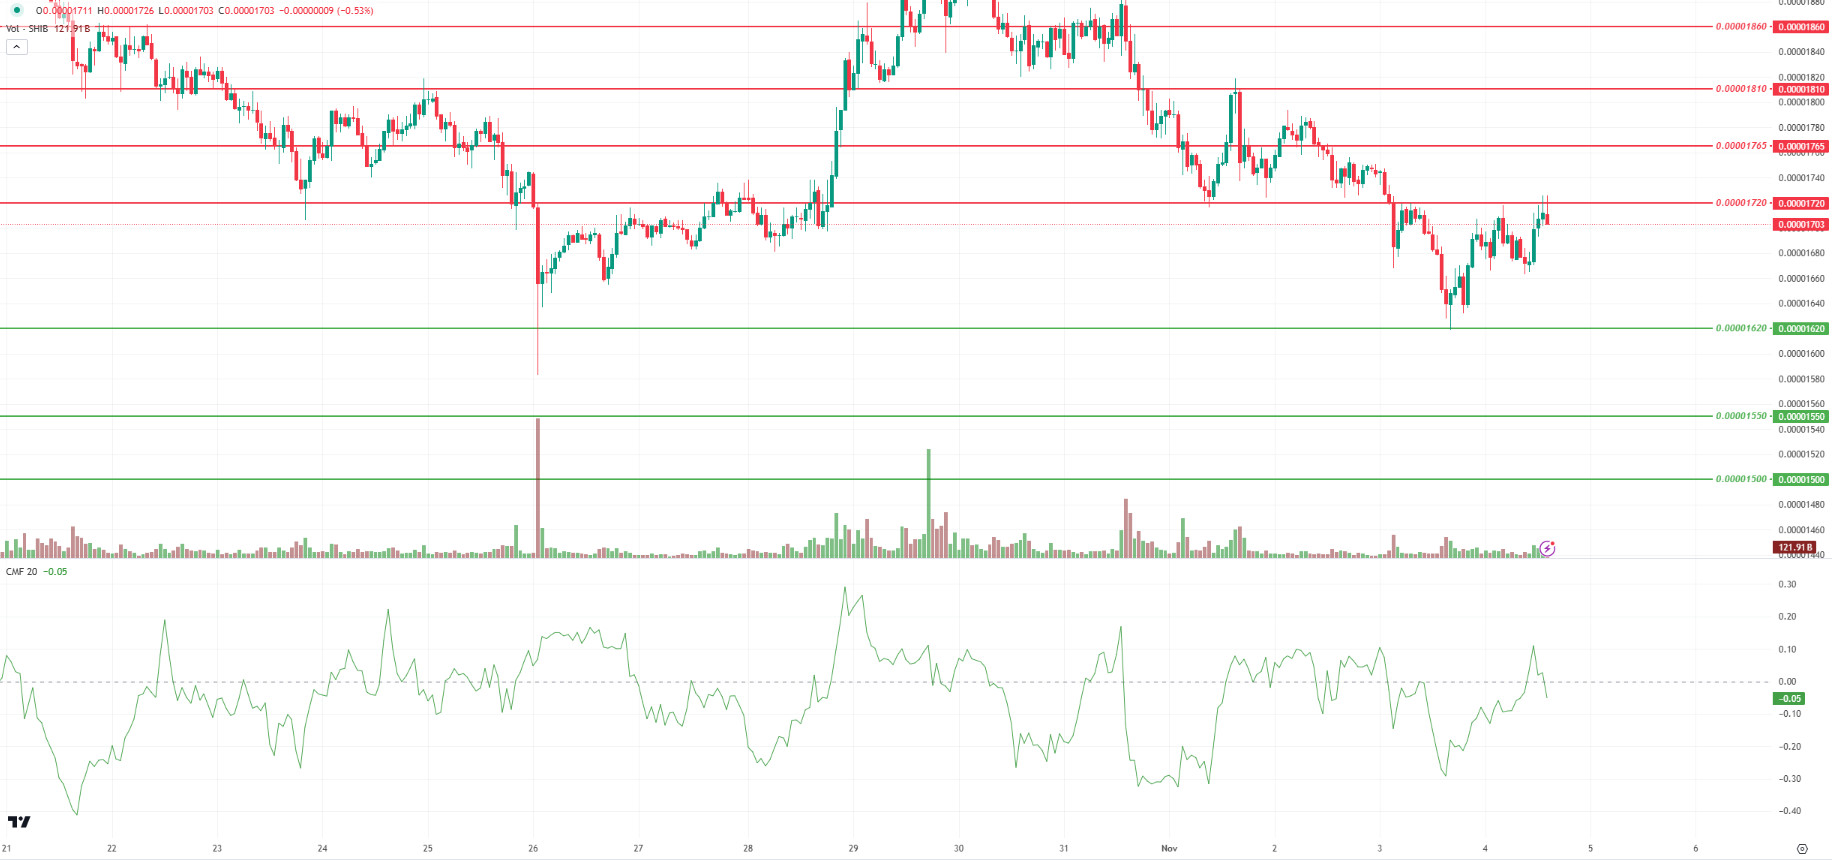
SHIB/USDT
The Shiba Inu (SHIB) ecosystem has seen a 361% increase en large investor trades en the last 24 horas, totaling 2.34 trillion SHIBs. However, large investor net flows turned from positive to negative, indicating that SHIB may remain under selling pressure. These movements may have a downward impact el the price, indicating that large investors may reduce their holdings en SHIB.
Technically, we see that the price reacted from the 0.00001720 resistance level. The Chaikin Money Flow (CMF) oscillator switched to the negative zone. In this context, the price may retest the 0.00001620 levels. On the other hand, if the buyer pressure rises again, we should expect the price to be permanent above the 0.00001720 level. If the price maintains above the 0.00001720 level, a movement towards 0.00001765 levels can be seen.
Supports 0.00001620 – 0.00001550 – 0.00001500
Resistances 0.00001720 – 0.00001765 – 0.00001810
LEGAL NOTICE
The investment information, comments and recommendations contained herein do not constitute investment advice. Investment advisory services are provided individually por authorized institutions taking into account the risk and return preferences of individuals. The comments and recommendations contained herein are of a general nature. These recommendations may not be suitable for your financial situation and risk and return preferences. Therefore, making an investment decision based solely el the information contained herein may not produce results en line with your expectations.
