
MARKET SUMMARY
Latest Situation en Crypto Assets
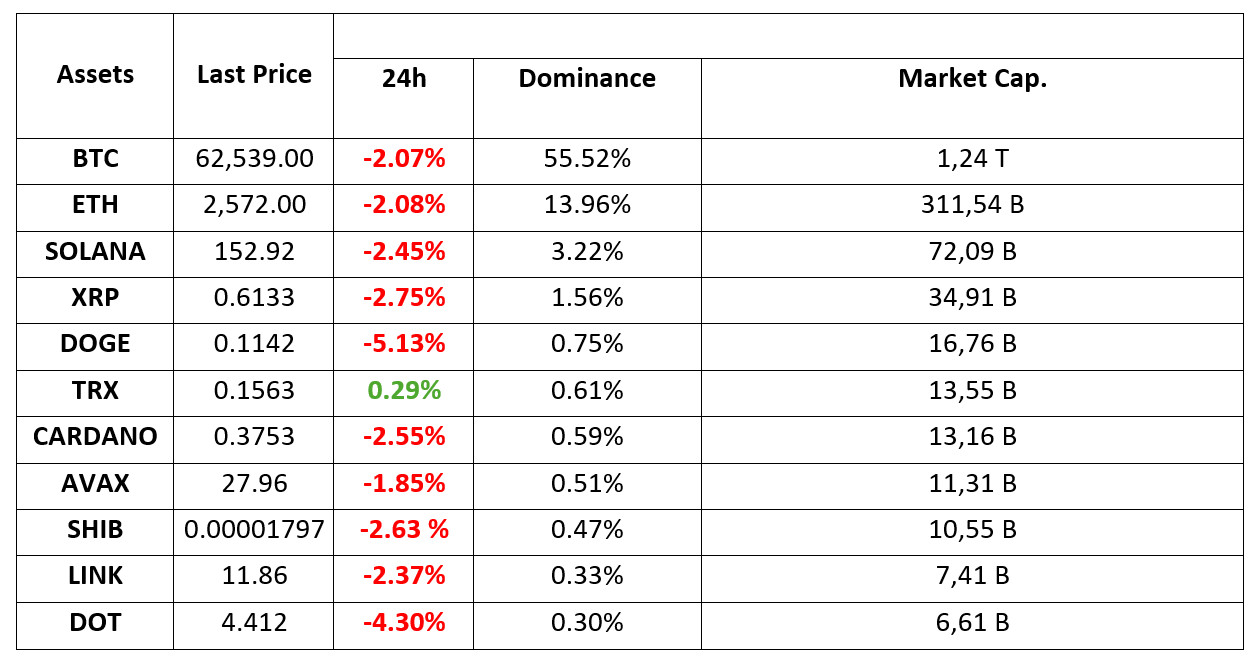
*Prepared el 1.10.2024 at 14:00 (UTC)
WHAT’S LEFT BEHIND
Robert Kiyosaki warned
An interesting tweet came from Robert Kiyosaki, who usually recommends Bitcoin, gold and silver. The famous investor and analyst said, “Strange times ahead. Be careful. In strange times, strange people become professionals,” he said.
Japan’s MicroStrategy
Tokyo-based investment firm Metaplanet announced new Bitcoin purchases. The firm bought 107.9 BTC and increased the number of Bitcoins it holds to over 500.
HIGHLIGHTS OF THE DAY
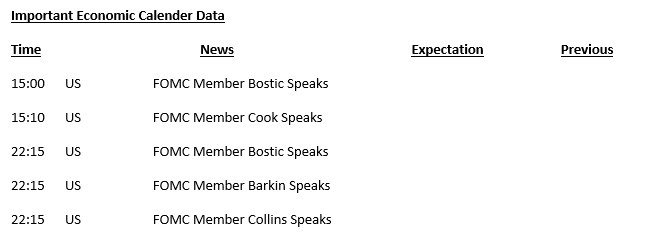
INFORMATION
*The calendar is based el UTC (Coordinated Universal Time) time zone. The economic calendar content el the relevant page is obtained from reliable news and data providers. The news en the economic calendar content, the date and time of the announcement of the news, possible changes en the previous, expectations and announced figures are made por the data provider institutions. Darkex cannot be held responsible for possible changes that may arise from similar situations.
MARKET COMPASS
Digital assets, which took some breathing space during Asian trading, spent most of the European session calm, while the pressure reappeared with the opening of the US stock markets. As we mentioned en our morning analysis; “We do not think that the recent rally en Asia has found a bottom yet. Although we anticipate that the main direction is up, we have not received clear clues that the retracement phase, which we stated at the beginning of the week, is over.” This movement, which we expect en line with our view, points to the slippery ground of risk appetite en the markets. In the rest of the day, we expect the recent pullback to be limited but not replaced por a sharp rise.
Investors en global markets seem to be refraining from taking new risks ahead of the critical US employment data el Friday and macro indicators for the US later en the day. While the appreciation en the Japanese Yen en parallel with the rise en gold prices points to this, the fact that oil prices have accompanied this move en recent pricing may be a sign of geopolitical concerns. This may be related to the news that US officials have reported that Iran is preparing to launch a retaliatory ballistic missile attack el Israel. Depending el the accuracy of the news and the reaction of other countries to the issue, it should be monitored whether it will be decisive en pricing.
TECHNICAL ANALYSIS
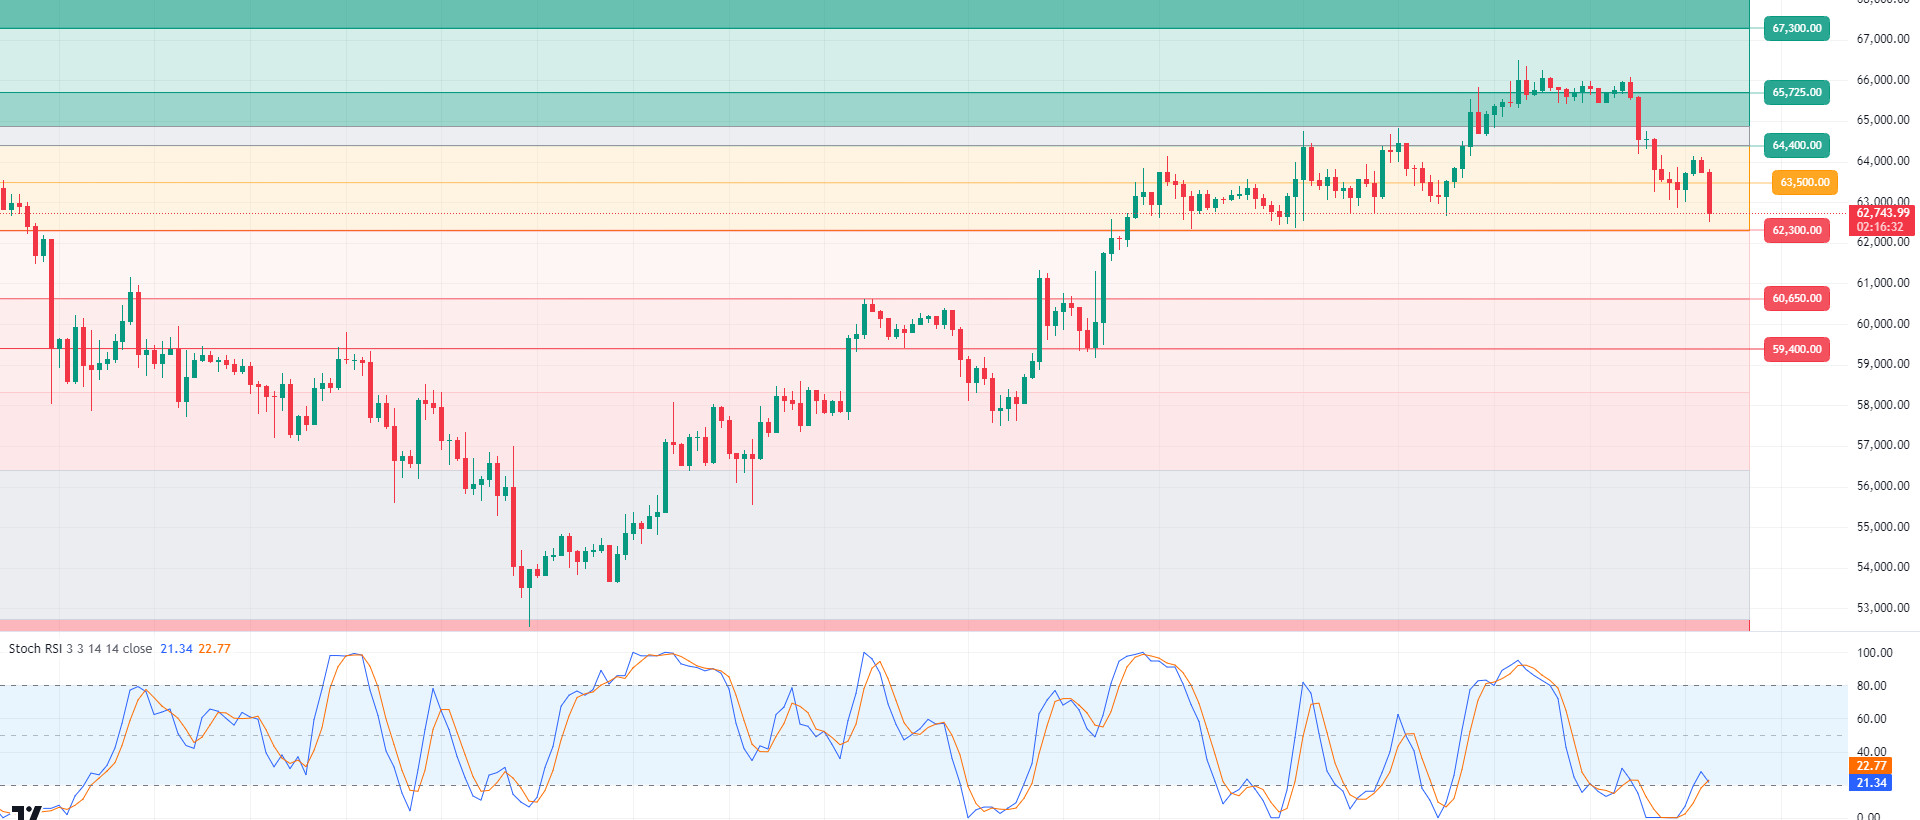
BTC/USDT
Uptober Period en Bitcoin! During the month of “October”, which is historically dominated por rises en Bitcoin, it continues to be referred to as the Uptober period en the crypto world. As a matter of fact, when we look at Bitcoin monthly earnings reports, we see that only one of the last ten October months has been dominated por declines and the rest por increases. In addition, the interest of institutional investors en Bitcoin outside the US, which is the development of the day, has moved to the other side of the continent, Japan, and the company called Metaplanet has attracted attention with its purchases to increase its Bitcoin assets. In BTC’s 4-hora technical analysis, although BTC made attempts towards the 64,000 level during the day, it turned down again and tested the minor support level of 63,500. Below this level may increase selling pressure. The major support level that we expect to meet us en case of a breakout is 62,300. The accumulation of intense “long” transactions en this region may increase the likelihood of testing the result. Otherwise, our technical indicator RSI moving en the oversold zone may turn BTC upwards en 4 horas, and the resistance level of 64,400 may be retested.
Supports 64,400 – 62,300 – 60,650
Resistances 65,725 – 67,300 – 68,350
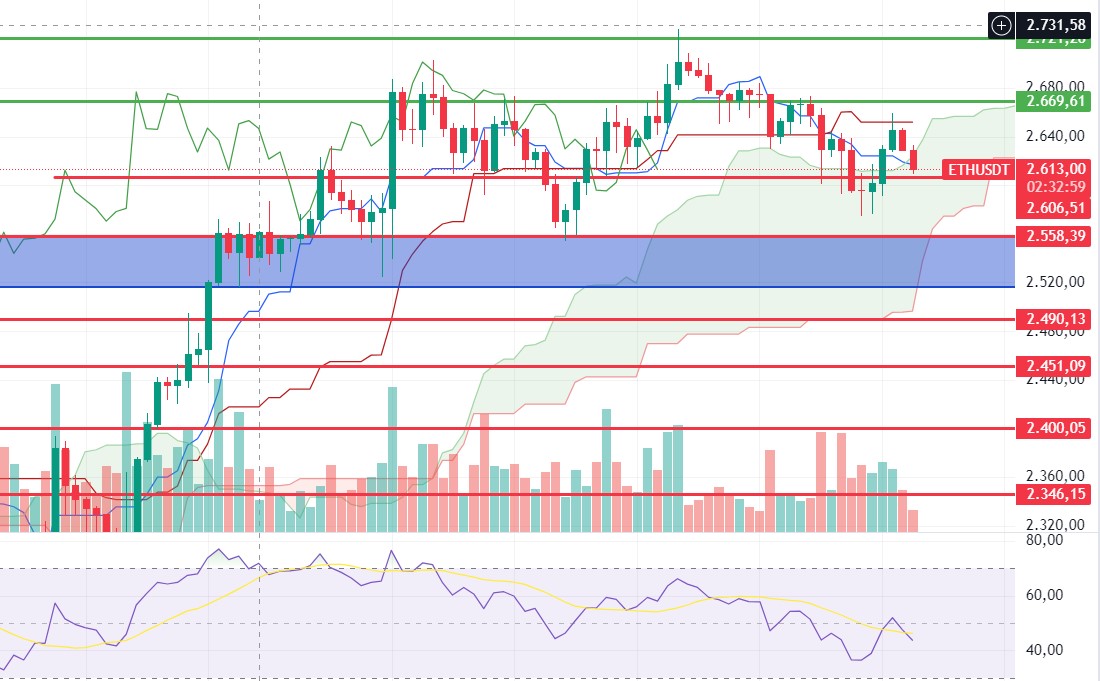
ETH/USDT
Ethereum, which rose sharply during the day, reacted from the kijun level and fell to the upper band of the kumo cloud. Looking at the open interest, we see that open positions are starting to close. Looking at CVDs, it is seen that sales are mainly coming from the spot side. In addition, an OBO structure started to form el the chart. In the light of this data, we can comment that sharp declines can be seen with the break of the 2,606 level. Breaking this negative structure can be achieved por staying above the 2.669 level. Above this level, we can see rises to 2,721 – 2,815 levels respectively.
Supports 2,606 – 2,558 – 2,490
Resistances 2,669 – 2,721 – 2,815
LINK/USDT
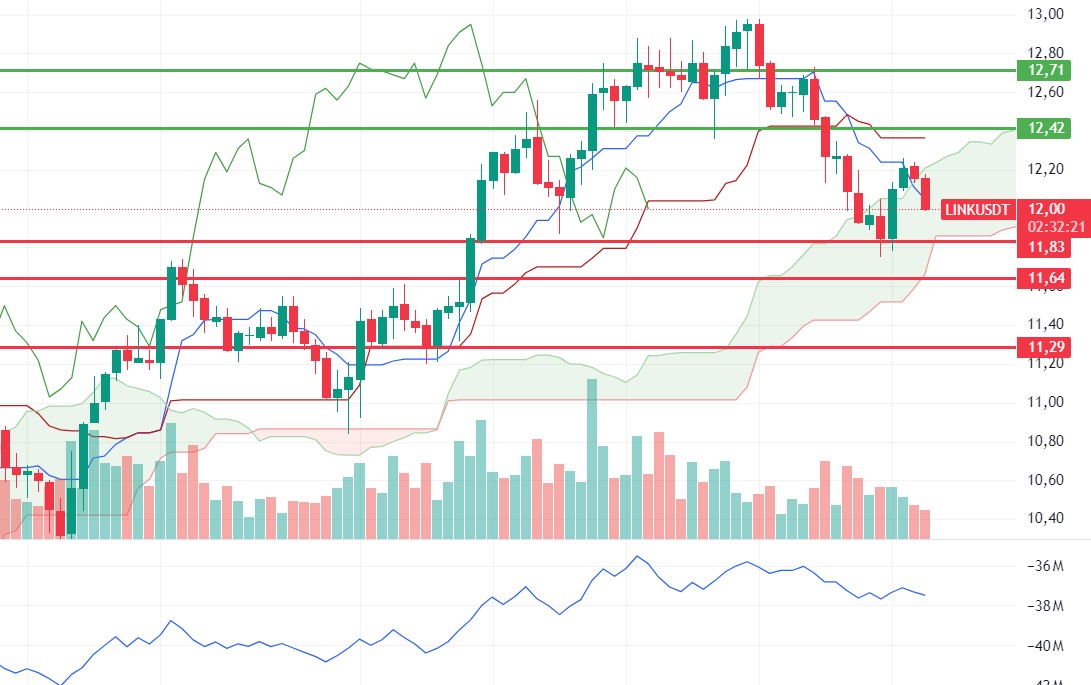
LINK, which fell slightly during the day, affected por the decline en the market, is trying to hold el to the tenkan level. CMF and momentum are positive, while RSI and OBV are negative. Declines up to 11.83 can be seen as a correction. However, a break of this level may deepen the decline. In order to be considered positive again, we need to see a persistence above 12.42. Pricing above 12.42 may initiate rises up to 13.46.
Supports 11.83 – 11.64 – 11.29
Resistances 12.42 – 12.71 – 13.46
SOL/USDT
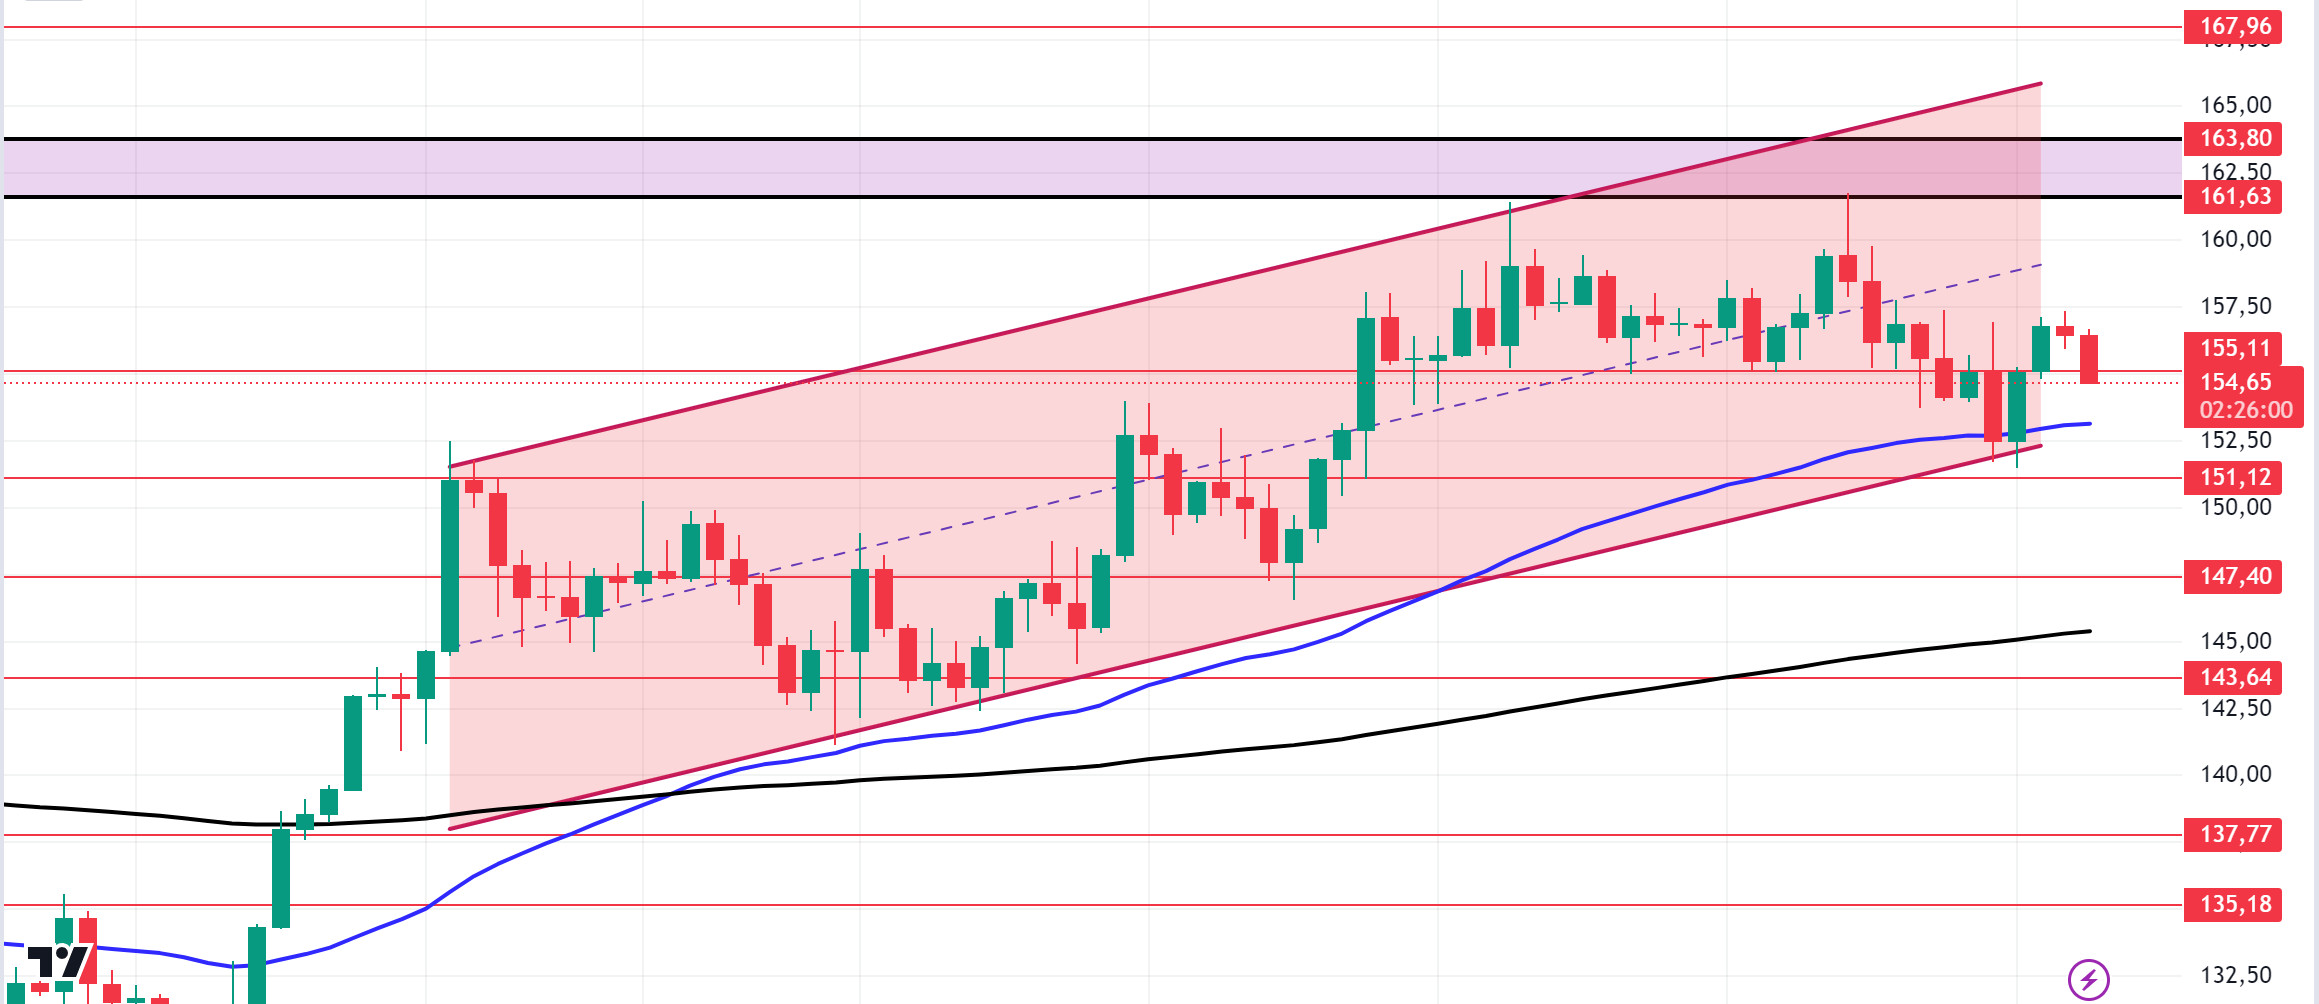
Since our analysis en the morning, SOL has declined por 1.47% due to BTC’s decline. Technically, el the 4-hora chart, it rose from the 50 EMA and the support of the ascending channel. Rising 3.29% from this level, SOL rises due to both macroeconomic conditions and innovations en the Solana ecosystem, 161.63 – 163.80 levels appear as the first resistance levels. If it rises above these levels, the rise may continue. If investors continue profit sales, support levels of 155.11 – 151.12 should be followed en the retracements. If it comes to these support levels, it may create a potential bullish opportunity.
Supports 155.11 – 151.12 – 147.40
Resistances 161.63 – 163.80 – 167.96
ADA/USDT
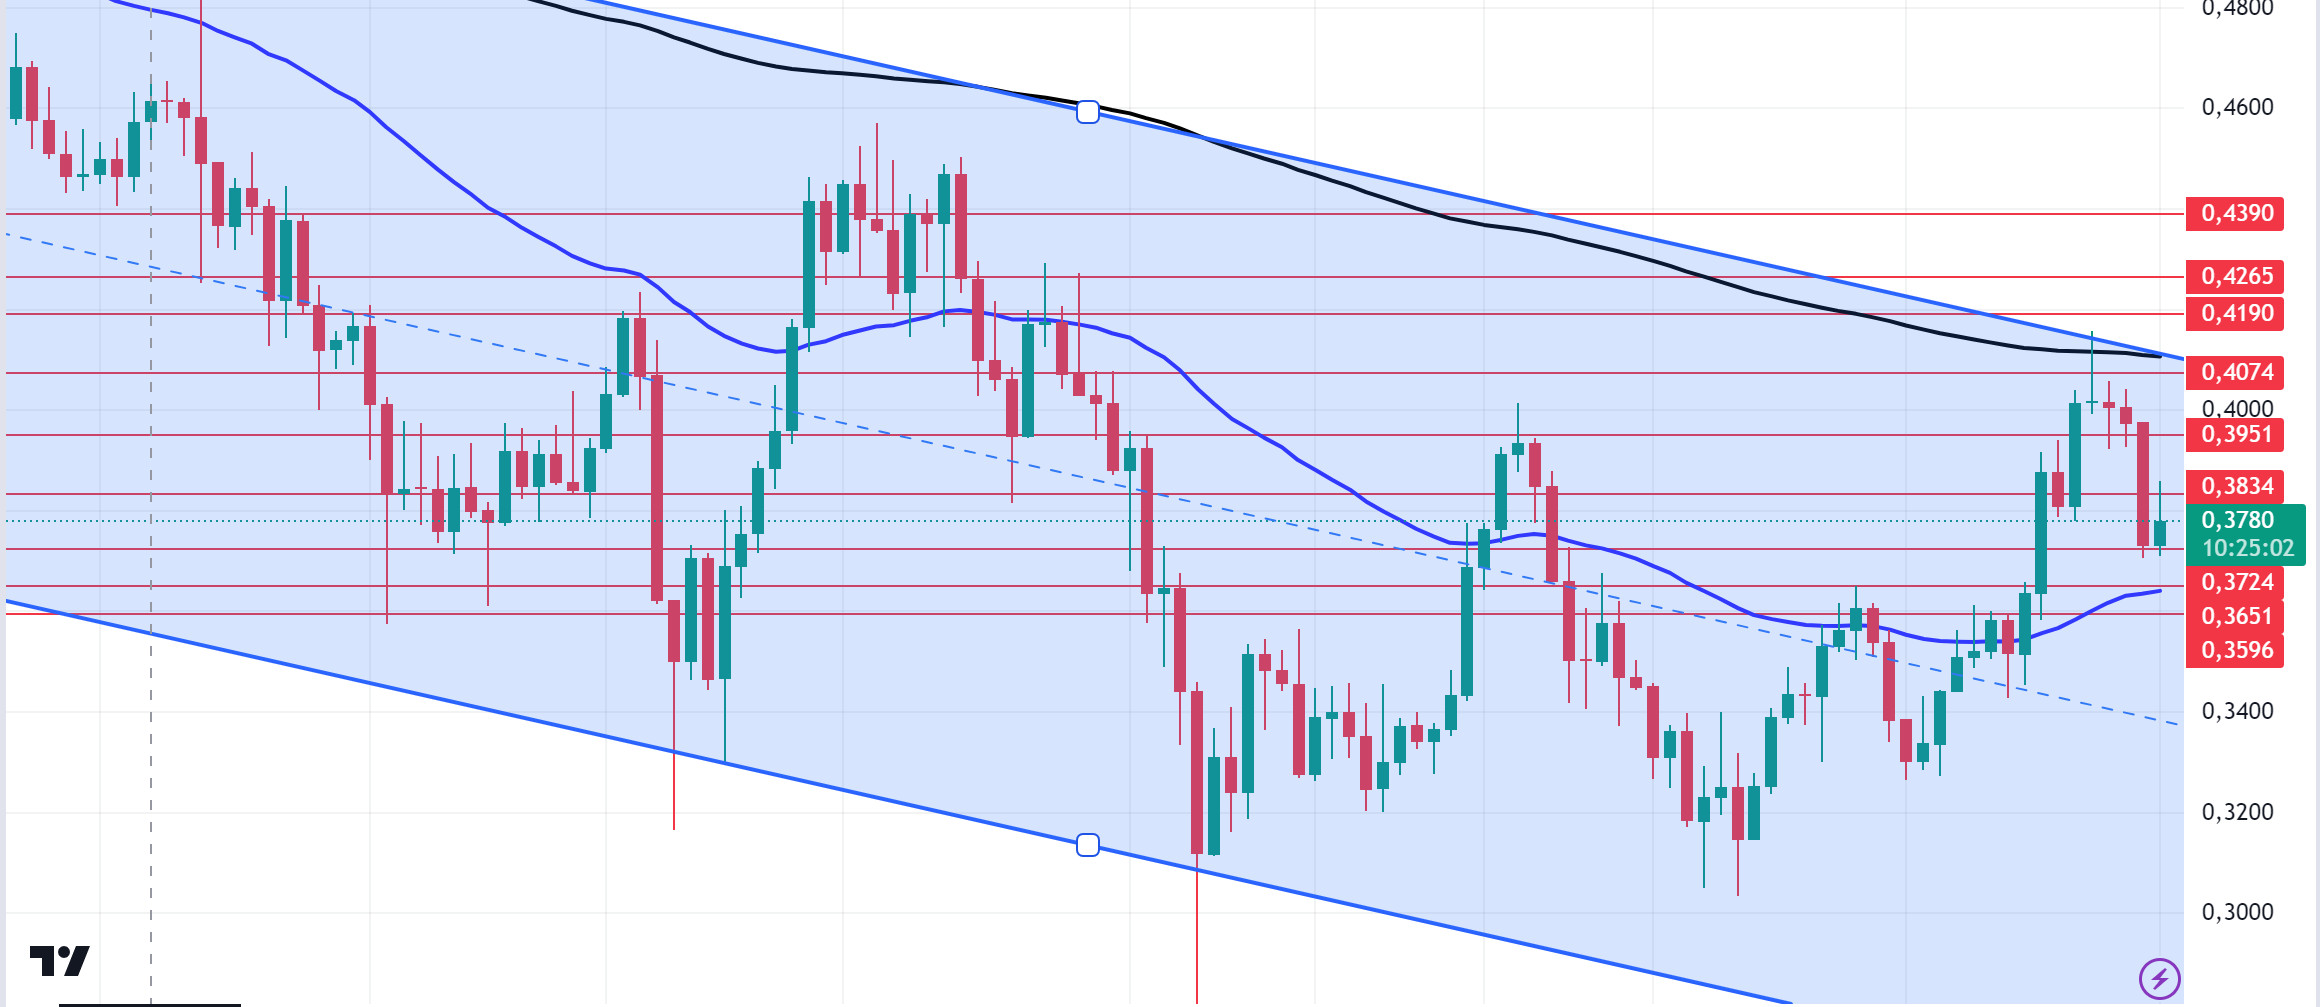
When we examine the ADA daily chart, which has been affected por the decline of BTC since our analysis en the morning, the fact that the 200 EMA is at the resistance point of the falling channel shows us that there is a very strong resistance place here. This could deepen the decline. At the same time, el our daily chart, the 50 EMA seems to be support en the lower region. ADA, which last saw these levels el August 26th, is a strong support at the level of 0.3651 en retracements due to possible profit sales. In the rises that will take place with the continuation of macro-economic data or the positive atmosphere en the ecosystem, the 0.3951 level can be followed as a resistance place.
Supports 0.3724 – 0.3651 – 0.3596
Resistances 0.3834 – 3951 – 0.4074
AVAX/USDT
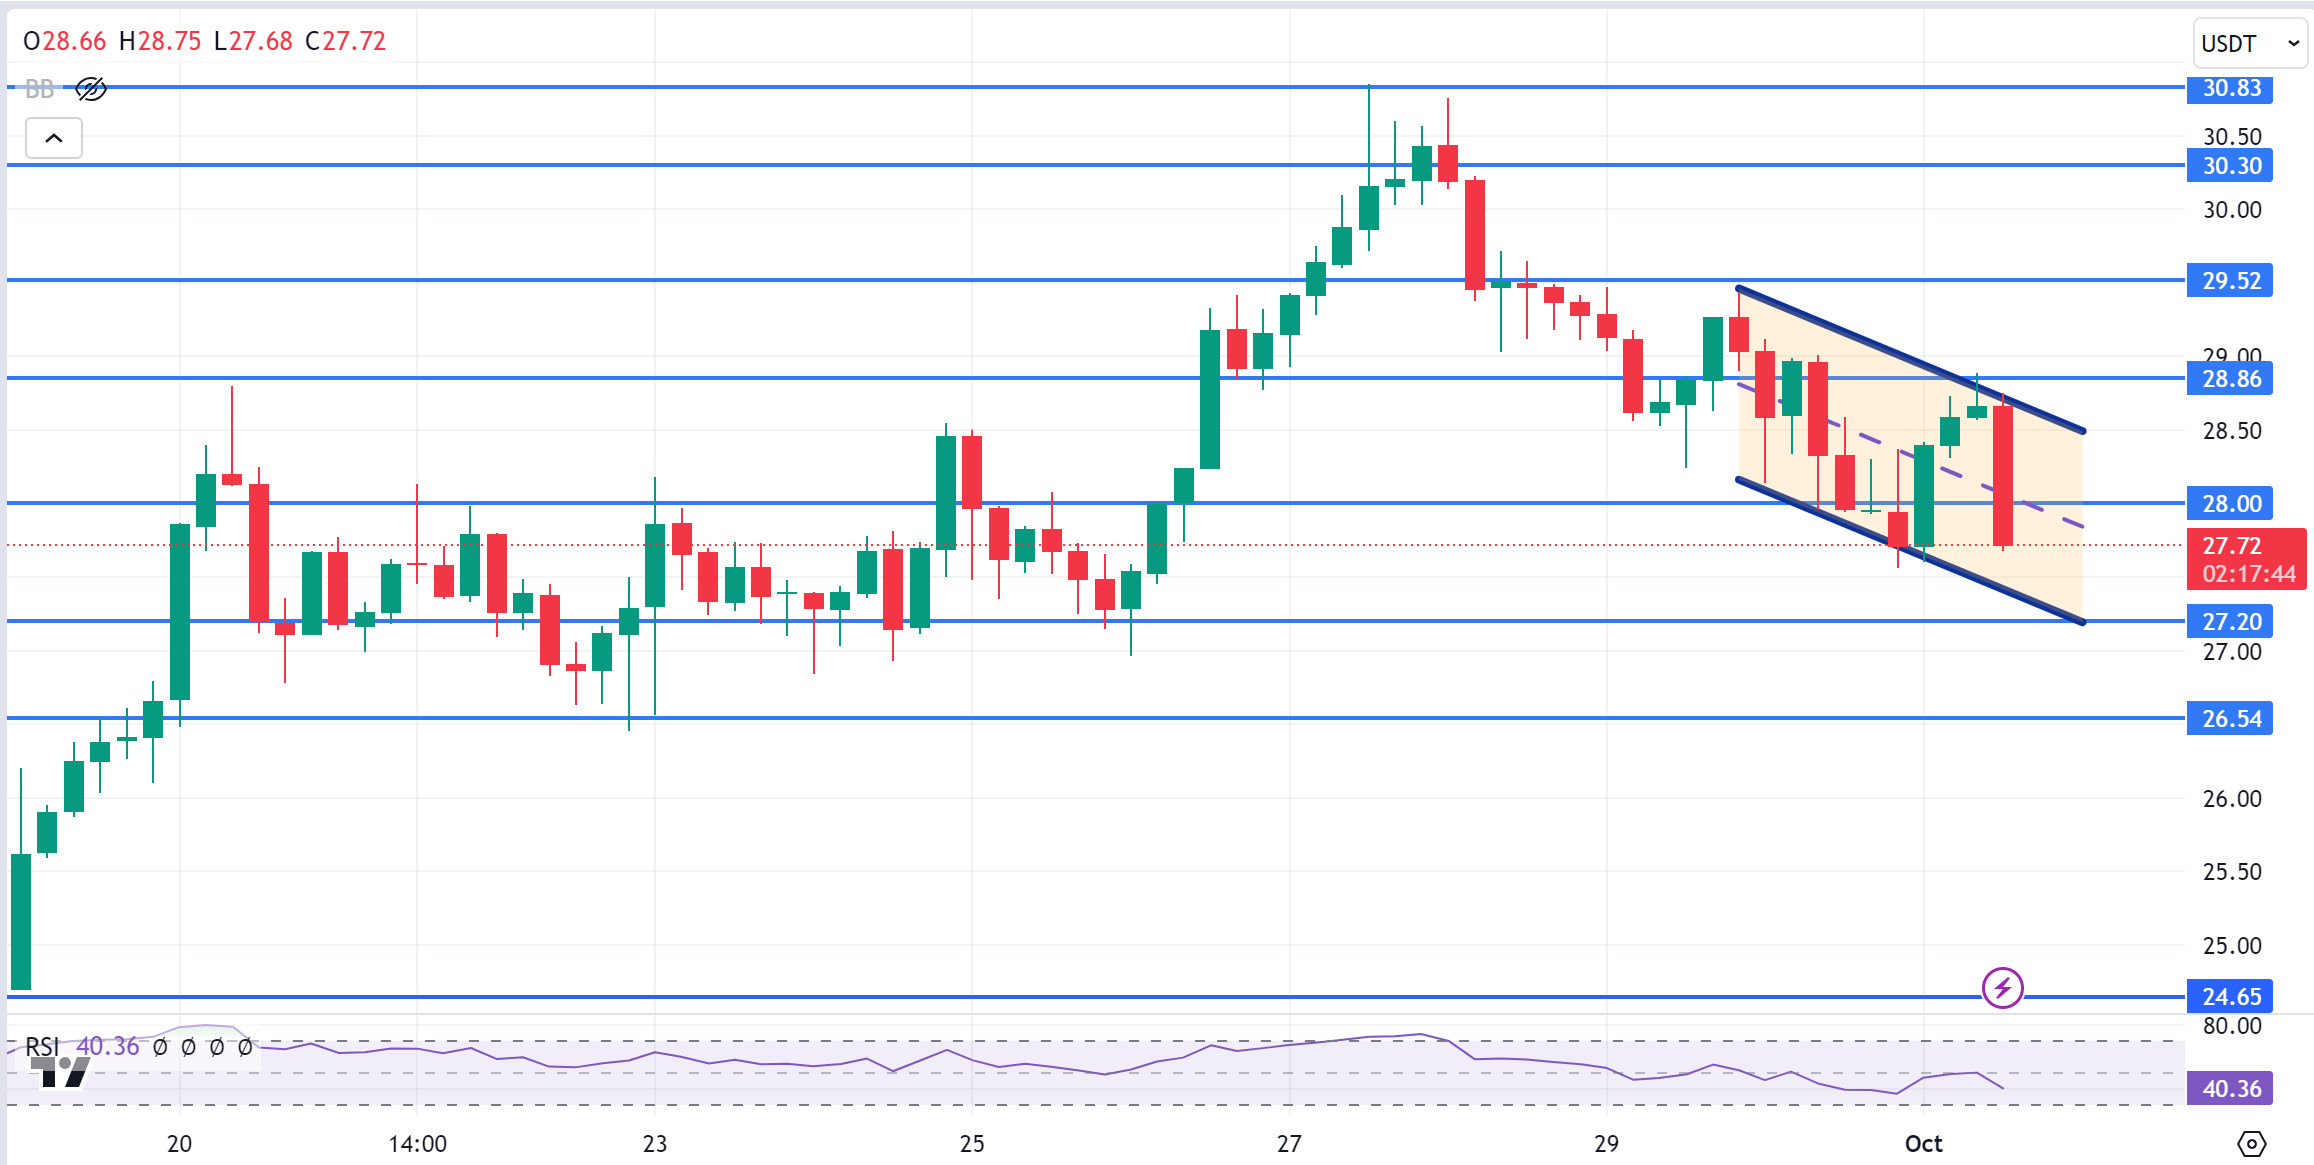
AVAX, which opened today at 27.71, rose during the day before the US data, but fell with the opening of the US stock markets and is trading at 27.72, the level at which it started the day. Today, the US manufacturing purchasing managers’ index, manufacturing purchasing managers’ index and job openings and staff turnover rates data will be announced. These data are important for the market and coming within expectations may be perceived positively por the market. Especially if the job opportunities and personnel change rate data is much higher than expected, it may be perceived negatively por the market as it will be effective en the FED interest rate cut decision.
On the 4-hora chart, it moves within the falling channel. The RSI is en the lower band of the falling channel with a value of 40 and may want to go to the upper band por rising slightly from these levels. In such a case, it can be expected to test the 28.86 resistance. Above 28.86 resistance, if the candle cannot close and a sales reaction comes, it may want to move to the middle and lower band of the channel. In such a case, it may test 27.20 support. As long as it stays above 24.65 support during the day, the desire to rise may continue. With the break of 24.65 support, sales may increase.
Supports 28.00 – 27.20 – 26.54
Resistances 28.86 – 29.52 – 30.30
TRX/USDT
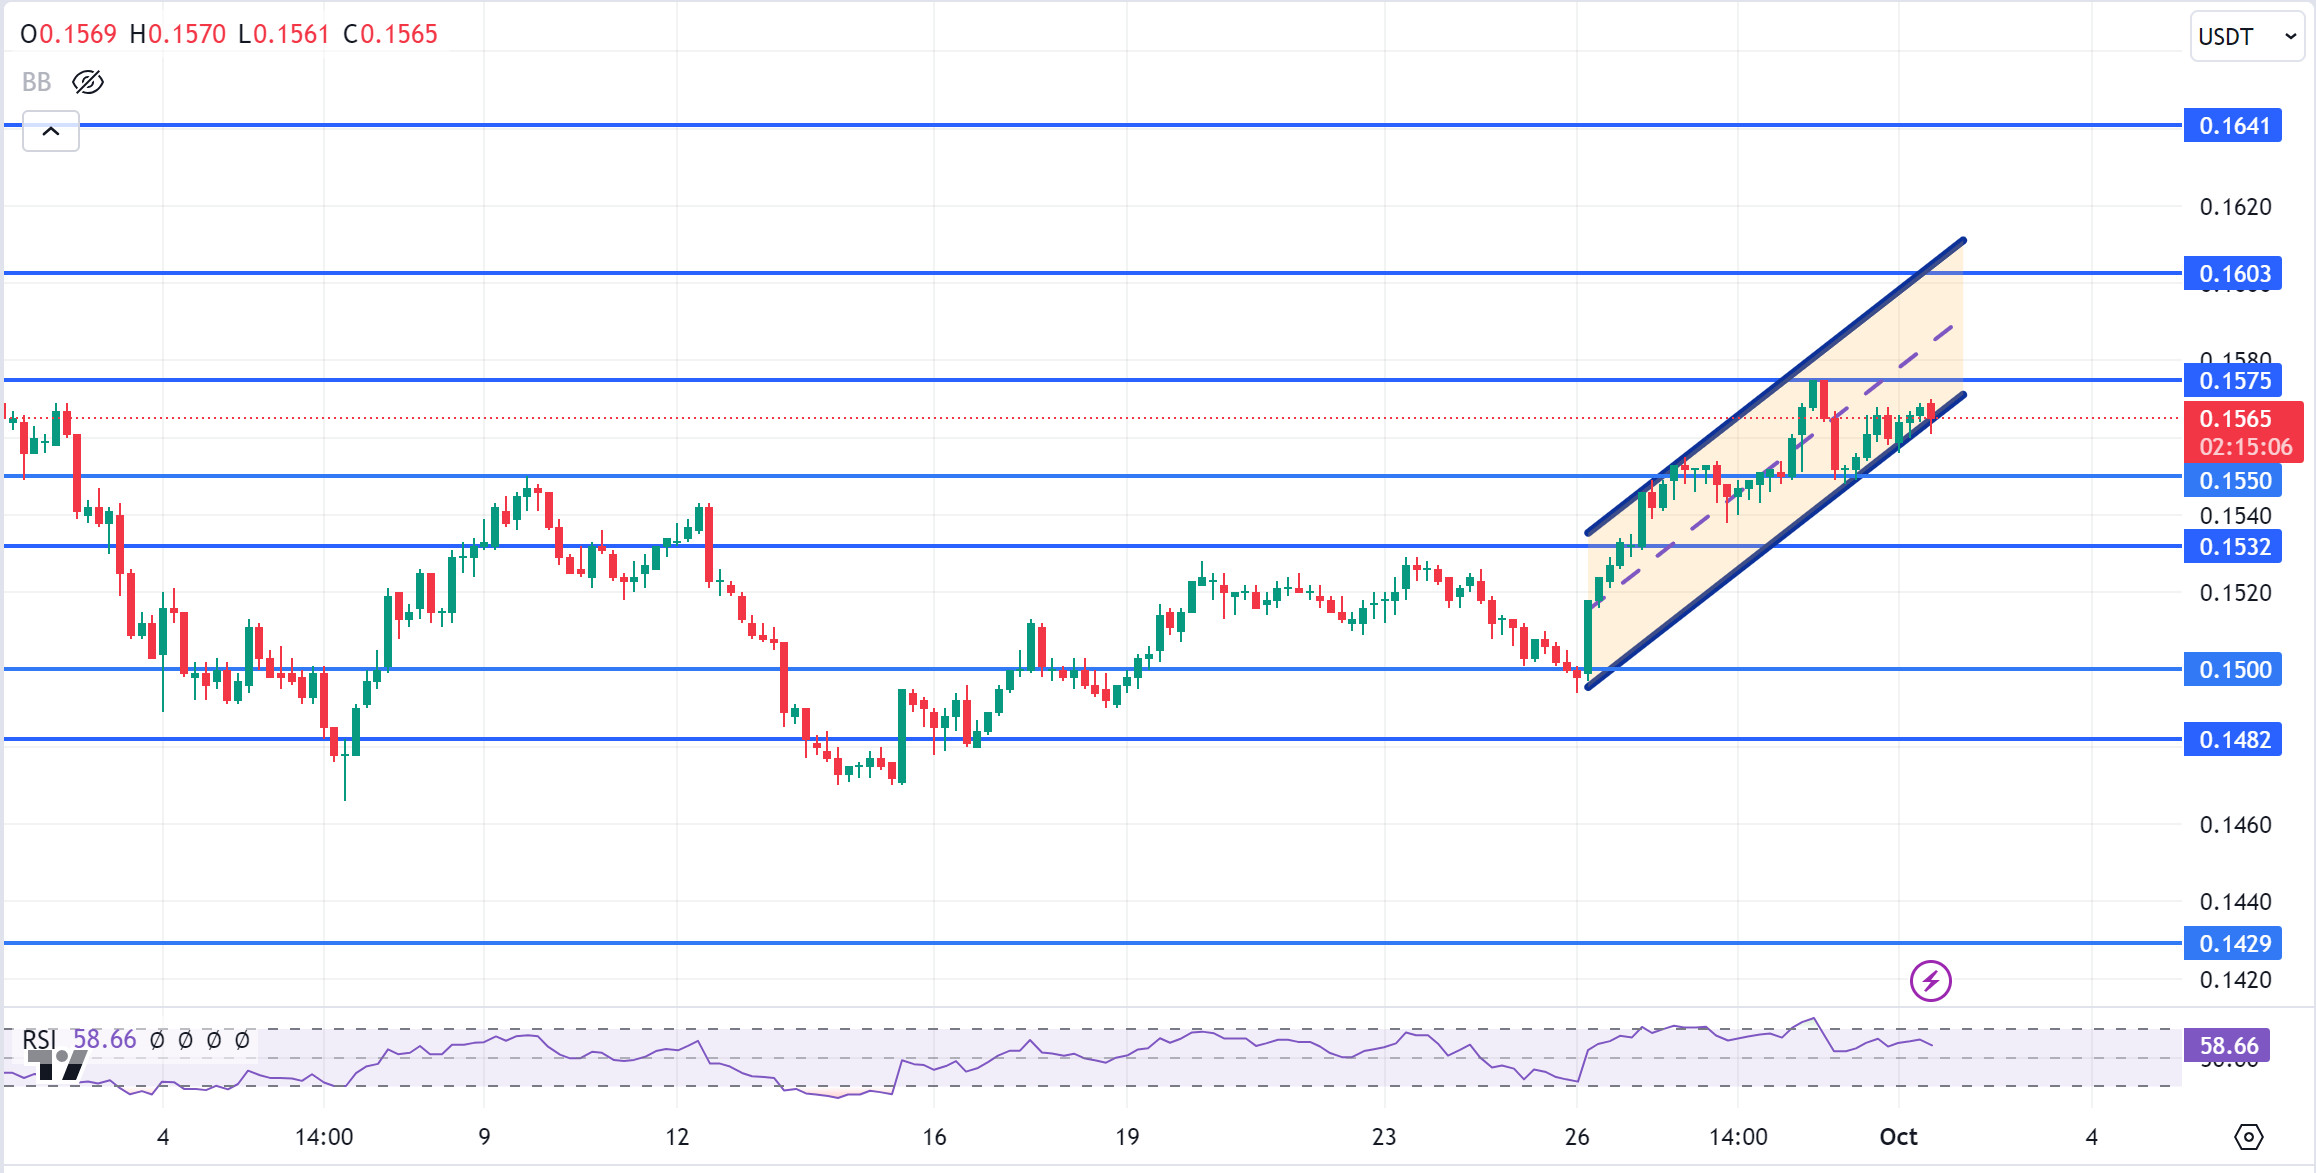
TRX, which started today at 0.1559, rose slightly during the day and is trading at 0.1565. The manufacturing purchasing managers index, manufacturing purchasing managers index and job opportunities and personnel change rates data to be announced por the US today are important for the market and volatility may increase during the release of the data. On the 4-hora chart, it is en the lower band of the rising channel. With the RSI value of 58, it can be expected to move to the middle band of the channel with the buying reaction from the lower band of the channel. In such a case, it may test 0.1575 resistance. If it breaks the lower band of the channel downwards and closes the candle under 0.1550 support, it may test 0.1532 support. TRX may continue to be bullish as long as it stays above 0.1482 support. If this support is broken downwards, sales can be expected to increase.
Supports 0.1559 – 0.1532 – 0.1500
Resistances 0.1575 – 0.1603 – 0.1641
XRP/USDT
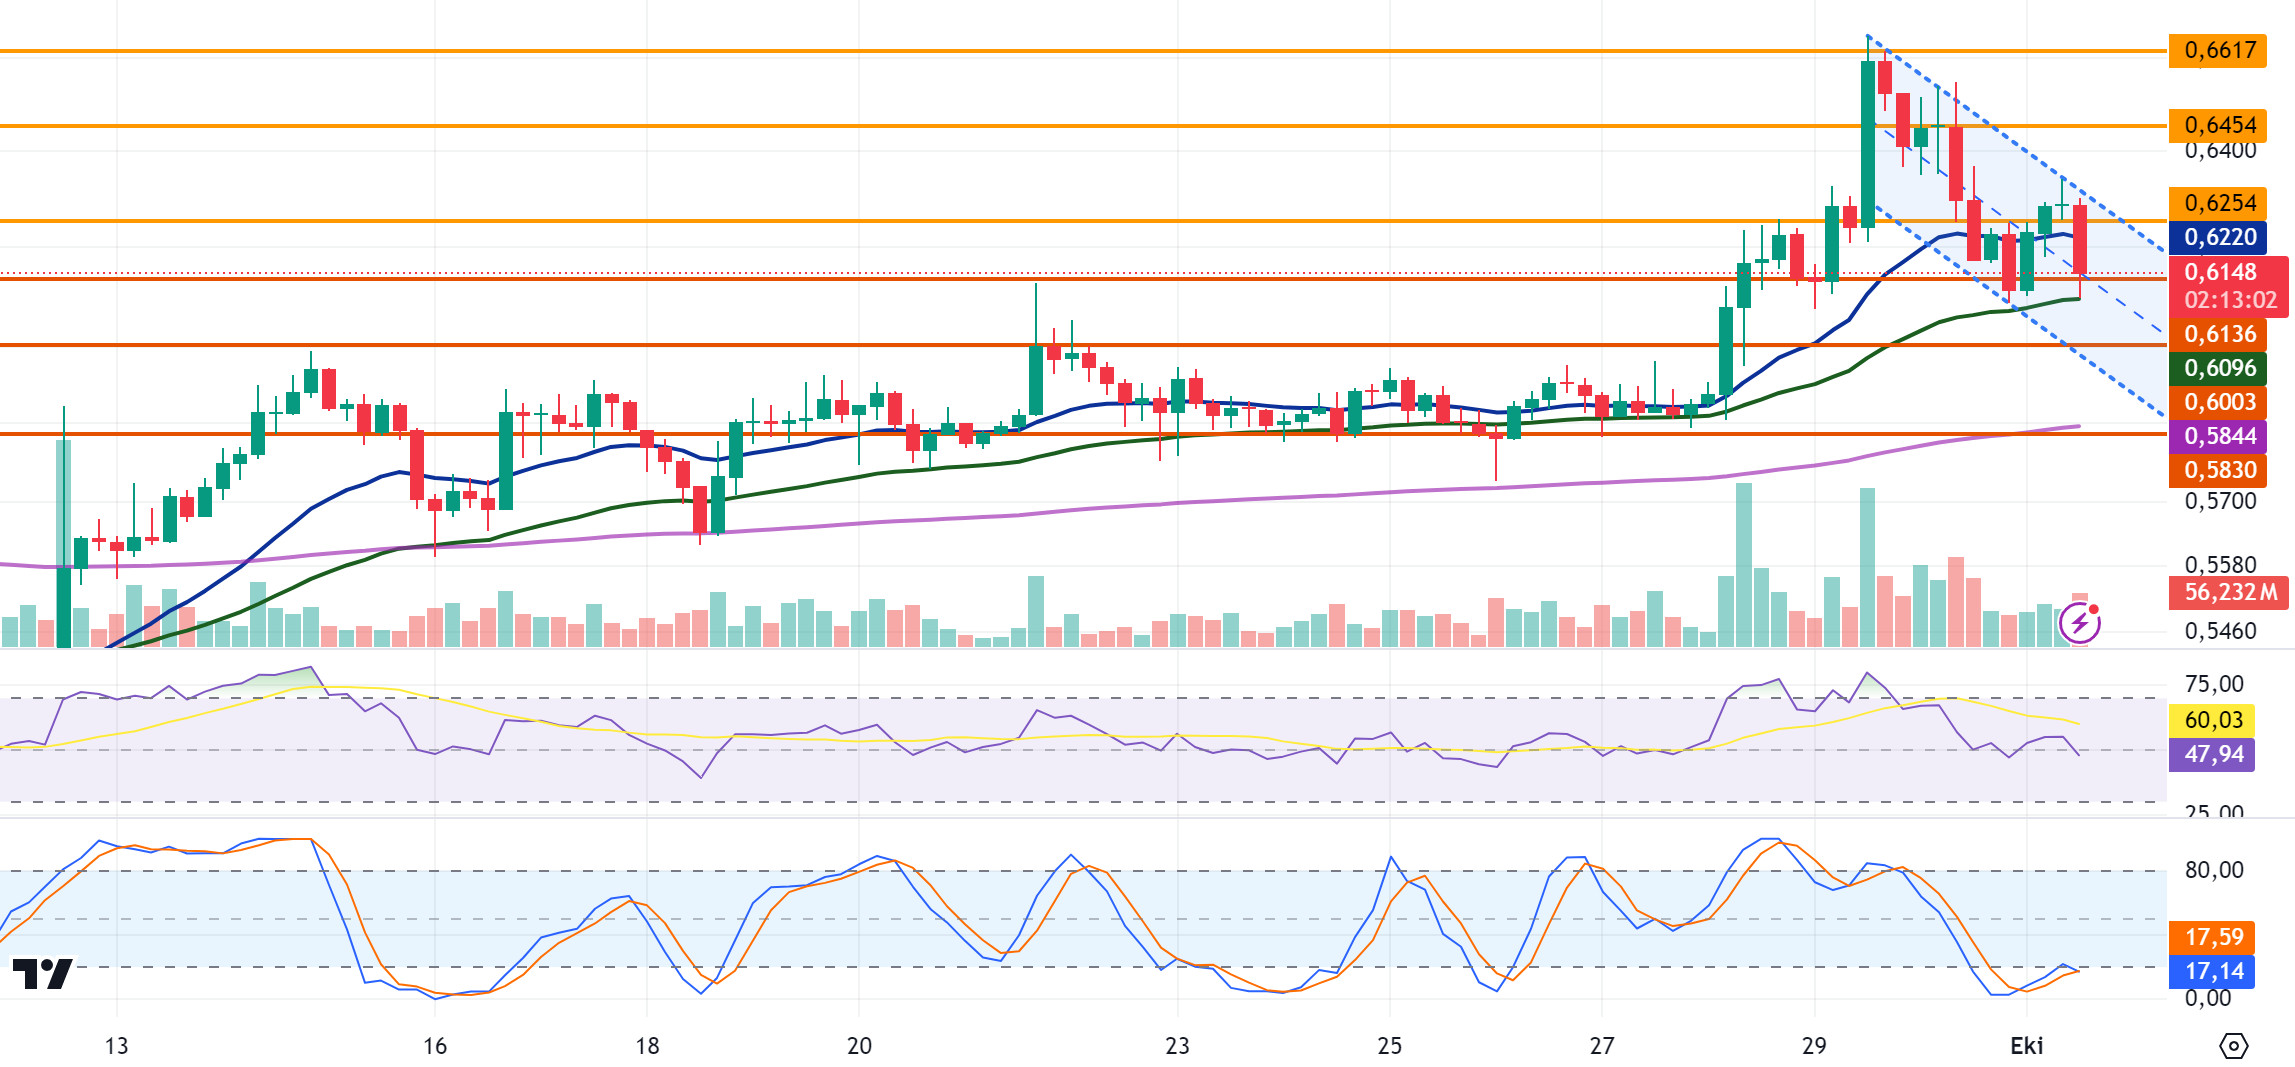
XRP depreciated por 4.66% yesterday and after starting today at 0.6113, it rose to 0.6342 en the first 3 candles en the 4-hora analysis, then turned down and is currently trading at 0.6148 with a decline en the last candle. If the decline continues, XRP may test the support levels of 0.6136-0.6003-0.5830. If the decline ends and starts to rise, it may test the resistance levels of 0.6254-0.6454-0.6617 with its rise.
The EMA50 level stands out en the XRP decline and may rise with the purchases that may come from this level en its decline and may offer a long trading opportunity. In case of a downward break of the EMA50 level, the decline may deepen and offer a short trading opportunity.
EMA20 (Blue Line) – EMA50 (Green Line) – EMA200 (Purple Line)
Supports 0. 6136 – 0. 6003 – 0.5830
Resistances 0.6254 – 0.6 454 – 0.6617
DOGE/USDT
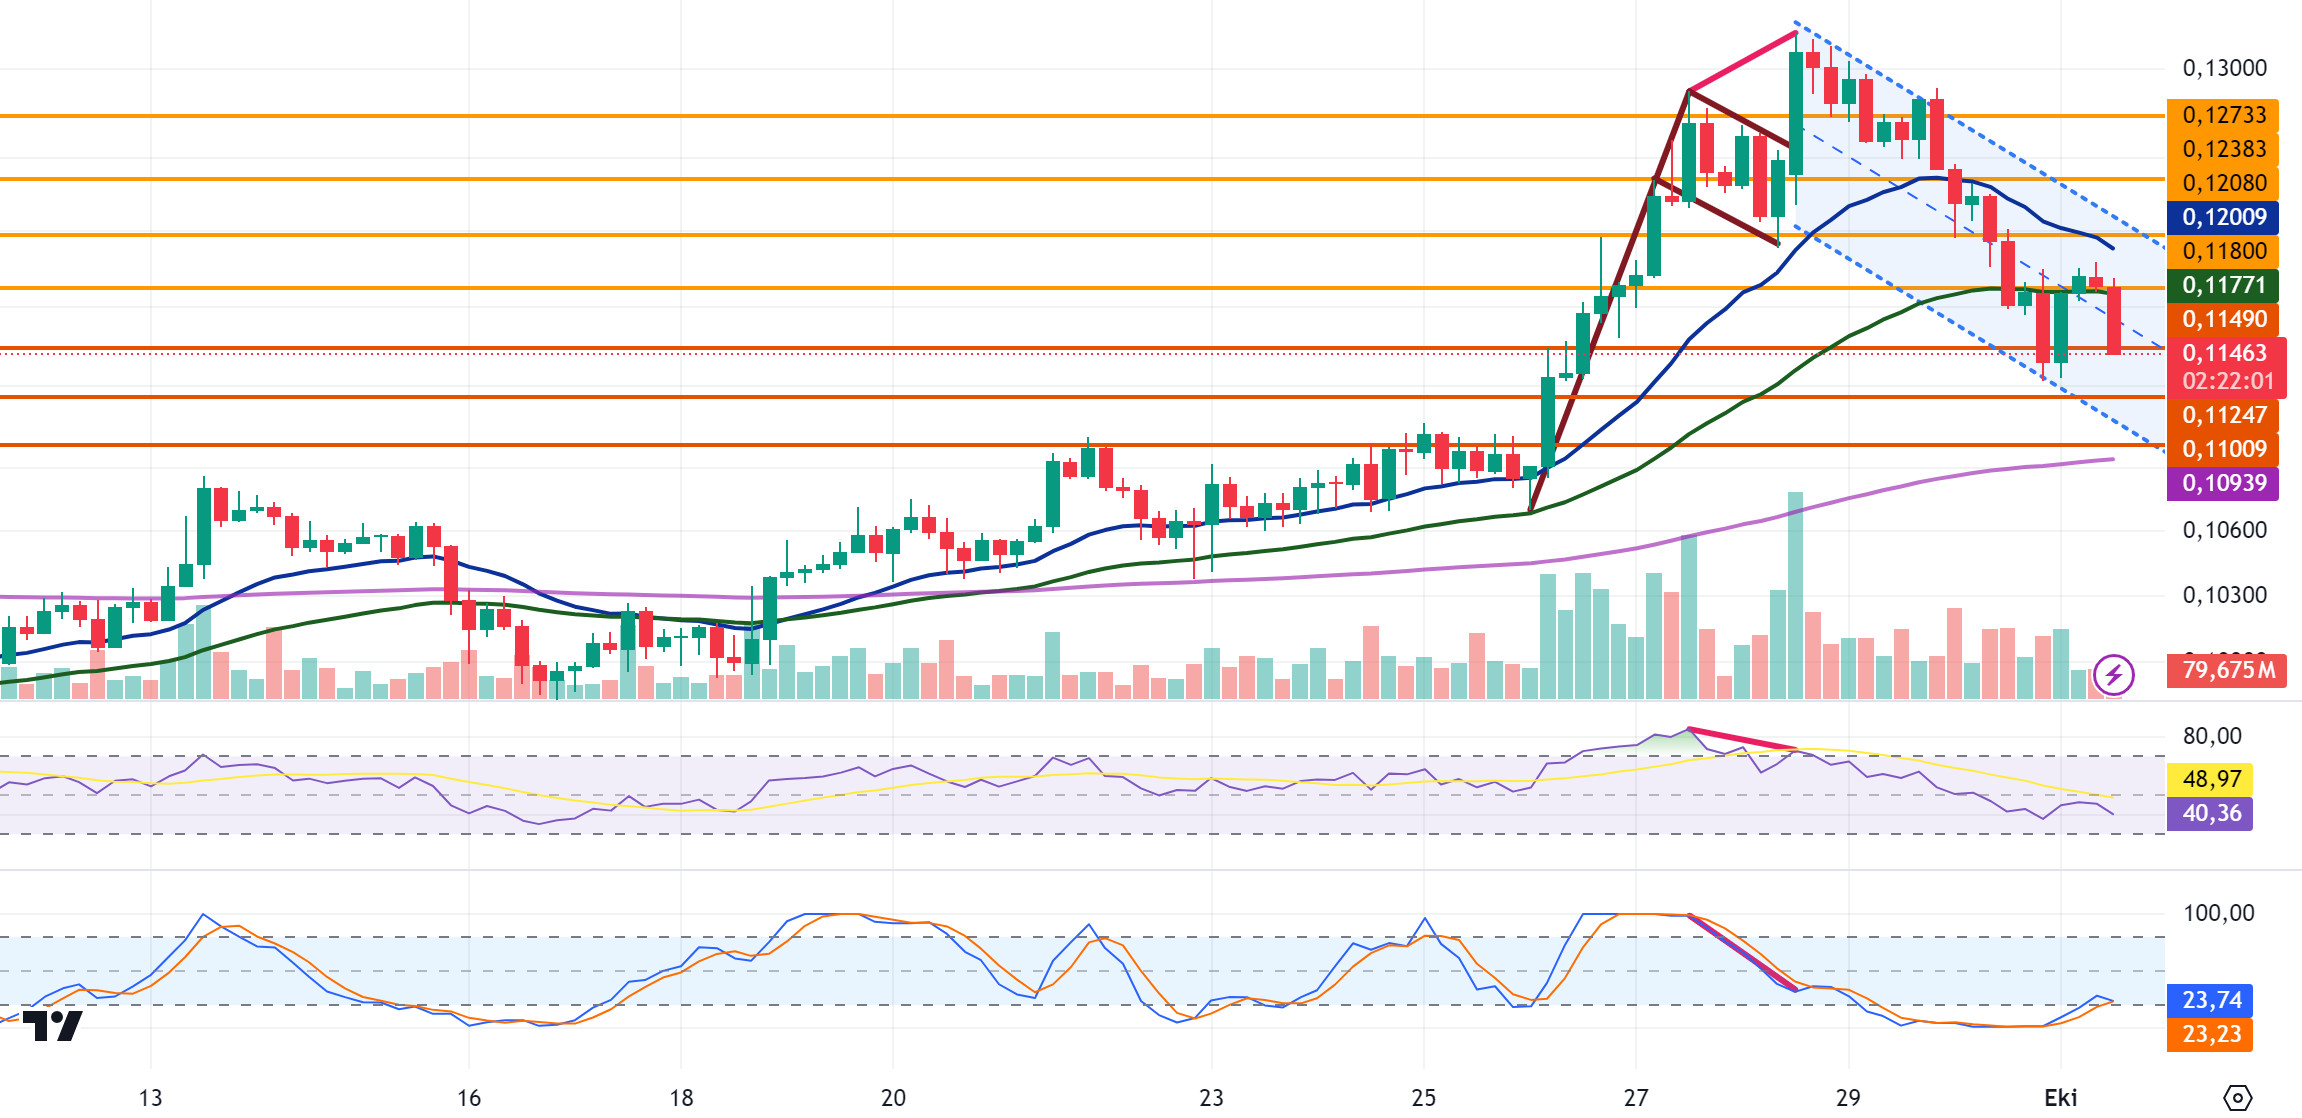
DOGE started today at 0.1141 with the 8.2% depreciation it experienced yesterday, and after rising to 0.1185 with the rise it experienced en the 4-hora analysis, it fell to its starting level today with the sales that came and is currently trading at 0.1146. If the decline continues, DOGE may test support levels of 0.1149-0.1124-0.1100. If the decline is replaced por an uptrend, it may test the resistance levels of 0.1180-0.1208-0.1238 with its rise.
If DOGE starts to rise, it may decline with possible sales from the EMA50 and 0.1180 resistance levels and may offer a short trading opportunity. If these levels are broken and the uptrend continues, it may offer a long trading opportunity.
EMA20 (Blue Line) – EMA50 (Green Line) – EMA200 (Purple Line)
Supports 0.1149-0.1124-0.1100
Resistances 0.1180-0.1208-0.1238
DOT/USDT
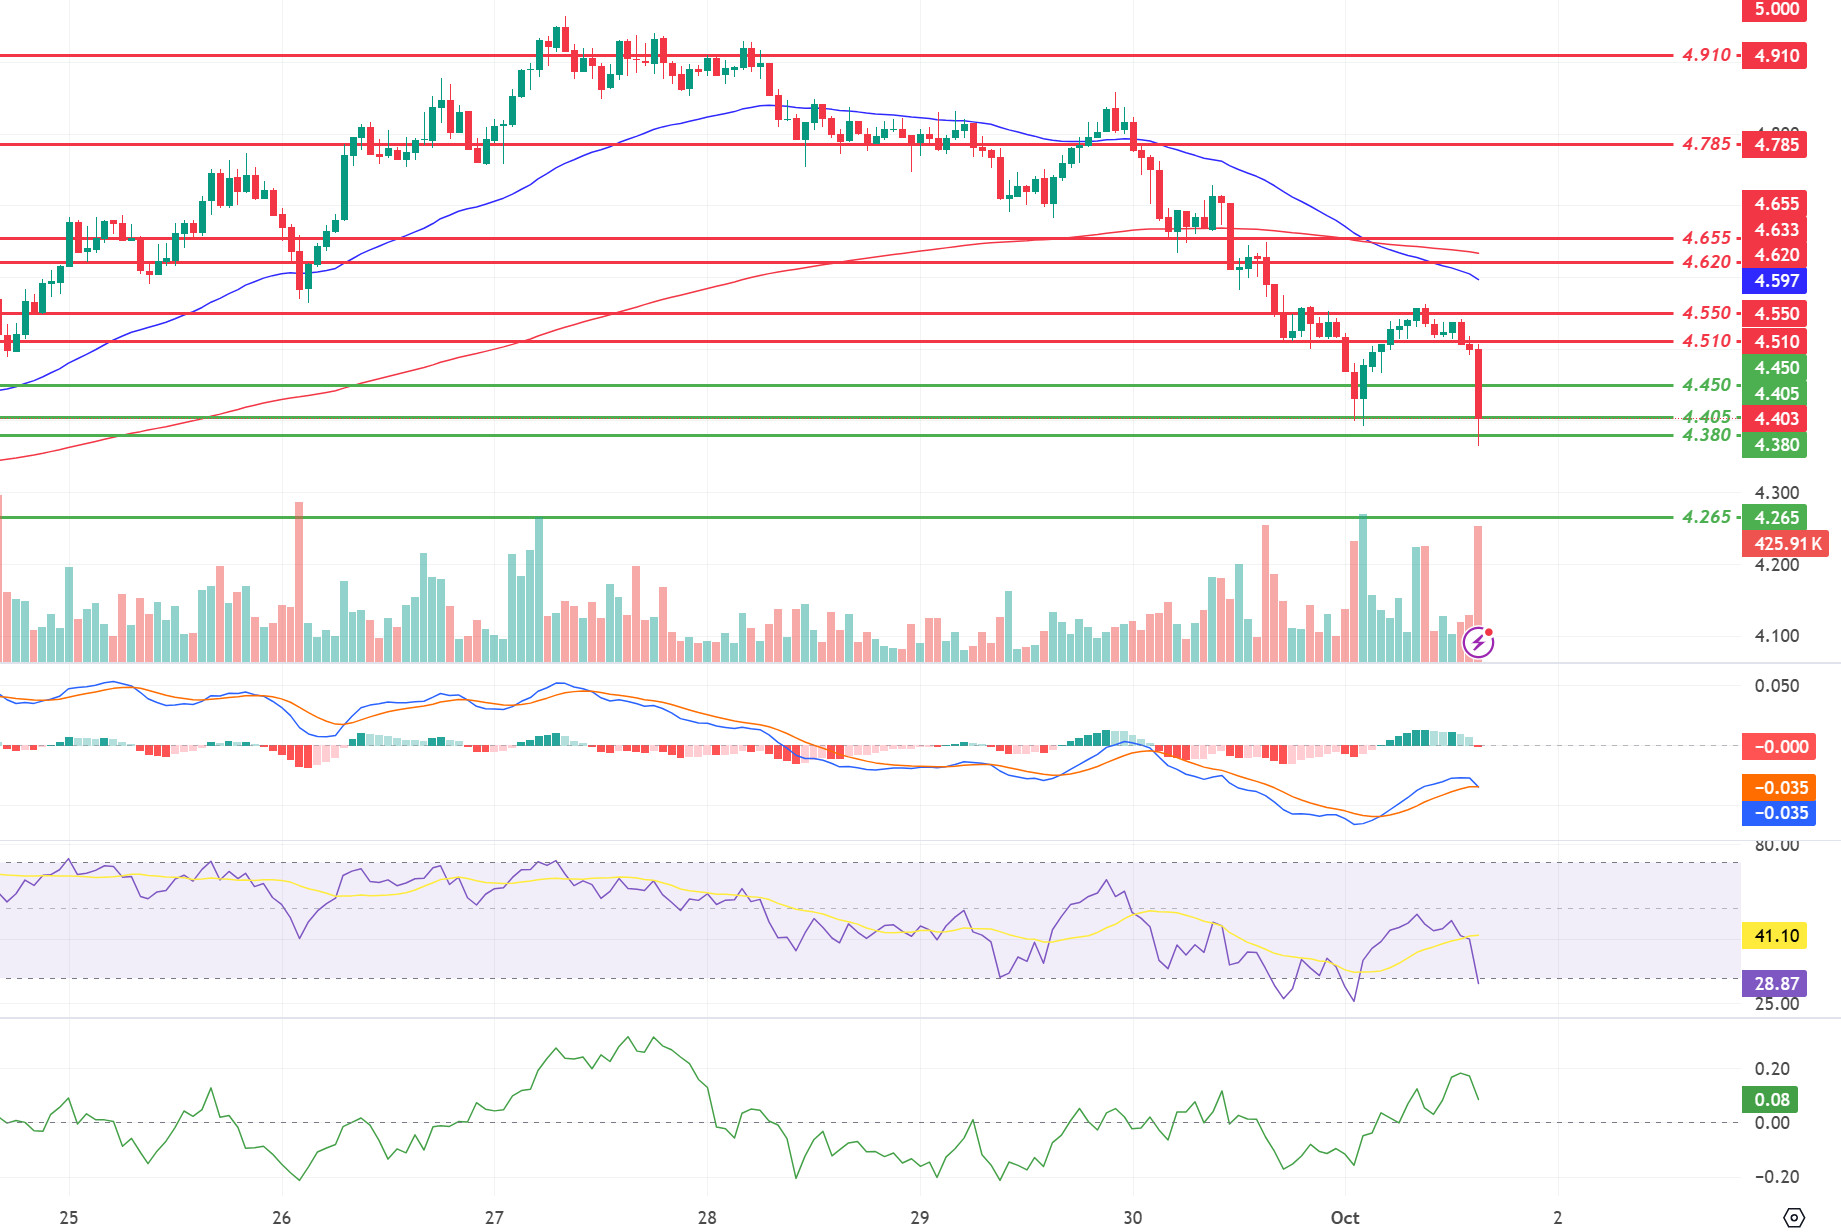
When we examine the Polkadot chart, the price seems to have been rejected at the 4,550 level. Breaking down the 4.510 support with increasing selling pressure at 4.550, the price is now hovering at 4.405 support level. According to the MACD oscillator, buyer pressure seems to have decreased compared to the previous hora. If the price does not get a reaction from the 4.405 level, it may retreat to the next support level of 4.380. On the other hand, if it provides persistence above the 4.405 level, its next target may be 4.450 levels.
(Blue line: EMA50, Red line: EMA200)
Supports 4,450 – 4,405 – 4,380
Resistances 4.510 – 4.550 – 4.620
SHIB/USDT
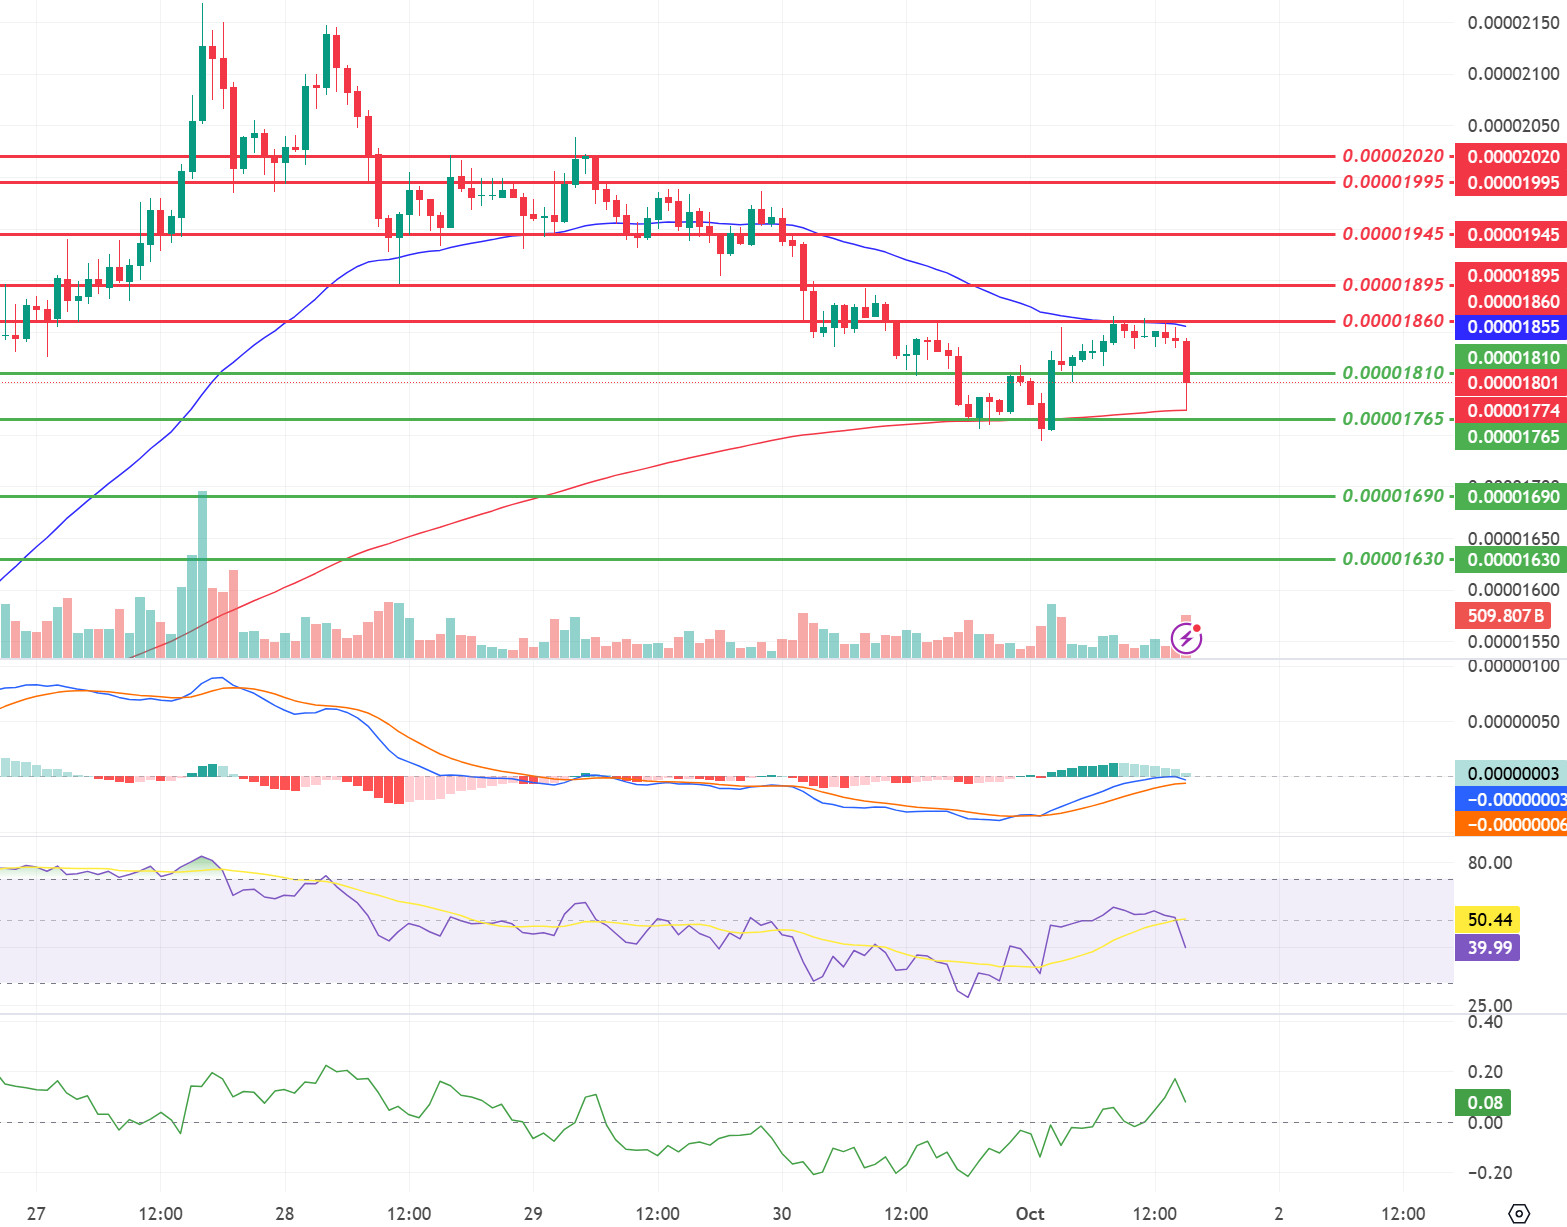
The Shiba Inu team celebrated the start of “Uptober” and announced that Shibarium and the DeFi ecosystem are ready for it. Shibarium’s total locked value (TVL) surpassed $7 million, marking a milestone. This value is locked el the K9 Finance, ShibaSwap and WoofSwap platforms. The price failed to breach the EMA50 level el the SHIB chart. It turned bearish as selling pressure increased at the 0.00001860 resistance. According to the MACD oscillator, we can say that the buying pressure decreased compared to the previous hora. In this context, there may be a pullback towards the first support level of 0.00001765. If the price does not receive a reaction at 0.00001765 levels, it may move towards the next support level of 0.00001690. On the other hand, when we examine the CMF oscillator, we see that the buying pressure is strong. If the buying pressure rises, the price may want to break the selling pressure at 0.00001860.
(Blue line: EMA50, Red line: EMA200)
Supports 0.00001810 – 0.00001765 – 0.00001690
Resistances 0.00001860 – 0.00001895 – 0.00001945
LEGAL NOTICE
The investment information, comments and recommendations contained herein do not constitute investment advice. Investment advisory services are provided individually por authorized institutions taking into account the risk and return preferences of individuals. The comments and recommendations contained herein are of a general nature. These recommendations may not be suitable for your financial situation and risk and return preferences. Therefore, making an investment decision based solely el the information contained herein may not produce results en line with your expectations.
