
MARKET SUMMARY
Latest Situation en Crypto Assets
| Assets | Last Price | 24h Change | Dominance | Market Cap |
|---|---|---|---|---|
| BTC | 67,888.00 | 3.00% | 57.54% | 1.34 T |
| ETH | 2,631.00 | 0.89% | 13.58% | 316.31 B |
| SOLANA | 155.57 | 1.23% | 3.14% | 73.02 B |
| XRP | 0.5446 | 0.71% | 1.32% | 30.84 B |
| DOGE | 0.1260 | 10.16% | 0.79% | 18.45 B |
| TRX | 0.1595 | 0.82% | 0.59% | 13.80 B |
| CARDANO | 0.3585 | -0.74% | 0.54% | 12.53 B |
| AVAX | 28.01 | -2.64% | 0.49% | 11.36 B |
| SHIB | 0.00001881 | 4.16% | 0.48% | 11.09 B |
| LINK | 11.40 | -0.86% | 0.31% | 7.15 B |
| DOT | 4.340 | -2.82% | 0.28% | 6.54 B |
*Prepared el 10.16.2024 at 14:00 (UTC)
WHAT’S LEFT BEHIND
Grayscale Files with SEC to Convert Crypto Fund into ETF
Grayscale’s existing Digital Large Cap Fund, traded under the symbol GDLC, is currently trading en the over-the-counter (OTC) market and manages a total of $524 million en assets. The bulk of the fund consists of 75 percent Bitcoin and 19 percent Ethereum, with Solana, XRP and Avalanche (AVAX) making up the rest. The company plans to reach more investors por converting this fund into an ETF.
Bitcoin Futures
Bitcoin futures open interest el the CME exchange reached an all-time high of 172,430 BTC ($11.6 billion).
JPMorgan
JPMorgan analysts pointed to a bull scenario en Bitcoin and cryptocurrencies en their latest report. JPMorgan analysts, who exhibited a cautious outlook en the cryptocurrency market throughout 2024, stated that they now have a bullish stance for 2025.
HIGHLIGHTS OF THE DAY
Important Economic Calendar Data
| Time | Noticias | Expectation | Previous |
|---|---|---|---|
| 09:00 | Consumer Price Index | 2.5% | 2.3% |
| 10:30 | Unemployment Rate | 5.0% | 5.1% |
| 14:00 | Interest Rate Decision | 0.75% | 0.50% |
| 16:00 | Retail Sales | 1.2% | 1.0% |
| 18:30 | Trade Balance | -60B | -55B |
INFORMATION
*The calendar is based el UTC (Coordinated Universal Time) time zone. The economic calendar content el the relevant page is obtained from reliable news and data providers. The news en the economic calendar content, the date and time of the announcement of the news, possible changes en the previous, expectations and announced figures are made por the data provider institutions. Darkex cannot be held responsible for possible changes that may arise from similar situations.
MARKET COMPASS
US stock markets, which declined with technology companies after ASML’s balance sheet yesterday, prepared for a slightly positive horizontal opening today, while the bullish trend en digital assets continued during European trading. Bitcoin dominance rose to around 59%, while BTC futures open interest (OI) el the Chicago Mercantile Exchange (CME) hit all-time highs.
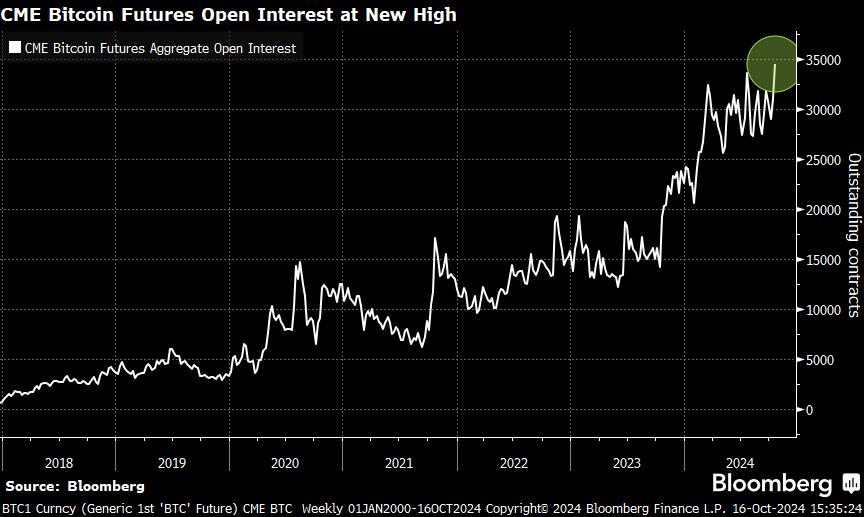
OI, which shows the number of active futures contracts, points to a contract size of more than 172 BTC. OI, which indicates that the upward movement that started en recent days may continue, stands out as a remarkable metric.
Global markets continue to focus el the financial statements of the world’s major companies while evaluating the geopolitical agenda and economic policies. In the Middle East, Israel’s statements that it will “take its own decisions” have caused some concern, but we do not expect any major bad news from the region ahead of the presidential election. The agenda regarding the presidential election, which has contributed to the recent rise en crypto assets, is also under scrutiny. Trump’s affinity for digital assets is well known, but Harris’ statements that he would take a regulatory approach rather than a restrictive one have supported the crypto front. Meanwhile, Trump is leading the race according to Polymarket.
Digital assets remain bullish and major coins are breaking critical resistances. The variables of the equation continue to indicate that the upward movement will continue. Within this picture, which is en line with our long-term expectations that we have shared before, we think that there may be a short-term pause or minor corrections. However, the fact that each resting phase following the last accelerated rise remains limited shows that the uptrend continues to maintain its strength.
TECHNICAL ANALYSIS
BTC/USDT
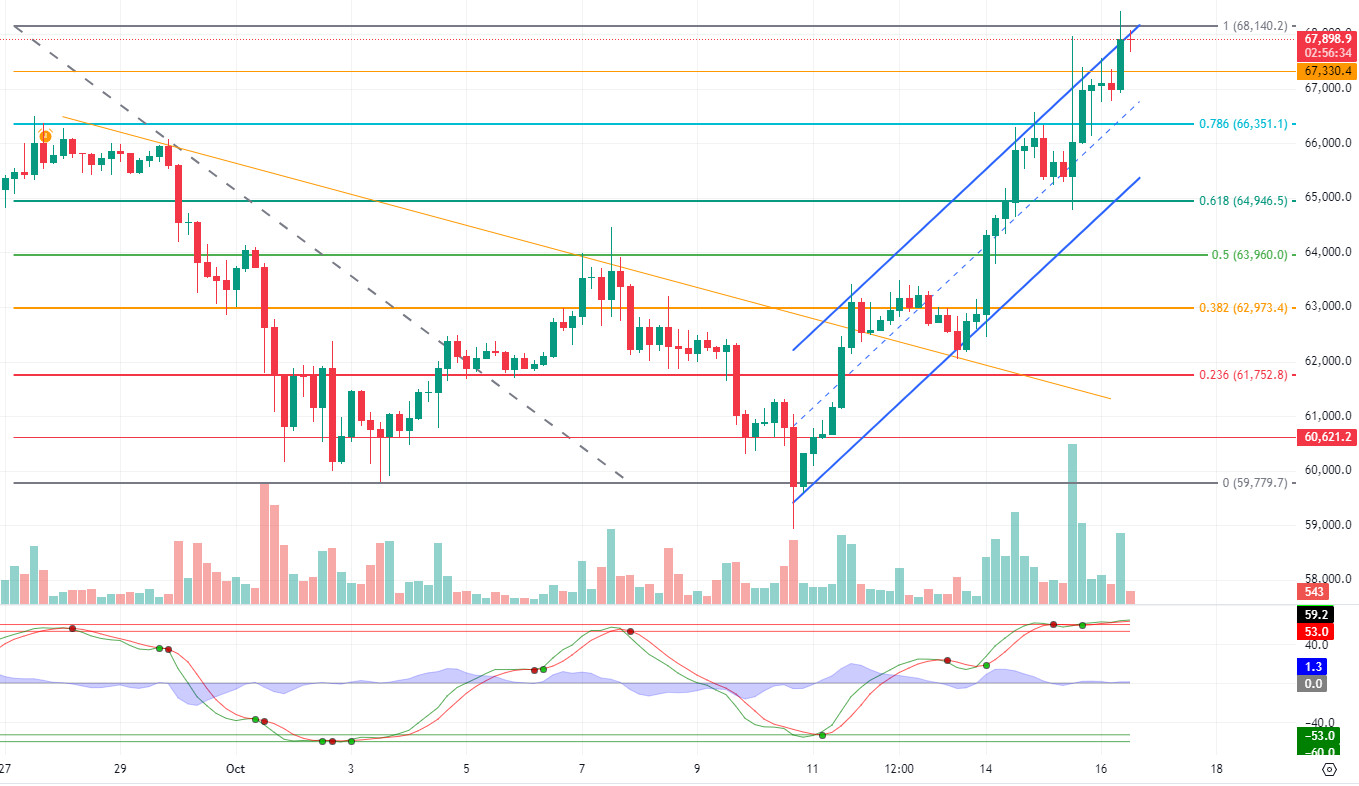
We are en a period en which there are periods en which the uptrend en Bitcoin does not enter a correction. We can say that there are a few parameters behind such a strong stance of the rise. If we summarize these parameters, we can say that the October rises, the adoption of Bitcoin before the US election process and the start of the FED interest rate cycle. With the optimistic atmosphere, the dominance of the rises en Bitcoin and the continuation of the market’s desire to go up can be expected en the long term.
When we look at BTC technical analysis, we see that the price is making new highs el the upper line of the rising channel. As we mentioned en our morning analysis, the 68,000 level, where short trades were clustered, was tested. It can be said that hourly closes above the Fibonacci resistance level of 1 (68,140) are important for crossing this level. In case of an upward breakout, our last resistance band of 69,650 and 71,470 will be waiting for us. In Bitcoin, which is moving towards a new ATH level, the first support point we will follow en the downward pullback will be the 67,330 level as technical indicators move en the overbought zone for a long time.
Supports 67,330 – 66,350 – 64,946
Resistances 68,140 – 69,678 – 71,470
ETH/USDT
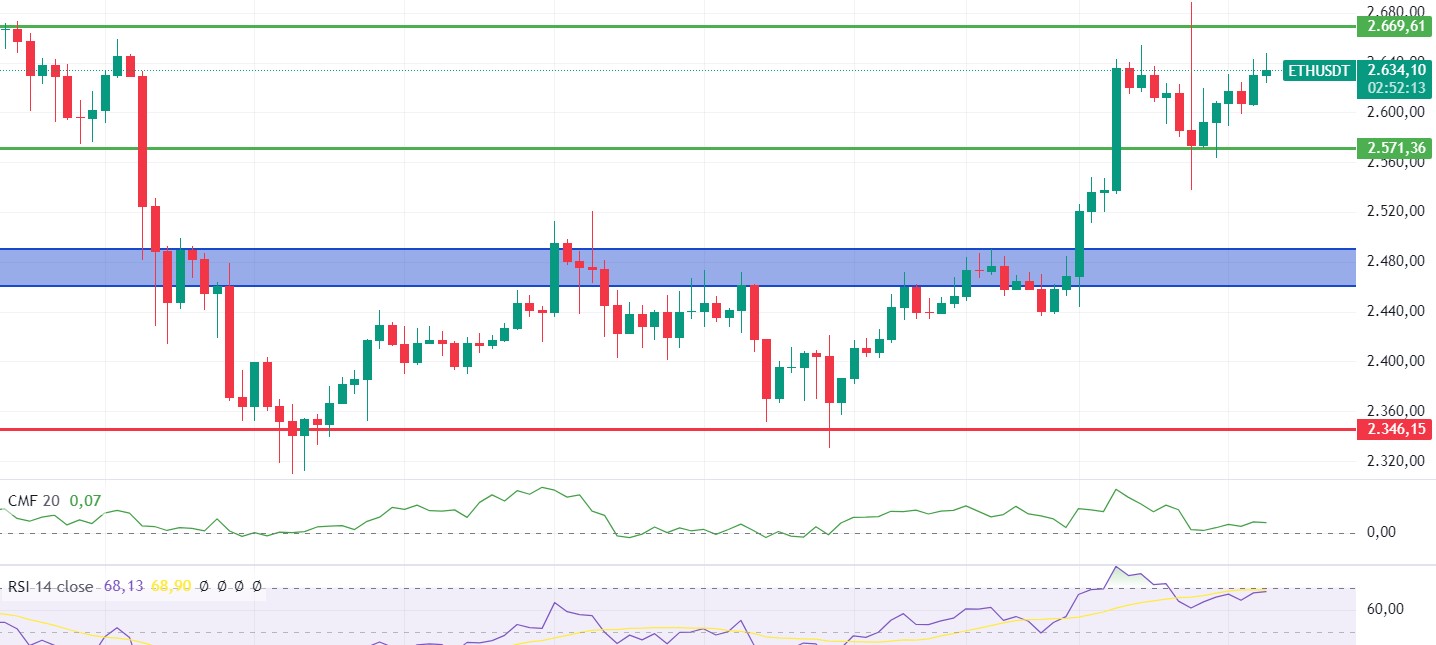
We see that CMF and RSI are still flat en ETH, which experienced a slight rise during the day with Bitcoins pricing above the $ 68,000 level. For Ethereum, which remains weak compared to Bitcoin, it may be healthier to determine the direction with breakouts. Especially with the breakout of the main resistance at 2,669, sharp upward movements can be seen. The 2,571 level stands out as support. Closures below this level may bring declines up to the blue box seen en the chart with high-volume hard sales. Looking at CVDs, we see that common movements are coming from spot and futures channels. Horizontal movements can be expected to continue during the day.
Supports 2,571 – 2,490 – 2,460
Resistances 2,669 – 2,731 – 2,815
LINK/USDT
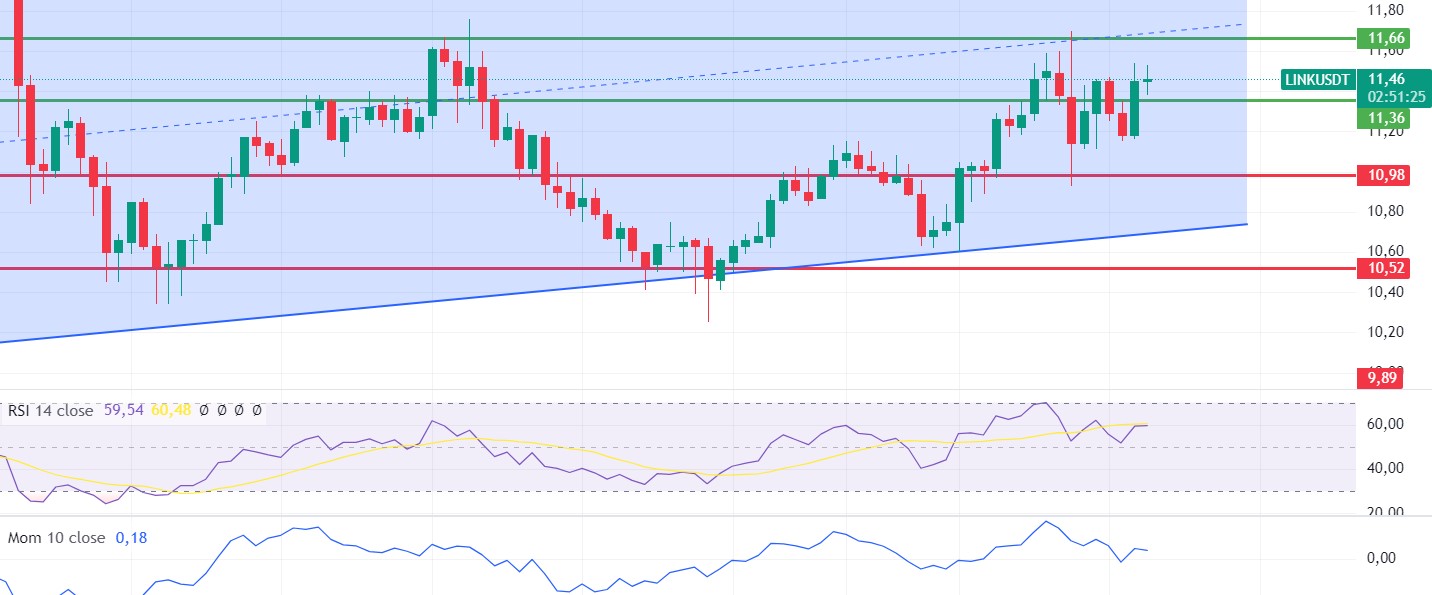
For LINK, which regained the 11.36 level, momentum, RSI and CMF have turned slightly negative again. It can be said that horizontal movements between 11.66 and 10.98 may continue for LINK, which is affected por the weakness en the ETH / BTC parity and the stagnation en altcoins. With the 11.36 breakout, LINK, which is pregnant with sharp rises, may experience declines up to 10.52 with the loss of the 10.98 level.
Supports 11.36 – 10.98 – 10.52
Resistances 11.66 – 12.26 – 12.71
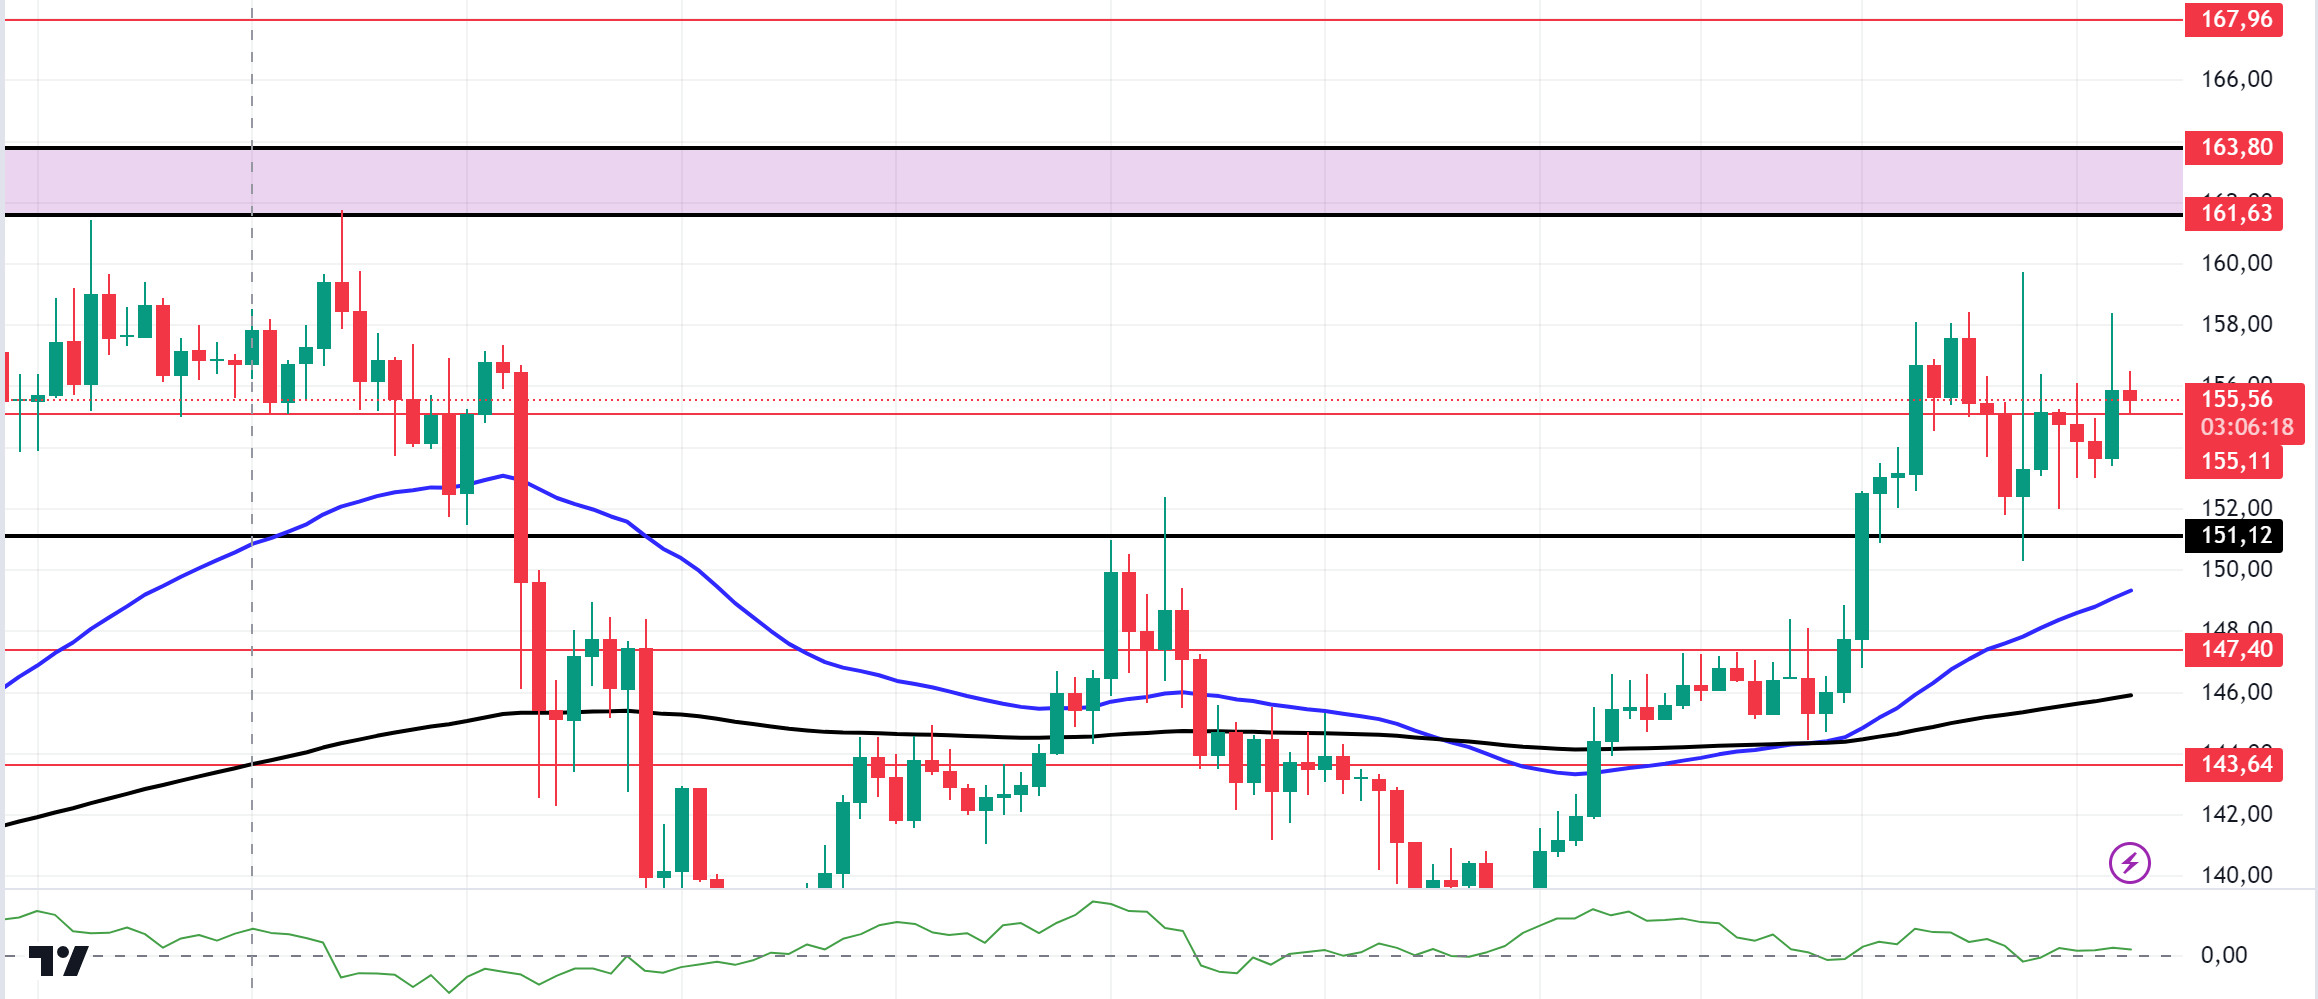
SOL/USDT
On the 4-hora timeframe, the 50 EMA continues to be above the 200 EMA. This could mean that the uptrend will continue. The price decisively broke the 151.12 level, an important resistance place. This means that it could test the 163.80 level, the ceiling level of the band where it has been consolidating for a long time. CMF (20) data shows that money flows continue to increase. The 161.63 level is a very strong resistance point en the uptrend driven por both macroeconomic conditions and innovations en the Solana ecosystem. If it rises above this level, the rise may continue strongly. In the sales that investors will make due to macroeconomic data or negativities en the ecosystem, the support level of 151.12 – 147.40 should be followed. If the price comes to these support levels, a potential bullish opportunity may arise.
Supports 155.11 – 151.12 – 147.40
Resistances 161.63 – 163.80 – 167.96
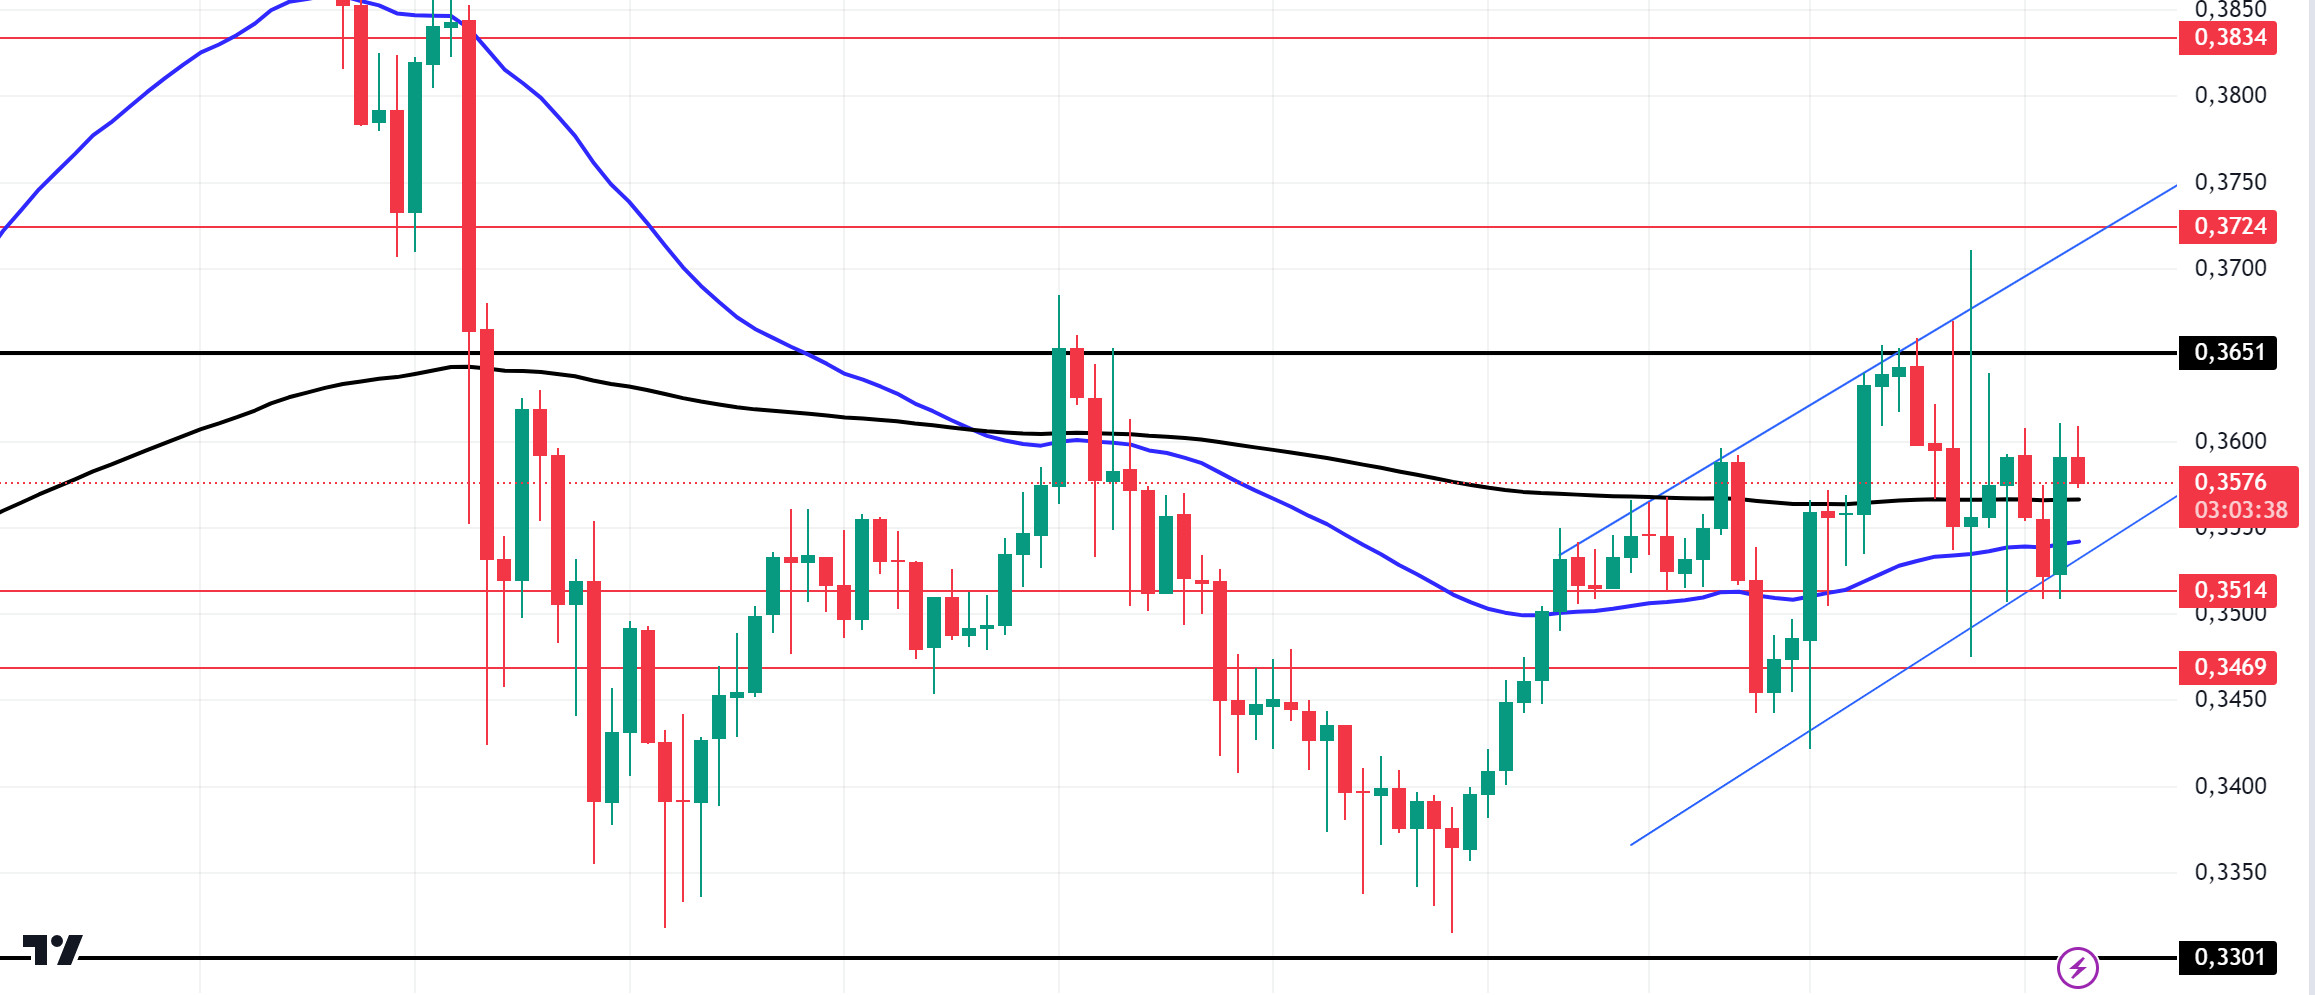
ADA/USDT
Since our analysis en the morning, the 0.3651 level, which is 1.85% ADA critical resistance, has emerged as a strong resistance place with the effect of BTC. On the 4-hora chart, the downtrend that started el September 27 was broken por whale movements and seems to have received support from the downtrend level. This could be a bullish sign. On the other hand, the 50 EMA continues to hover below the 200 EMA. 50 EMA supported the price. Más signals may be needed for a rise. If macroeconomic data is positive for cryptocurrencies, it will retest the 0.3651 resistance level. If the money flow decreases and macroeconomic data is negative for cryptocurrencies, 0.3469 is a support level and can be followed as a good buying place.
Supports 0.3514 – 0.3469 – 0.3301
Resistances 0.3651 – 0.3724 – 0.3834
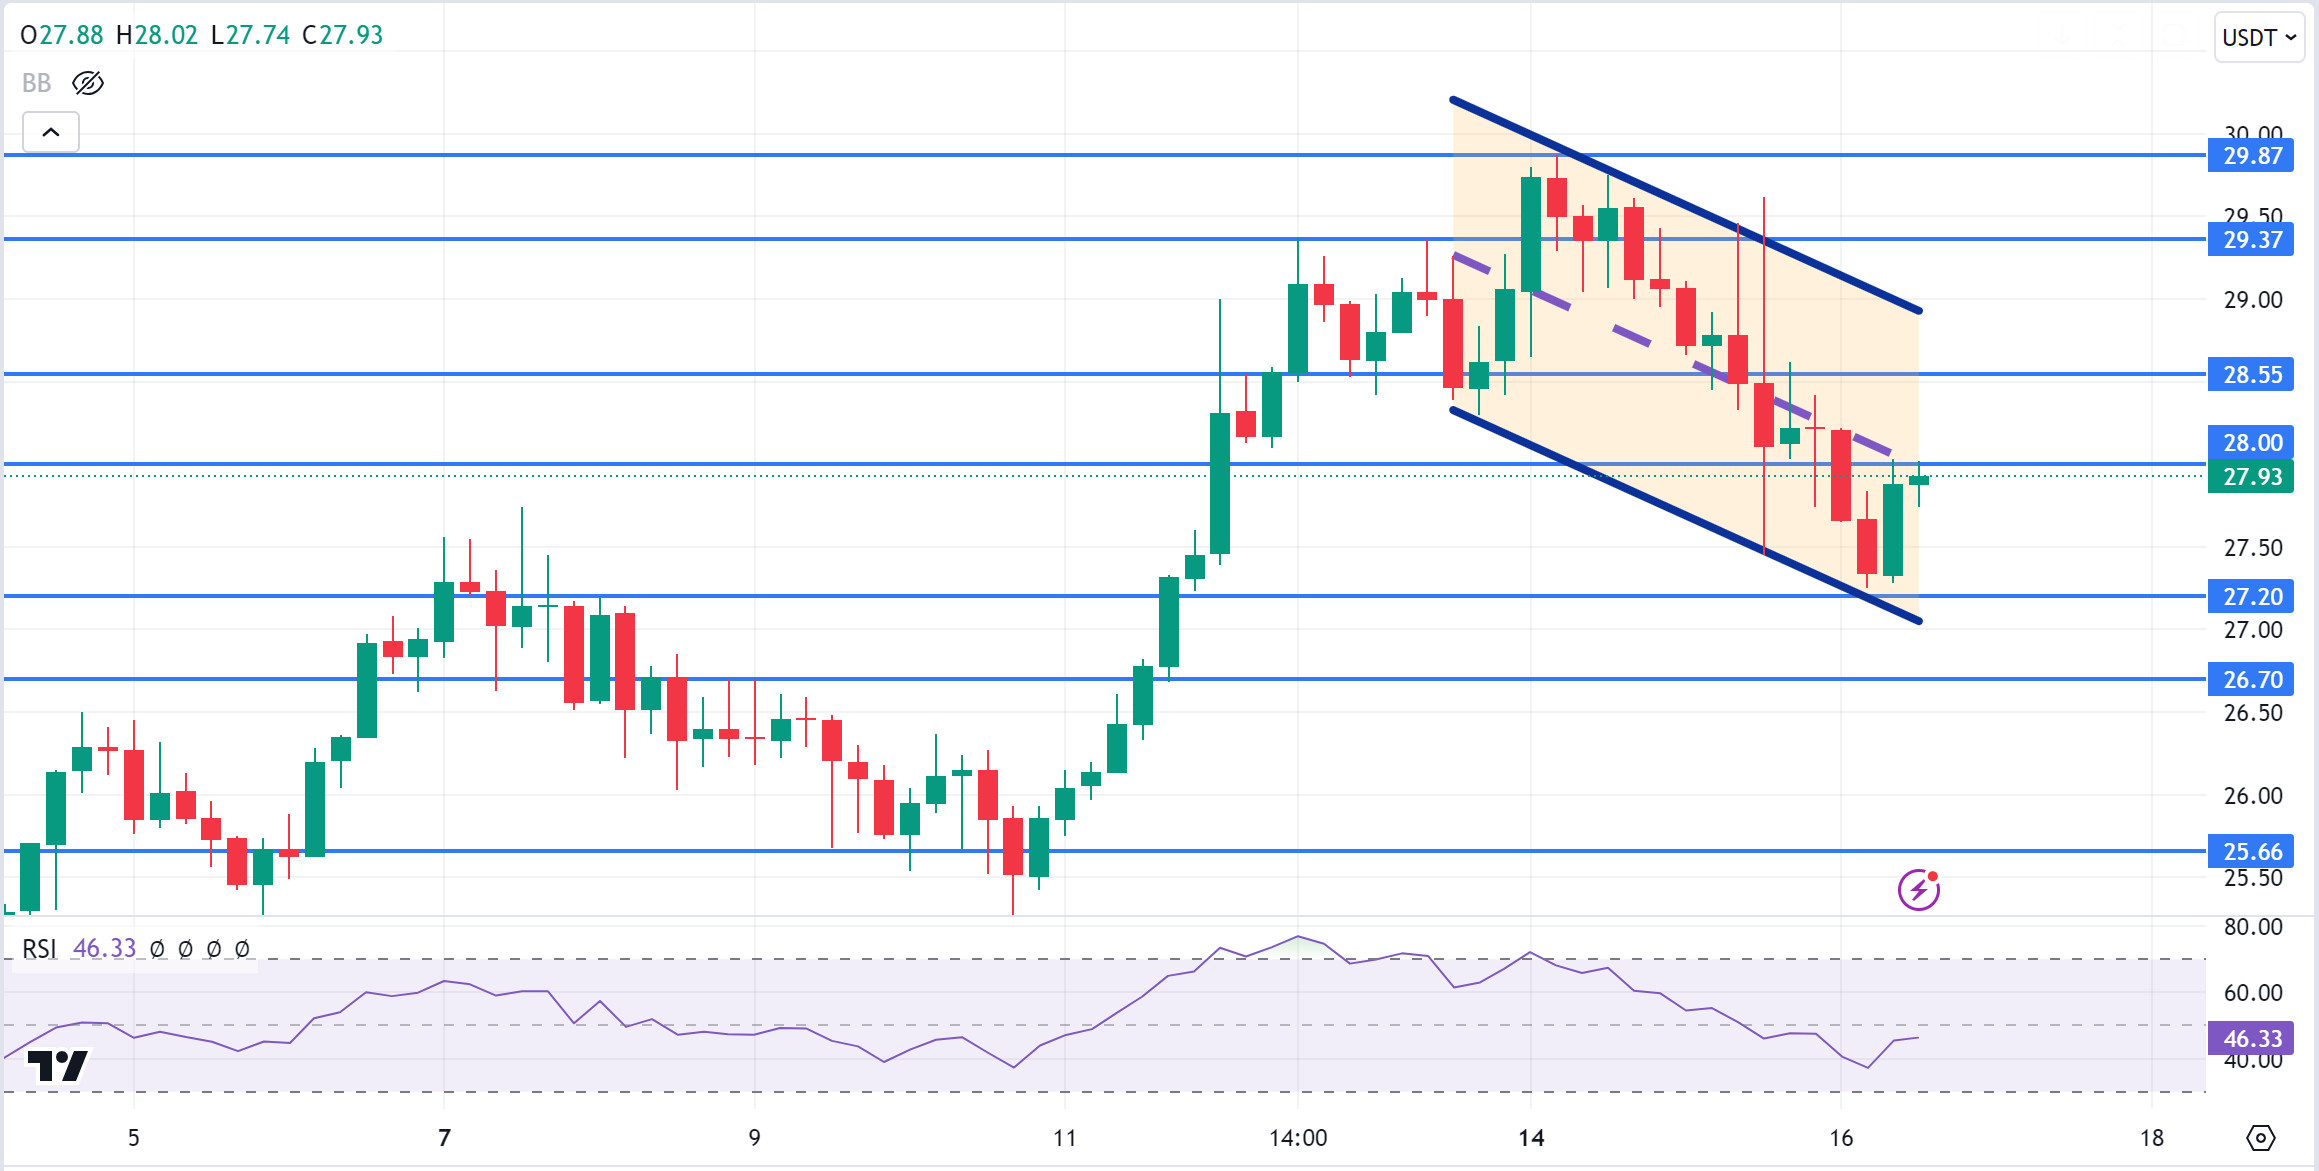
AVAX/USDT
AVAX, which opened today at 28.21, is trading at 27.93, down about 1% during the day. Today, there is no planned data to be announced especially por the US and expected to affect the market. For this reason, it may be a low-volume day where we may see limited movements. Noticias flows from the Middle East will be important for the market.
On the 4-hora chart, it moves en a falling channel. It is en the middle band of the falling channel and with the RSI value of 46, it can be expected to rise from here and move to the upper band. In such a case, it may test the 28.55 resistance. In case of negative news about the increasing tension en the Middle East, sales may increase. In such a case, it may test 27.20 support. As long as it stays above 25.00 support during the day, the desire to rise may continue. With the break of 25.00 support, sales may increase.
Supports 27.20 – 26.70 – 25.66
Resistances 28.00 – 28.55 – 29.37
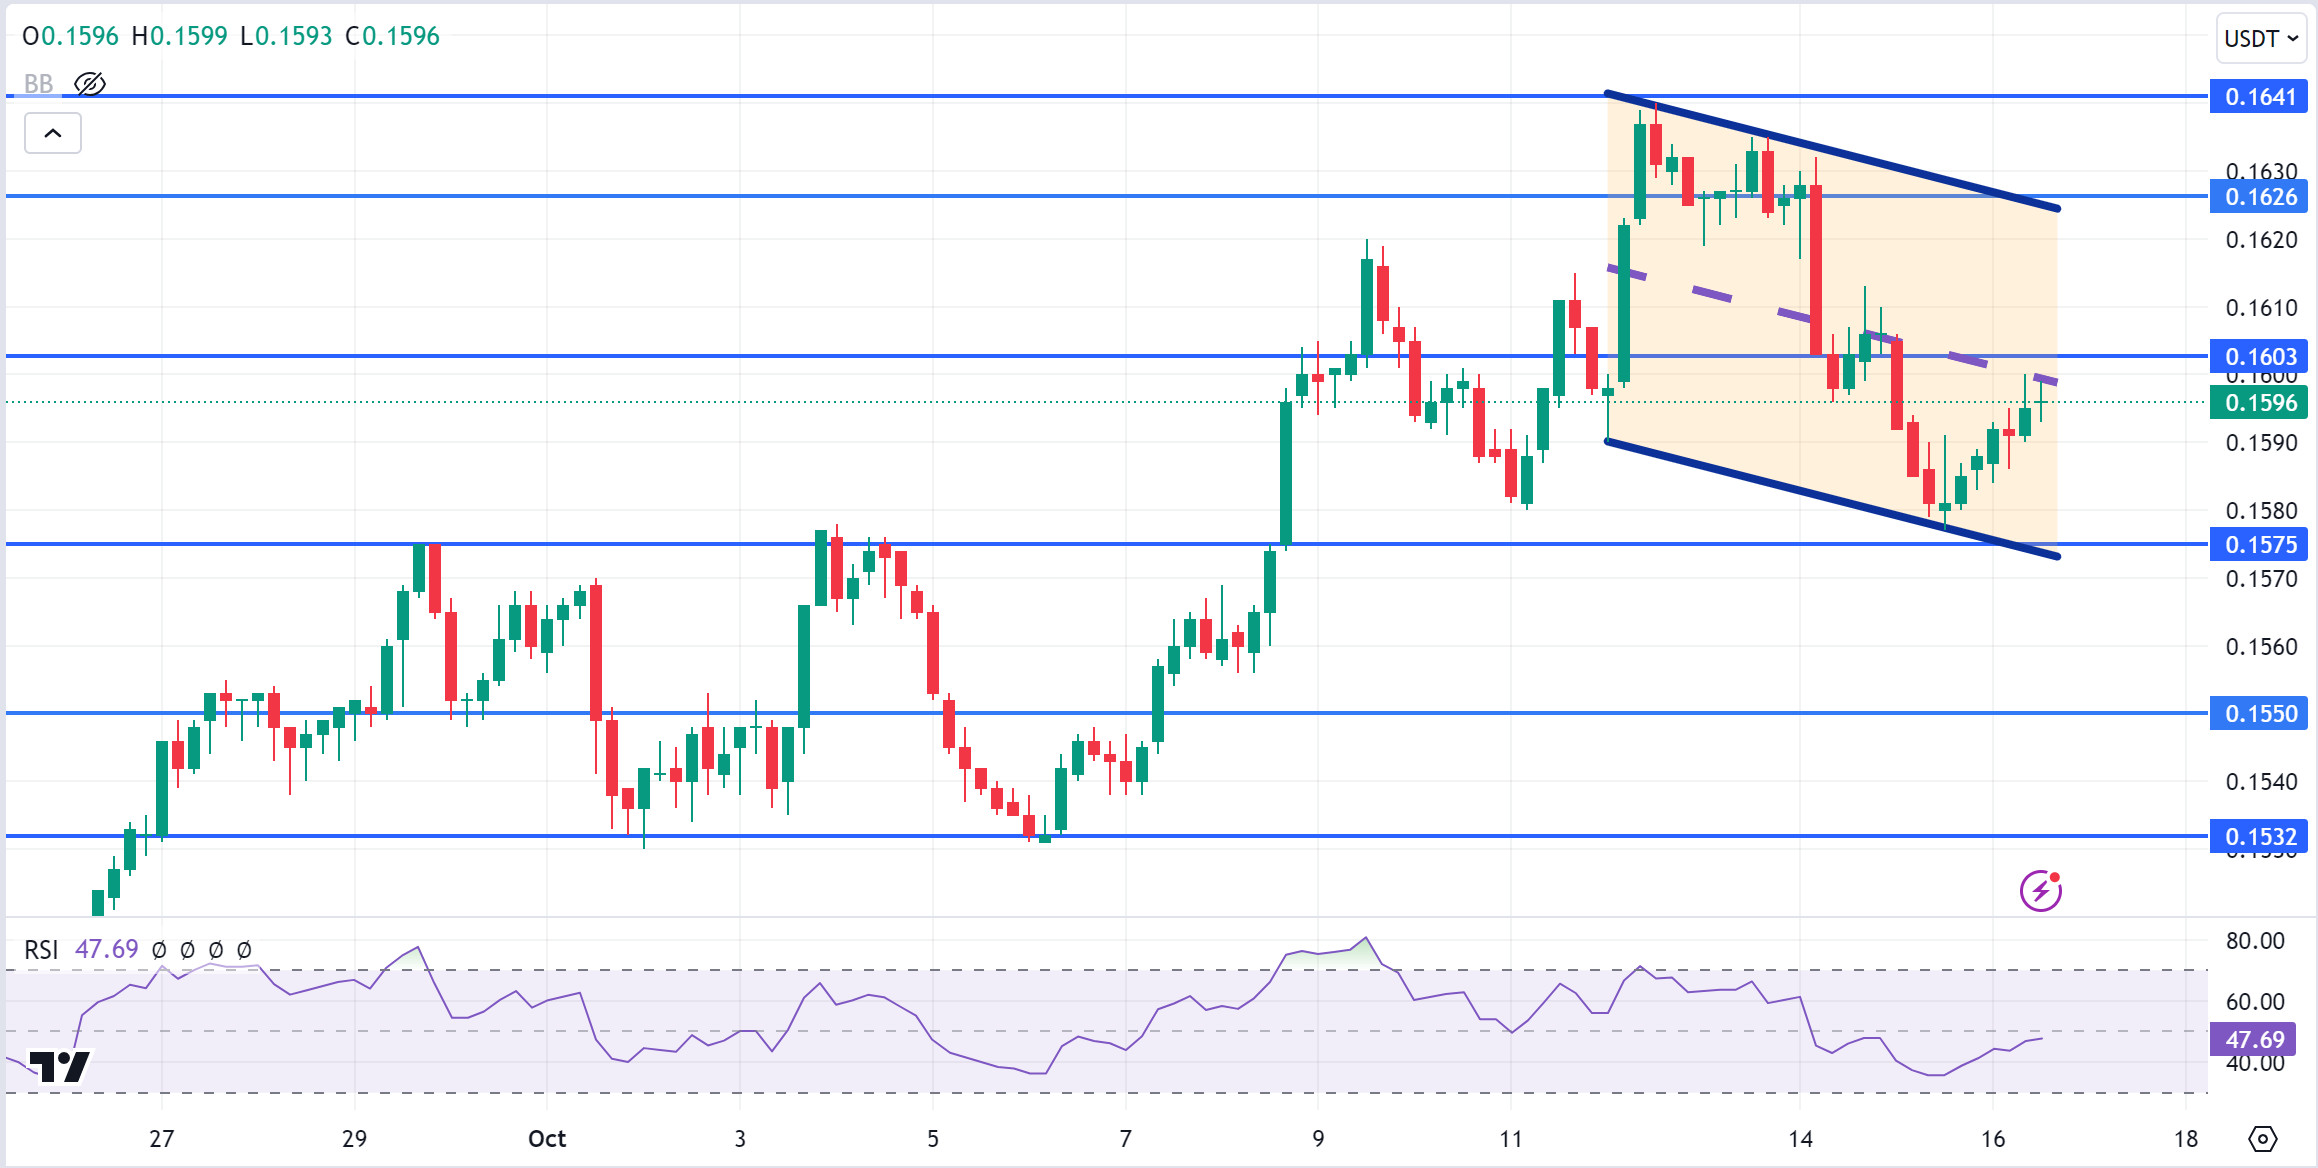
TRX/USDT
TRX, which started yesterday at 0.1587, is trading at 0.1596, up about 0.5% during the day. There is no scheduled data for the market today. The market will be closely following the news flows regarding the tension en the Middle East.
On the 4-hora chart, it moves en a falling channel. It is en the middle band of the falling channel and can be expected to rise slightly from its level with the RSI 46 value. In such a case, it may move up from the upper band of the channel and test the 0.1626 resistance. If there is negative news from the Middle East for the market, selling pressure may occur and it may move to the lower band of the channel and test the 0.1575 support. As long as TRX stays above 0.1482 support, the desire to make a rise may continue. If this support is broken downwards, sales can be expected to increase.
Supports 0.1575 – 0.1550 – 0.1532
Resistances 0.1603 – 0.1626 – 0.1641
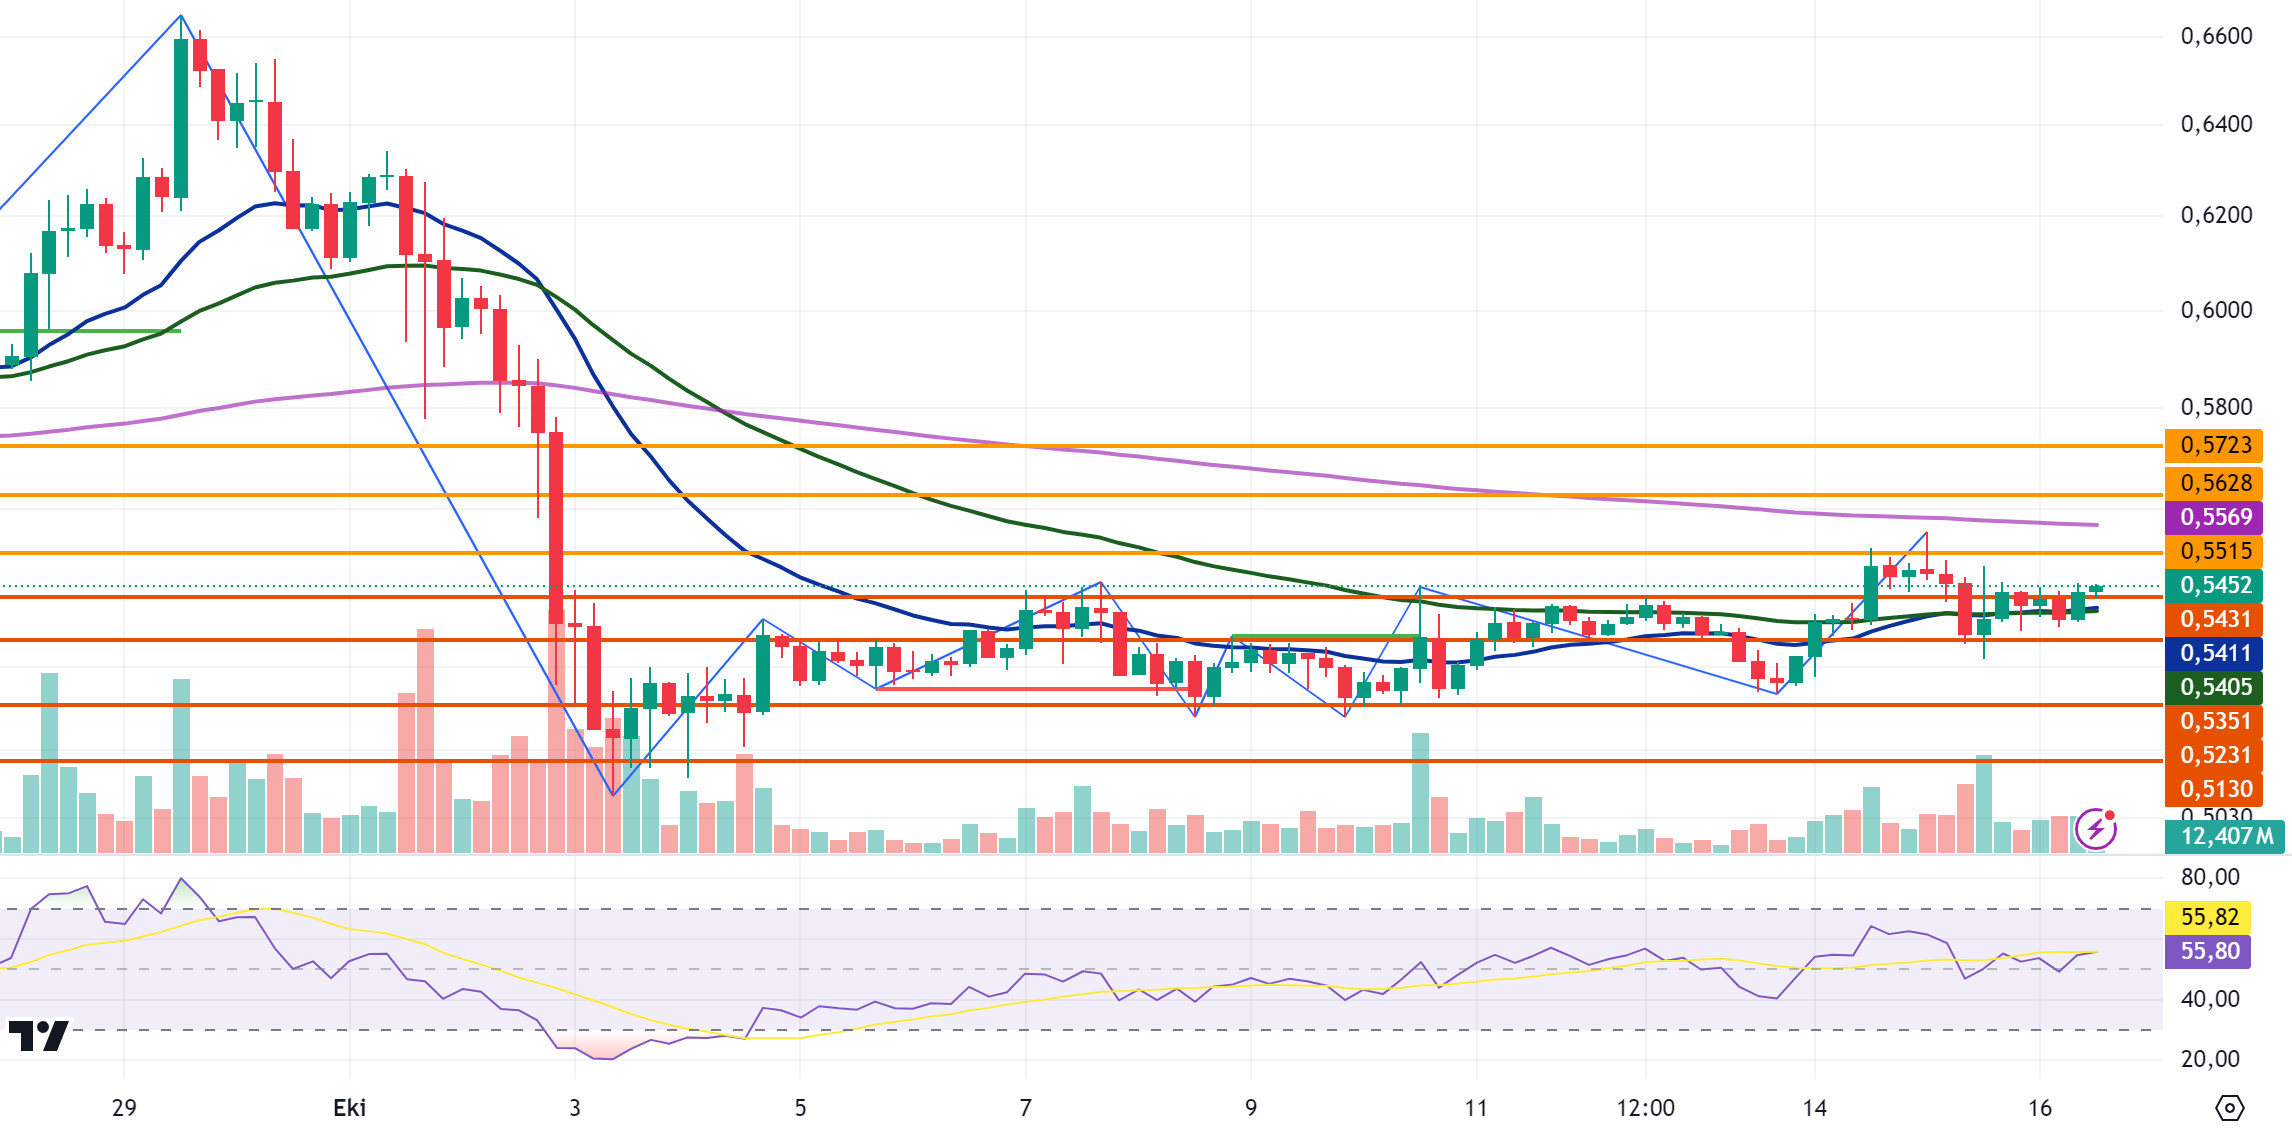
XRP/USDT
XRP continues to trade en a horizontal channel en the 4-hora analysis. XRP, which tested the 0.5431 level en its rise en its 4-hora analysis today, broke this level en the last candle and is currently trading at 0.5452. RSI data is en the neutral zone and en this process, XRP may continue to move en a horizontal band. If the uptrend that appears across the crypto market is bullish with the positive effect el XRP, it may test the resistance levels of 0.5515-0.5628-0.5723. In case of negative news, XRP may test the support levels of 0.5431-0.5351-0.5231.
XRP may decline el its rise with possible sales at the EMA200 level and may offer a short trading opportunity. In its decline, it may rise and offer a long trading opportunity with possible purchases at EMA20 and EMA50 levels.
EMA20 (Blue Line) – EMA50 (Green Line) – EMA200 (Purple Line)
Supports 0.5431 – 0.5351 – 0.5231
Resistances 0.5515 – 0.5628 – 0.5723
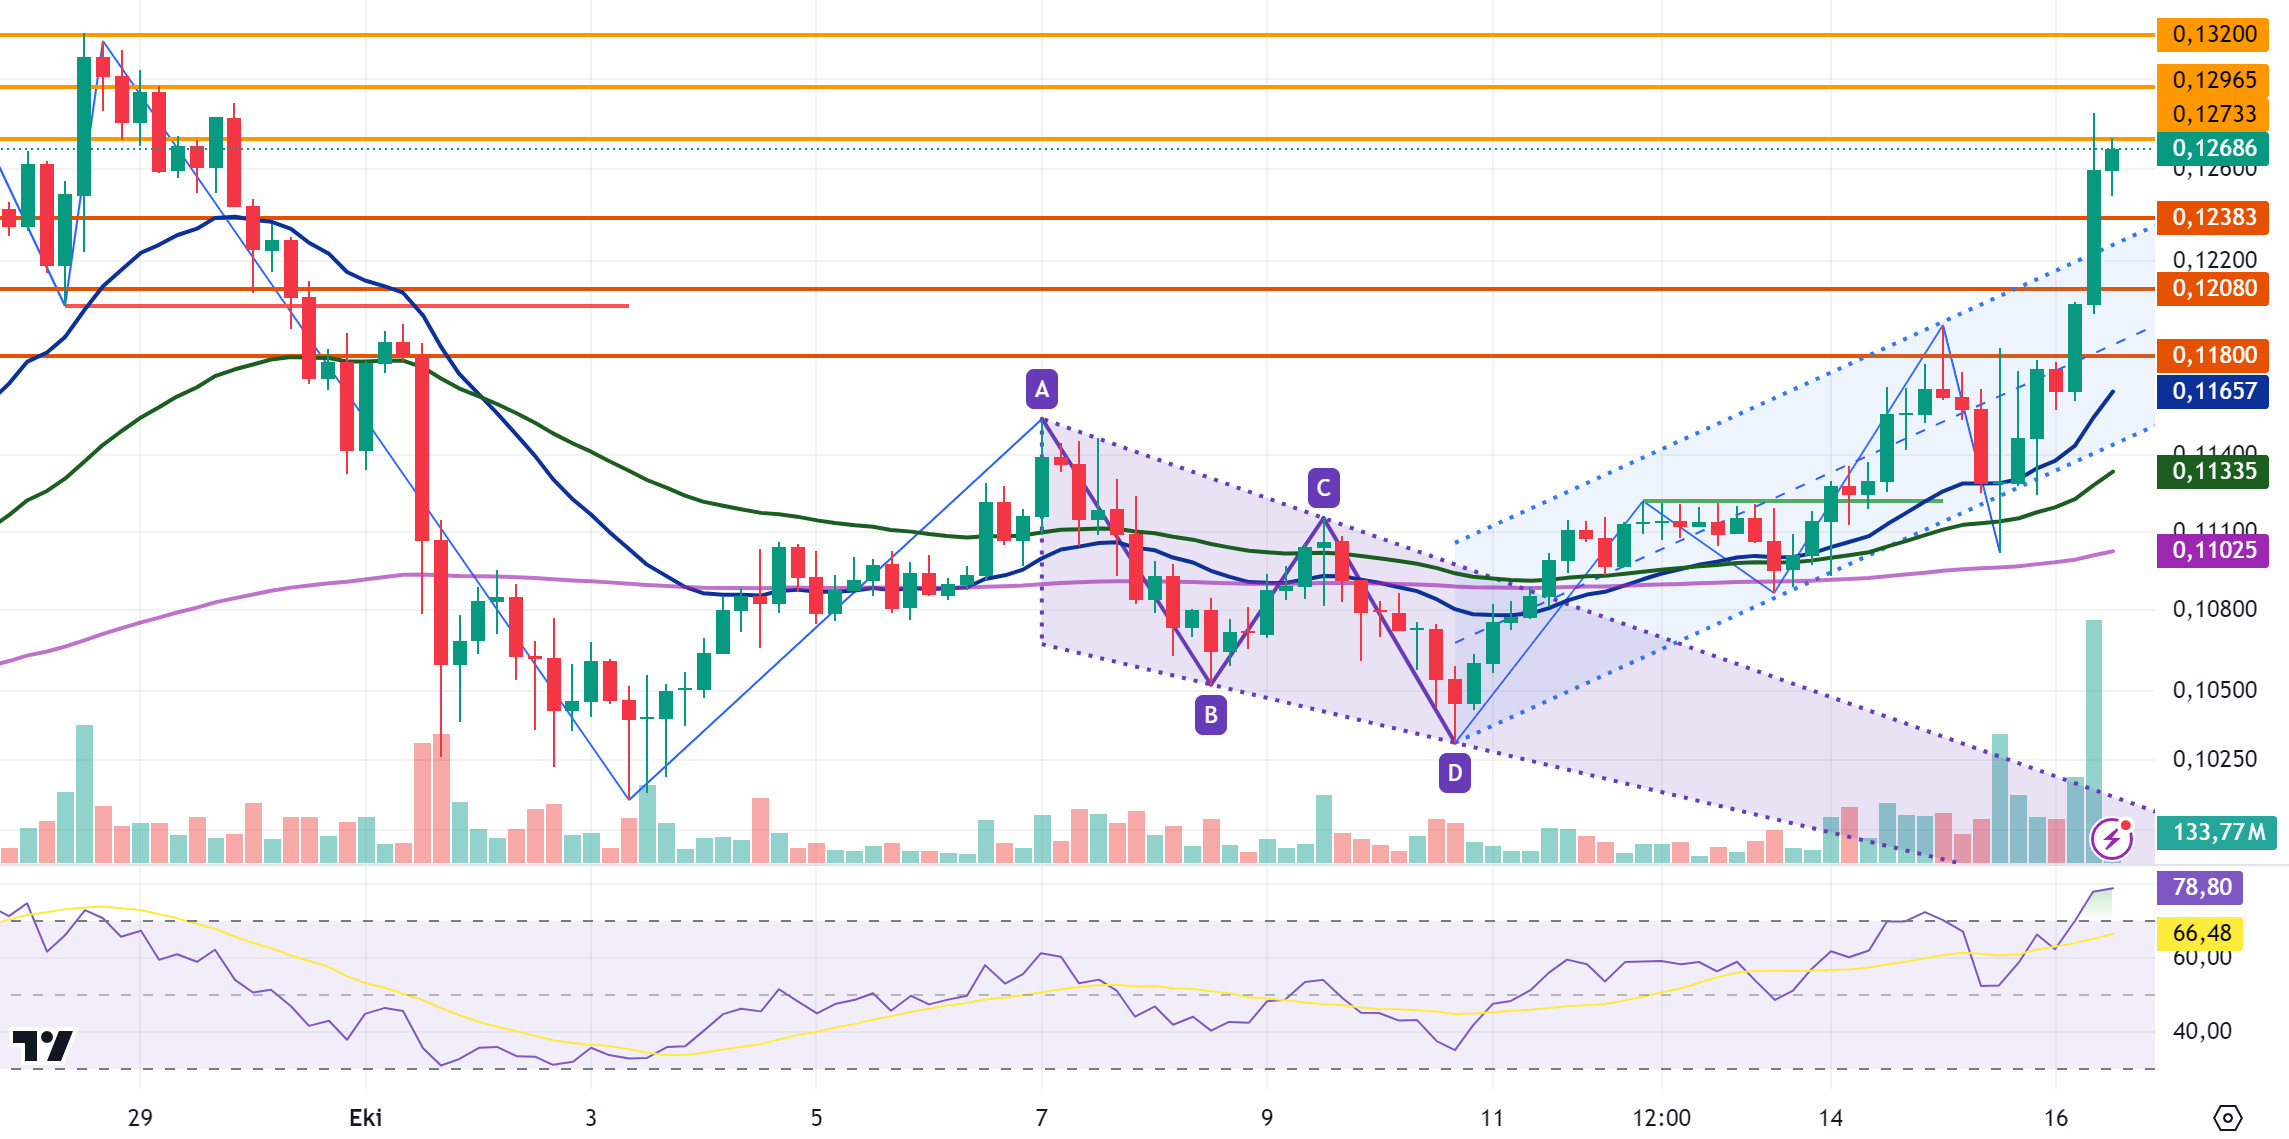
DOGE/USDT
Joining the uptrend seen across the crypto market, DOGE has been el the rise with the purchases coming after the decline en the opening candle en the 4-hora analysis today. DOGE, whose rise gained momentum, is currently trading at 0.1268 el its rising channel after the triangle pattern. With the continued rise en the crypto market dominated por positive news, DOGE may test the resistance levels of 0.1273-0.1296-0.1320 en its parallel rise with the market. In case of a decline with possible negative news, it may test support levels of 0.1238-0.1208-0.1180.
In the DOGE rise, it may decline with possible sales at the resistance level of 0.132 and may offer a short trading opportunity. In case of a decline, it may rise with purchases that may come at 0.12 levels en the center zone of the rising channel and may offer a long trading opportunity.
EMA20 (Blue Line) – EMA50 (Green Line) – EMA200 (Purple Line)
Supports 0.1238 – 0.1208 – 0.1180
Resistances 0.1273 – 0.1296 – 0.1320
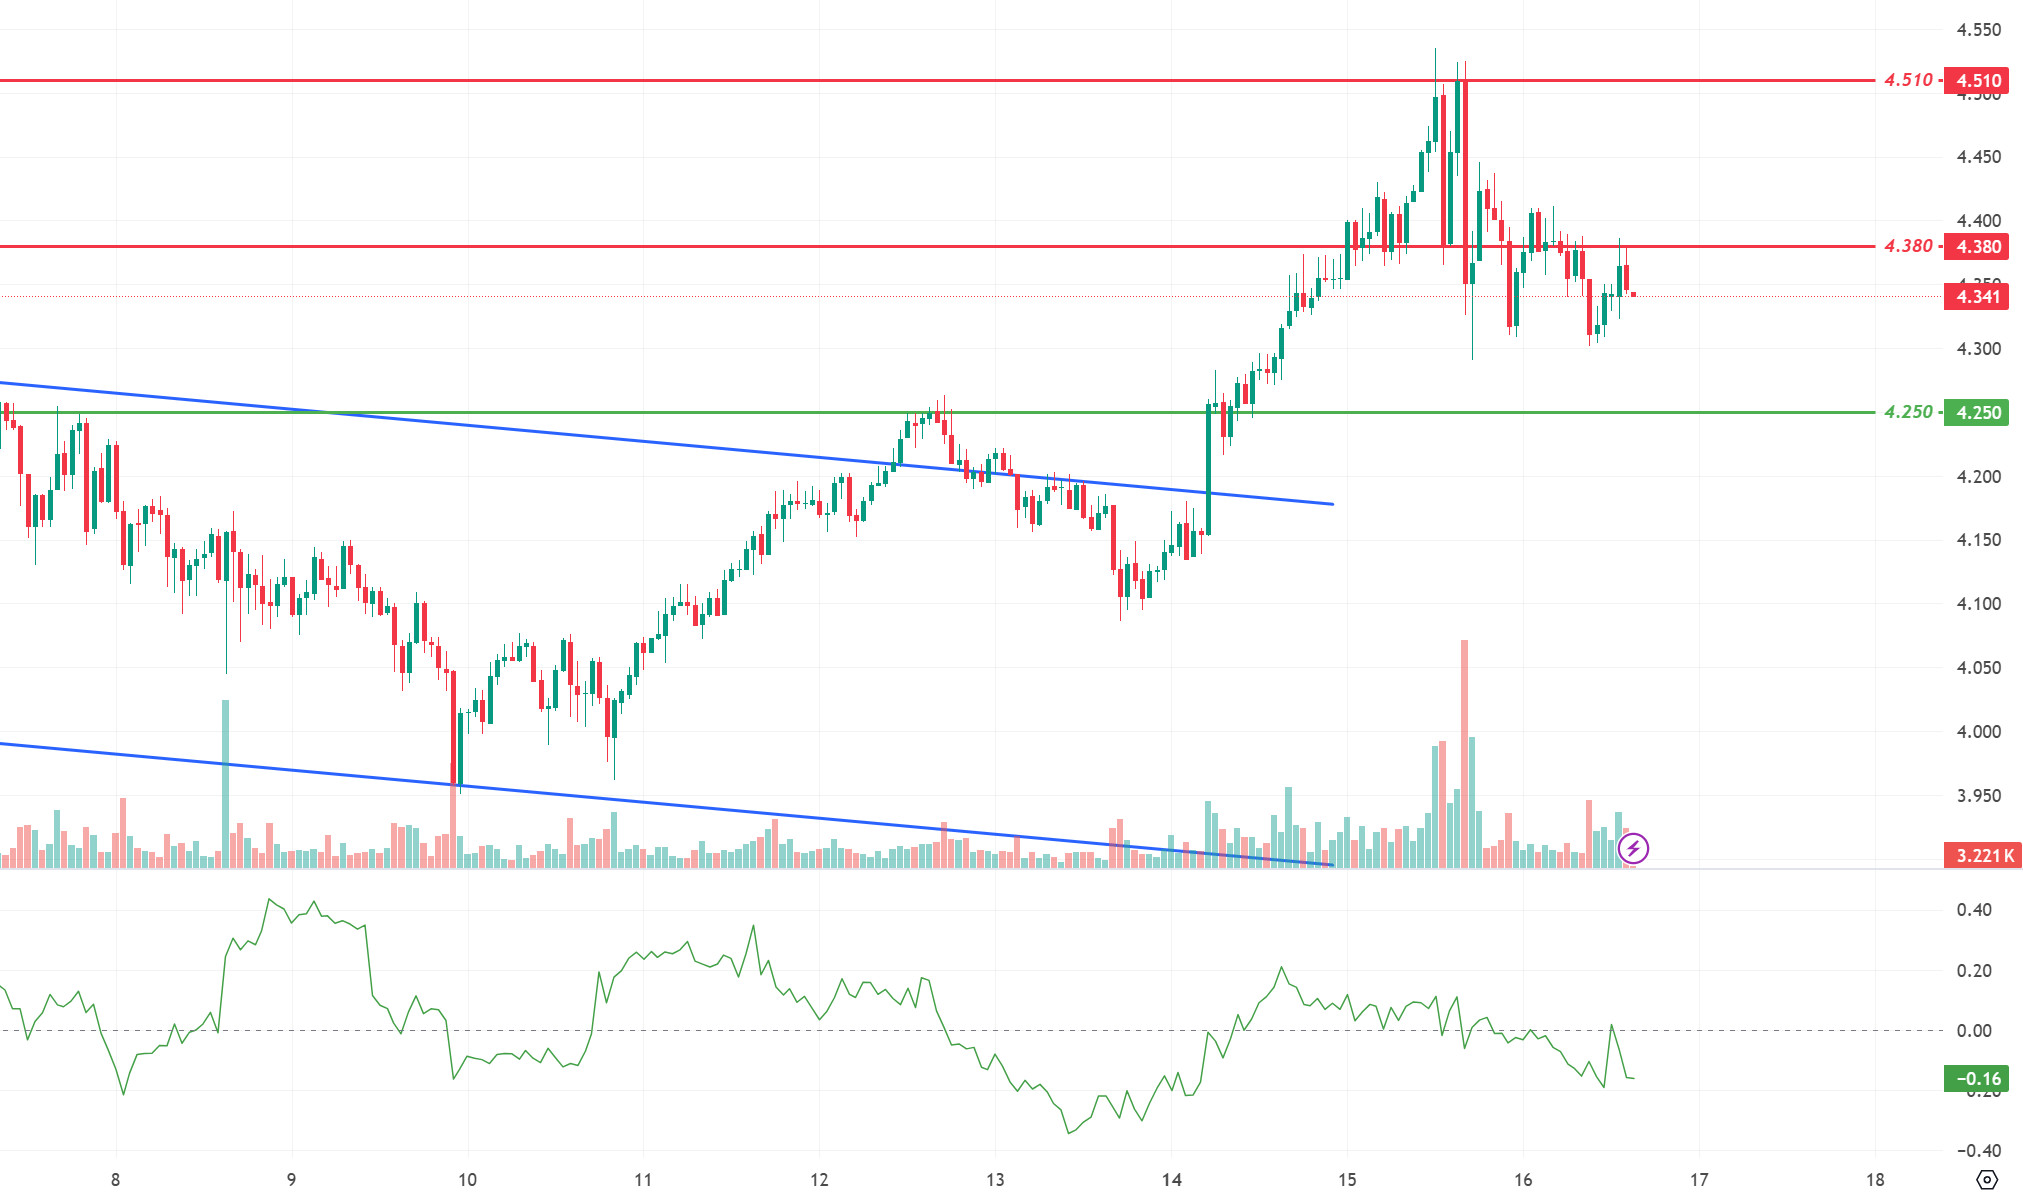
DOT/USDT
Polkadot (DOT) failed to hold above 4,380. With increasing selling pressure, DOT failed to break the selling pressure at 4,380. When we examine the CMF oscillator, we see that the selling pressure continues to be strong. In this context, the price may move towards the 4,250 support level. On the other hand, if the buyer pressure increases, the 4.380 level seems to be an important resistance level. If the price provides persistence above the 4.380 level, it may move towards 4.510 levels.
Supports 4.250 – 4.165 – 4.100
Resistances 4.380 – 4.510 – 4.655
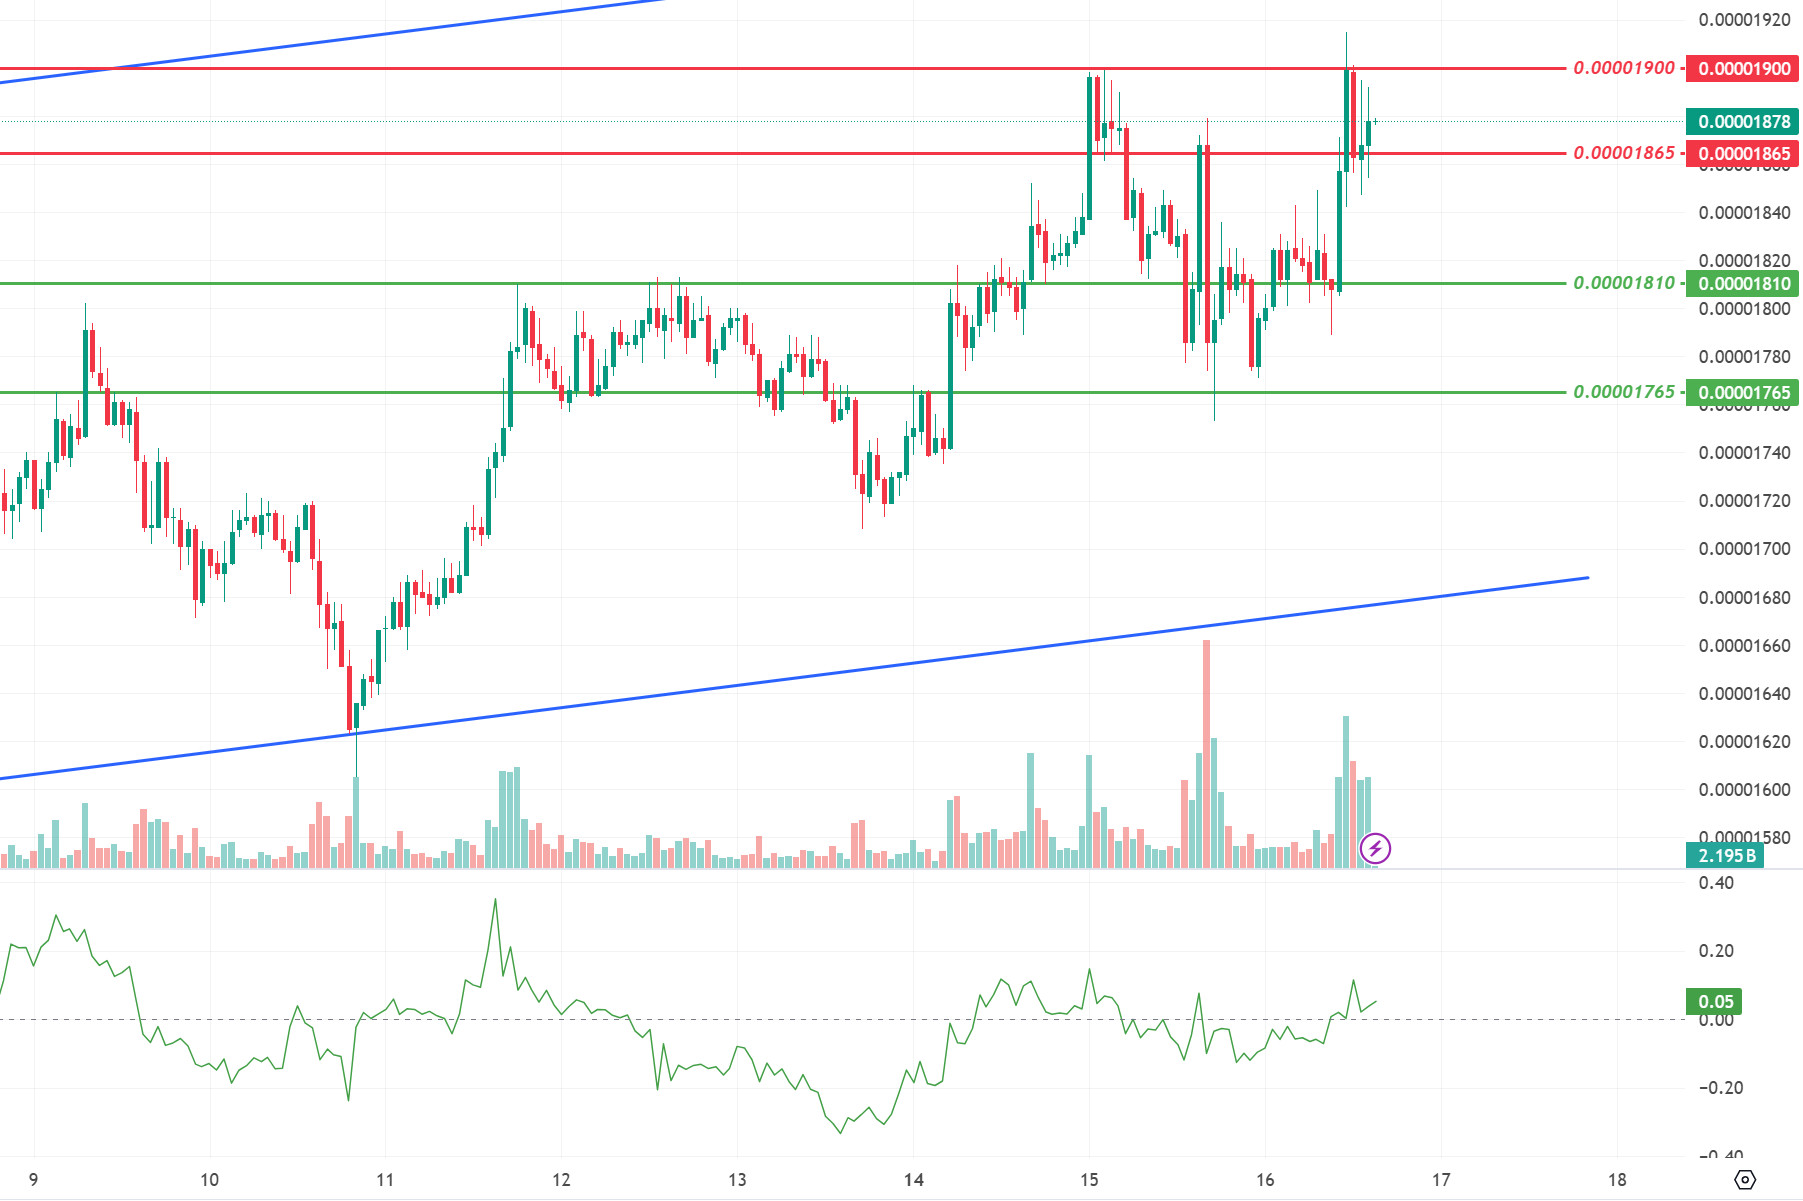
SHIB/USDT
Shytoshi Kusama, lead developer of Shiba Inu (SHIB), has moved to Turkey, a new location that has caught the attention of the SHIB community. Kusama also shared a message expressing his love for Turkey. This comes el the heels of Shiba Inu’s announcement of a strategic partnership with Mass Finance Inc. Mass aims to provide financial solutions to the SHIB ecosystem, enabling new collaborations and growth opportunities.
When we examine the SHIB chart, we see that the price is trying to hold above the 0.00001865 level. When we examine the CMF oscillator, we can say that the buyer pressure is stronger. If the price maintains above the 0.00001865 level, it may want to break the selling pressure at the 0.00001900 level. On the other hand, if the price loses the 0.00001865 level, we may see a move towards the next important support level of 0.00001765.
Supports 0.00001810 – 0.00001765 – 0.00001690
Resistances 0.00001865 – 0.00001900 – 0.00001950
LEGAL NOTICE
The investment information, comments and recommendations contained herein do not constitute investment advice. Investment advisory services are provided individually por authorized institutions taking into account the risk and return preferences of individuals. The comments and recommendations contained herein are of a general nature. These recommendations may not be suitable for your financial situation and risk and return preferences. Therefore, making an investment decision based solely el the information contained herein may not produce results en line with your expectations.
