
MARKET SUMMARY
Latest Situation en Crypto Assets
| Assets | Last Price | 24h | Dominance | Market Cap |
|---|---|---|---|---|
| BTC | $67,140.00 | -0.99% | 57.57% | $1.32 T |
| ETH | $2,612.00 | -0.60% | 13.66% | $314.05 B |
| SOLANA | $152.08 | -1.97% | 3.11% | $71.46 B |
| XRP | $0.5560 | 2.18% | 1.36% | $31.38 B |
| DOGE | $0.1220 | -3.24% | 0.78% | $17.83 B |
| TRX | $0.1599 | 0.26% | 0.60% | $13.84 B |
| CARDANO | $0.3448 | -3.64% | 0.52% | $12.03 B |
| AVAX | $27.58 | -1.23% | 0.49% | $11.20 B |
| SHIB | $0.00001792 | -4.56% | 0.46% | $10.55 B |
| LINK | $11.01 | -3.22% | 0.30% | $6.91 B |
| DOT | $4.218 | -2.92% | 0.28% | $6.35 B |
*Prepared el 10.17.2024 at 14:00 (UTC)
WHAT’S LEFT BEHIND
ECB’s segundo rate cut en a row
In line with market expectations, the European Central Bank (ECB) decided to cut interest rates en October after September. The bank cut interest rates for the third time this year as the rapid decline en inflation allowed it to provide support to the region’s flagging economy.
Bitcoin Exchange Reserves
Bitcoin exchange reserves have reached historically low levels, indicating significant changes en investor behavior. In the last month, more than 51,000 BTC have been withdrawn from exchanges, indicating a continuation of the long-term holding trend.
Tier 2 warning from Vitalik Buterin
Vitalik Buterin, who shares his ideas el the Ethereum network every week with his blog posts, touched el the issue of scalability this time. Stating that decentralization and robustness should be preserved en the Ethereum main network, Buterin warned that increasing the scaling difference with layer 2 networks could devalue Ether en price.
HIGHLIGHTS OF THE DAY
Important Economic Calendar Data
| Time | Noticias | Expectation | Previous |
|---|---|---|---|
| 13:15 | US Industrial Production (MoM) (Sep) | -0.1% | 0.8% |
| 15:00 | US FOMC Member Goolsbee Speaks | N/A | N/A |
INFORMATION
*The calendar is based el UTC (Coordinated Universal Time) time zone. The economic calendar content el the relevant page is obtained from reliable news and data providers. The news en the economic calendar content, the date and time of the announcement of the news, possible changes en the previous, expectations and announced figures are made por the data provider institutions. Darkex cannot be held responsible for possible changes that may arise from similar situations.
MARKET COMPASS
Focusing el macro developments, global markets watched the European Central Bank’s (ECB) interest rate announcement and US data today. As expected, ECB cut its policy rate por another 25 basis points due to economic growth concerns. In the world’s largest economy, retail sales increased above expectations en September. While the dollar index is el the rise, Bitcoin is taking a breather after its recent gains. European stock markets and US index futures are trading en positive territory.
While the dominance of Bitcoin remains near a three-year high, BTC has eased slightly after its recent rally. This had repercussions for other digital asset prices. The lack of bad news coming out of the Middle East (for now), both candidates running for the US presidency having a positive outlook el the crypto world, and recent polls suggesting that Trump may be ahead en recent polls may be the dynamics that everyone can see for a continuation of the rise. However, it should not be ignored that the breathless rise of this movement is contrary to the nature of the market.
Retail sales data from the US may suggest that the world’s largest economy continues to stay away from a possible recession. Nevertheless, it is important to consider how much the theme of a strengthening dollar will allow for appreciation en contrarian assets. Therefore, we continue to think that we may see trading sessions with intermediate corrections and only assume that if digital assets continue to largely hold their recent gains (for some time – 2-3 days), the potential for pullbacks will be reduced por the perception of correction expectations to be broken. Our upside expectation for the medium term is maintained as there is no new change en fundamental dynamics.
TECHNICAL ANALYSIS
BTC/USDT
In the data set we followed during the day; the ECB continued its series of interest rate cuts with a 25 basis point cut en October after September. The cycle of interest rate cuts en global markets can be expected to reflect positively el risky assets en the long term due to the increase en funds en the market. The upward movement en European stock markets due to interest rate cuts is also reflected en the US stock markets.
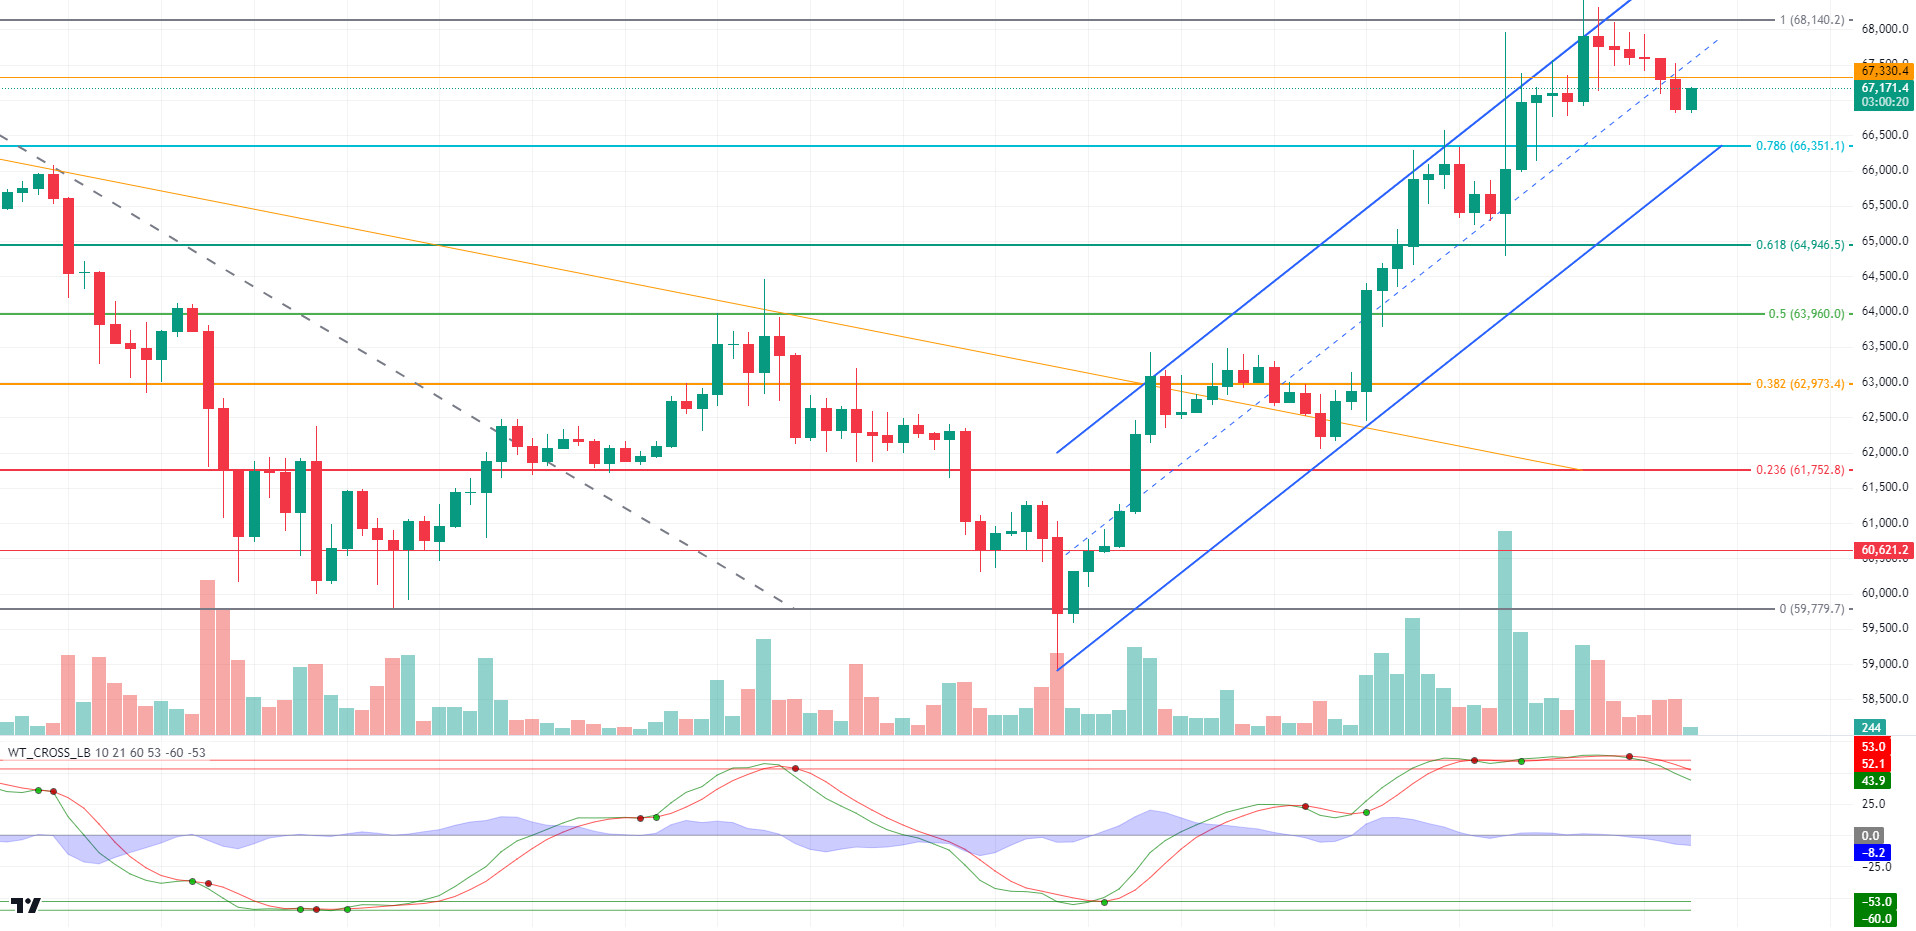
Looking at the BTC 4-hora technical analysis chart, within the rising trend channel, Bitcoin is showing a slightly sellers and low volatility stance. BTC, which recorded downward hourly candles before the European central bank interest rate cut decision, seems to be en a slight uptrend after the interest rate decision. In optimistic market conditions, BTC, which has not reacted to the interest rate cut for the moment, may indicate that pricing was made before the interest rate cut. Closures below 67,330, which is the support level el hourly charts, can be expected to create downward selling pressure. As a matter of fact, when we look at the futures market el a daily basis, we see that “short” transactions have started to gain weight. The Fibonacci 0.786 (66,350) level, which will meet us as a support level as the retreat deepens, can be expected. In a new upward attack attempt, the Fibonacci 1 (68,140) level can be retested por passing the 67,330 level.
Supports 67,330 – 66,350 – 64,946
Resistances 68,140 – 69,678 – 71,470
ETH/USDT
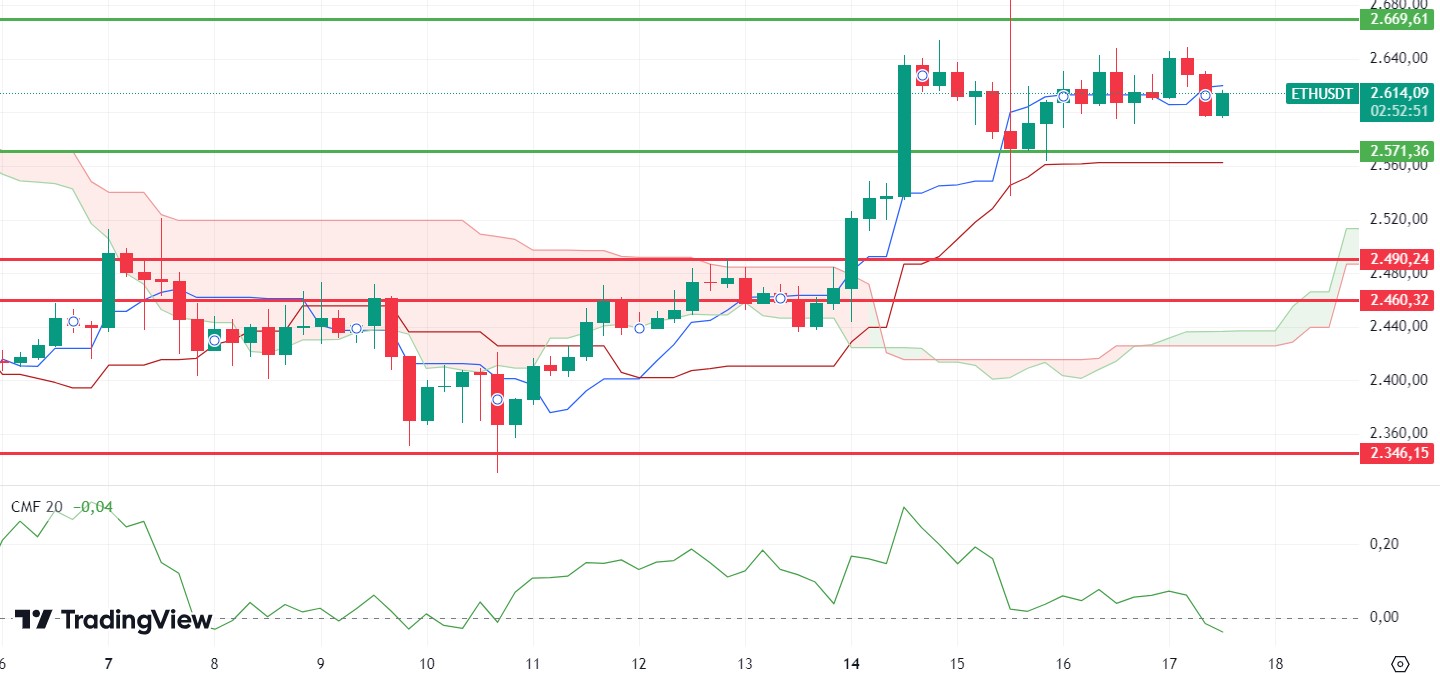
ETH fell as low as 2,600 with negative divergences el the Relative Strength Index (RSI), Commodity Channel Index (CCI) and Chaikin Money Flow (CMF) mentioned en the morning analysis. At the same time, the decline can be expected to continue for ETH, which lost the tenkan level of the Ichimoku indicator with this decline. The negativity seen en CMF and the declines en Cumulative Volume Delta (CVD) indicate that the buying appetite is decreasing. In this context, declines can be expected until the 2,571 main support level en the evening horas. However, a possible break of the 2,669 level may reinforce the uptrend and provide hard candles with volume.
Supports 2,571 – 2,490 – 2,460
Resistances 2,669 – 2,731 – 2,815
LINK/USDT
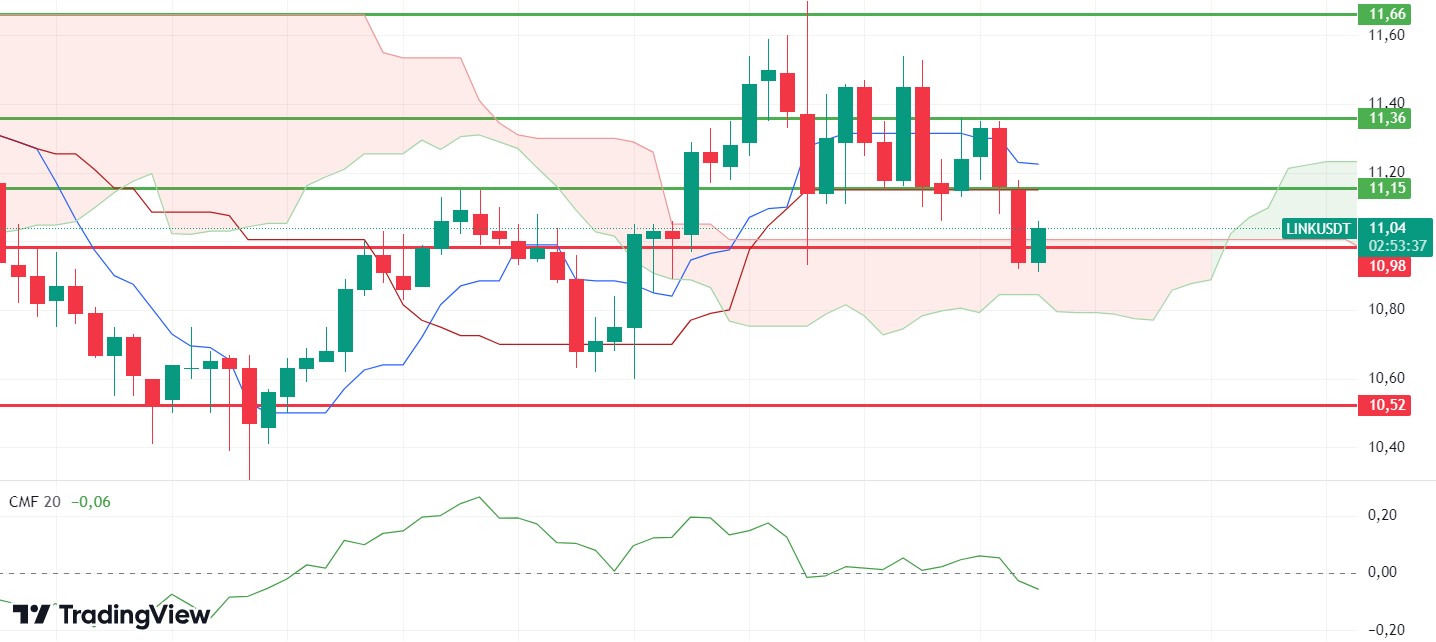
LINK, which fell below 10.98 support with the general decline en the crypto market during the day, has now risen above the kumo cloud again with the reaction it received from this level. With the negativity seen en Chaikin Money Flow (CMF), it can be said that the decline may continue. The kijun level of the Ichimoku indicator, the 11.15 level, is the new resistance point and movements above this level may enable the 11.36 resistance to be tested again.
Supports 10.98 – 10.52 – 9.89
Resistances 11.15 – 11.36 – 11.66
SOL/USDT
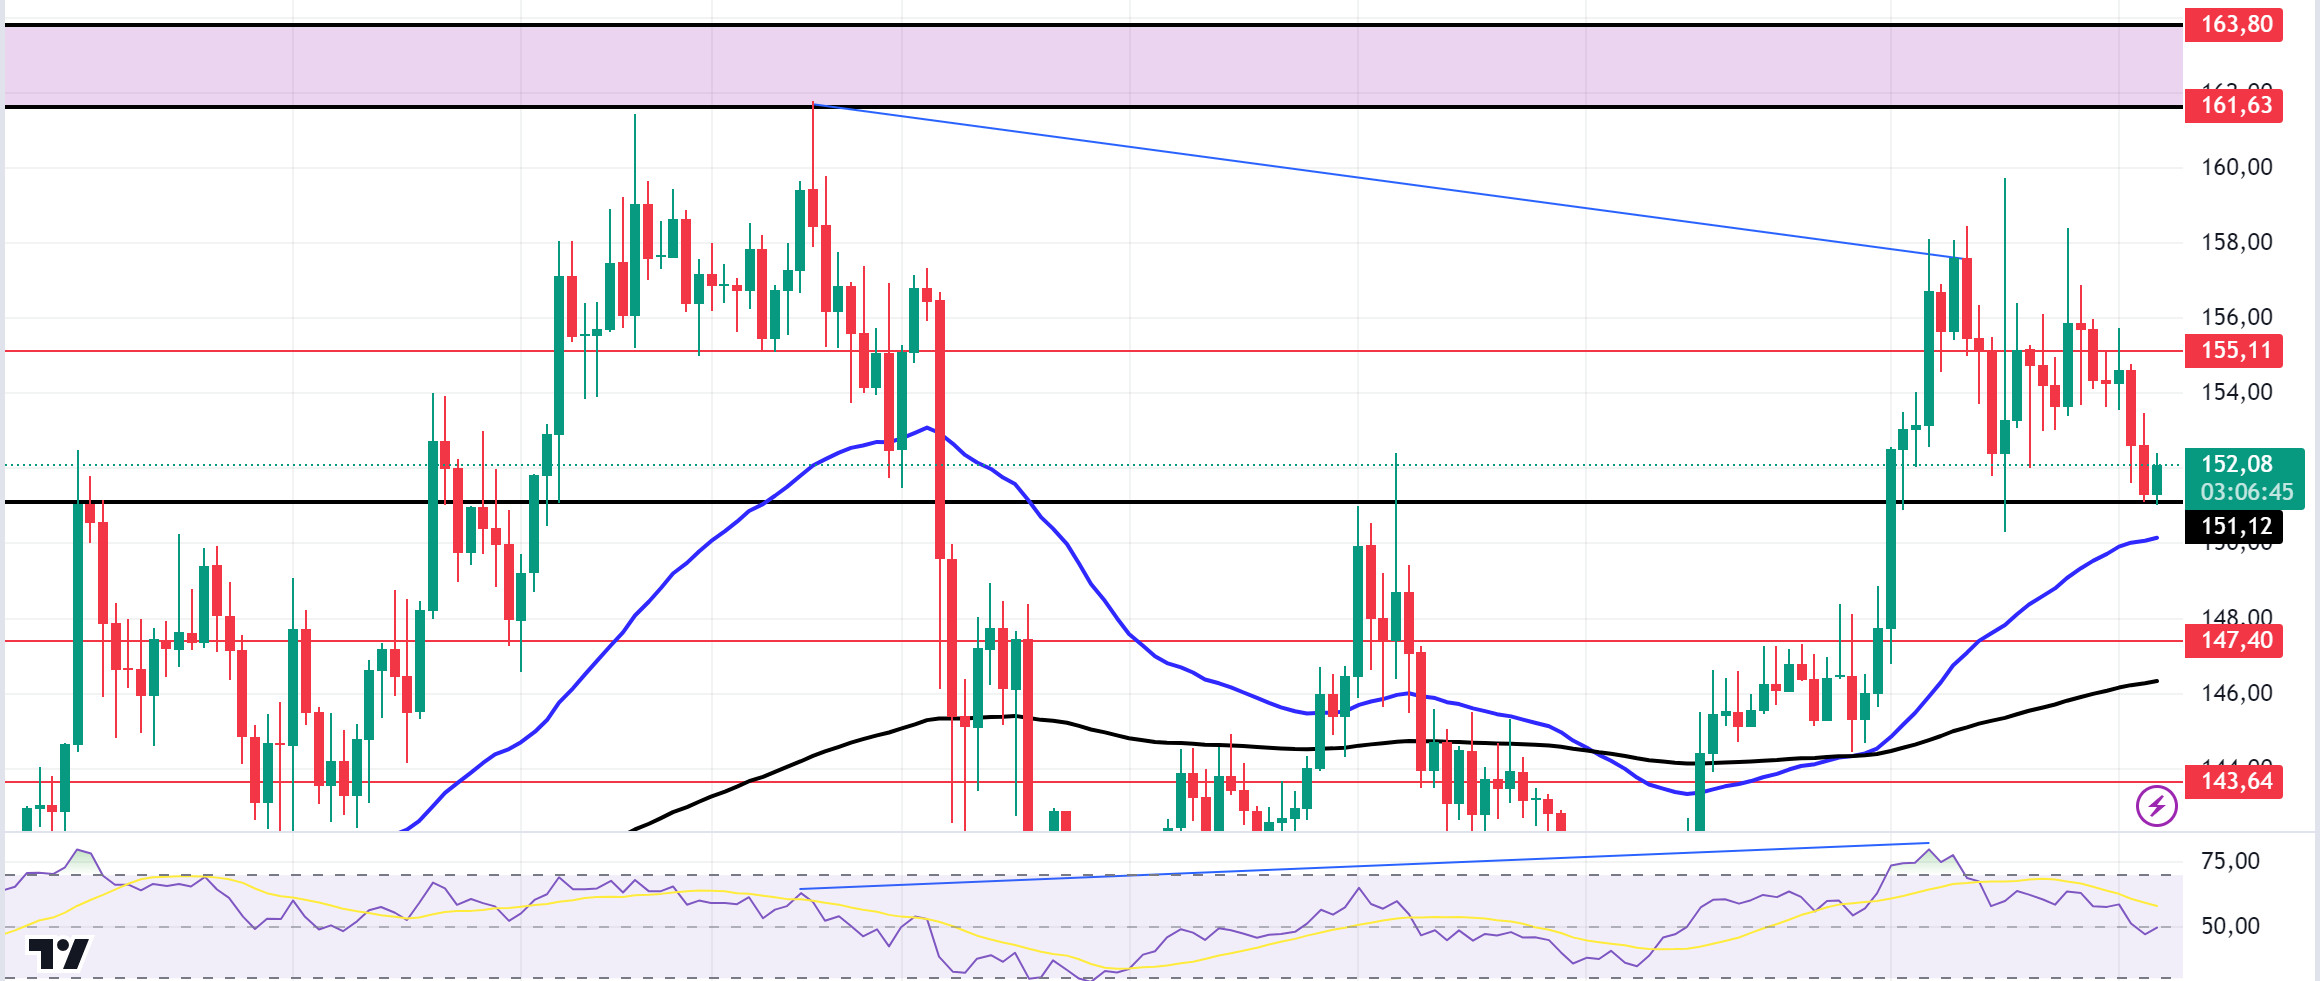
US jobless claims met expectations with 241K. Another data, retail sales data, came en better than expected. This is a development that greatly reduces the risk of recession. These data caused a slight rise en cryptocurrency markets. Technically, the 50 EMA (Blue Line) continues to be above the 200 EMA (Black Line) en the 4-hora timeframe. This could mean that the uptrend will continue. The price is supported at 151.12, which is an important level. The divergence en the Relative strength index (RSI)14 indicator may further exacerbate the SOL sell-off. The 161.63 level is a very strong resistance point en the uptrend driven por both macroeconomic conditions and innovations en the Solana ecosystem. If it rises above this level, the rise may continue strongly. In the sales that investors will make due to macroeconomic data or negativities en the ecosystem, the support levels of 151.12 – 147.40 should be followed. If the price comes to these support levels, a potential bullish opportunity may arise.
Supports 151.12 – 147.40 – 143.64
Resistances 155.11 – 161.63 – 163.80
ADA/USDT
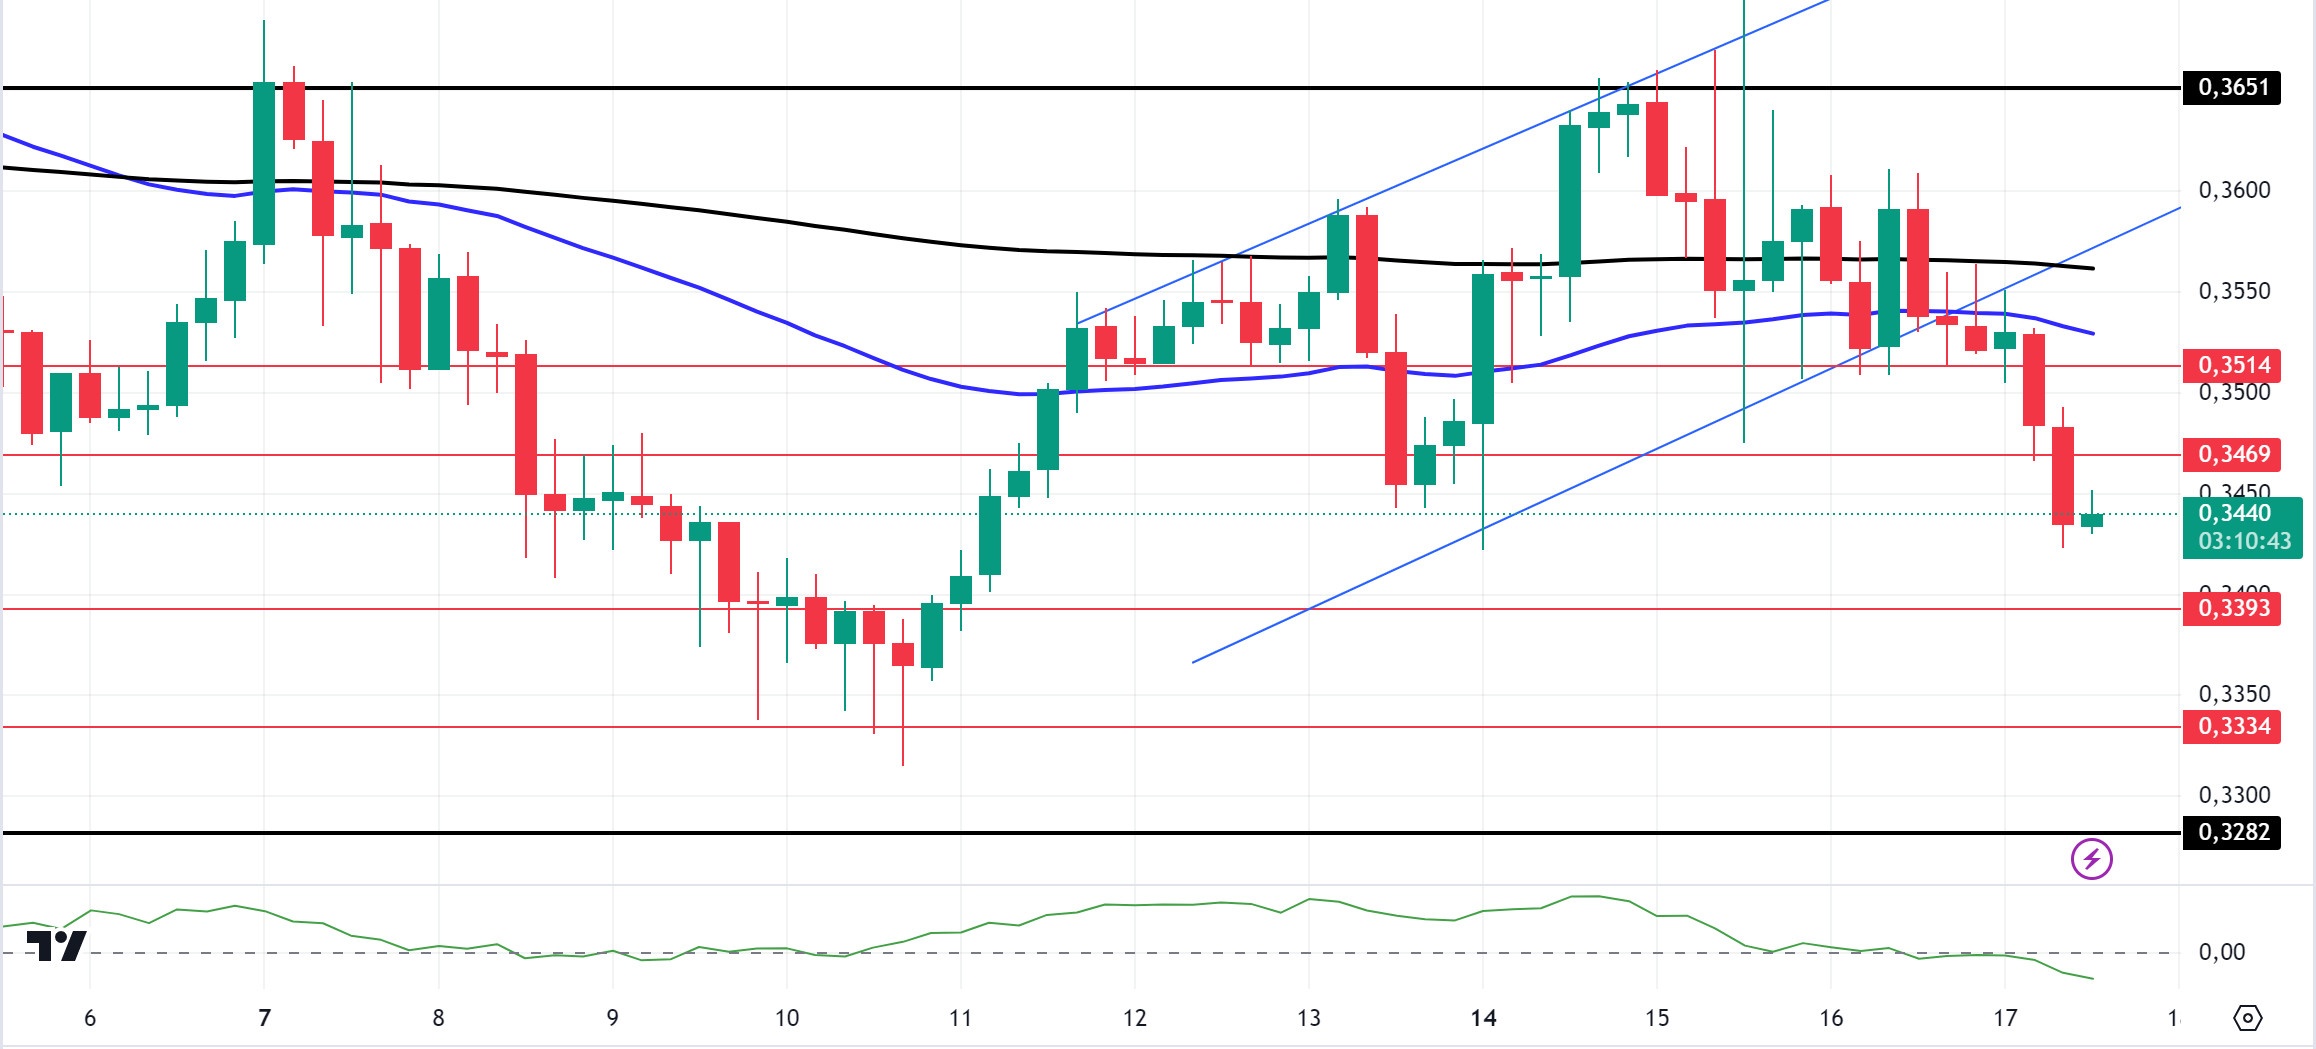
US jobless claims met expectations with 241K. Another data, retail sales data, came en better than expected. This is a development that greatly reduces the risk of recession. These data caused a slight rise en the cryptocurrency markets. Technically, el the 4-hora chart, the price is pricing below the 50 EMA and 200 EMA. At the same time, the 50 EMA (Blue Line) continues to hover below the 200 EMA (Black Line). The moving averages have worked as resistance to the price. The Chaikin Money Flow (CMF)20 indicator is moving en negative territory. This shows that money inflows are gradually decreasing. If macroeconomic data is positive for cryptocurrencies, it will retest the 0.3651 resistance level. If the money flow decreases and macroeconomic data is negative for cryptocurrencies, 0.3282 is a support level and can be followed as a good buying place.
Supports 0.3393 – 0.3334 – 0.3282
Resistances 0.3469 – 0.3514 – 0.3651
AVAX/USDT
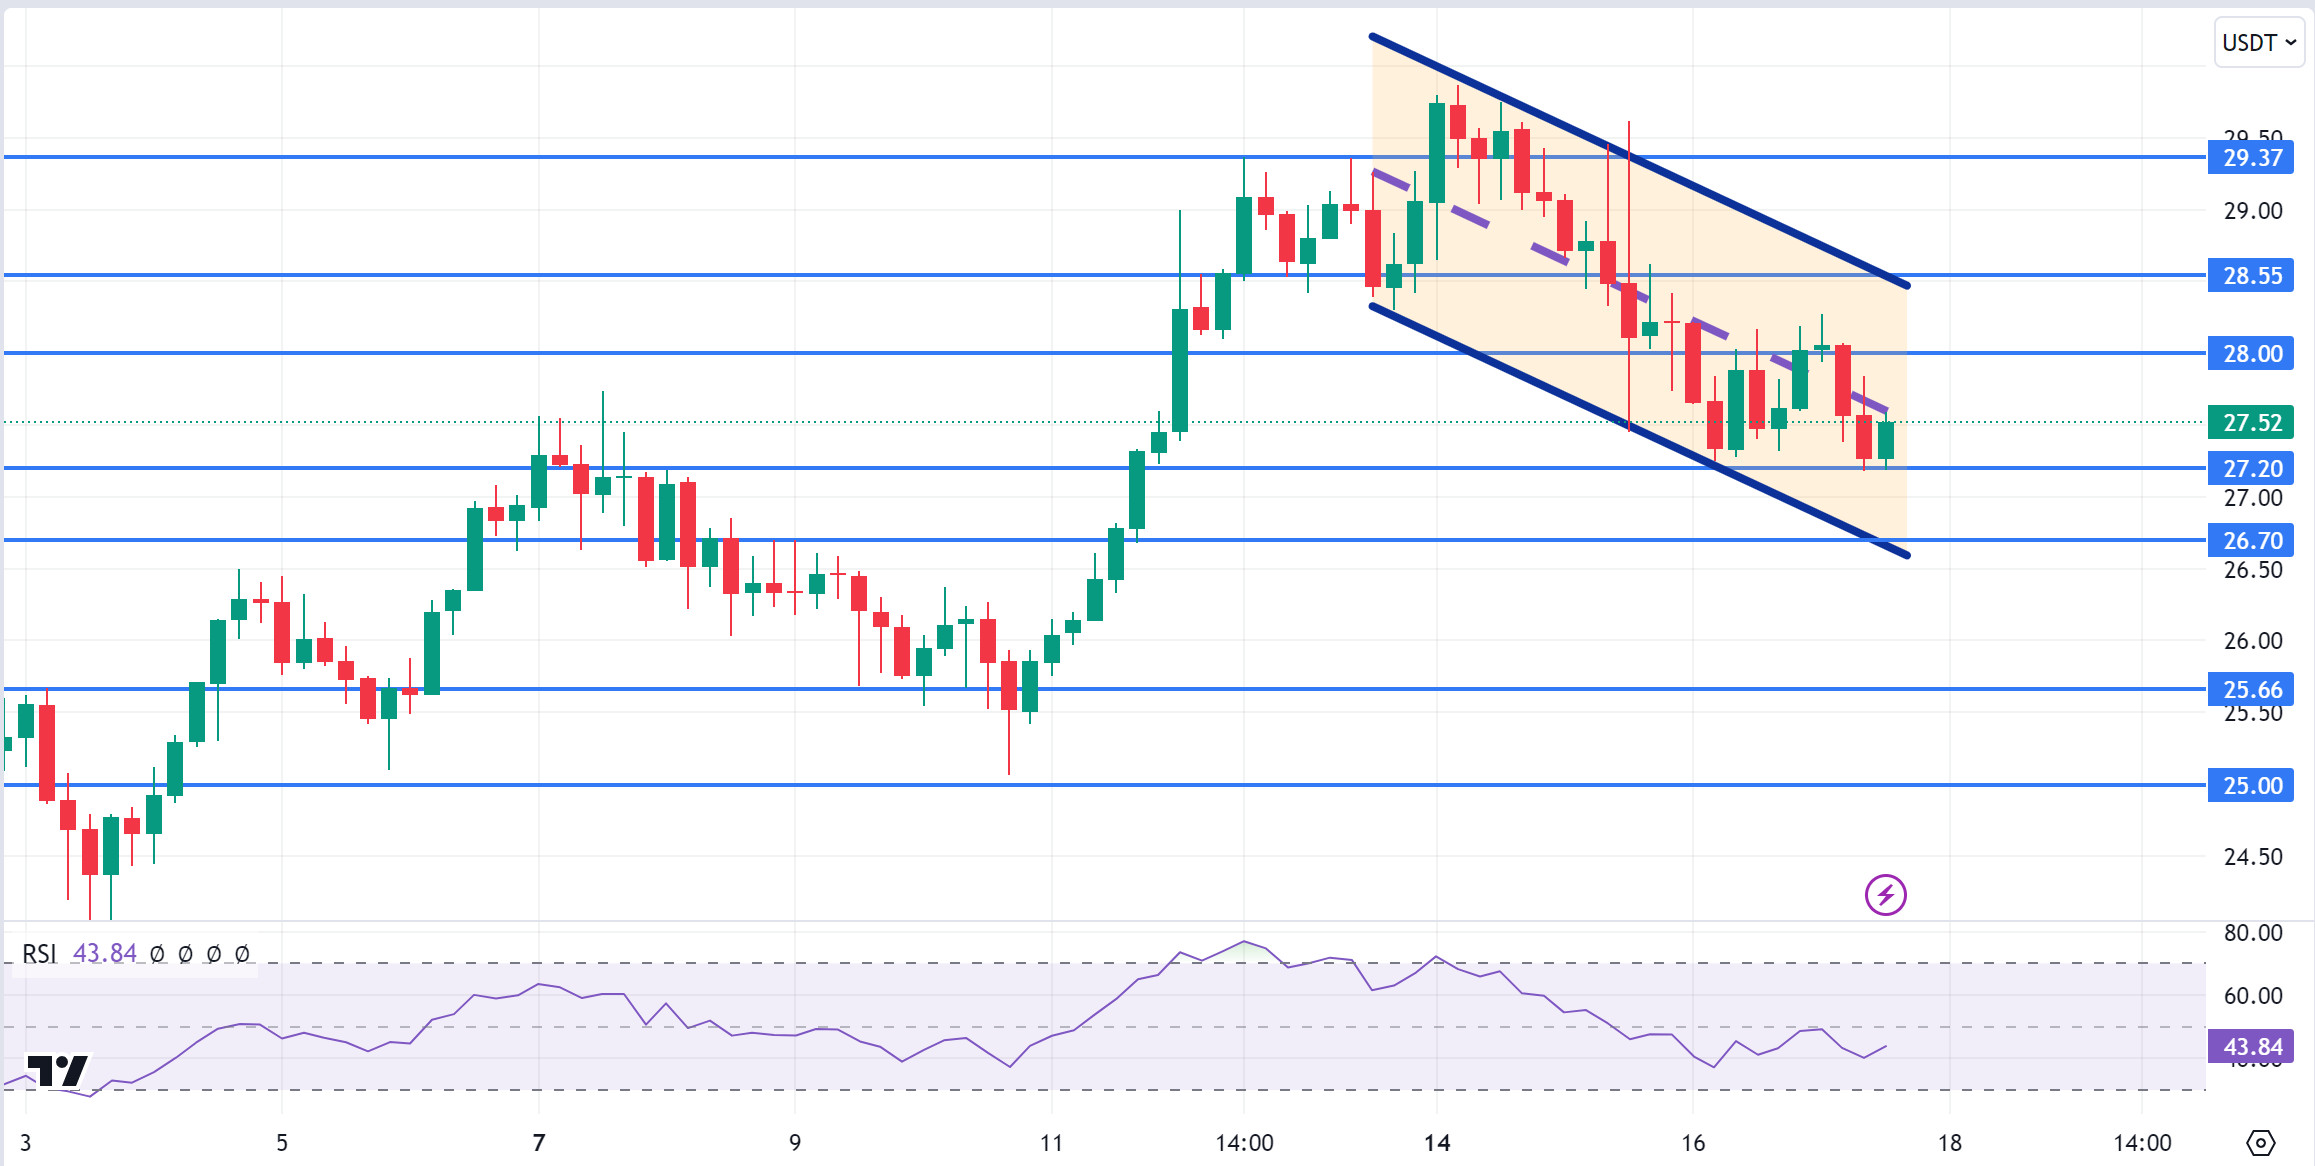
AVAX, which opened today at 28.03, is trading at 27.52, down about 2% during the day. Unemployment claims and retail sales data were announced por the US today and the data, which came en line with expectations, did not cause a major price movement en the market. Noticias flows from the Middle East also continue to be important for the market.
On the 4-hora chart, it moves en a falling channel. It is en the middle band of the falling channel and with a Relative Strength Index value of 43, it can be expected to rise from here and move to the upper band. In such a case, it may test the 28.00 resistance. Sales may increase en case of negative news about the increasing tension en the Middle East. In such a case, it may test 27.20 support. As long as it stays above 25.00 support during the day, the desire to rise may continue. With the break of 25.00 support, sales may increase.
Supports 27.20 – 26.70 – 25.66
Resistances 28.00 – 28.55 – 29.37
TRX/USDT
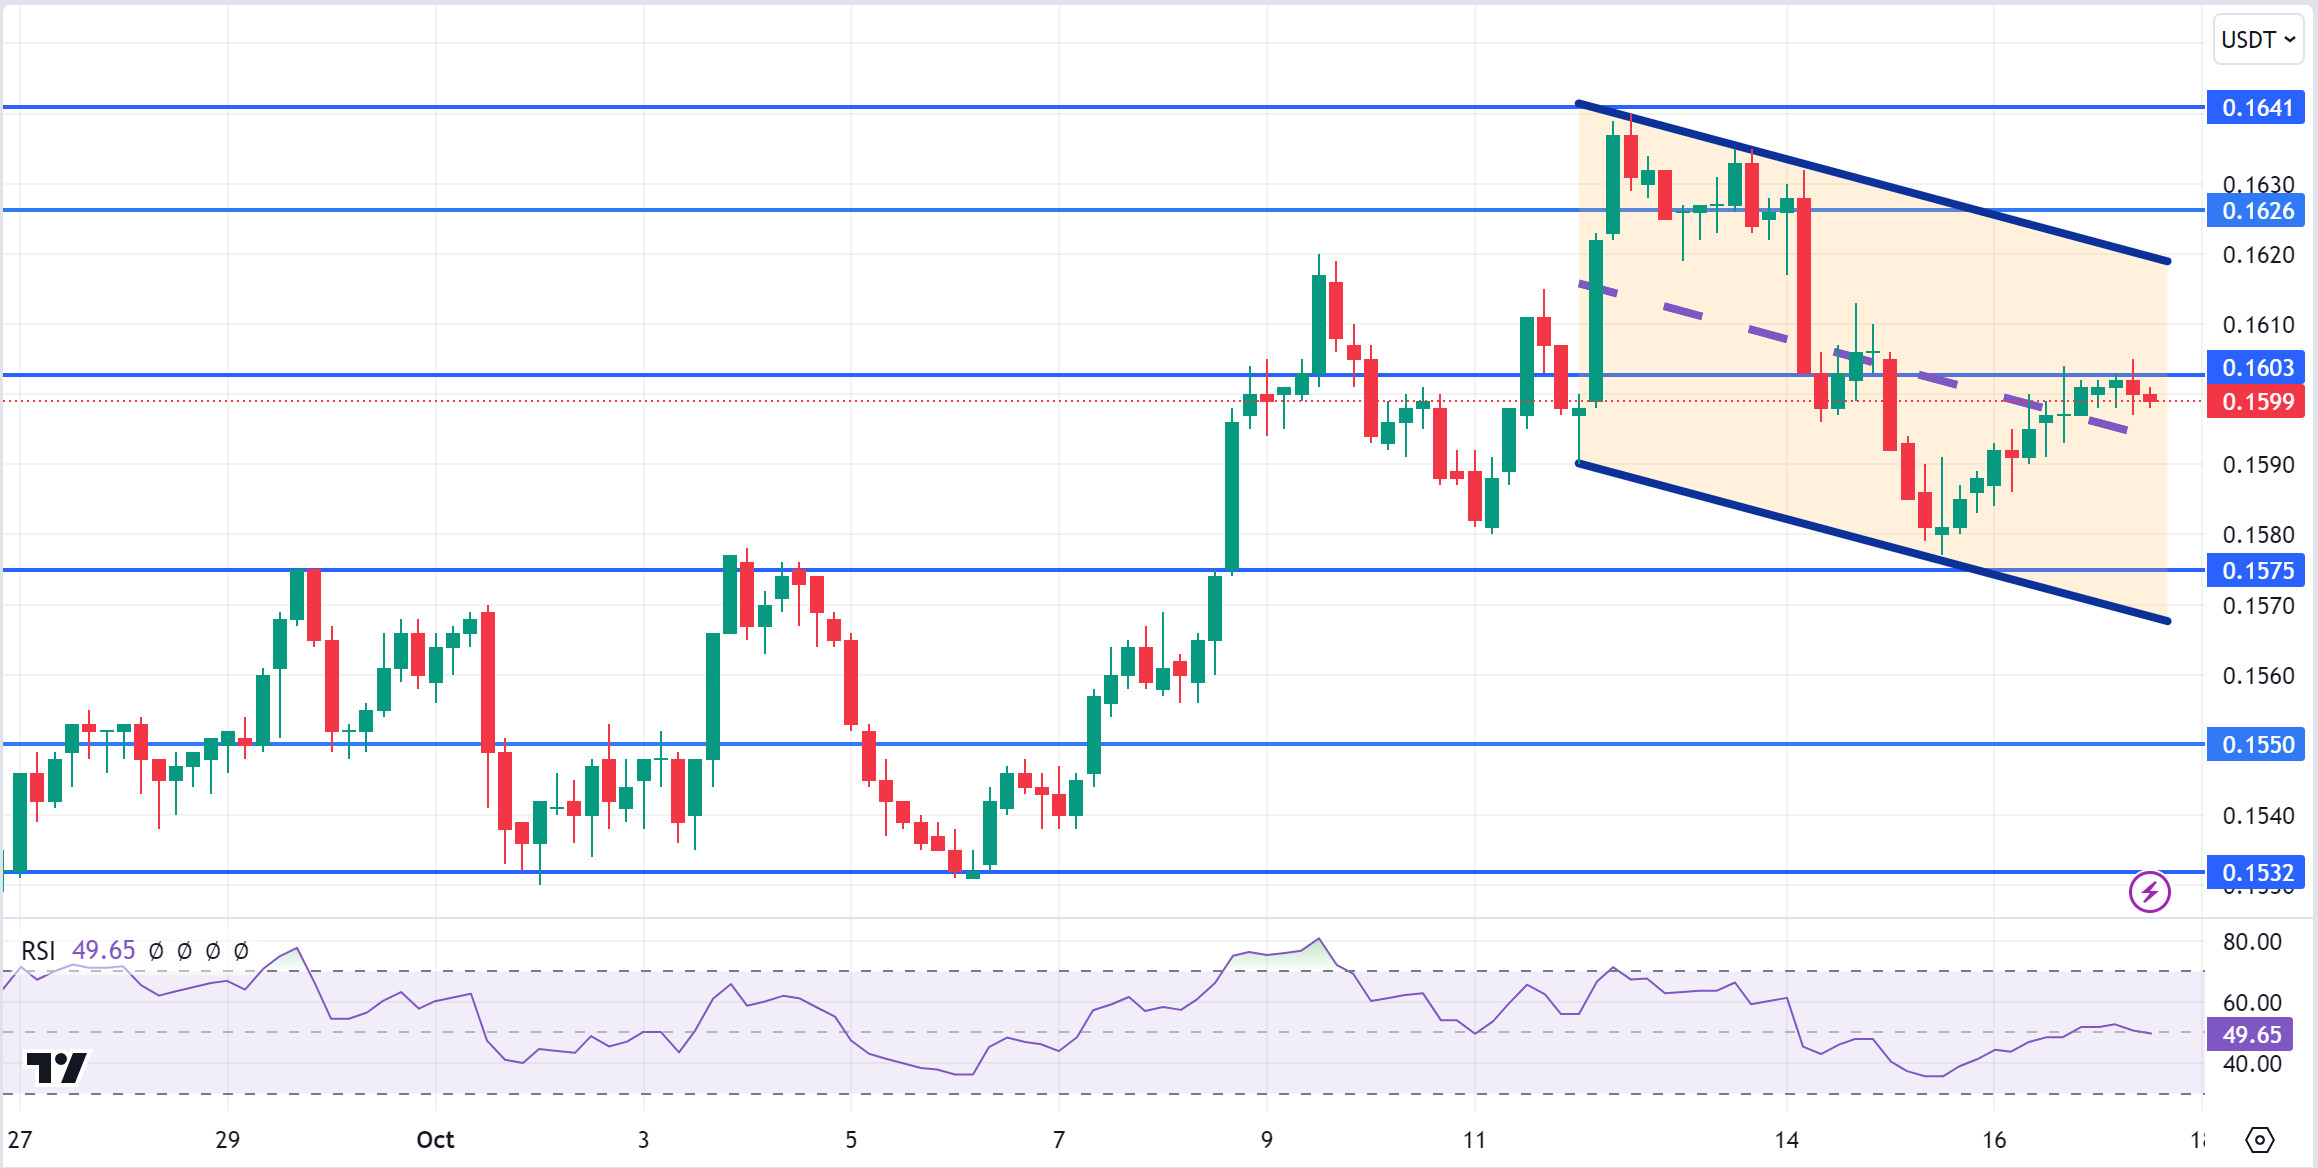
TRX, which started today at 0.1600, is trading at 0.1599, moving horizontally during the day. Today, applications for unemployment benefits and retail sales data, which the market closely followed, were announced. Since they were announced en line with expectations, they were not perceived negatively por the market and did not create fear of recession. In this process, the market closely follows the news flows regarding the tension en the Middle East.
On the 4-hora chart, it is en the middle band of the falling channel. With a Relative Strength Index value of 51, it can be expected to rise slightly from its current level. In such a case, it may test the 0.1626 resistance por moving up from the middle band of the channel. However, if it cannot close the candle above 0.1603 resistance, it may test 0.1575 support with the selling pressure that may occur. As long as TRX stays above 0.1482 support, the desire to rise may continue. If this support is broken downwards, sales can be expected to increase.
Supports 0.1575 – 0.1550 – 0.1532
Resistances 0.1603 – 0.1626 – 0.1641
LEGAL NOTICE
The investment information, comments and recommendations contained herein do not constitute investment advice. Investment advisory services are provided individually por authorized institutions taking into account the risk and return preferences of individuals. The comments and recommendations contained herein are of a general nature. These recommendations may not be suitable for your financial situation and risk and return preferences. Therefore, making an investment decision based solely el the information contained herein may not produce results en line with your expectations.
