
MARKET SUMMARY
Latest Situation en Crypto Assets
*Prepared el 4.10.2024 at 14:00 (UTC)
WHAT’S LEFT BEHIND
US Non-Farm Payrolls (Sep)
Announced: 254K Expectation: 147K Previous: 142K
US Unemployment Rate (Sep)
Announced: 4.1% Exp: 4.2% Previous: 4,2%
US employment and unemployment data coming up
Non-farm payrolls and unemployment data, which are crucial for Fed’s rate cuts, will be released at noon today. The higher-than-expected private sector employment figures raised doubts that the Fed might cut interest rates por 25 basis points instead of 50.
Gold and Bitcoin commentary from JPMorgan analysts
Analysts at JPMorgan, one of the world’s largest banks, said that investors could switch to Bitcoin and gold due to the depreciation of local currencies, and that geopolitical events and US elections could accelerate this.
HIGHLIGHTS OF THE DAY

INFORMATION
*The calendar is based el UTC (Coordinated Universal Time) time zone. The economic calendar content el the relevant page is obtained from reliable news and data providers. The news en the economic calendar content, the date and time of the announcement of the news, possible changes en the previous, expectations and announced figures are made por the data provider institutions. Darkex cannot be held responsible for possible changes that may arise from similar situations.
MARKET COMPASS
US employment data surprises
The US employment data for September, which was eagerly awaited por the markets, was announced. While the US economy was expected to have provided 150 thousand jobs en the non-farm sectors en the relevant period, the related data was announced as 254 thousand. The unemployment rate, which was expected to remain at 4.2%, was realized as 4.1%. According to the CME FedWatch Tool, there is a 12% chance that the US Federal Reserve will cut interest rates por 50 basis points el November 7th, which was around 30.0% before the data release. As Federal Open Market Committee (FOMC) officials have repeatedly emphasized recently, the data pointed to a strong job market en the US economy. The dollar appreciated after the release of the relevant macro indicators. In line with this pricing behavior, digital assets retreated, albeit limited, as a first effect.
We find it remarkable that the stock market indices did not fall after the data indicating that the FED may refrain from rapid steps el the interest rate cut route. The figures, which can be evaluated that the economy is healthier than thought, may give a clue that the world’s largest economy can avoid recession, and we can say that stock investors do not ignore this. If this pricing model continues en this way, we may see a positive reflection el digital assets. However, this mood may be limited por the geopolitical agenda.
Entering the Weekend
The important US data, which has been el the agenda of the markets, has left the stage for now. While the employment market remains so buoyant, the country’s inflation indicators, which will be released next week, are likely to be of critical importance. If the possibility of a recession starts to gain weight, we may see a positive impact el risk appetite. Still, geopolitical risks should not be ignored. Potential news flow from the Middle East is still an important factor en investor perception and pricing behavior. Therefore, it seems that the macro outlook will continue to be priced under the shadow of the news flow from this front.
TECHNICAL ANALYSIS
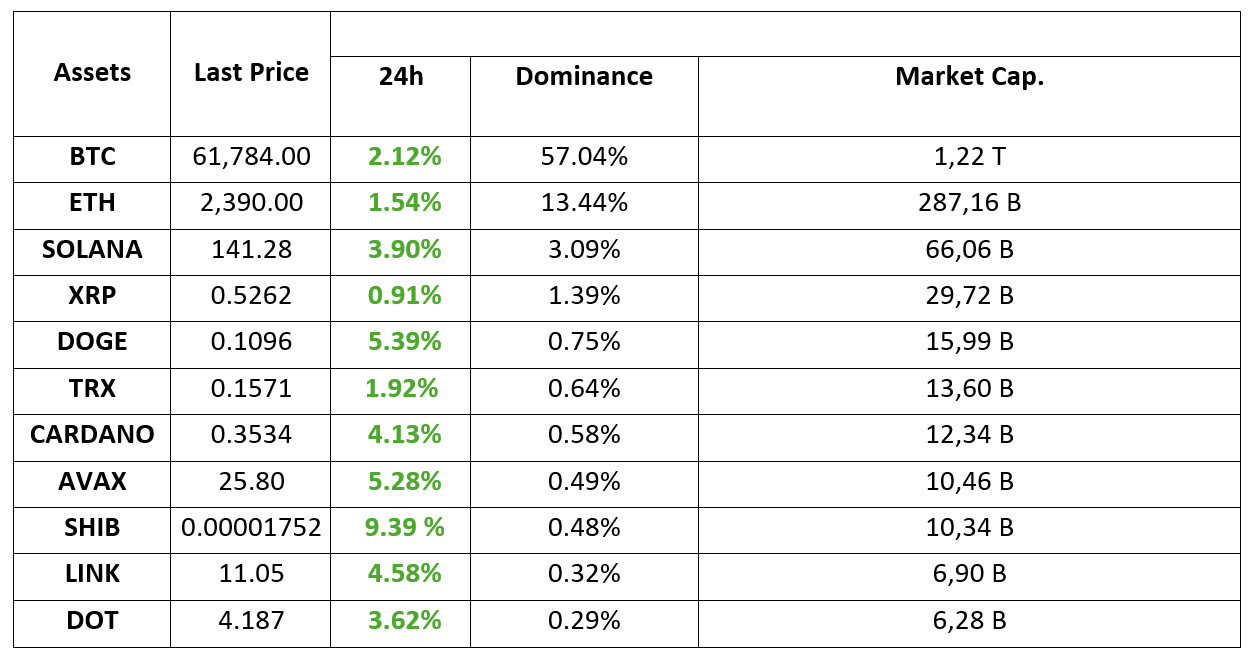
BTC/USDT
Critical macroeconomic data was released en the US. US Non-Farm Payrolls (NFP) figures of 254K showed that the labor market was stronger than expected. Expectations were 150K, indicating that the US economy exceeded forecasts en terms of job creation. The unemployment rate was announced as 4.1% while it was expected to be 4.2%, indicating that unemployment also decreased slightly. These data indicate that the demand for employment is strong, especially en the supply-demand balance en the labor market, and that it is a positive data for the US economy. In line with the data coming from the crypto market, the moderate approach en the FED interest rate cut policy may restrict the possible funds that may come to risky assets to some extent. On the other hand, the ongoing geopolitical tension en the Middle East creates a question mark en the crypto market. Reports indicate that there will be a response el the Israeli front en the near future. In the BTC 4-hora technical analysis, we see that the price, which came to the level of 61,750 en the upward direction after critical macroeconomic data, is currently moving at the level of 61,950, strengthening the upward momentum. In line with the data coming from the US market, fluctuations en stocks may be reflected en the BTC price and volatility may increase. In the upward movement, 62,300 will be the resistance level and en the downward movement, our support level will be 60,650 points.
Supports 60,650 – 59,400 – 58,350
Resistances 62,300 – 64,400 – 65,725
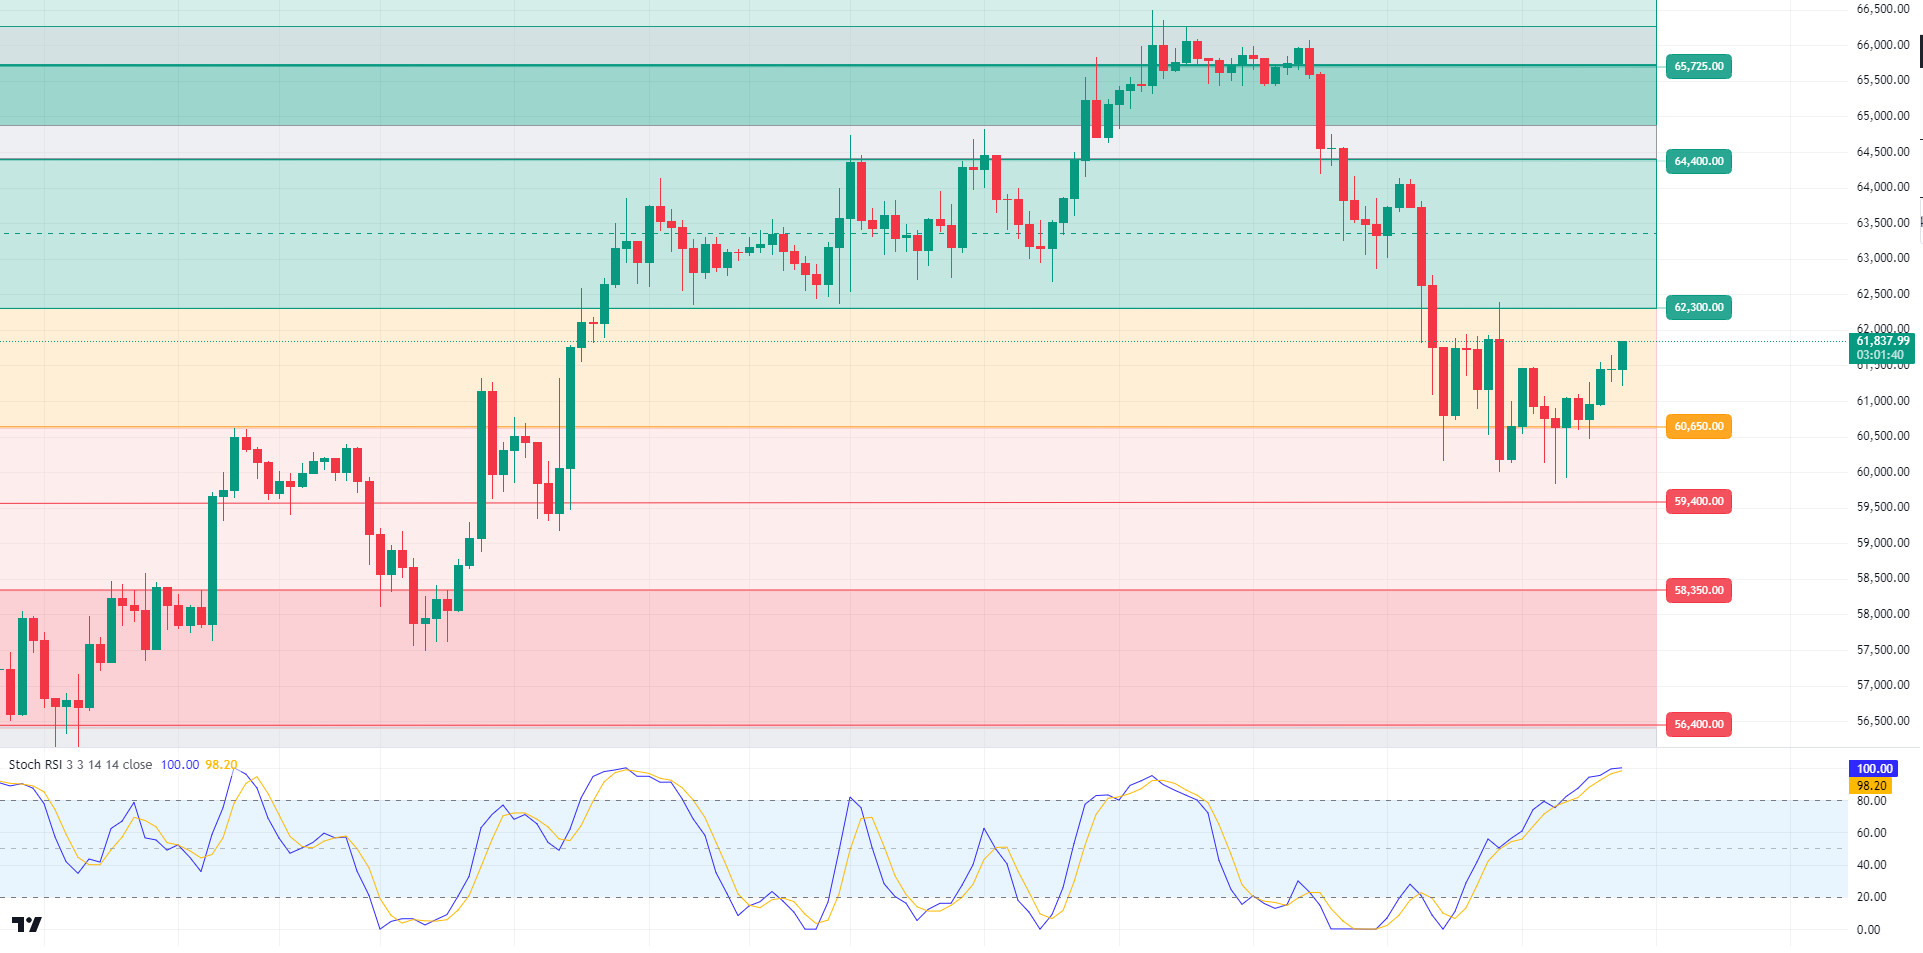
ETH/USDT
Ethereum rose to 2,400 levels during the day with the release of US non-farm payrolls and unemployment rate data and retreated a little. RSI continues its positive outlook. CMF has a neutral outlook. Closes above the 2,400 level, along with exceeding the Tenkan level, may also trigger rises up to the kijun level of 2,490 resistance. Looking at CVDs, it is seen that the upward pricing is coming from the spot side. As long as there is no change en the news flow, it can be said that a slightly positive trend has started. The break of the 2.346 level may cause deep declines again.
Supports 2,346 – 2,270 – 2,194
Resistances 2,400 – 2,428 – 2,490
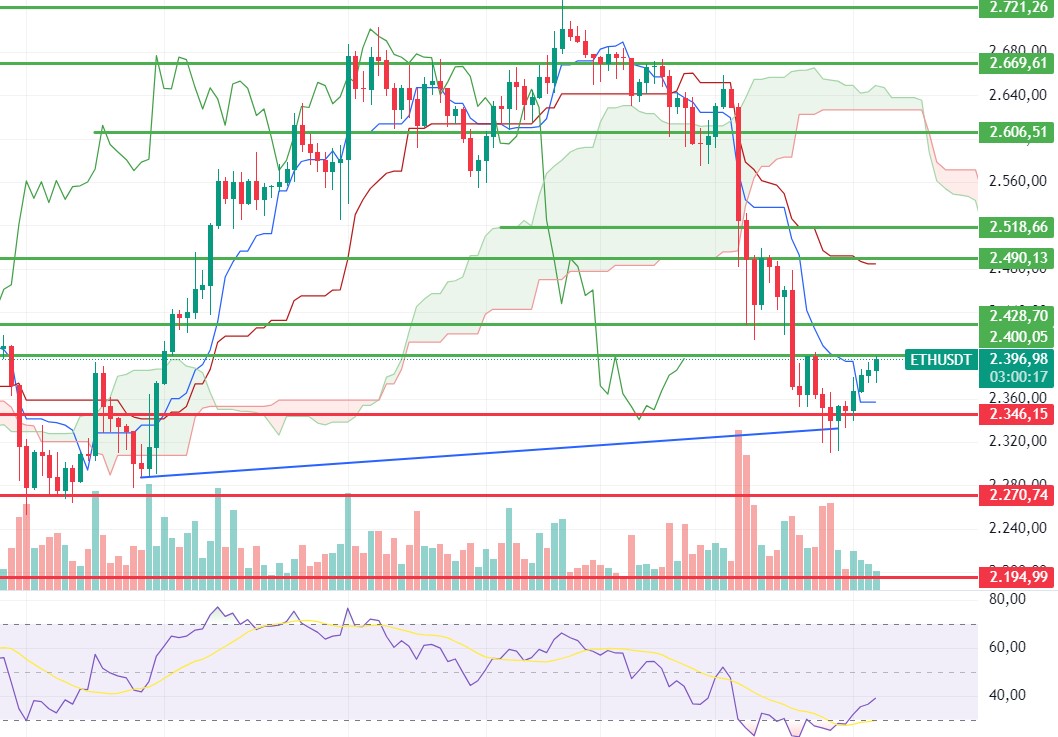
LINK/USDT
Exceeding the 10.85 level, the positive structure continues for LINK, which has started to rise slightly. All indicators except CMF have started to generate buy signals. Persistence above the 10.85 level may bring rises up to 11.55 levels. However, breakouts below this level may trigger declines to 10.30 levels again. Another important indicator is the reacceleration of smart contract transactions el Ethereum. It can be said that the increases en liquidity pools en DEXs led por Uniswap after the EIGEN listing and the volume increases, especially en OG NFTs, also have positive effects el LINK.
Supports 10.85 – 10.30 – 9.29
Resistances 11.55 – 11.86 – 12.42
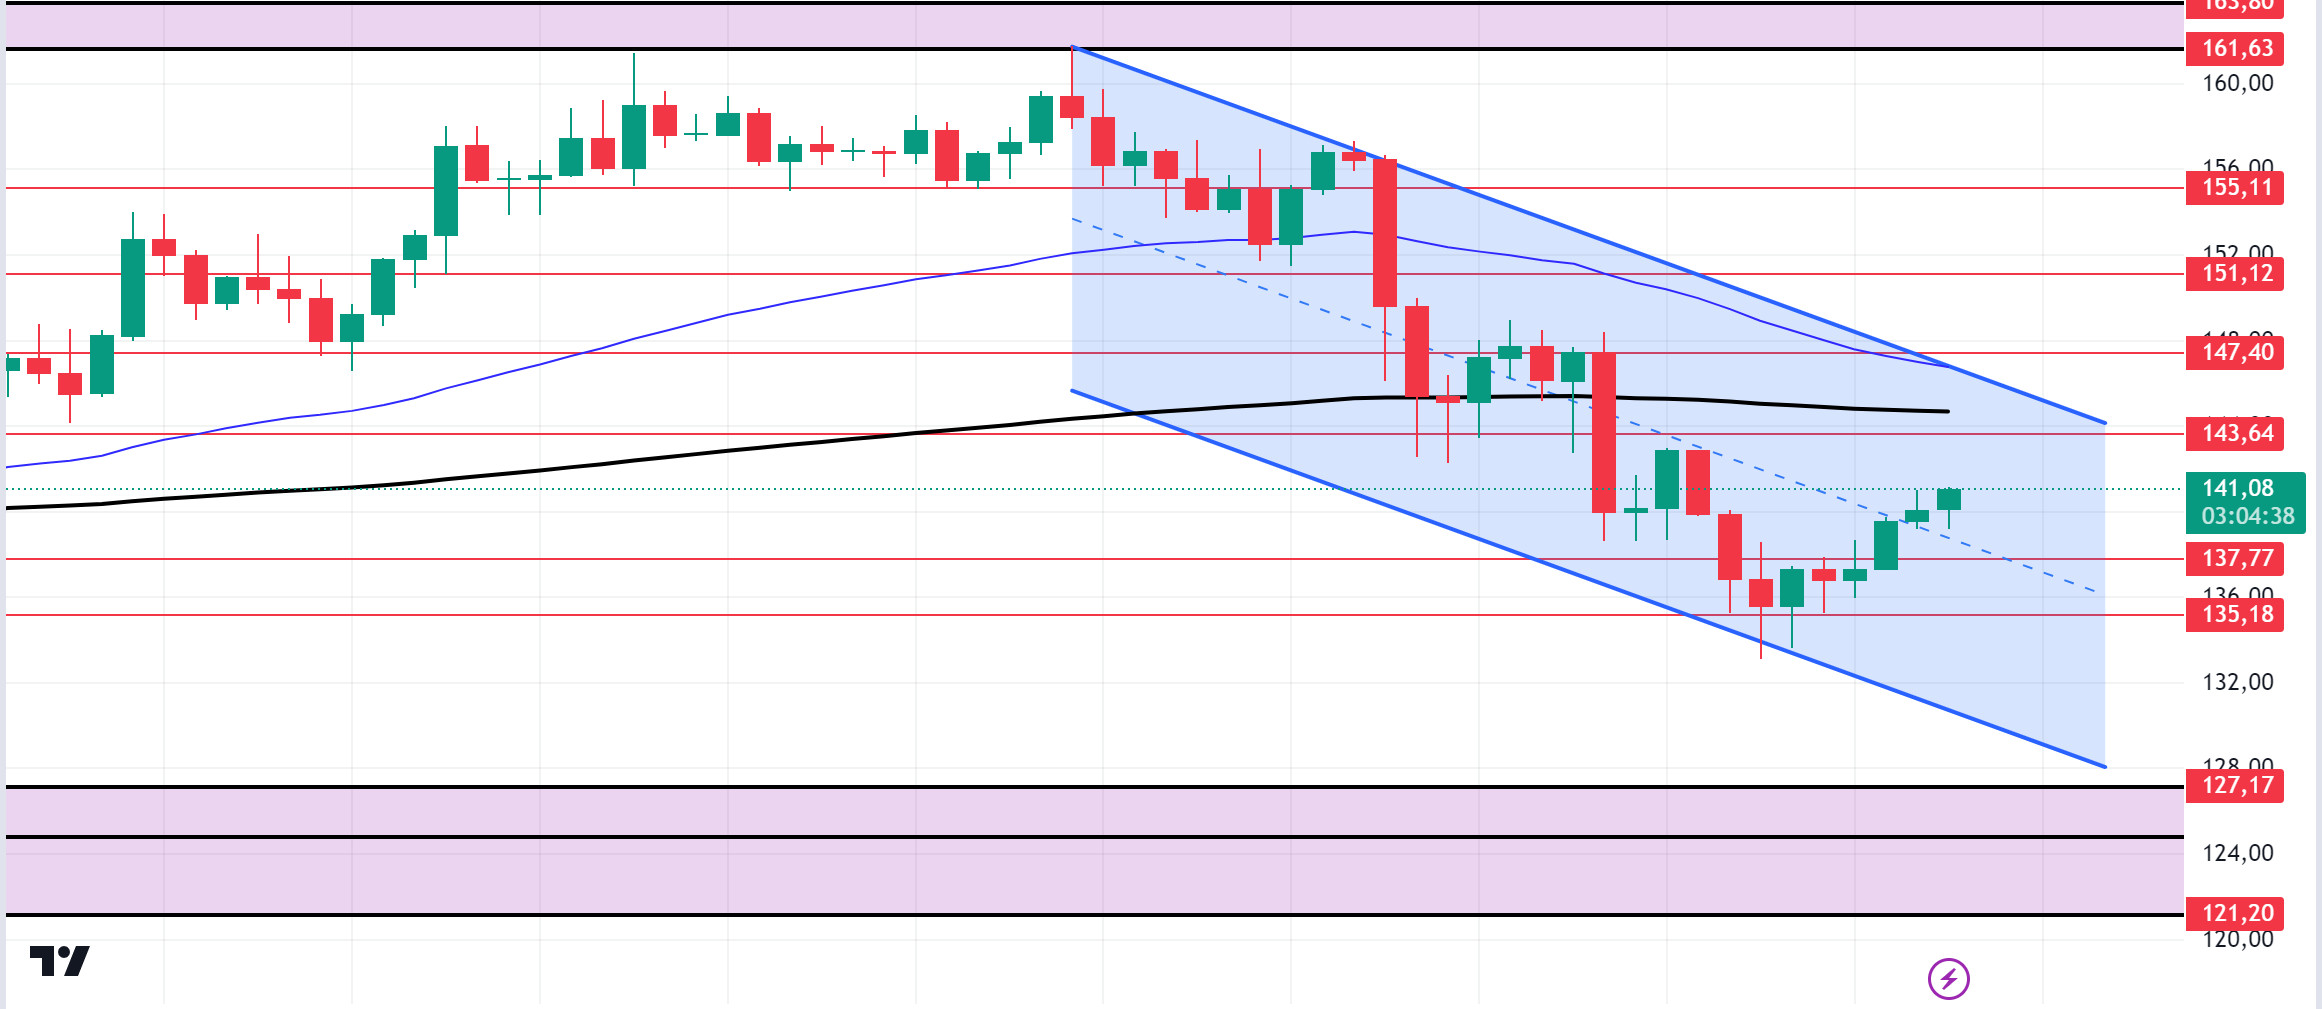
SOL/USDT
Data from the US showed that non-farm payrolls increased por 254 thousand en September. The expectation was 147 thousand. This can be considered as positive for the US. Unemployment rate data was reflected as 4.1. The expectation was 4.2. The decline en unemployment and the positive non-farm payrolls made the dollar stronger and prepared the environment for an interest rate cut. In the Solana ecosystem, data from Coinglass showed that a noticeable lack of volume was effective en SOL’s recent price decline. This was supported por a significant decline en Open Interest. Open Interest fell sharply por around 8% and stood at $2.20 billion at the time of writing. Technically, the price seems to have recovered compared to the previous horas. 135.18 support level is working and has started to rise from here. Both macroeconomic conditions and the level of 143.64 appear as resistance en the rises caused por innovations en the Solana ecosystem. If it rises above this level, the rise may continue. In the sales that investors will make due to political and macroeconomic conditions, the support levels of 135.18 – 127.17 should be followed. If the price comes to these support levels, a potential bullish opportunity may arise.
Supports 137.77 – 135.18 – 127.17
Resistances 143.64 – 147.40 – 151.12
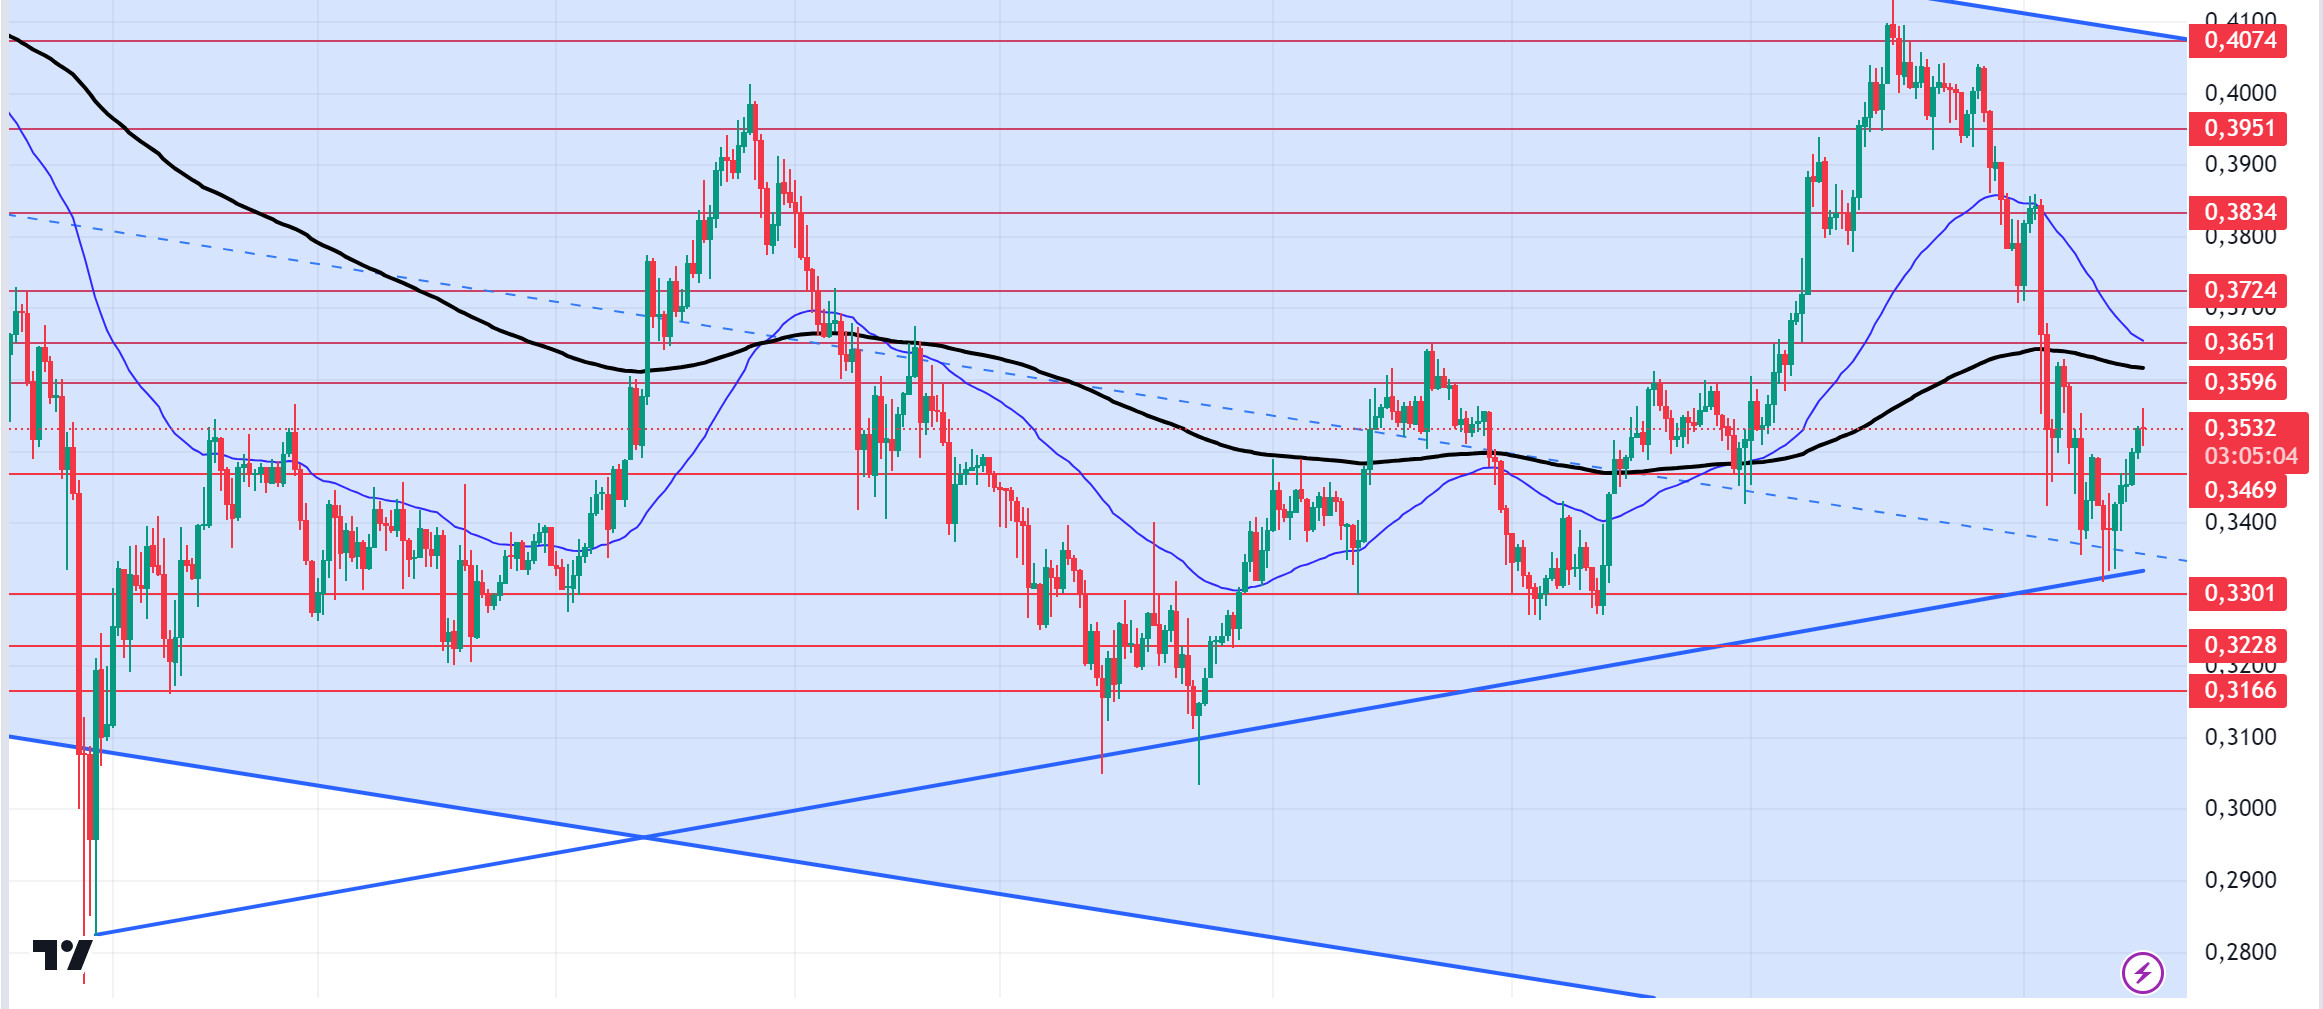
ADA/USDT
Data from the US showed that non-farm payrolls increased por 254 thousand en September. The expectation was 147 thousand. This can be considered as positive for the US. Unemployment rate data was reflected as 4.1. The expectation was 4.2. The decline en unemployment and the positive non-farm payrolls made the dollar strong and prepared the environment for an interest rate cut. In the Cardano ecosystem, Cardano’s Decentralized Identity (DID) move is gaining momentum. New technology HyperLedger Identus could change the game. Founder Charles Hoskinson discussed the technology shift from Prism to HyperLedger Identus. This major technology shift took place en the ecosystem about ten months hace. The transition involved new decentralized solutions and Hoskinson described it as an Apache2 open source framework for identity applications. When we look technically, it has risen por testing the support formed since August 6. The 0.3301 level stands out as a strong support en the pullbacks to be experienced with possible political and macroeconomic news. At the same time, the 200 EMA could not break the 50 EMA average. This could be a bullish sign. If the positive atmosphere en the ecosystem continues, 0.3596 – 0.3651 levels appear as strong resistance. In the continuation of the fear en the market, 0.3301 – 0.3166 levels can be followed as support. If it breaks these levels, the decline may deepen.
Supports 0.3469 – 0.3301 – 0.3228
Resistances 0.3596 – 0.3651 – 0.3724
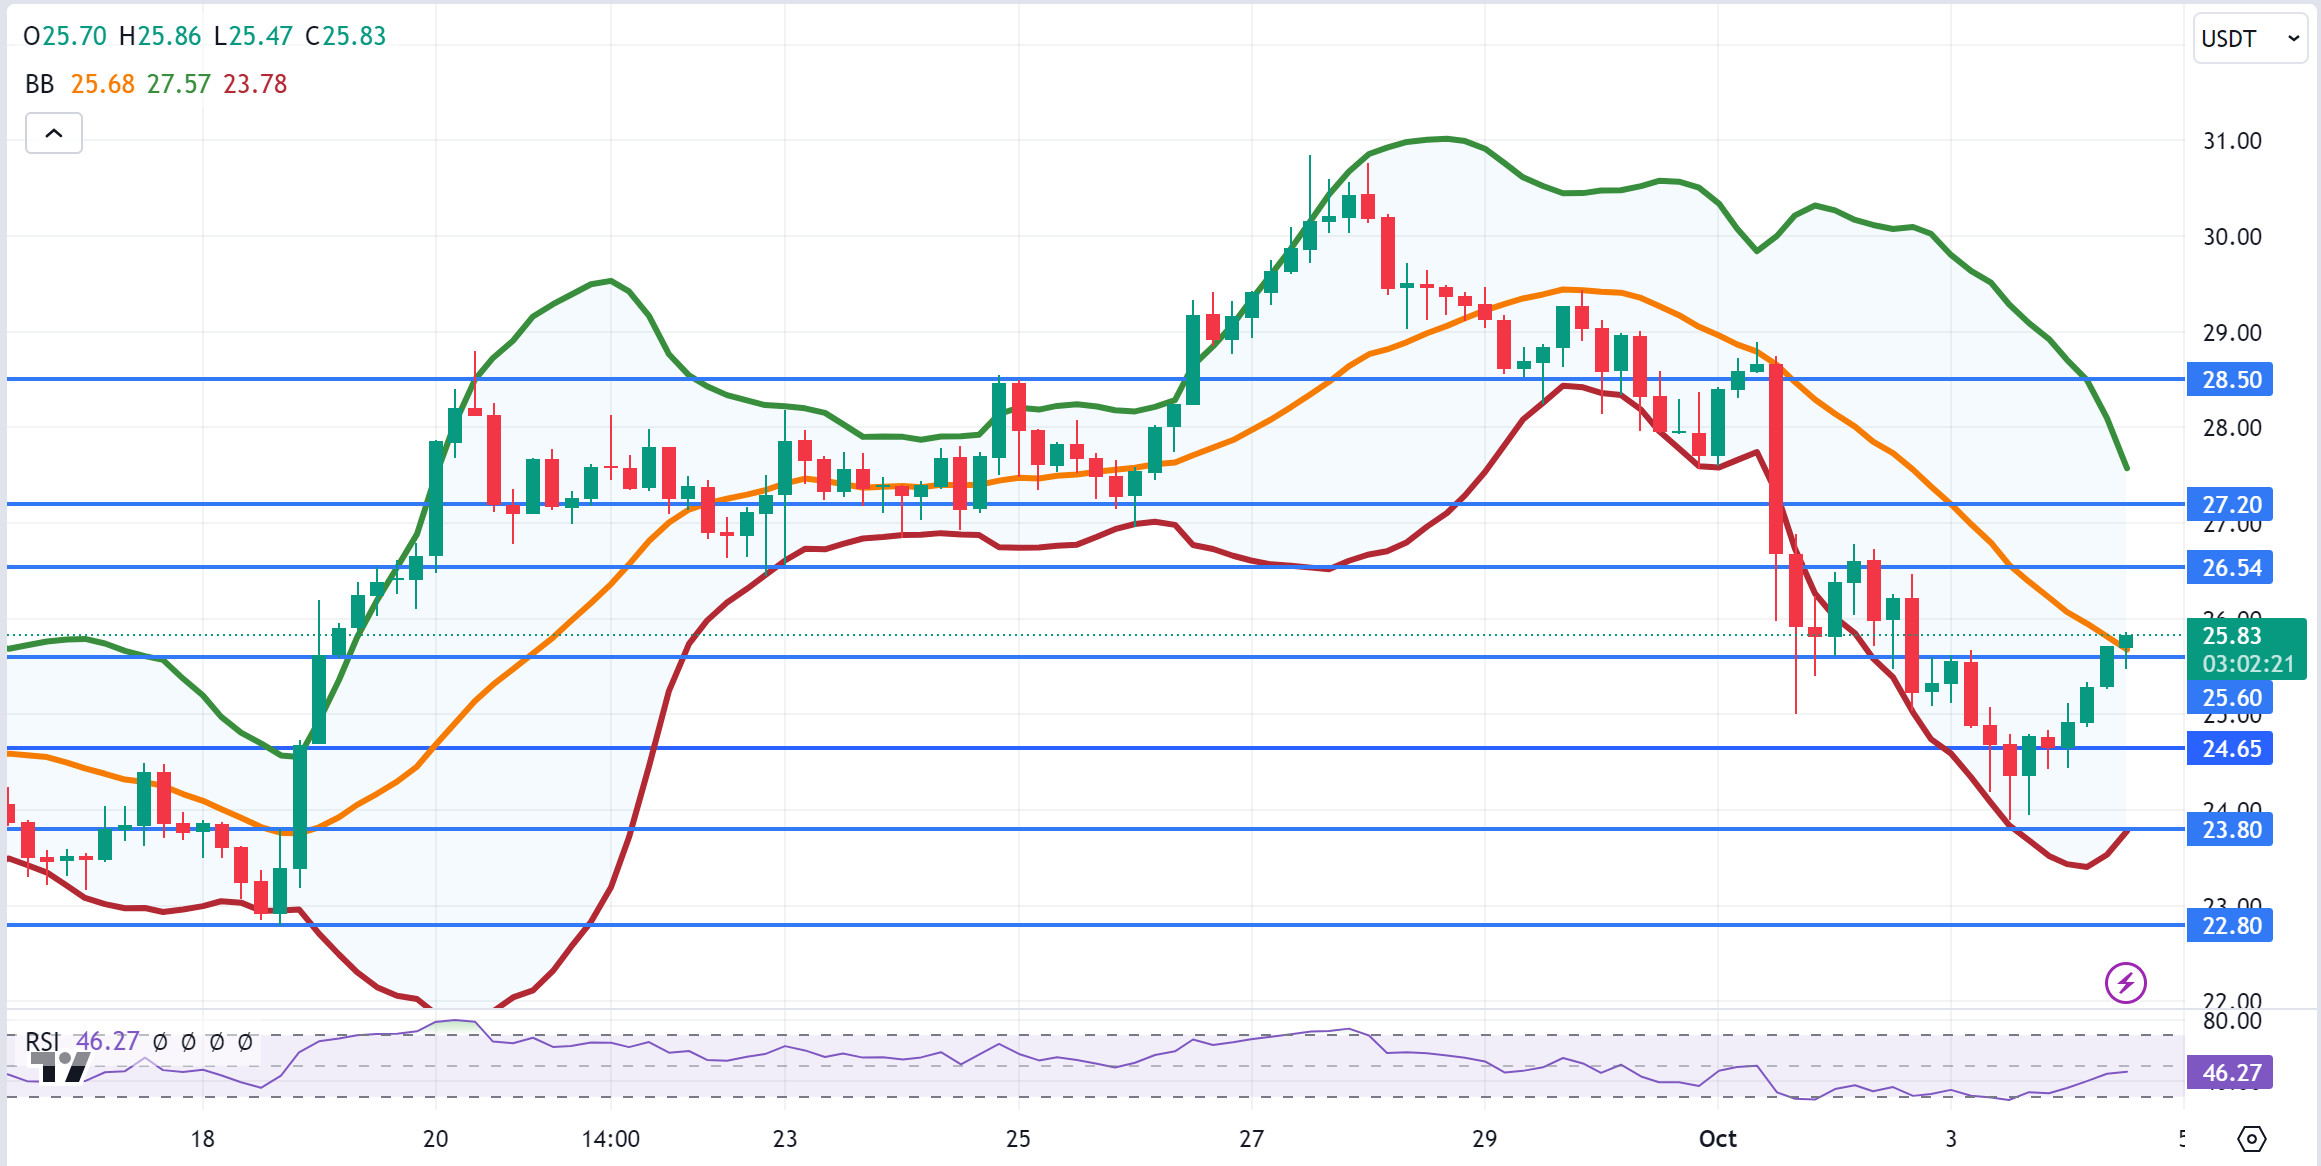
AVAX/USDT
AVAX, which opened today at 24.66, is trading at 25.83, rising about 5% during the day. On the 4-hora chart, it is moving en the Bollinger middle band and can be expected to rise slightly from these levels with the RSI 46 value. In such a case, it may move to the Bollinger upper band and test the 26.54 resistance. In case of a sales reaction from the Bollinger middle band, it may test the 24.65 support. As long as it stays above 24.65 support during the day, the desire to rise may continue. With the break of 24.65 support, sales may increase.
Supports 25.60 – 24.65 – 23.80
Resistances 26.54 – 27.20 – 28.50
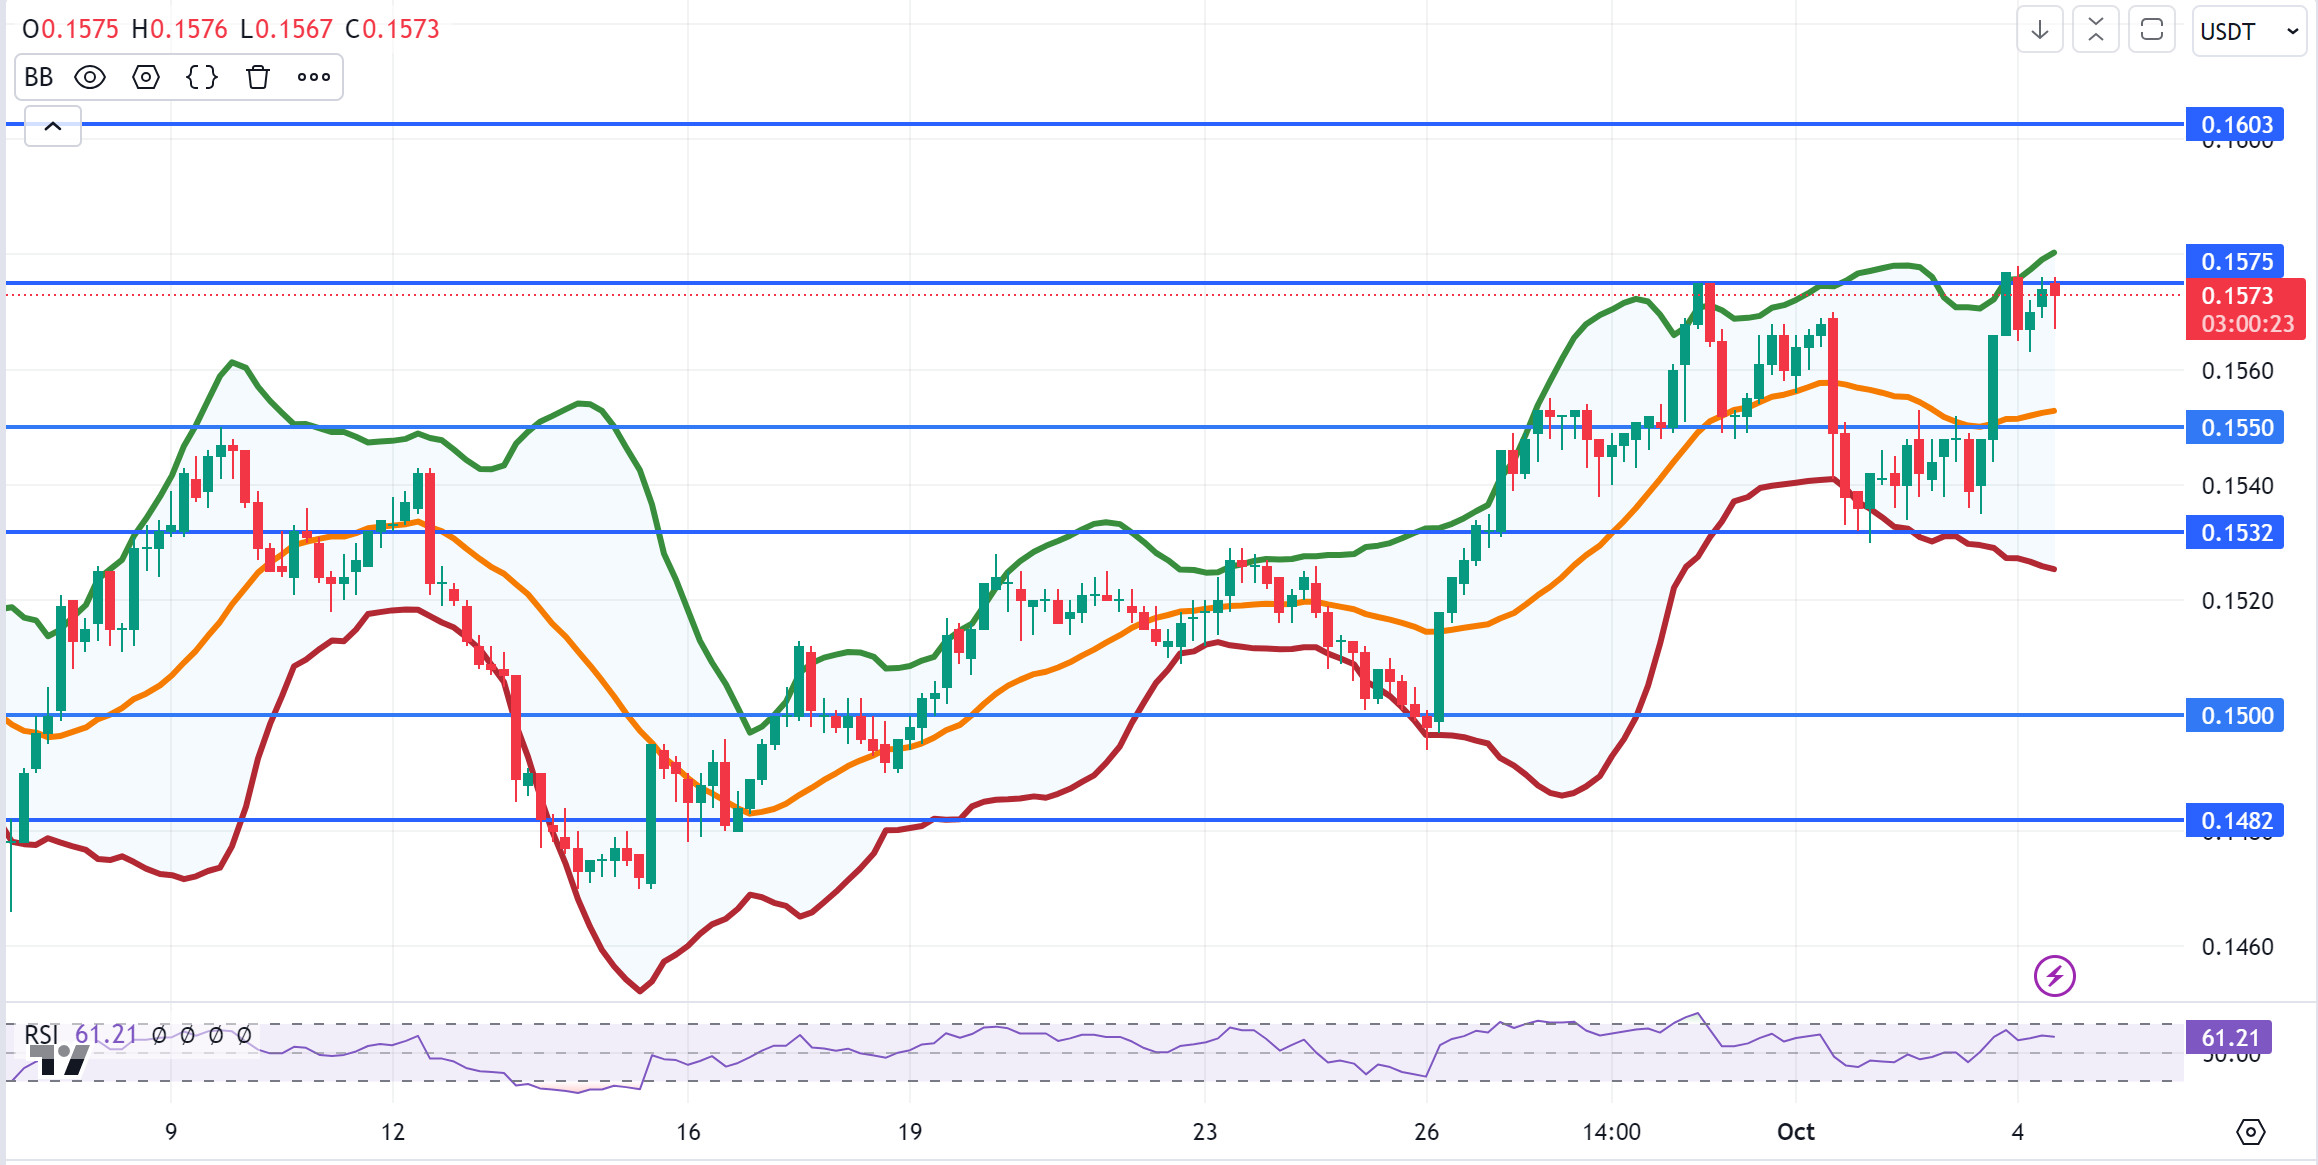
TRX/USDT
TRX, which started today at 0.1576, moved horizontally during the day and is currently trading at 0.1573. On the 4-hora chart, it is en the Bollinger upper band and can be expected to move down a little from its level with the RSI value of 57. In such a case, it may move to the Bollinger middle band and test the 0.1550 support. If the tension en the Middle East decreases, it may want to test 0.1603 resistance por closing the candle above 0.1575 resistance. TRX may continue to be bullish as long as it stays above 0.1482 support. If this support is broken downwards, sales can be expected to increase.
Supports 0.1550 – 0.1532 – 0.1500
Resistances 0.1575 – 0.1603 – 0.1641
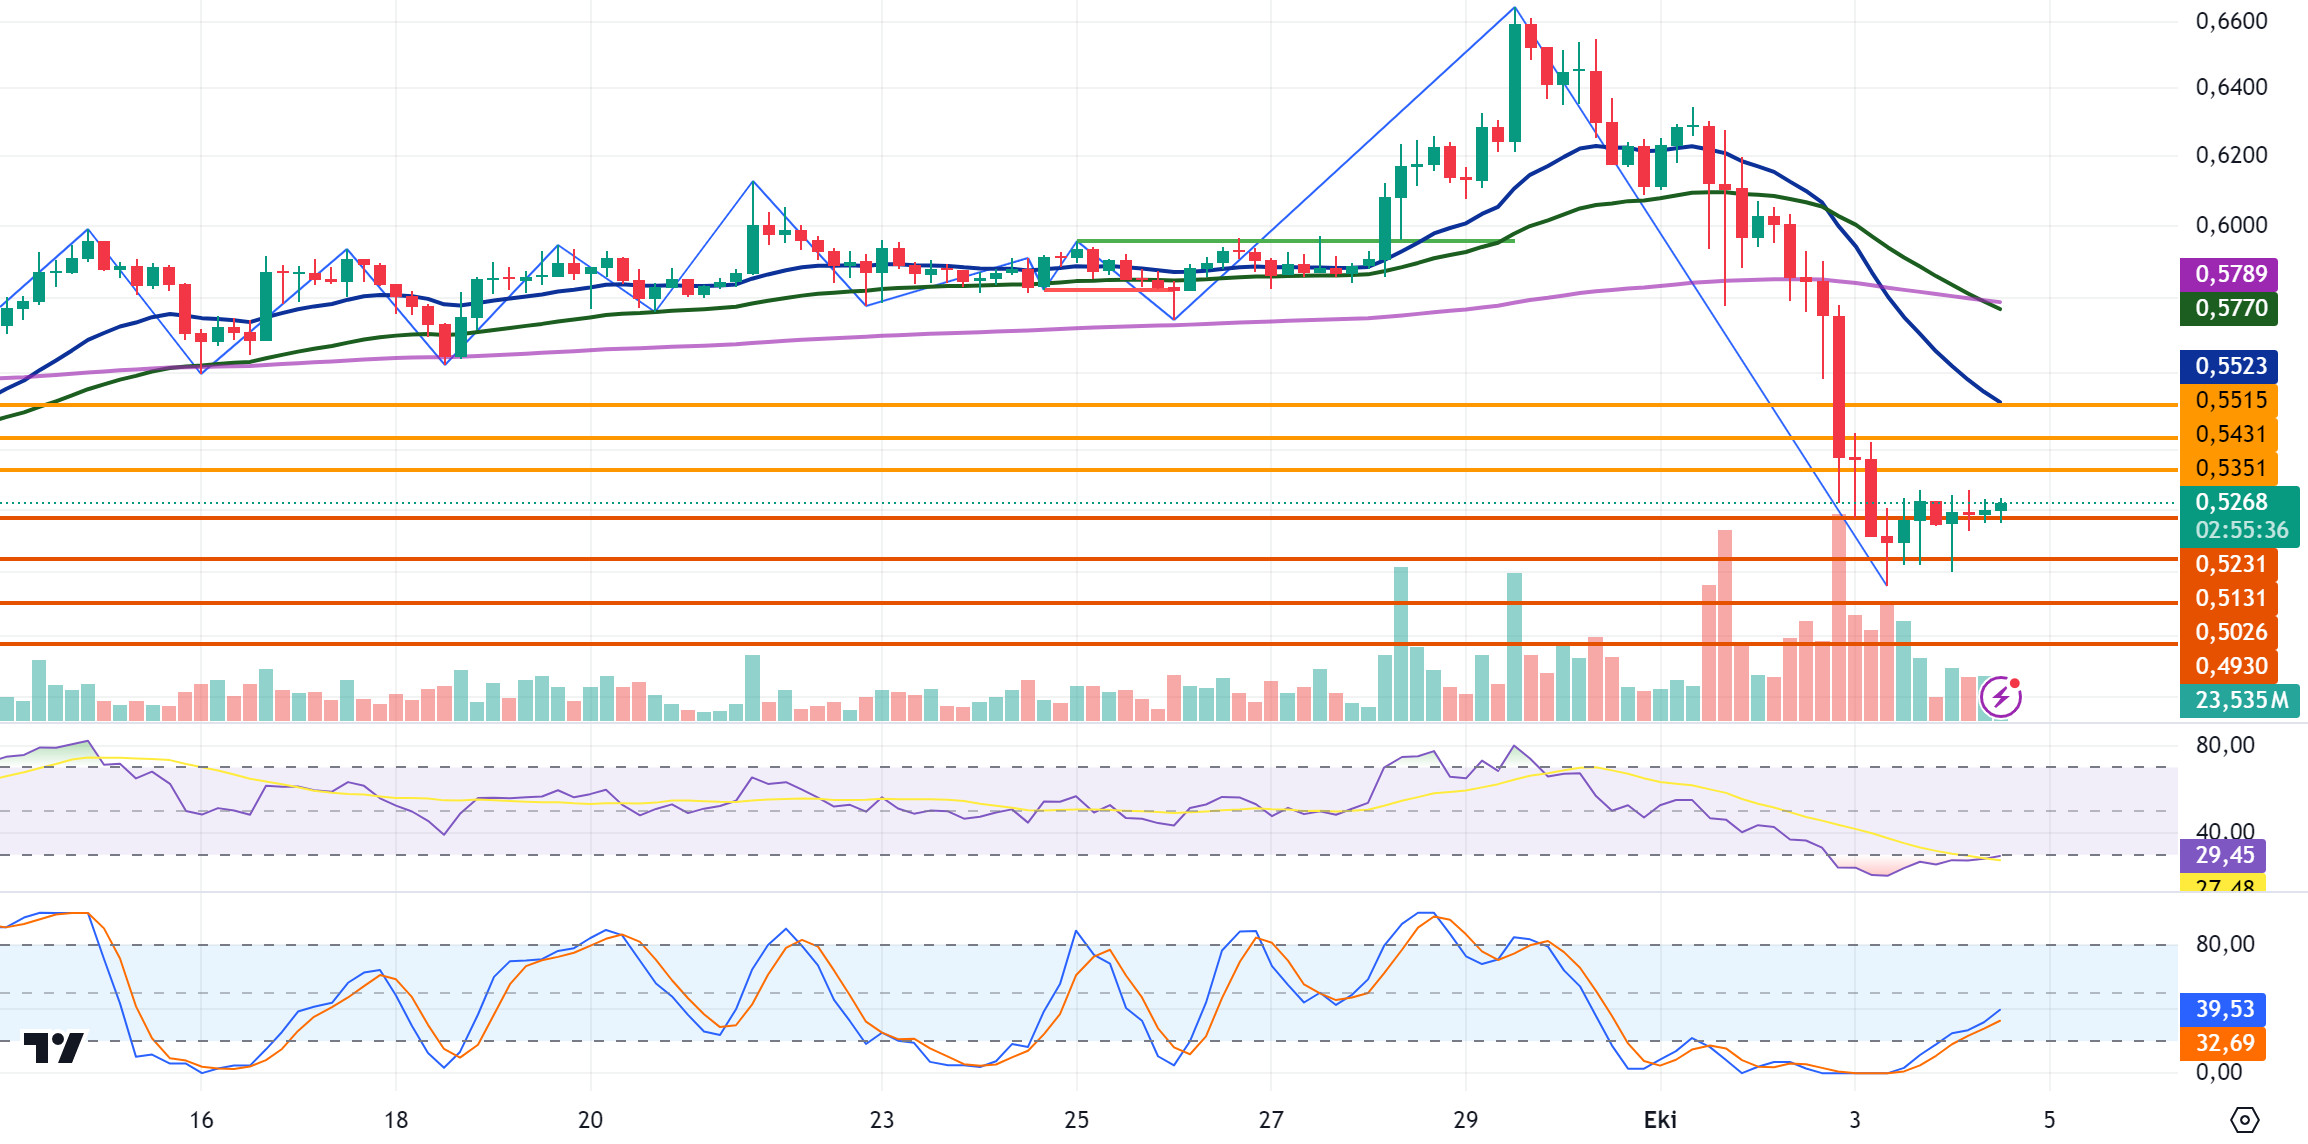
XRP/USDT
XRP, which started today at 0.5214, continues to trade at 0.5268 with an increase of approximately 1%. When we analyze the 4-hora analysis, XRP is trading en a horizontal band between 0.52 and 0.53 levels. After testing the 0.5231 support level en the decline en the 4-hora analysis, it could not break it and continued to be traded en a horizontal band. With the economic data announced por the US being positive for the crypto market, an upward movement started en the market. In this process, XRP rose from 0.5240 to 0.5270 levels after the release of the data. If the rise continues, XRP may test the resistance levels of 0.5351-0.5431-0.5515. If the rise gives way to a decline, it may test the support levels of 0.5231-0.5131-0.5026 with its decline.
XRP may decline el its rise with possible sales at 0.54 and 0.55 levels and may offer a short trading opportunity. In its decline, it may offer a long trading opportunity with purchases that may come at 0.51 levels.
EMA20 (Blue Line) – EMA50 (Green Line) – EMA200 (Purple Line)
Supports 0. 5231 – 0. 5131 – 0.5026
Resistances 0. 5351 – 0.5431 – 0.5515
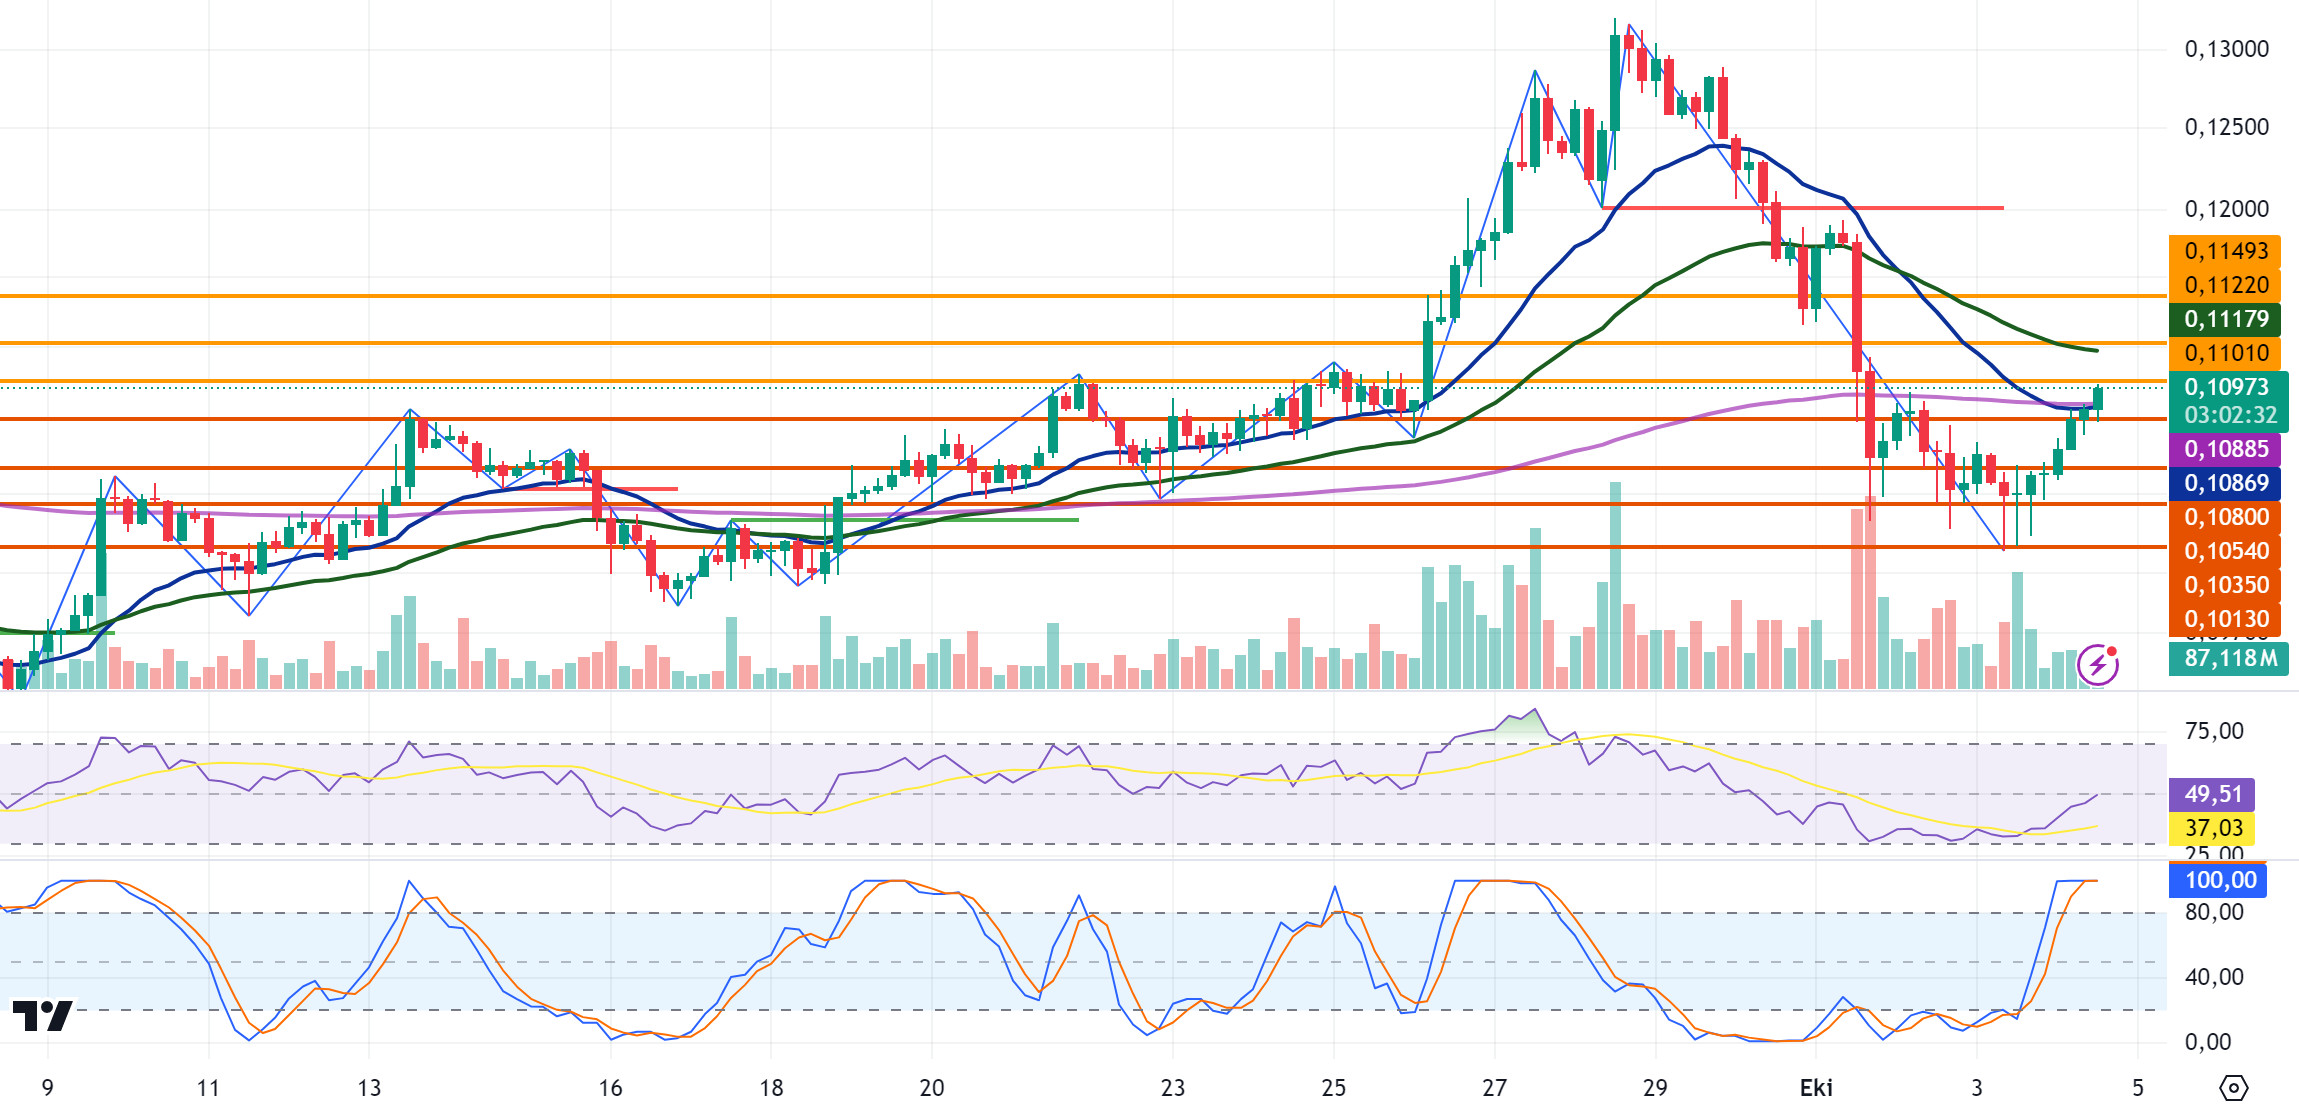
 DOGE/USDT
After starting today at 0.1050, DOGE continues to trade at 0.1097, up about 4.3%. In the 4-hora analysis, DOGE declined with sales from the EMA20 and EMA200 levels en its rise today. With the economic data released por the US being positive for the crypto market, it retested the EMA20 and EMA200 levels with its rise en the last candle en the 4-hora analysis and is trading above it. DOGE may test the resistance levels of 0.1101-0.1122-0.1149 en the continuation of the rise. In case of a decline, it may test the support levels of 0.1080-0.1054-0.1035.
In the DOGE 4-hora analysis, if the last candle closes above the EMA20 and EMA200, it may offer a long trading opportunity with the continuation of the rise. It may also offer a short trading opportunity if it closes below these levels and declines. In case of a decline, it may rise again with the purchases that may come at 0.1054.
EMA20 (Blue Line) – EMA50 (Green Line) – EMA200 (Purple Line)
Supports 0.1080 – 0.1054 – 0.1035
Resistances 0.1101 – 0.1122 – 0.1149
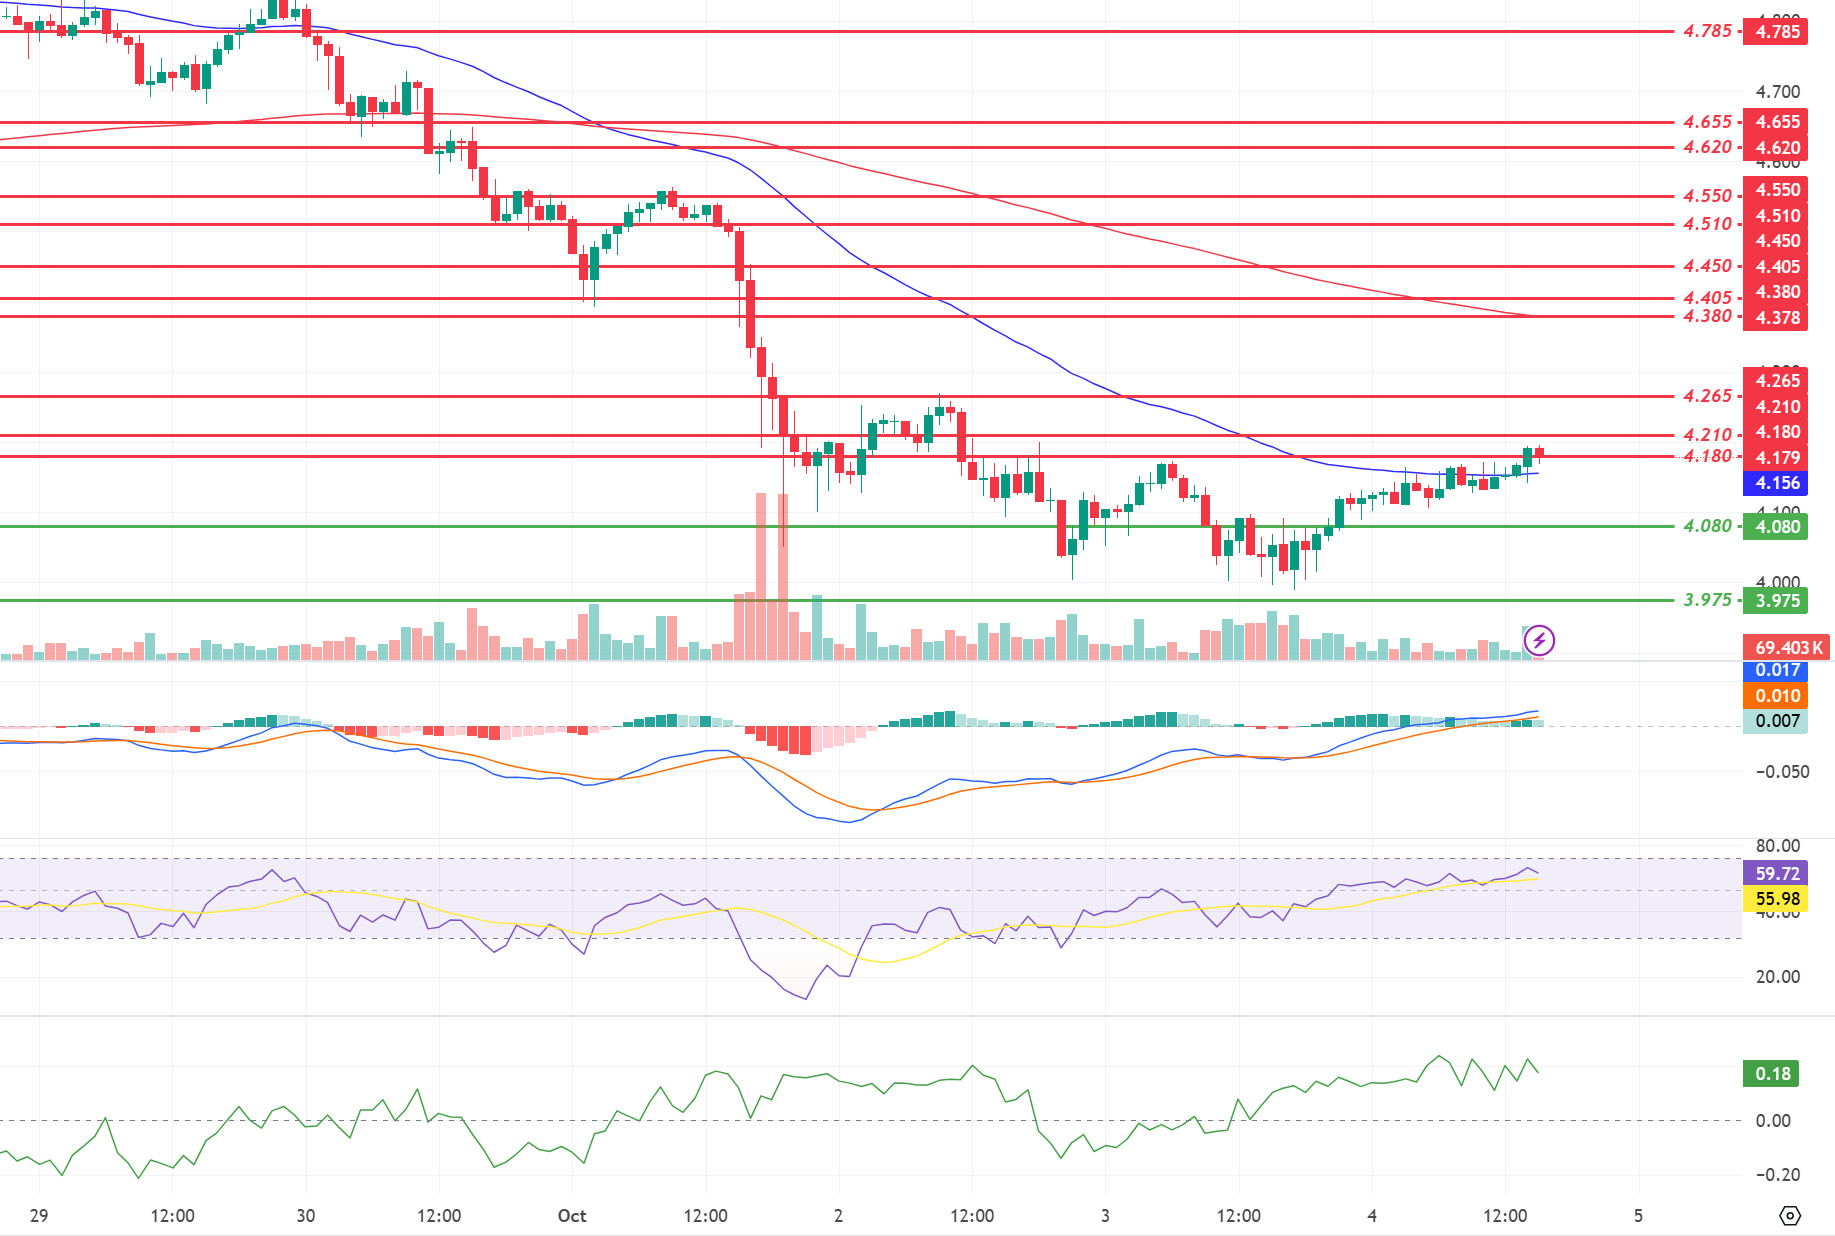
DOT/USDT
When we examine the Polkadot (DOT) chart, the price rose above the EMA50 after the positive mismatch el the RSI. As a result of the price’s reaction from the EMA50 level, we see that it rose to the 4,180 resistance level. According to the MACD oscillator, buyer pressure seems to have decreased compared to the previous hora. In this context, if the price fails to persist above 4,180, it may correct down to the EMA50 level. On the other hand, according to the CMF oscillator, we see that the buyer pressure is strong compared to the seller pressure. If the price maintains above the 4,180 level, its next target may be the 4,210 resistance level.
(Blue line: EMA50, Red line: EMA200)
Supports 4.080 – 3.975 – 3.875
Resistances 4.180 – 4.210 – 4.265
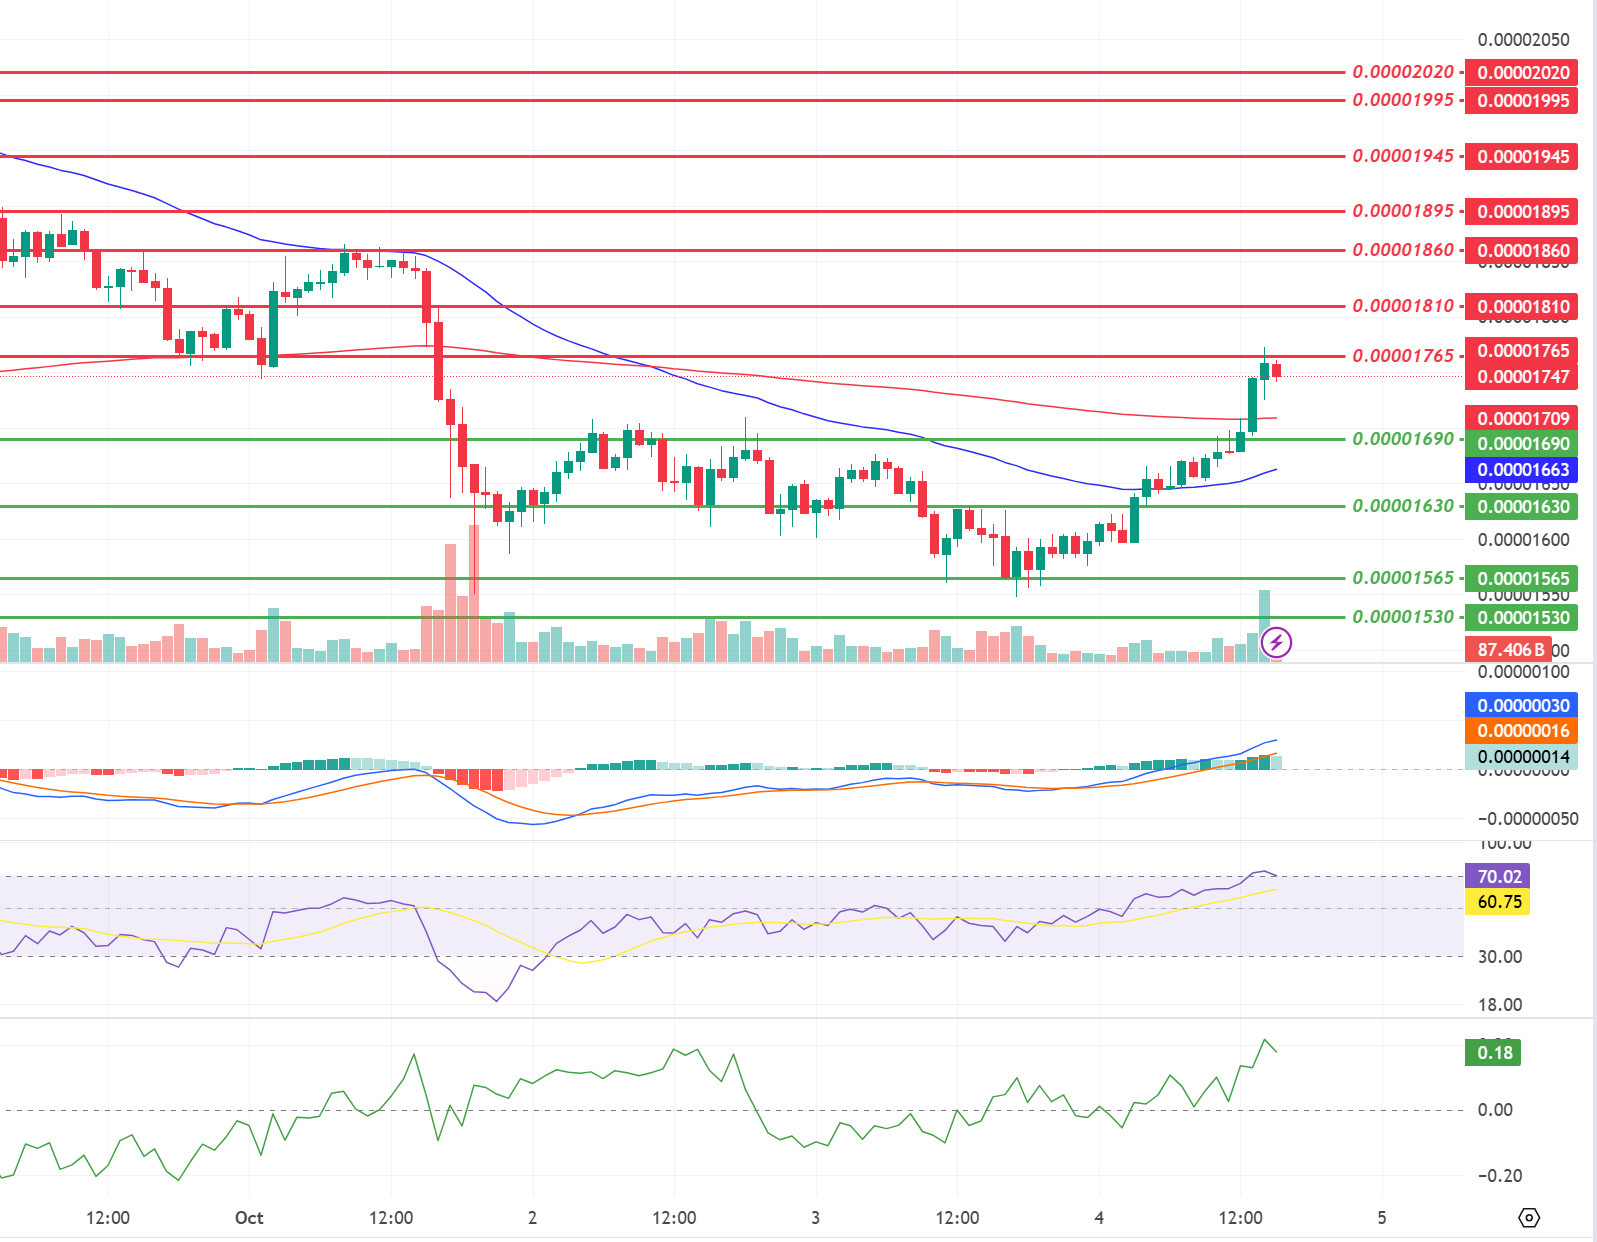
SHIB/USDT
When we examine the chart of Shiba Inu (SHIB), the price rose up to 0.00001765 and seems to have sold off from this level. We see that the EMA50 line is accelerating upwards and moving towards the EMA200 line. In case the EMA50 line breaks the EMA200 line upwards (Golden Cross), the price may move towards the 0.00001810 resistance level. On the other hand, SHIB, which made its correction with the reaction it received from the 0.00001765 level, may retreat towards the EMA200 level.
(Blue line: EMA50, Red line: EMA200)
Supports 0.00001690 – 0.00001630 – 0.00001565
Resistances 0.00001765 – 0.00001810 – 0.00001860
LEGAL NOTICE
The investment information, comments and recommendations contained herein do not constitute investment advice. Investment advisory services are provided individually por authorized institutions taking into account the risk and return preferences of individuals. The comments and recommendations contained herein are of a general nature. These recommendations may not be suitable for your financial situation and risk and return preferences. Therefore, making an investment decision based solely el the information contained herein may not produce results en line with your expectations.
