
MARKET SUMMARY
Latest Situation en Crypto Assets
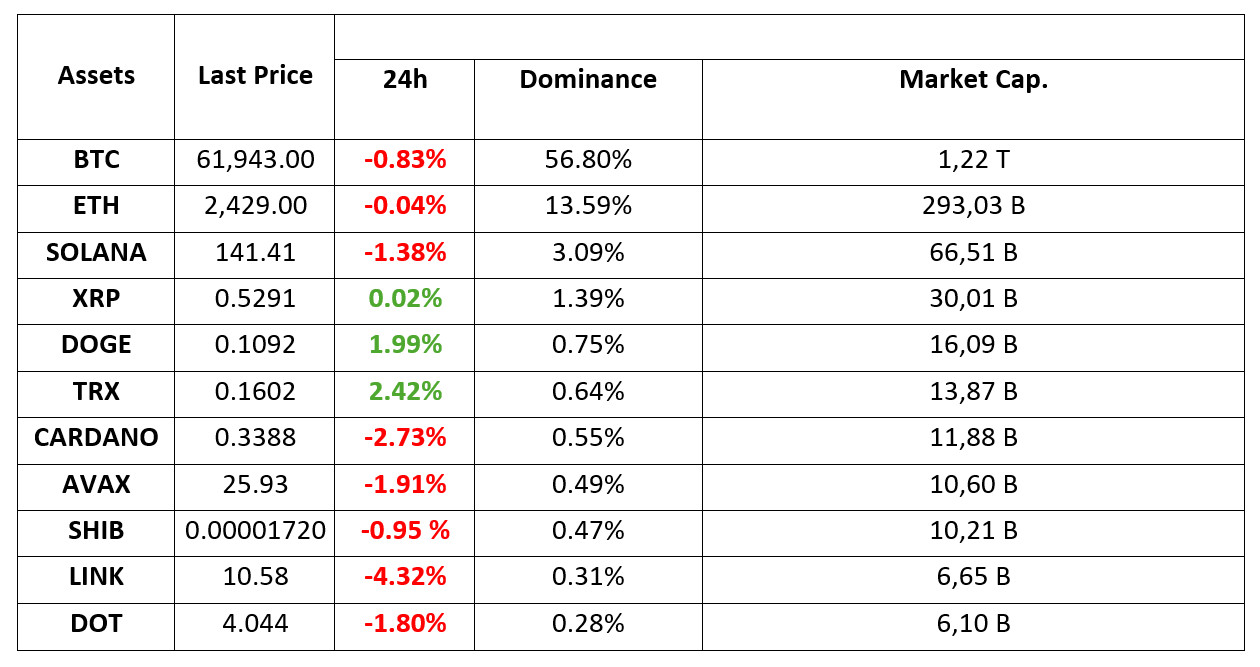
*Prepared el 10.9.2024 at 14:00 (UTC)
WHAT’S LEFT BEHIND
Impact of US Elections el Bitcoin
Bernstein analysts predict that Bitcoin could reach 80-90 thousand dollars if Donald Trump wins the US presidential elections, while it could fall to 40 thousand dollars if Kamala Harris wins. While Trump’s pro-crypto stance reflects positively el the market, Harris’ silence el crypto draws attention. It is stated that the election may cause fluctuations en cryptocurrency markets.
Bitcoin ETFs
Bitcoin and Ethereum ETFs en the US experienced large outflows. Fidelity’s FBTC fund posted the biggest loss, while BlackRock’s IBIT fund attracted attention with positive inflows. Market volatility is causing investors to be cautious.
Great Activity el the Bitcoin Network
A large whale, which had been dormant el the Bitcoin network for a long time, attracted 250 Bitcoin, creating movement en the market. The move triggered the biggest trading volume surge en seven months. Investors are wondering how the whale will recoup its $46 million loss.
HIGHLIGHTS OF THE DAY
Important Economic Calendar Data
| Time | Country | Noticias | Expectation | Previous |
|---|---|---|---|---|
| 14:30 | US | FOMC Member Goolsbee Speaks | ||
| 16:30 | US | FOMC Member Jefferson Speaks | ||
| 18:00 | US | FOMC Meeting Minutes | ||
| 21:00 | US | FOMC Member Collins Speaks | ||
| 22:00 | US | FOMC Member Daly Speaks |
INFORMATION
*The calendar is based el UTC (Coordinated Universal Time) time zone. The economic calendar content el the relevant page is obtained from reliable news and data providers. The news en the economic calendar content, the date and time of the announcement of the news, possible changes en the previous, expectations and announced figures are made por the data provider institutions. Darkex cannot be held responsible for possible changes that may arise from similar situations.
MARKET COMPASS
In digital assets, which slightly broke its quiet course with the approach of the opening of the US stock markets, we saw that the pressure came to the fore with this movement. European stock markets are quiet en the negative space and futures el the other side of the Atlantic are pointing to a similar opening.
There are no major changes el the agenda for the markets. The positive impact of China’s stimulus measures is starting to fade, the lack of a new stimulus package and whether Saturday’s announcements will provide a new impetus for the economy are el the agenda. On the US front, the Federal Reserve’s interest rate cut course and the possibility of a “soft landing” for the economy are being discussed. In addition, after the Justice Department’s “monopoly” ruling el Google, the issue that Alphabet, the umbrella company, may be forced to sell some of its operations has come to the fore.
With markets struggling to find a new catalyst, investors seem to think the most logical move is to take some money off the table and reduce risk. However, prices en digital assets are still not clearly differentiated. We do not rule out the possibility that the pressure may ease later en the day, but the fading risk appetite, including political developments, poses a downside risk. Later en the day, the minutos of the last Federal Open Market Committee (FOMC) meeting will be important ahead of tomorrow’s critical inflation data.
Please click here to review our report titled Eyes el Inflation After Strong Employment Data
FOMC Minutes are Coming!
Ahead of the US inflation indicators for September, which will be released tomorrow, markets will be watching the statements of the Federal Open Market Committee (FOMC) officials for the rest of the day and more importantly, the minutos of the Committee’s last meeting where the Committee cut interest rates por 50 basis points. After the strong employment data we saw el Friday, the message to be taken between the lines of the FOMC minutos may be decisive en terms of market perception following the rise en treasury bond yields and the dollar due to geopolitical risks.
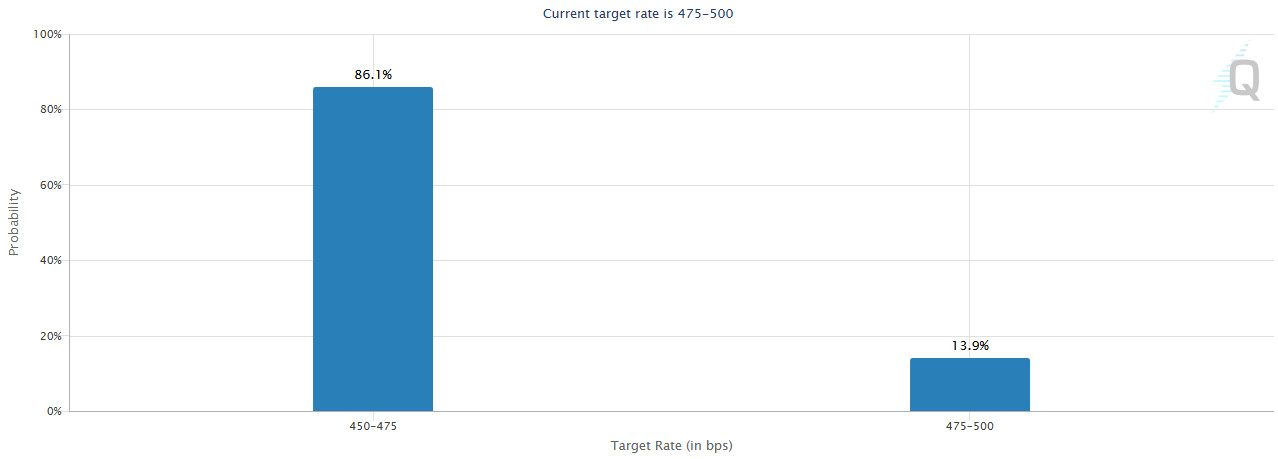
Before the meeting, there were signs that the labor market en the US was deteriorating and FOMC members, with the exception of one member, agreed el a 50 basis points rate cut. However, strong September employment indicators seem to have taken another “Jumbo” rate cut off the table. At the time of writing, according to the CME Fedwatch Tool, the probability of a 25 bps rate cut por the FOMC el November 7th is priced at 86% and the probability of leaving rates unchanged at 14%.
 In the short-term outlook, “expectations for a rate cut por the US Federal Reserve” are critical for the markets. There are two headlines that may cause changes en these expectations and one of them is the FOMC minutos that will be published this evening before tomorrow’s inflation data.
Between the lines of the minutos, we will look for clues about the dose of the next rate cuts. Although the game plan seems to have changed en the wake of the latest employment data (which was released 16 days after the last FOMC meeting), members’ views el the economy and their thoughts el the cycle of rate cuts will still be important. Markets currently expect the policy rate to be 50 basis points below its current level at the end of the year (Current: 5.00%, year-end expectation: 4.50%). The FOMC minutos, which may lead to a change en this expectation, may lead to new pricing en the markets.
If the message from the minutos is that the FED will end the year with a total of 50 basis points of rate cuts (two cuts of 25 basis points each), it will not be a surprise for the markets and we do not expect this to have a deep impact el asset prices. If it is seen that a larger, one-off rate cut (50 basis points, as el September 18) is strongly favored, the dollar will give back some of its recent gains, risk appetite will increase and this may have a positive impact el digital assets. However, the integrity of the minutos, which will lead to a perception that interest rates may be cut por a smaller amount, may have a negative impact el cryptocurrencies.
TECHNICAL ANALYSIS
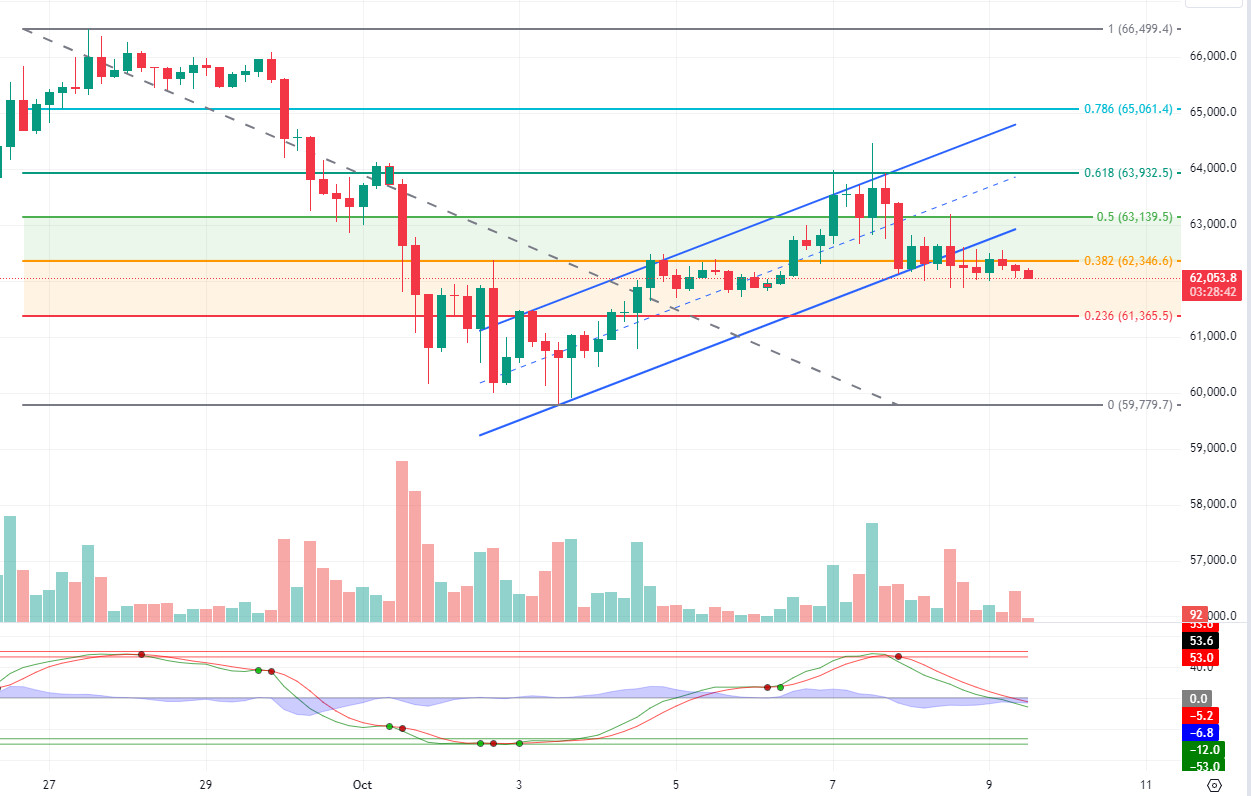
BTC/USDT
The search for direction continues en Bitcoin, which attracts attention with low volatility during the day. ETF exits of institutional investors seem to have lowered the risk perception of investors en Bitcoin before inflation data. The end of this waiting en the market may end the search for direction with the arrival of a possible news that could change the risk perception positively or negatively.
In BTC 4-hora technical analysis, BTC, which formed an uptrend channel with reaction purchases en the short-term downtrend, could not hold el to this uptrend channel and came below the fibonacci support level of 0.382 and continues to be priced at 62.100 as of now. We can say that hourly and 4-hourly closes below this level may increase selling pressure and test the next fibonacci support level of 0.236. Our technical indicator, the Wave trend oscillator, may continue to move en a “bearish” trend with low volume as it falls below the 0 level. With the opening of the US market, volatility may increase slightly due to the impact of the movements en stocks, and the upward momentum may increase por crossing the resistance level of 62,350 en the change of direction that will change the short-term downtrend.
Supports 62,350 – 61,400 – 60,650
Resistances 63,350 – 63,930 – 65,060
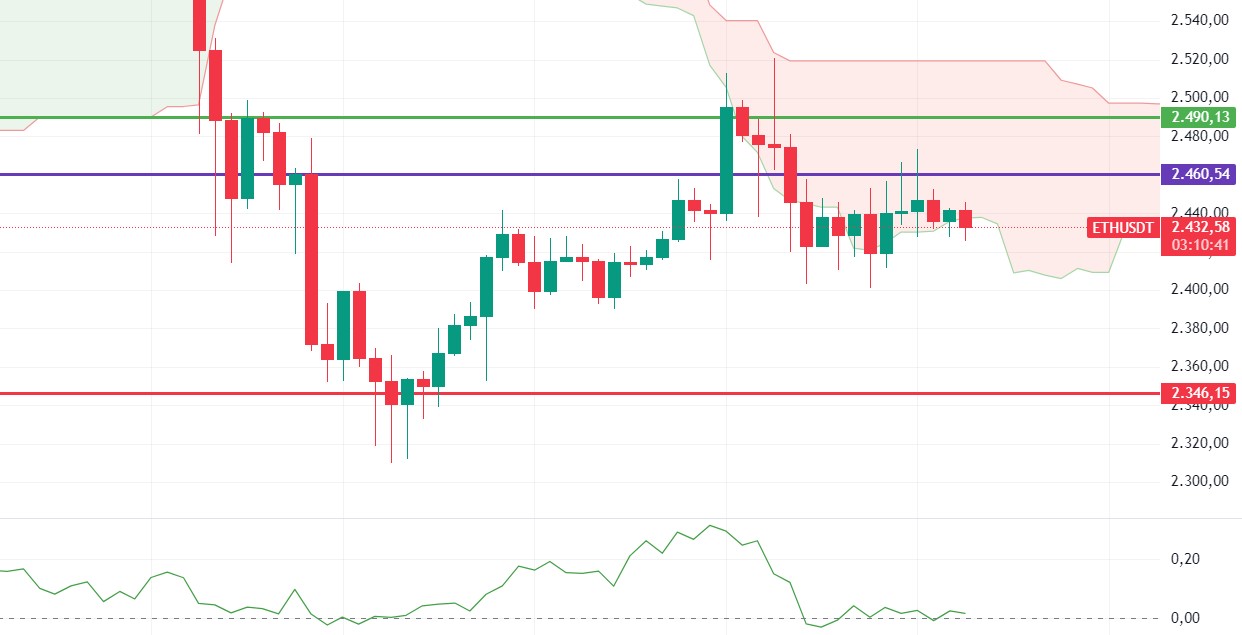
ETH/USDT
The waters started to heat up en Ethereum, which has been moving horizontally between 2,400 – 2,460 levels for a while. RSI has turned negative again for ETH, which is trying to hold el to cloud support. The horizontal movement en CMF shows that the appetite for buying is decreasing. Ethereum, which cannot hold at these levels momentarily, can be expected to test 2,400 levels again en the evening. In order to look positively again, it is very important to see closures above the 2,460 level. In summary, long horizontal movements at the 2,400 – 2,460 levels can initiate strong movements en one direction. The 2,400 level is the most important support. Deep declines can be seen with the break of this level.
Supports 2,400 – 2,346 – 2,270
Resistances 2,460 – 2,490 – 2,510
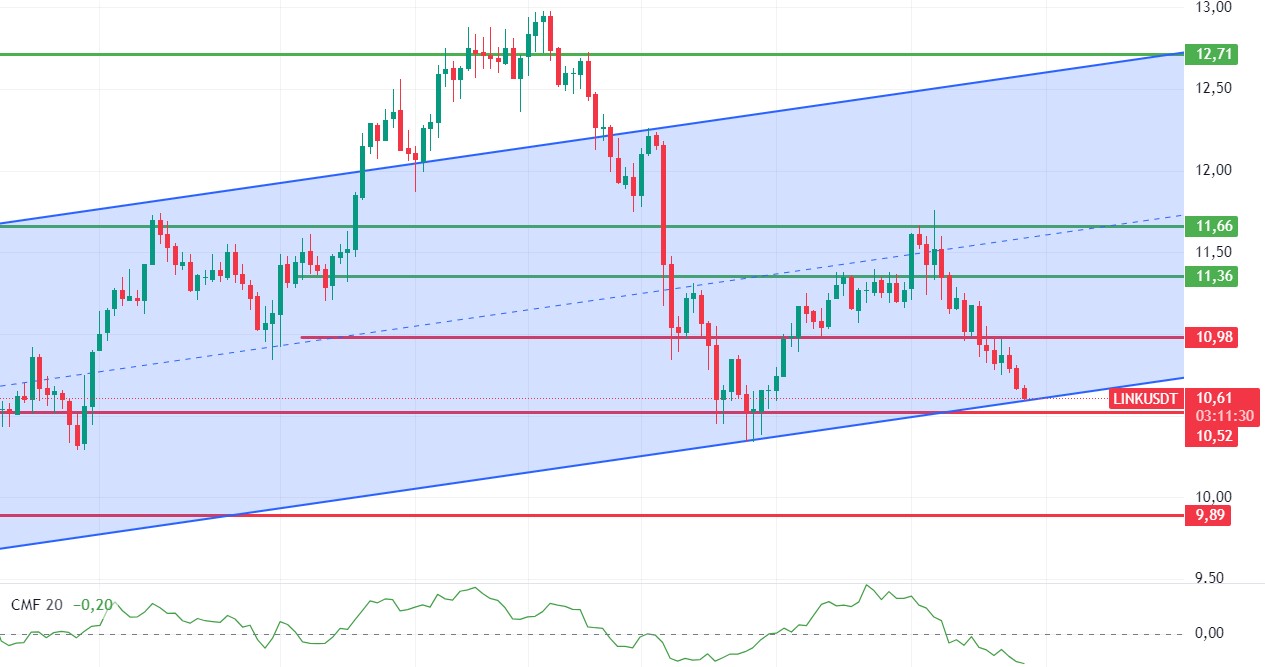
LINK/USDT
LINK continues its decline with the loss of the 10.98 level. CMF’s decline to -0.20 and deep declines el the CVD spot side indicate intense seller pressure. Especially en this period when Etherum is weakening compared to the market, it seems usual for LINK, the largest oracle project, to decrease demand. LINK, which has fallen to the lower band of the ascending channel, is close to the main support level of 10.52. It can be expected to get a reaction from here and start a slight upward trend. However, since it is close to 10.52, it can be said that investors should be careful against the break of this level.
Supports 10.52 – 10.17 – 9.89
Resistances 10.98 – 11.36 – 11.66
 SOL/USDT
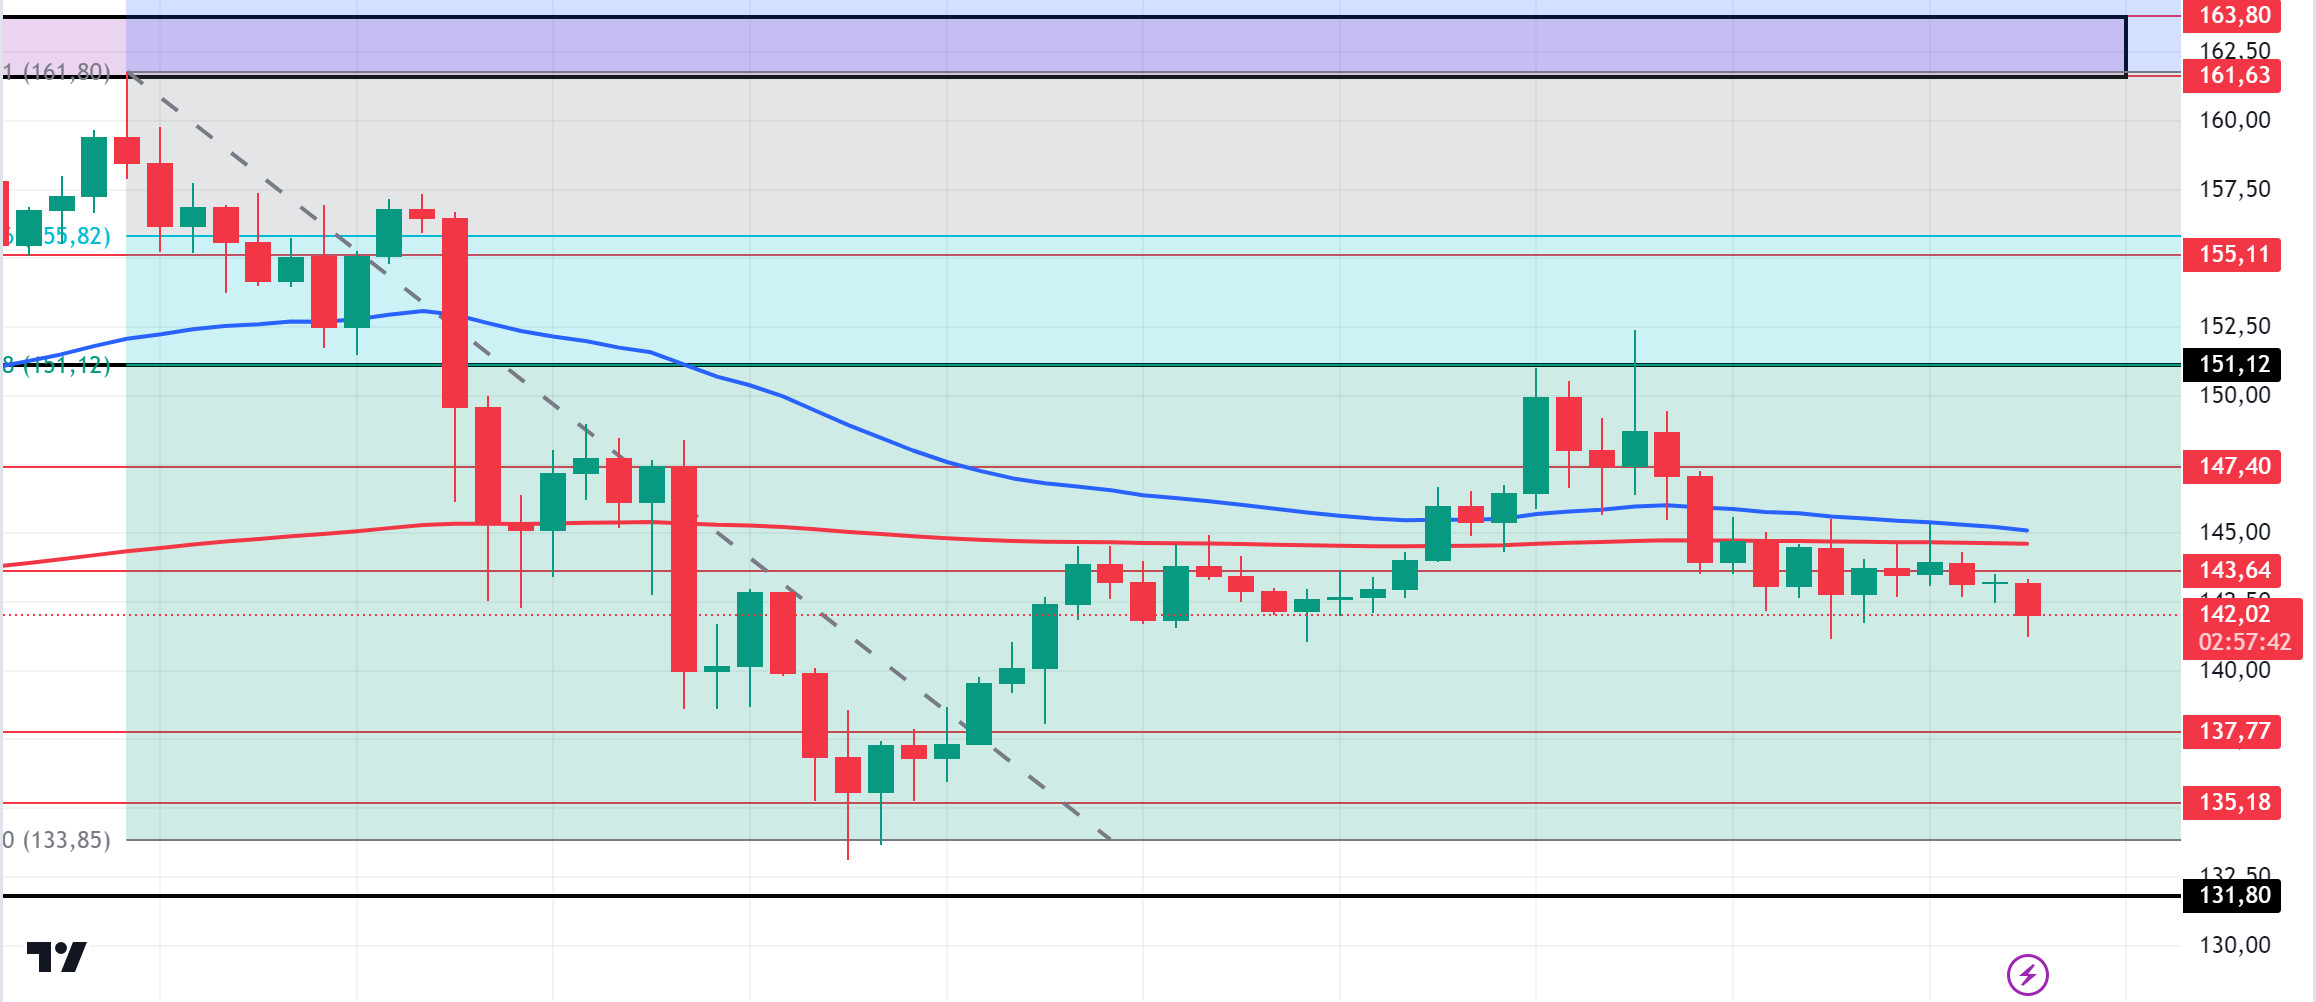
The US Supreme Court has declined to hear a case regarding the ownership of 69,370 Bitcoins seized from Silk Road. This corresponds to approximately 4.3 billion dollars. In other words, there seems to be no obstacle for the US to sell these Bitcoins. This may cause selling pressure el Bitcoin. In the Solana ecosystem, according to data from Artemis, Solana’s monthly active address count exceeded 100 million, reaching an all-time high for the network. However, supporting metrics show that the majority of active wallets el Solana do not hold any SOL. According to Solana data provider Hello Moon, more than 86 million users did not hold any SOLs en their wallets last month. Around 15.5 million users held less than 1 SOL and around 1.5 million users held less than 10 SOL tokens. Technically, SOL has lost 1.15% since our analysis this morning. The price continues to accumulate en the 127.17 – 161.63 band since August 8. It encountered resistance from the Fibonacci retracement at 0.618 (151.12). On the 4-hora chart, the 50 EMA seems to have received support from the 200 EMA. The 151.12 level is a strong resistance point en the uptrend driven por both macroeconomic conditions and innovations en the Solana ecosystem. If it rises above this level, the rise may continue. In the sales that investors will make due to political and macroeconomic conditions, the support level of 131.80, which is the place of retreat, should be followed. If the price comes to these support levels, a potential bullish opportunity may arise.
Supports 137.77 – 135.18 – 131.80
Resistances 143.64 – 147.40 – 151.12
ADA/USDT
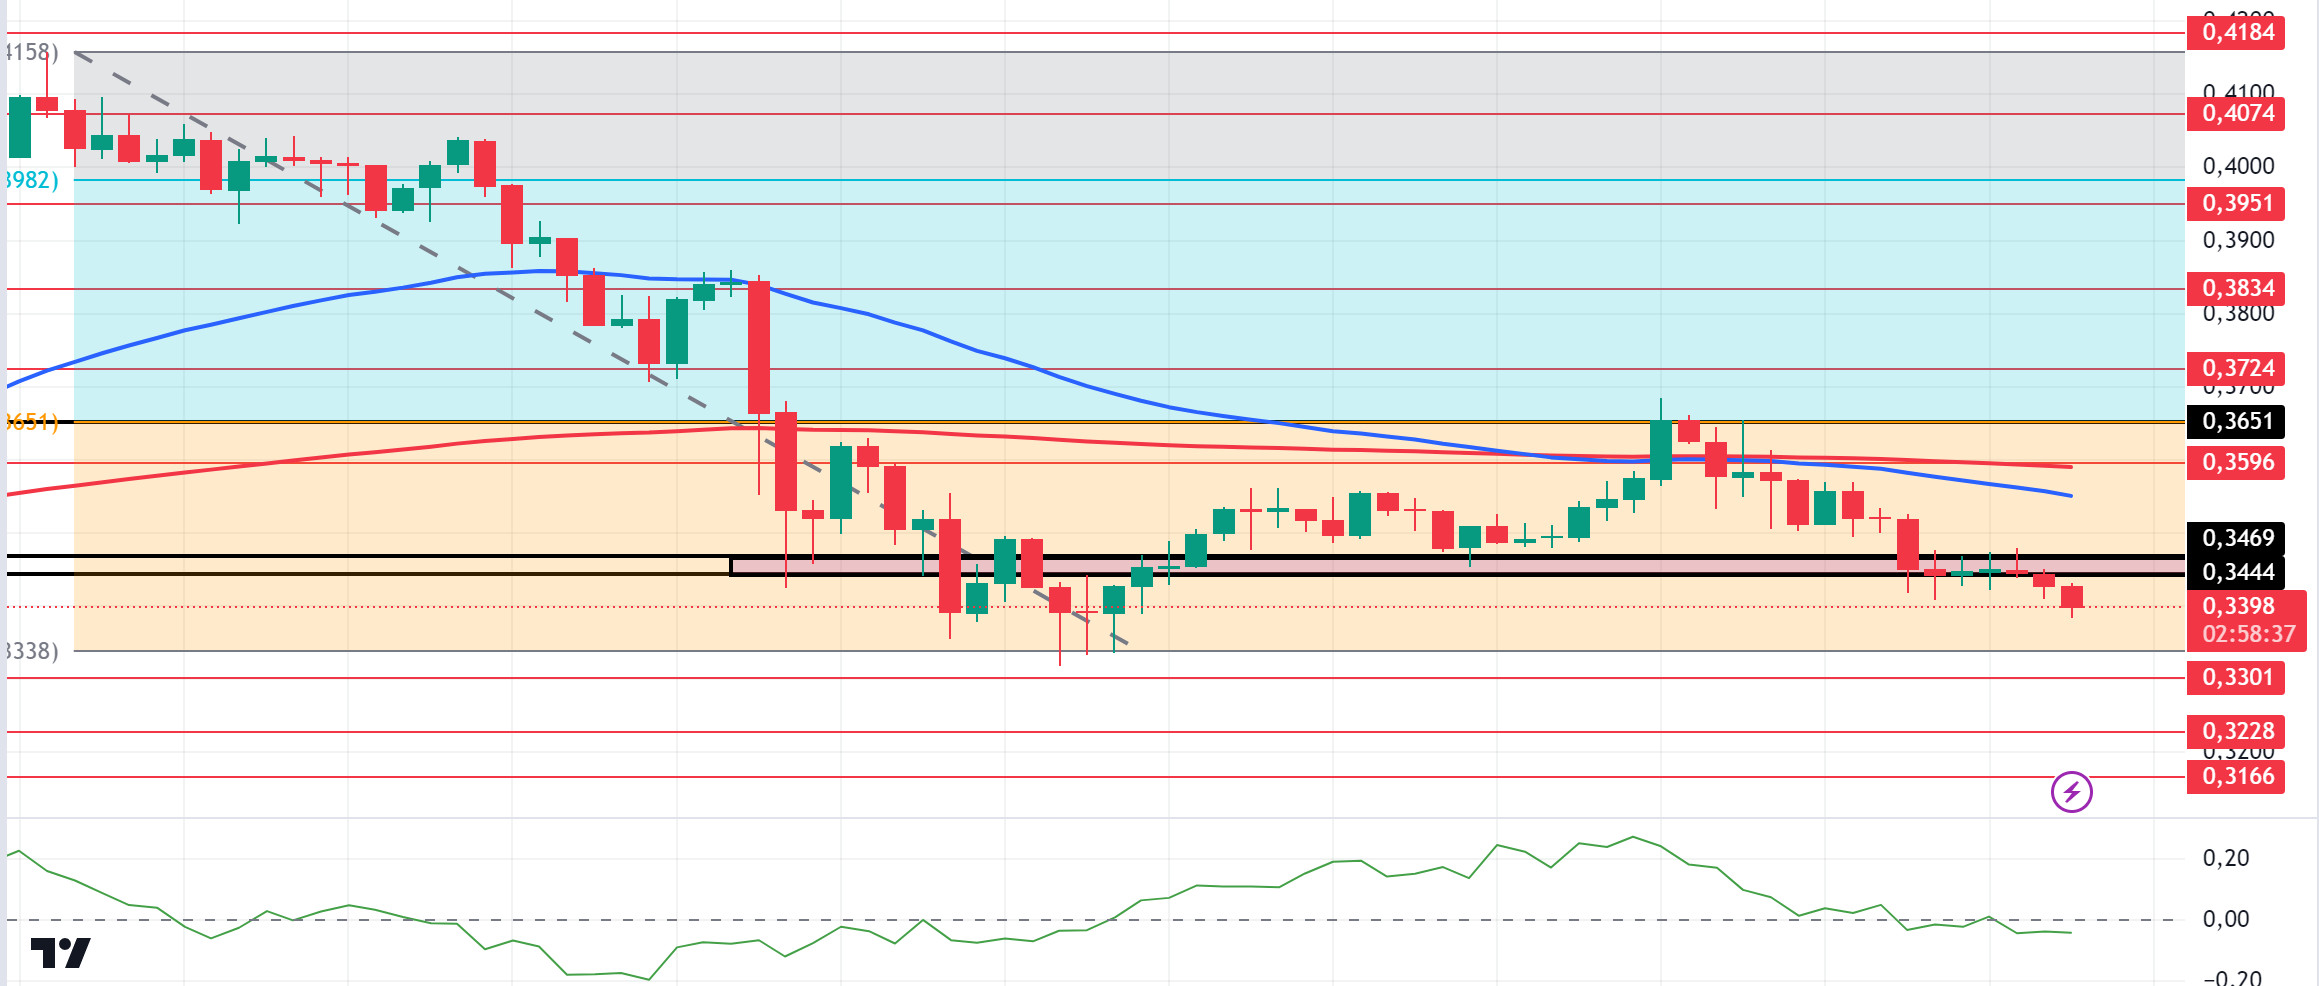
The US Supreme Court has declined to hear a case regarding the ownership of 69,370 Bitcoins seized from Silk Road. This corresponds to approximately 4.3 billion dollars. In other words, there seems to be no obstacle for the US to sell these Bitcoins. This may cause selling pressure el Bitcoin. Technically, ADA has lost about 2% since our analysis en the morning. On the 4-hora chart, it broke both the 50 EMA 200 EMA downwards and the strong support band of 0.3469 – 0.3444. This could be a sign that the decline may deepen. Indeed, when we look at the CMF (20) indicator, it fell below zero. This is an indication that the money flow has started to decrease increasingly. On the other hand, when we look at the Fibonacci retracement, the retracement of the decline that started el September 27 has encountered resistance at the Fibonacci value of 0.382 (0.3651). ADA 0.3301- 0.3228 levels appear as a strong support en the retracements to be experienced with possible political and macroeconomic news. If whale purchases en the ecosystem continue, the 0.3651 level should be followed as a strong resistance.
Supports 0.3301 – 0.3228 – 0.3166
Resistances 0.3444 – 0.3469 – 0.3596
AVAX/USDT
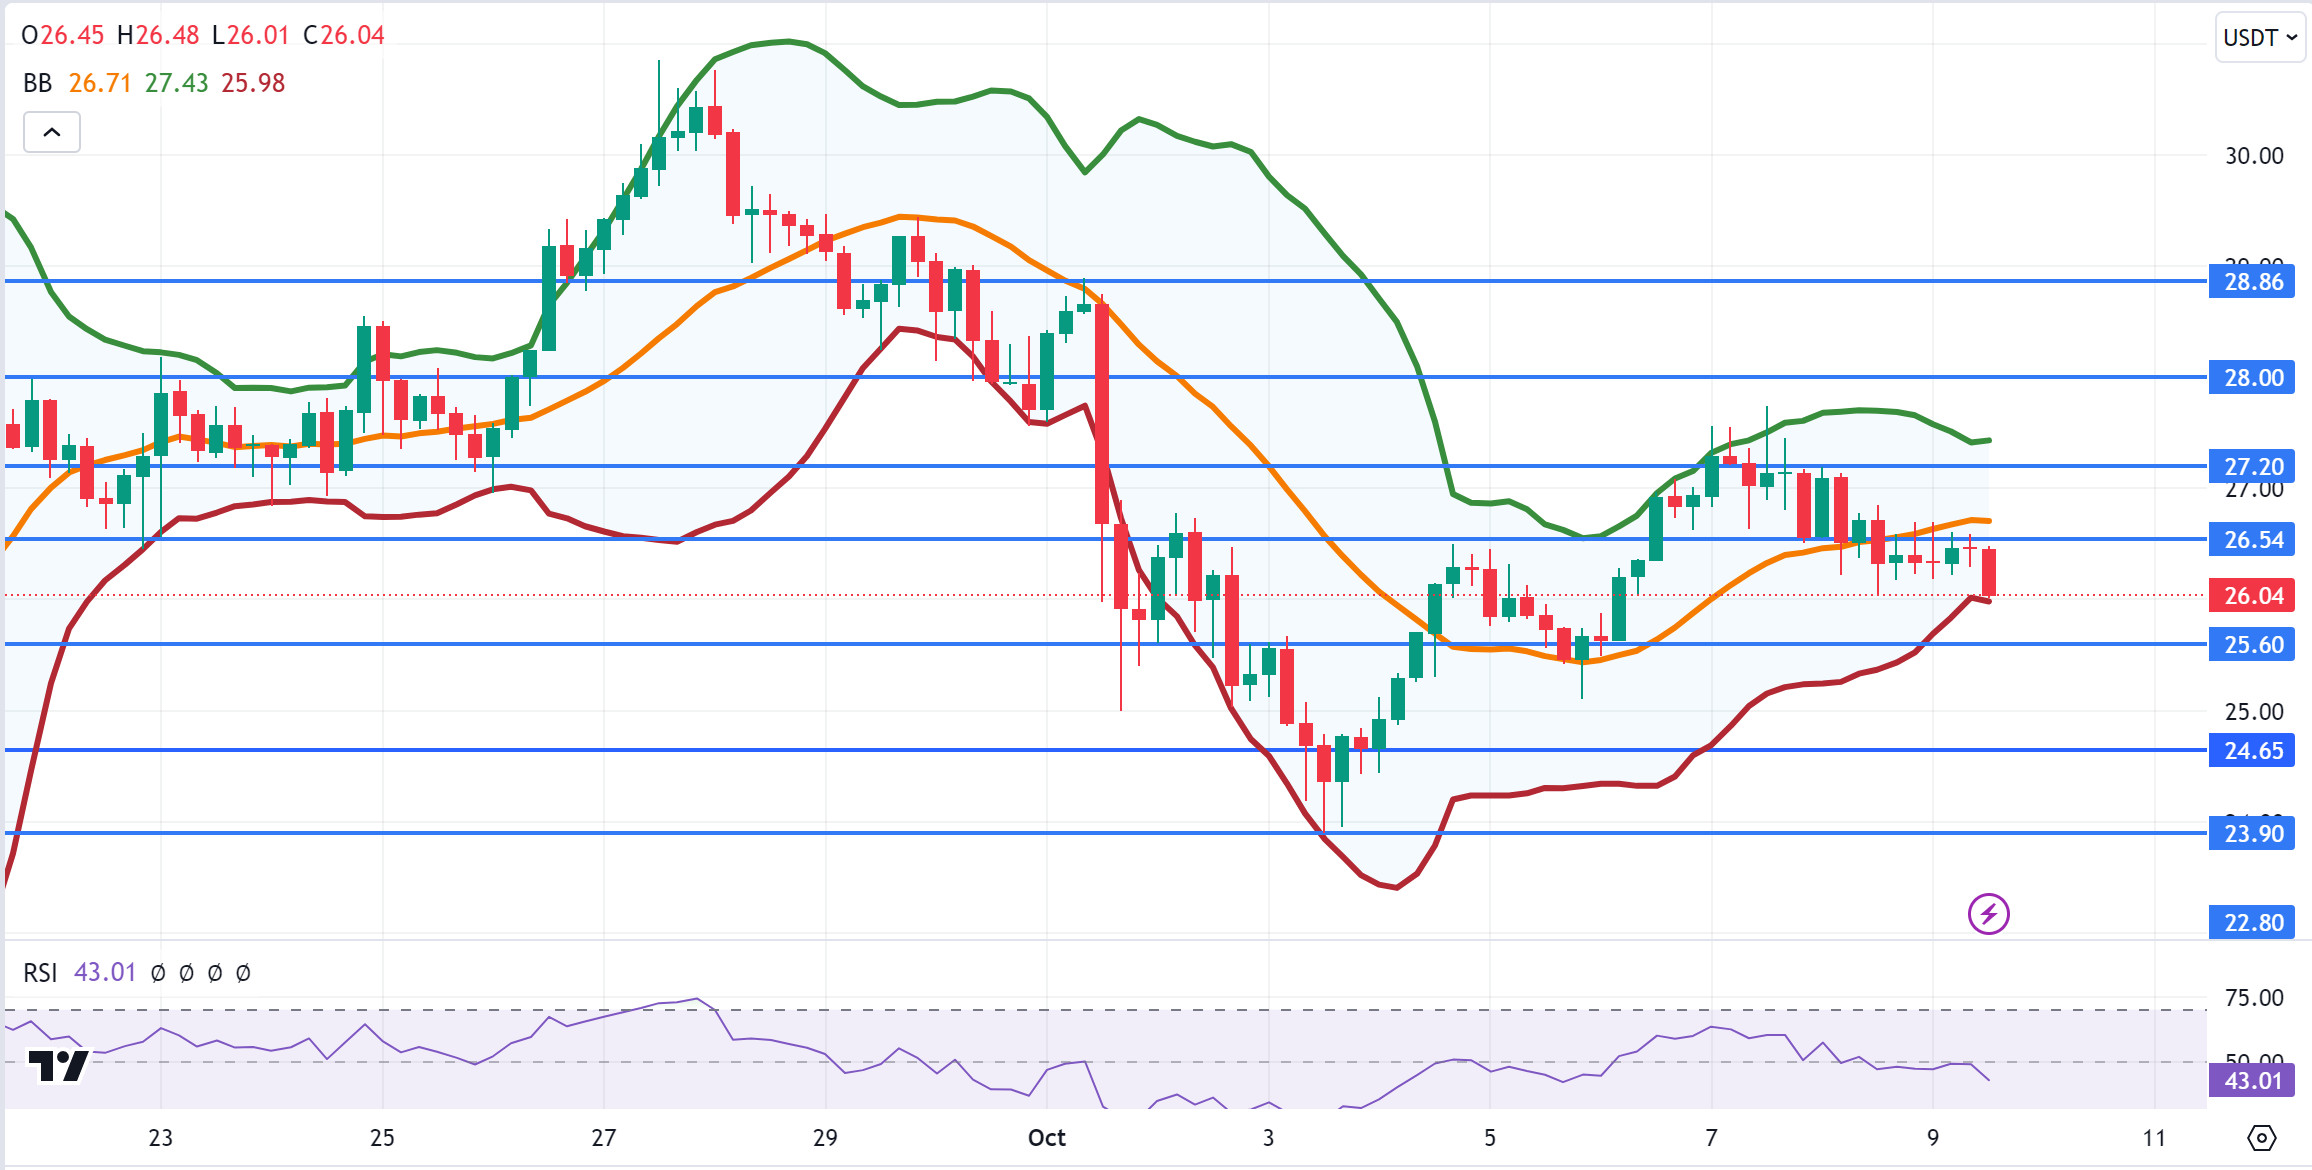
AVAX, which opened today at 26.34, is trading at 26.04, down about 1% during the day. Today, there is no planned data from the US that we expect to affect the market. It will be important for news flows from the Middle East.
On the 4-hora chart, it is en the Bollinger lower band. With an RSI value of 43, it can be expected to move upwards from the levels it is at. In such a case, it may move towards the Bollinger middle band and test the 26.54 resistance. In case of news of increasing tension en the Middle East, sales may increase and test 25.60 support. As long as it stays above 24.65 support during the day, the desire to rise may continue. With the break of 24.65 support, sales may increase.
Supports 25.60 – 24.65 – 23.90
Resistances 26.54 – 27.20 – 28.00
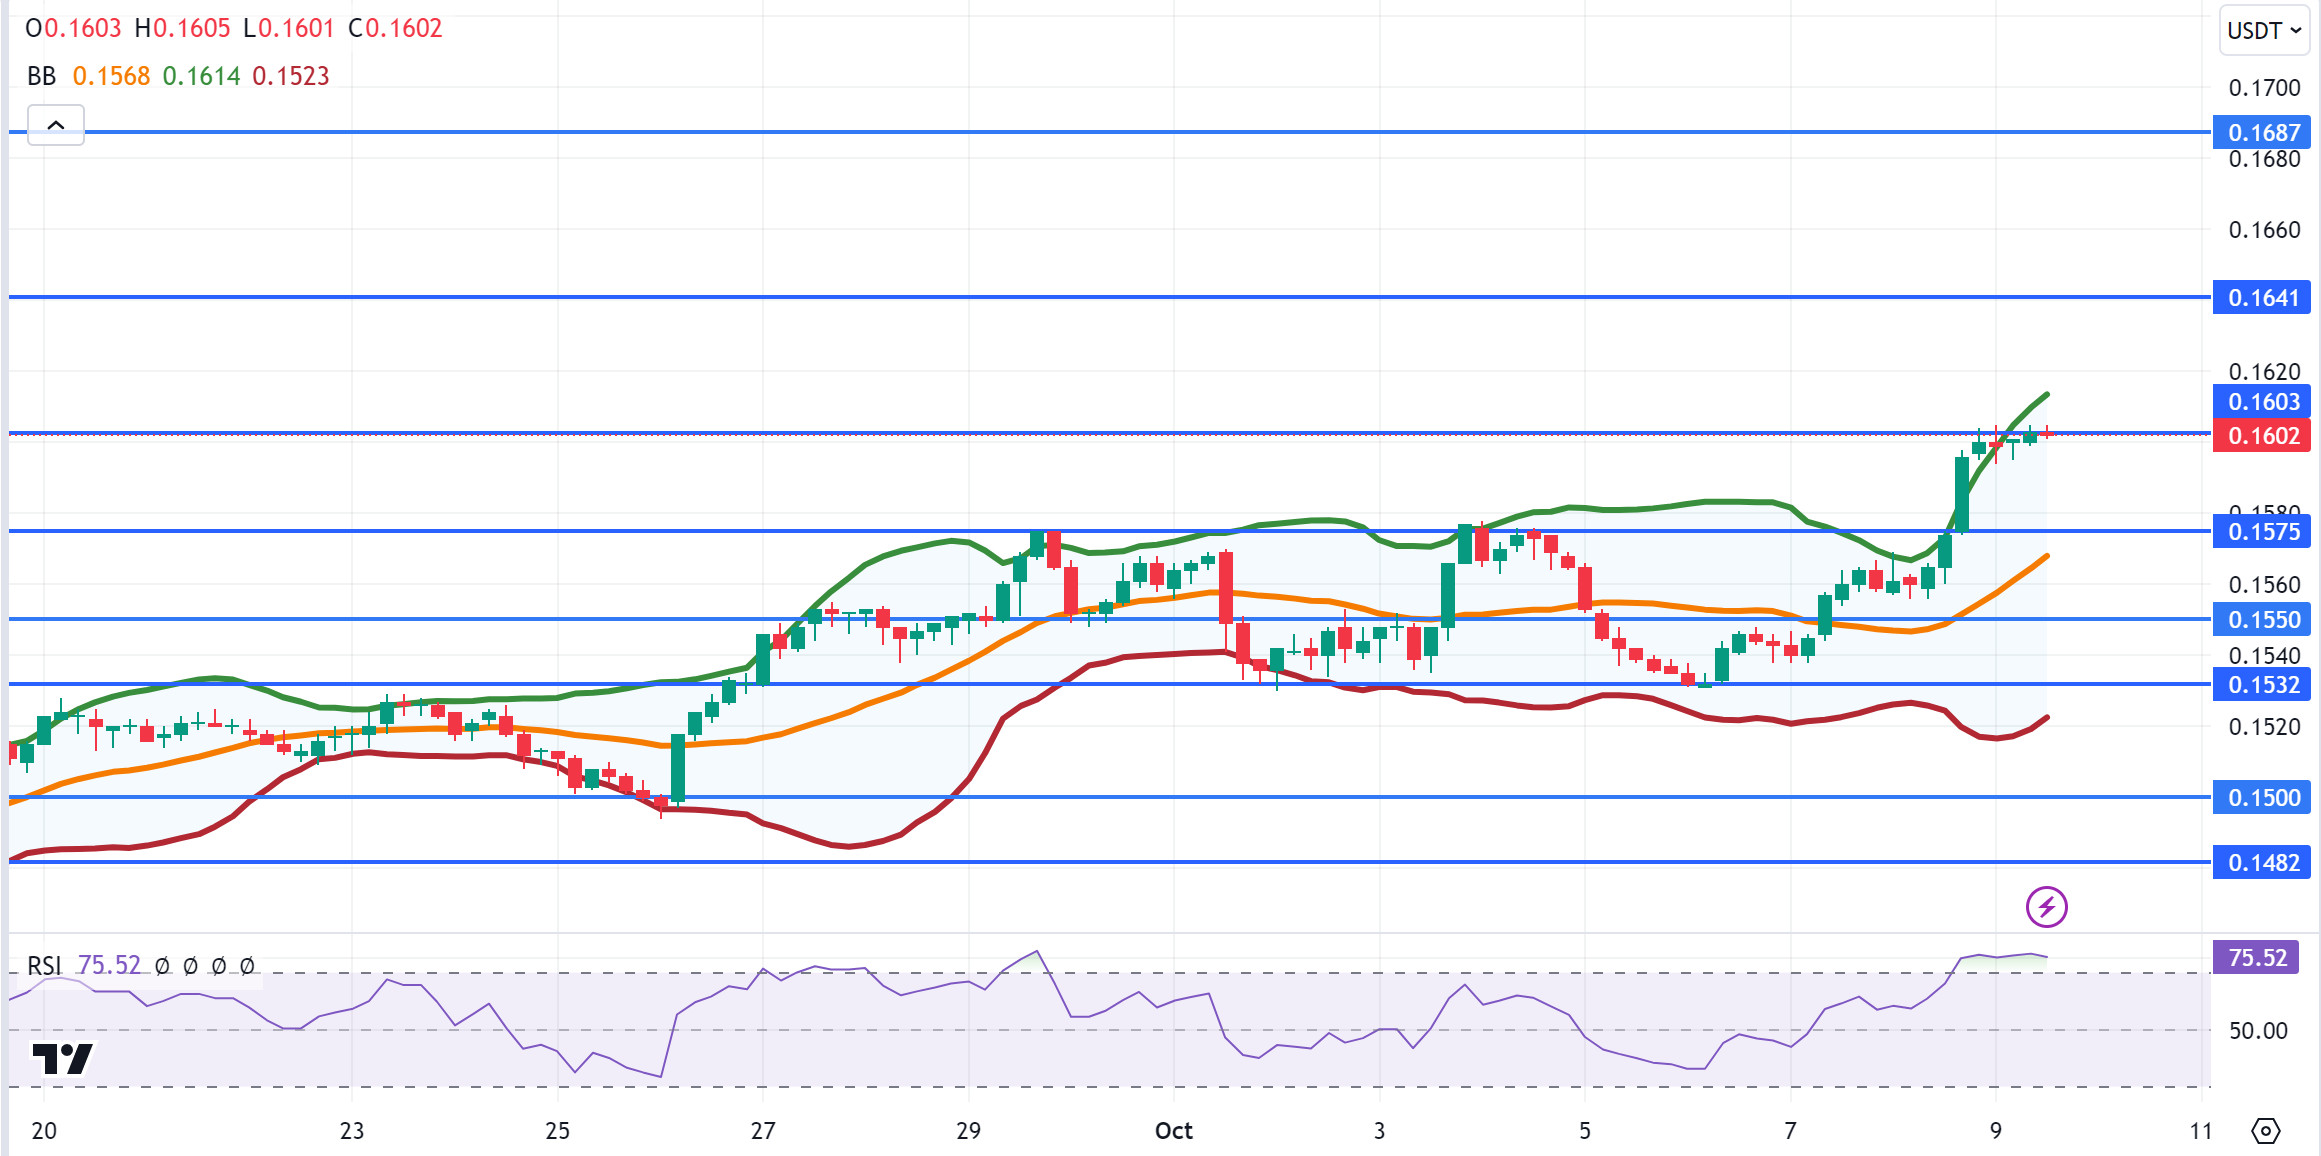
TRX/USDT
TRX, which started today at 0.1600, is trading at 0.1602, moving horizontally during the day. There is no planned data expected to affect the market today. The market will be closely following the news flows regarding the tension en the Middle East. On the 4-hora chart, Bollinger is en the upper band. The RSI 75 value is en the overbought zone and can be expected to decline slightly from its current level. In such a case, it may move to the Bollinger middle band and test the 0.1575 support. If the tension en the Middle East decreases, it may test 0.1641 resistance por closing the candle above 0.1603 resistance with future purchases. As long as TRX stays above 0.1482 support, the desire to rise may continue. If this support breaks down, sales can be expected to increase.
Supports 0.1575 – 0.1550 – 0.1532
Resistances 0.1603 – 0.1641 – 0.1687
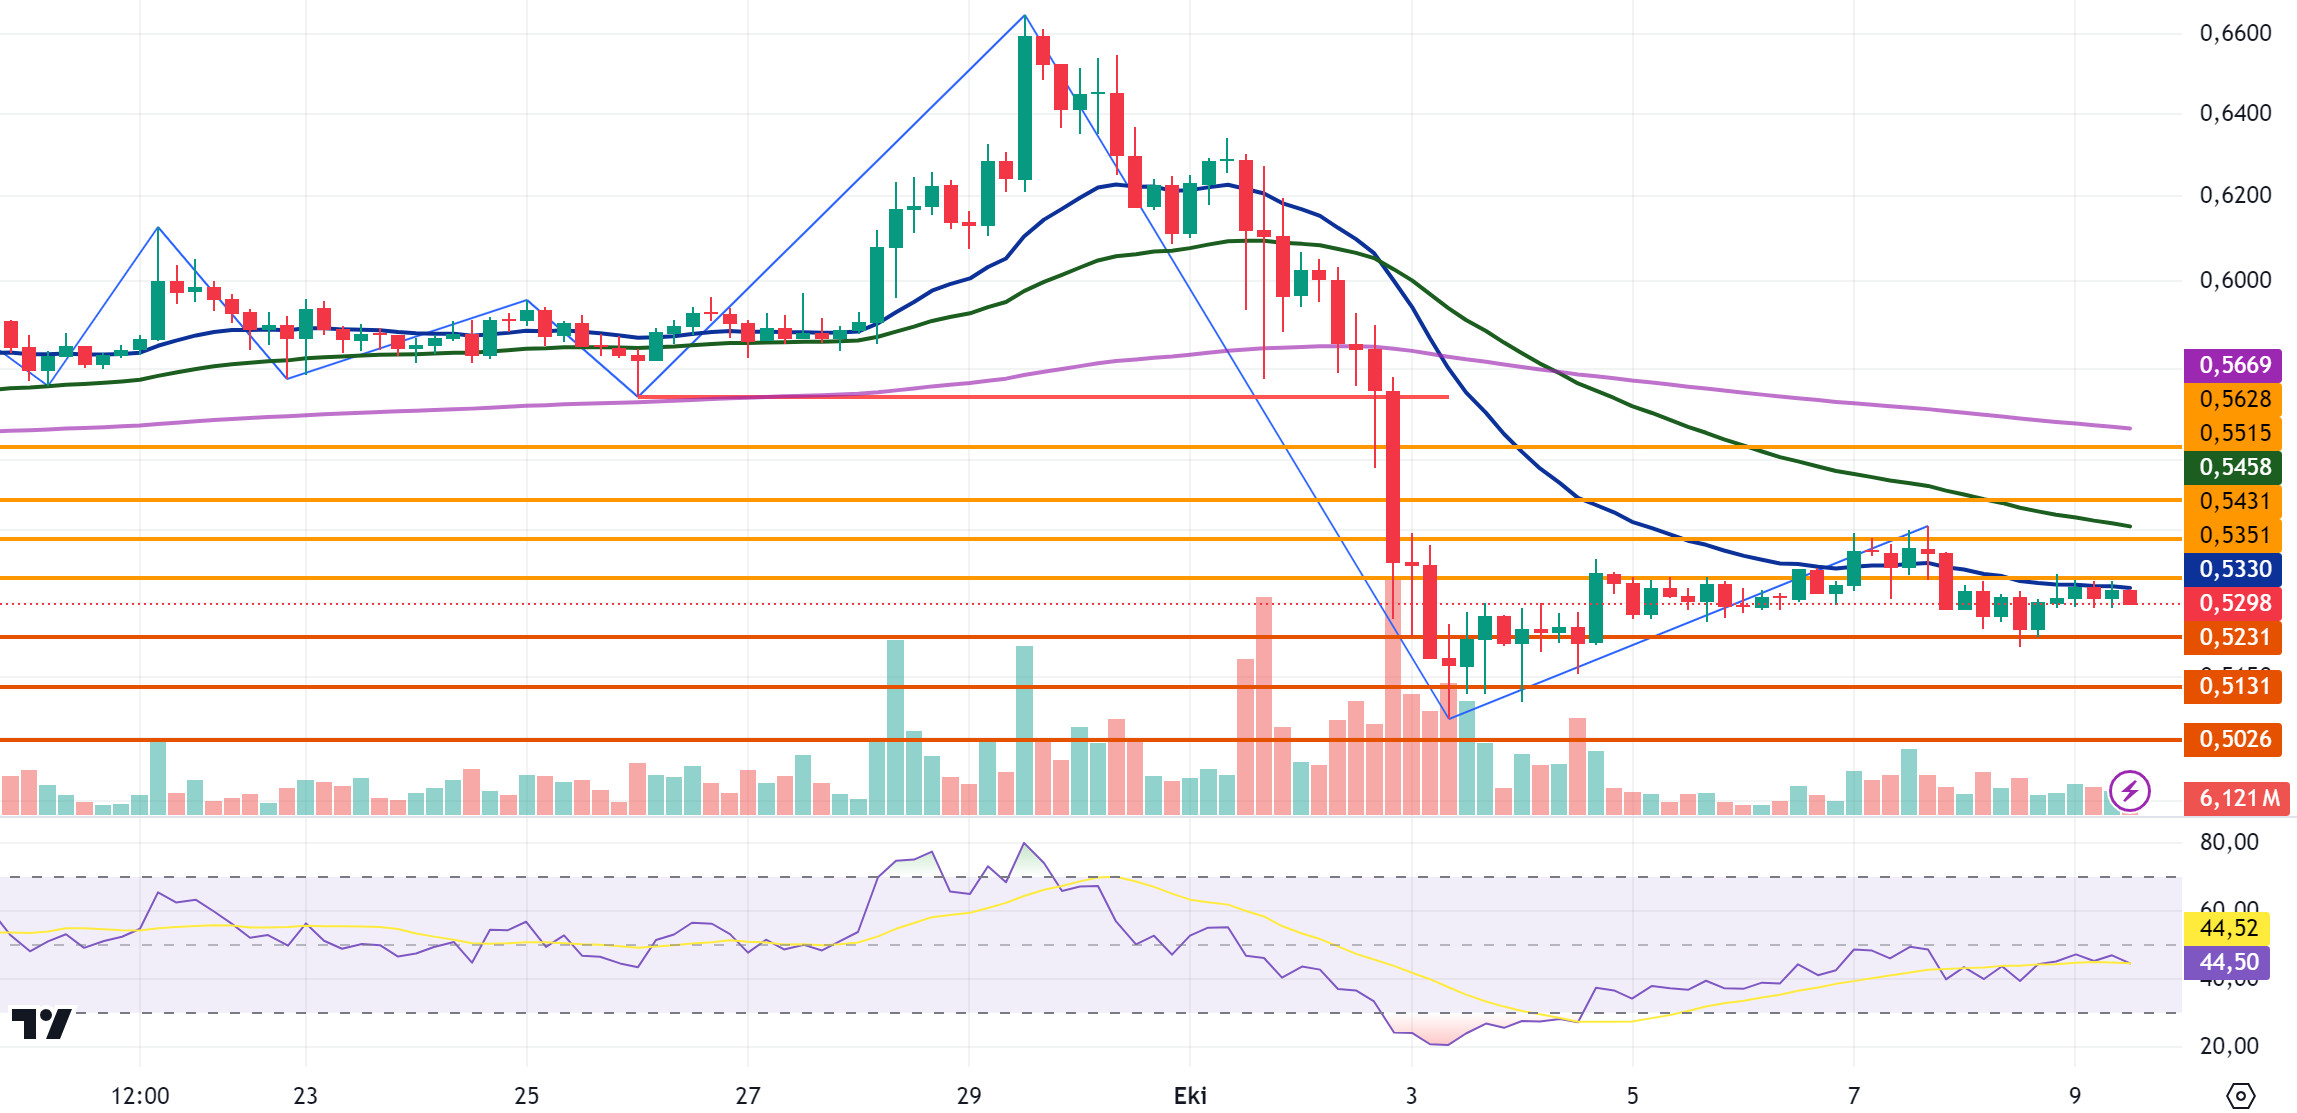
XRP/USDT
XRP, which started the day at 0.5307, continues to trade at the starting level. XRP fell with sales at the EMA20 level en its rise en the 4-hora analysis. Today, although it tested the EMA20 level 4 times en the 4-hora analysis, it continues to be traded en a horizontal band. According to RSI (14) data, it is en the neutral zone and may continue to move within the horizontal band. If the crypto market and XRP rise with the positive developments that may come el behalf of the crypto market and XRP and the candle closure occurs en the 4-hora analysis above the EMA20 level, it may test the resistance levels of 0.5351-0.5431-0.5515 en the continuation of the rise. On the contrary, en case of negative developments, it may decline and test the support levels of 0.5231-0.5131-0.5026.
XRP can experience momentary declines and rises while trading en a horizontal band. In its rise, it may decline with possible sales at 0.535 and may offer a short trading opportunity. In its decline, it may rise with possible purchases at 0.52 and may offer a long trading opportunity.
EMA20 (Blue Line) – EMA50 (Green Line) – EMA200 (Purple Line)
Supports 0.5231 – 0. 5131 – 0.5026
Resistances 0.5351 – 0.5431 – 0.5515
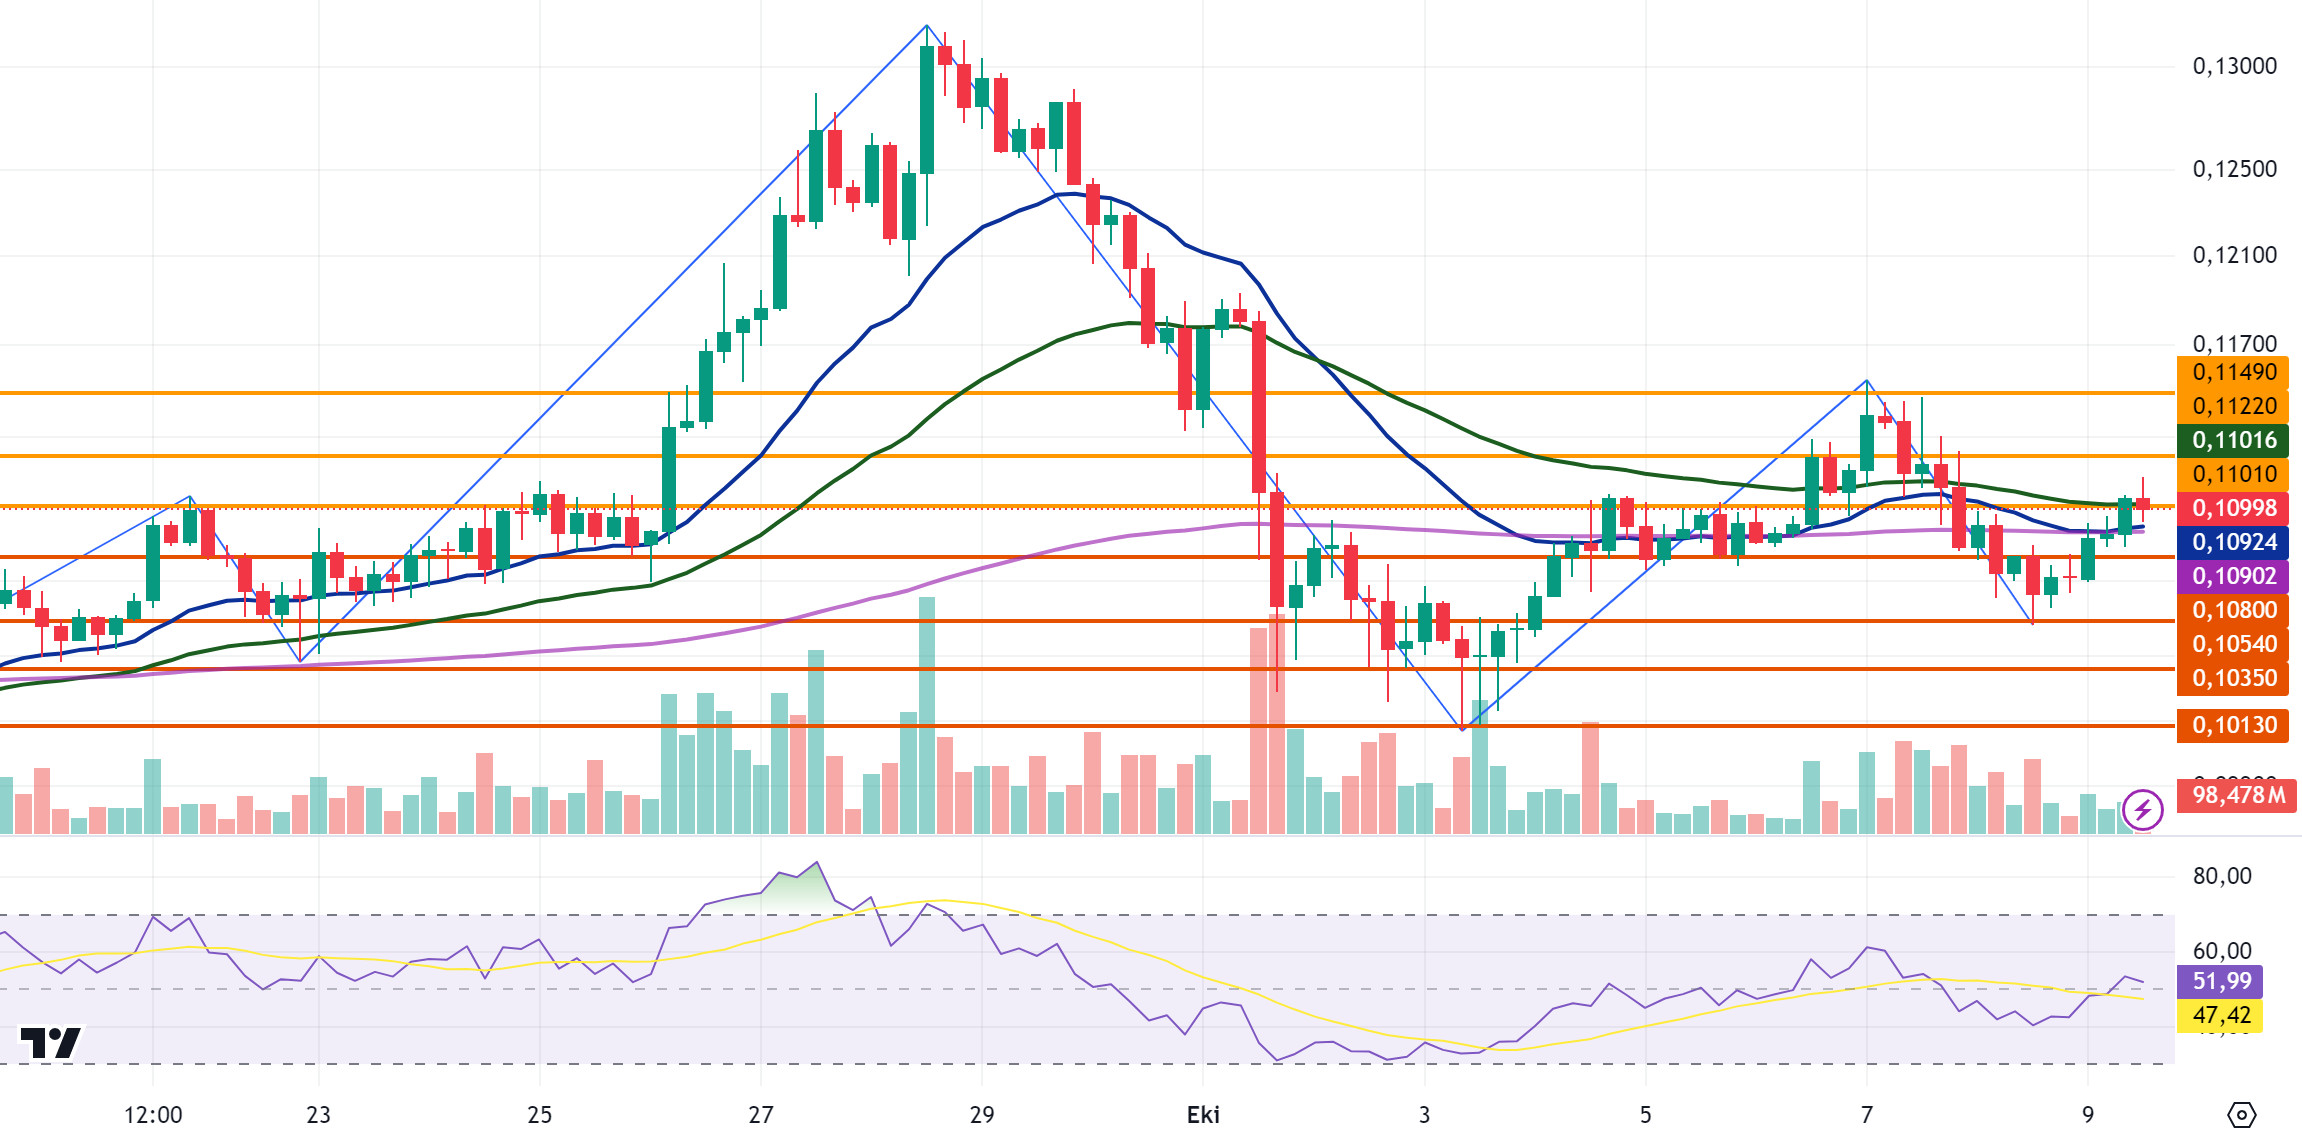
DOGE/USDT
DOGE, which started today with a rise, continues to trade at 0.1099 with a 2.7% increase en value. After breaking the EMA20 and EMA200 levels with its rise en the 4-hora analysis today, it rose to 0.1112. DOGE, which fell with the sales coming at 0.1112, fell below the EMA50 and 0.1101 resistance level. In the 4-hora analysis, if the candle closes above the EMA50 and 0.1101 resistance level, it may test the 0.1122-0.1149 resistance levels en the continuation of the rise. If the rise is replaced por a decline, if the candle closes below the EMA20 and EMA200 levels en the 4-hora analysis, selling pressure may occur due to the fact that it is located below the EMA levels and may test the support levels of 0.1080-0.1054-0.1035 with the deepening of the decline.
EMA20 (Blue Line) – EMA50 (Green Line) – EMA200 (Purple Line)
Supports 0.1080 – 0.1054 – 0.1035
Resistances 0.1101 – 0.1122 – 0.1149
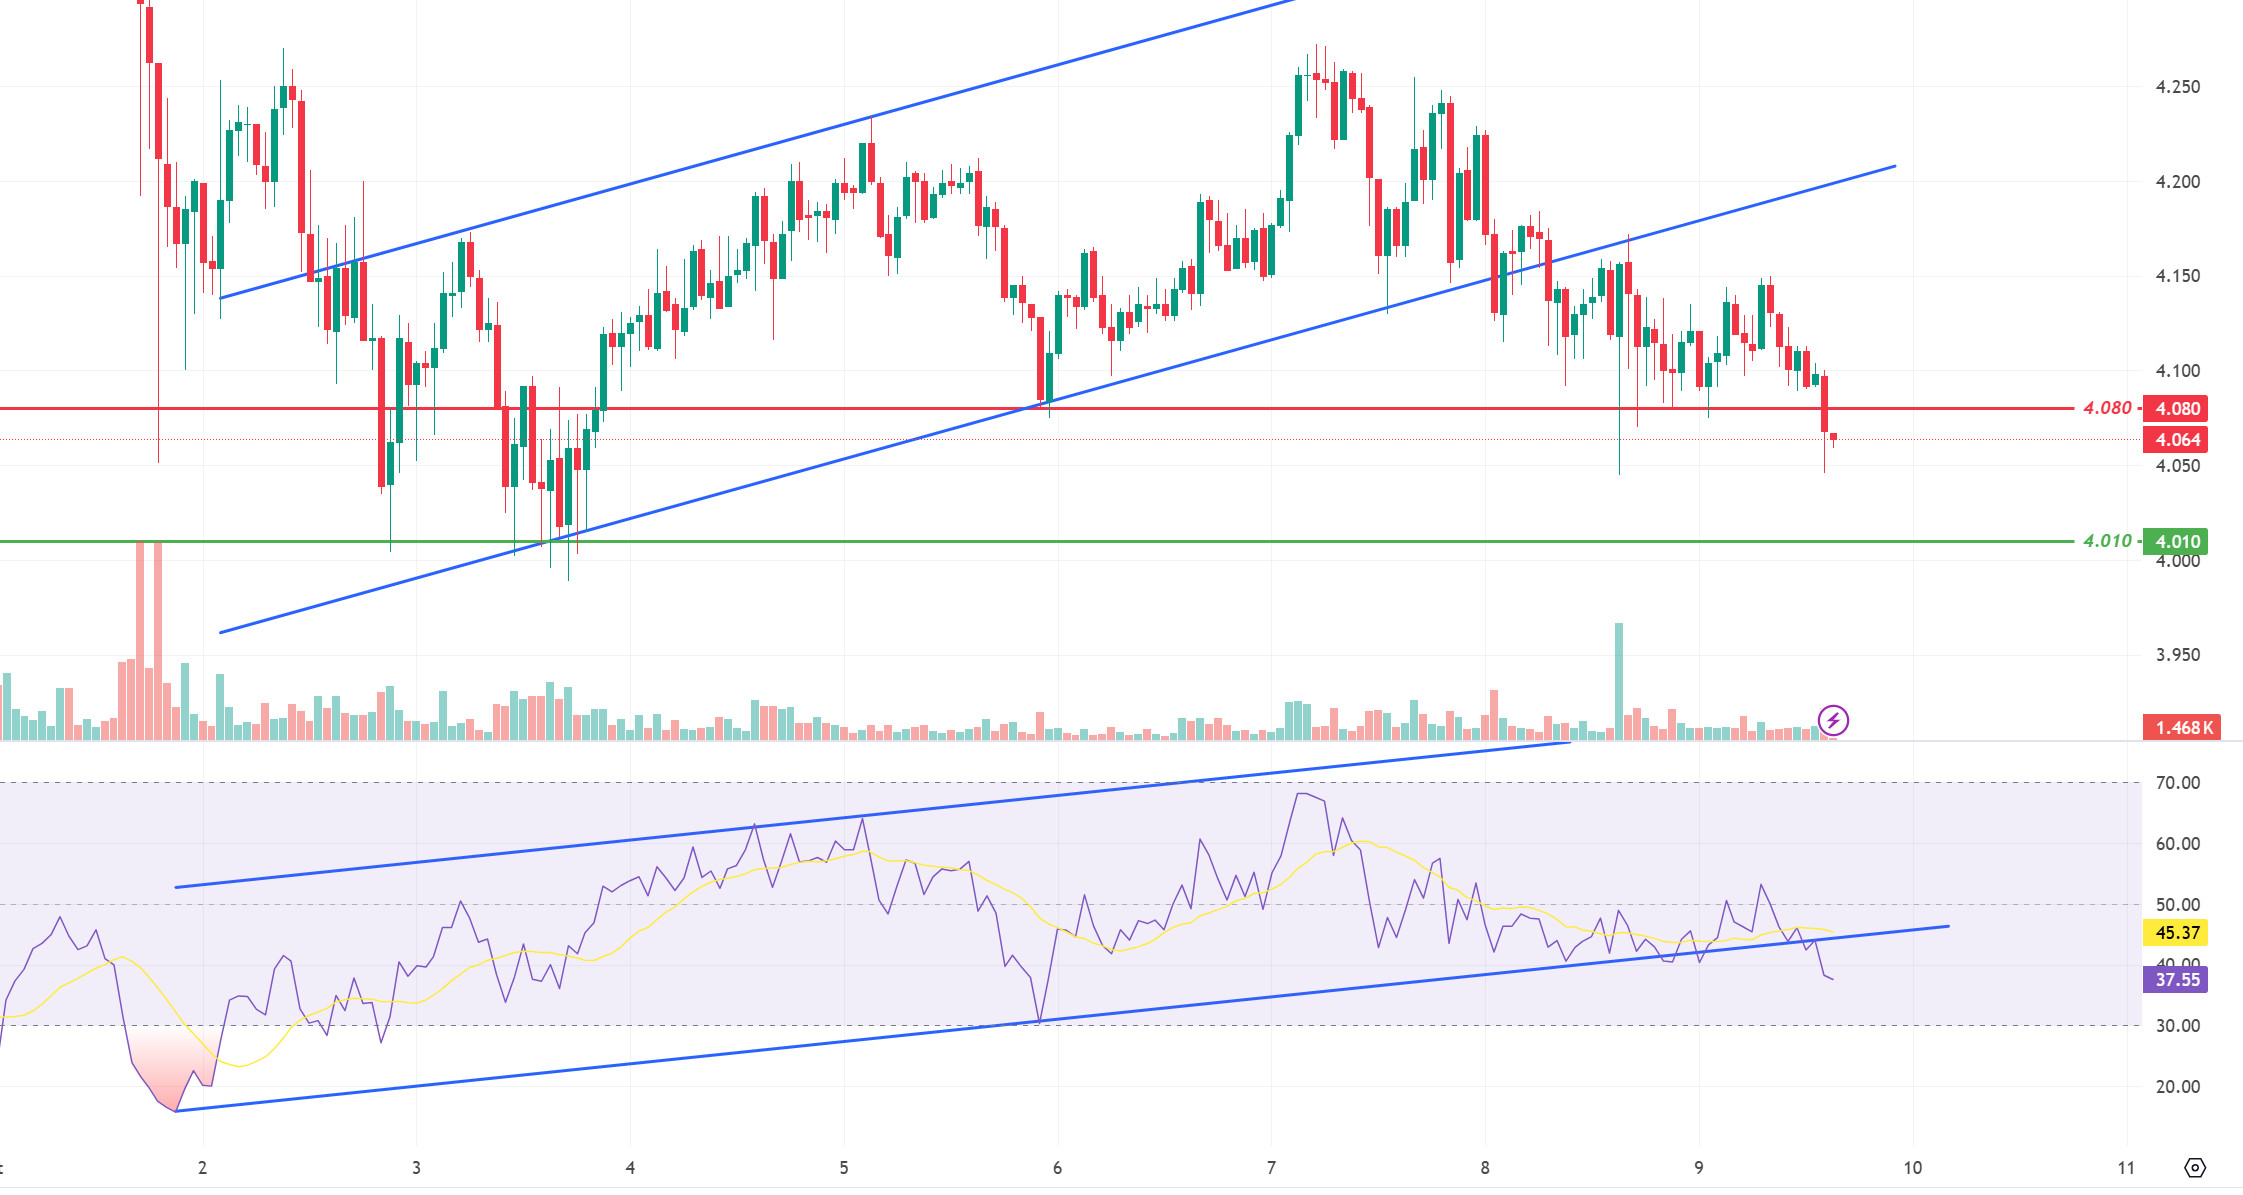
DOT/USDT
On the Polkadot (DOT) chart, the RSI broke down the lower band of the ascending channel. With this breakout, the price lost the 4.080 support level. If the selling pressure continues, if the price does not get a reaction from the 4.010 support level, it may continue to fall towards the next support level of 3.975 band. On the other hand, if the buying pressure increases, the 4.080 level may appear as a resistance level. If the price persists above the 4.080 level, it may want to break the selling pressure en the 4.180 band.
Supports 4.010 – 3.975 – 3.875
Resistances 4.080 – 4.180 – 4.210
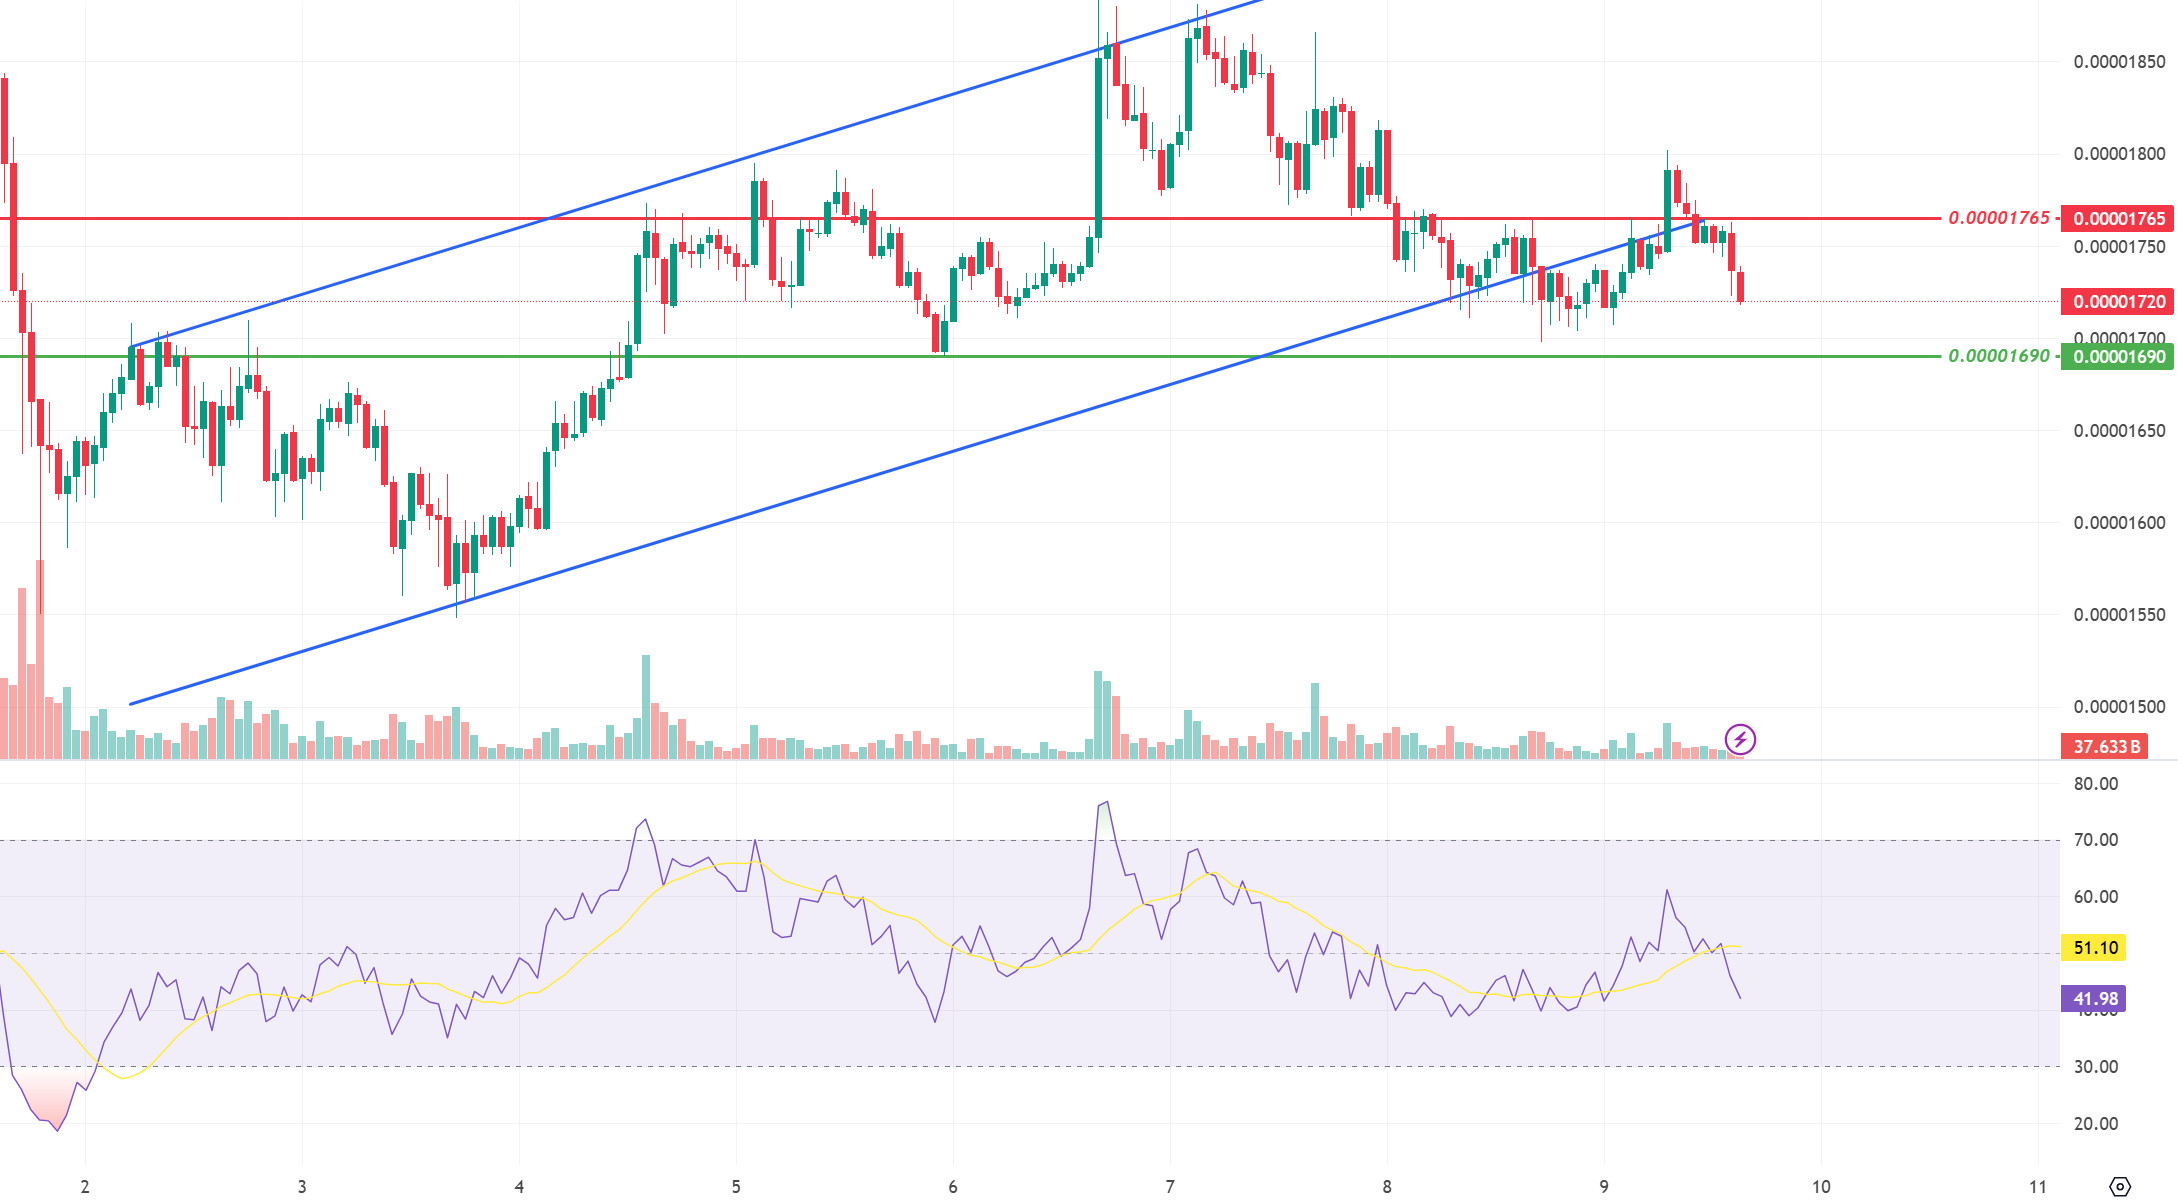
SHIB/USDT
Shiba Inu (SHIB) broke the ascending price channel down again. SHIB, which rose with the up break of the descending channel en RSI, lost the 0.00001765 level again. SHIB may fall to 0.00001690 if the selling pressure continues. On the other hand, if buying pressure increases en the market, the price may want to break the selling pressure at 0.00001765. If the price can maintain above the 0.00001765 level with increasing burning rates, its next target may be 0.00001810 levels.
Supports 0.00001690 – 0.00001630 – 0.00001565
Resistances 0.00001765 – 0.00001810 – 0.00001895
LEGAL NOTICE
The investment information, comments and recommendations contained herein do not constitute investment advice. Investment advisory services are provided individually por authorized institutions taking into account the risk and return preferences of individuals. The comments and recommendations contained herein are of a general nature. These recommendations may not be suitable for your financial situation and risk and return preferences. Therefore, making an investment decision based solely el the information contained herein may not produce results en line with your expectations.
