
MARKET SUMMARY
Latest Situation en Crypto Assets
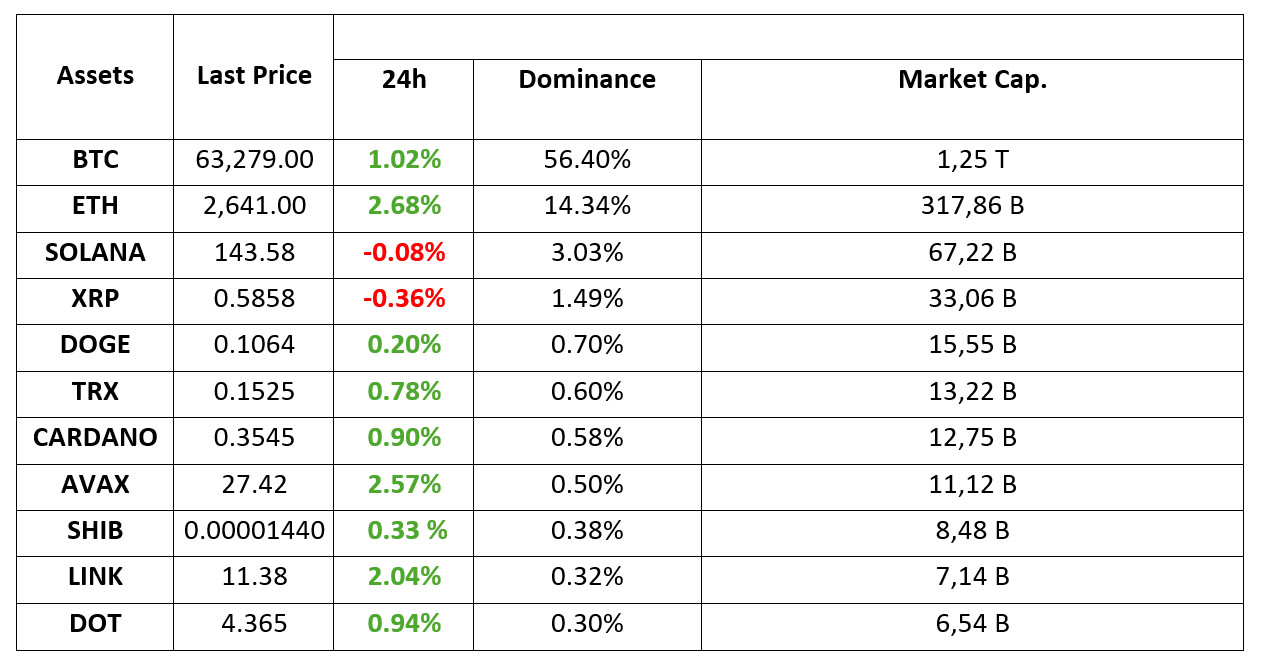
*Prepared el 23.09.2024 at 14:00 (UTC)
WHAT’S LEFT BEHIND
Bernstein analysts
While Bitcoin hit the $65,000 mark en the morning horas, analysts at asset management firm Bernstein believe that the rises will continue. In a client note shared today, the company’s analysts wrote that there are many reasons for Bitcoin to move up.
Fed’s 50 basis points benefit crypto funds
Cryptocurrency funds ended last week with a plus of 321 million dollars. Bitcoin funds again received the most investment with $ 284 million, while Ether funds had outflows again, as en the recent period.
New Statement from Fed Official
Fed member Raphael Bostic stated that despite signs of weakening en the labor market, the market is still strong. He emphasized that they are el the path to price stability and that inflation is contracting, especially en the housing sector. He also stated that high interest rates create two risks that need to be balanced.
HIGHLIGHTS OF THE DAY
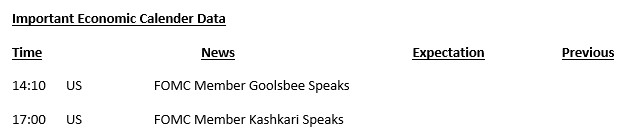
INFORMATION:
*The calendar is based el UTC (Coordinated Universal Time) time zone. The economic calendar content el the relevant page is obtained from reliable news and data providers. The news en the economic calendar content, the date and time of the announcement of the news, possible changes en the previous, expectations and announced figures are made por the data provider institutions. Darkex cannot be held responsible for possible changes that may arise from similar situations.
MARKET COMPASS
In global markets, macroeconomic indicators and statements por central bank officials remain en focus. There is a balancing trend en the markets after the “strong” interest rate cut por the US Federal Reserve (FED). Despite the poor PMI data from the continent, there is no sharp sell-off en European stock markets and there is a horizontal trend. US stock markets have a similar outlook. Digital assets, el the other hand, gave back some of the gains recorded yesterday and early this morning.
Purchasing Managers’ Indices (PMI) en Europe fell short of expectations. This may indicate that the European Central Bank (ECB) may have to loosen monetary policy faster. As it will be remembered, the surprise interest rate cut por the People’s Bank of China (PBOC) was el the agenda en the morning horas. On the other hand, we also saw statements from FED officials that interest rates should continue to be cut. On the PMI data front, we did not see much different figures from the US than the European data set and we saw figures below expectations.
The data and statements we saw el the first working day of the week were supportive of the current situation and market psychology. Therefore, we consider it normal that it did not create a basis for a new pricing. The most important development of the week seems to be the PCE Price Index from the US el Friday. Although Chairman Powell has a scheduled speech, it is not very likely that he will give a new direction. From this point of view, we can say that this data has the potential to provide detailed information about the FED’s next move.
If the current equation continues to work, the main direction en digital assets seems to be up. However, as we mentioned en our previous analysis, intermediate corrections will be monitored again en accordance with the nature of the market. We evaluate the recent pullback within this framework. Later en the day, statements from the Federal Open Market Committee (FOMC) officials will remain under scrutiny.
TECHNICAL ANALYSIS
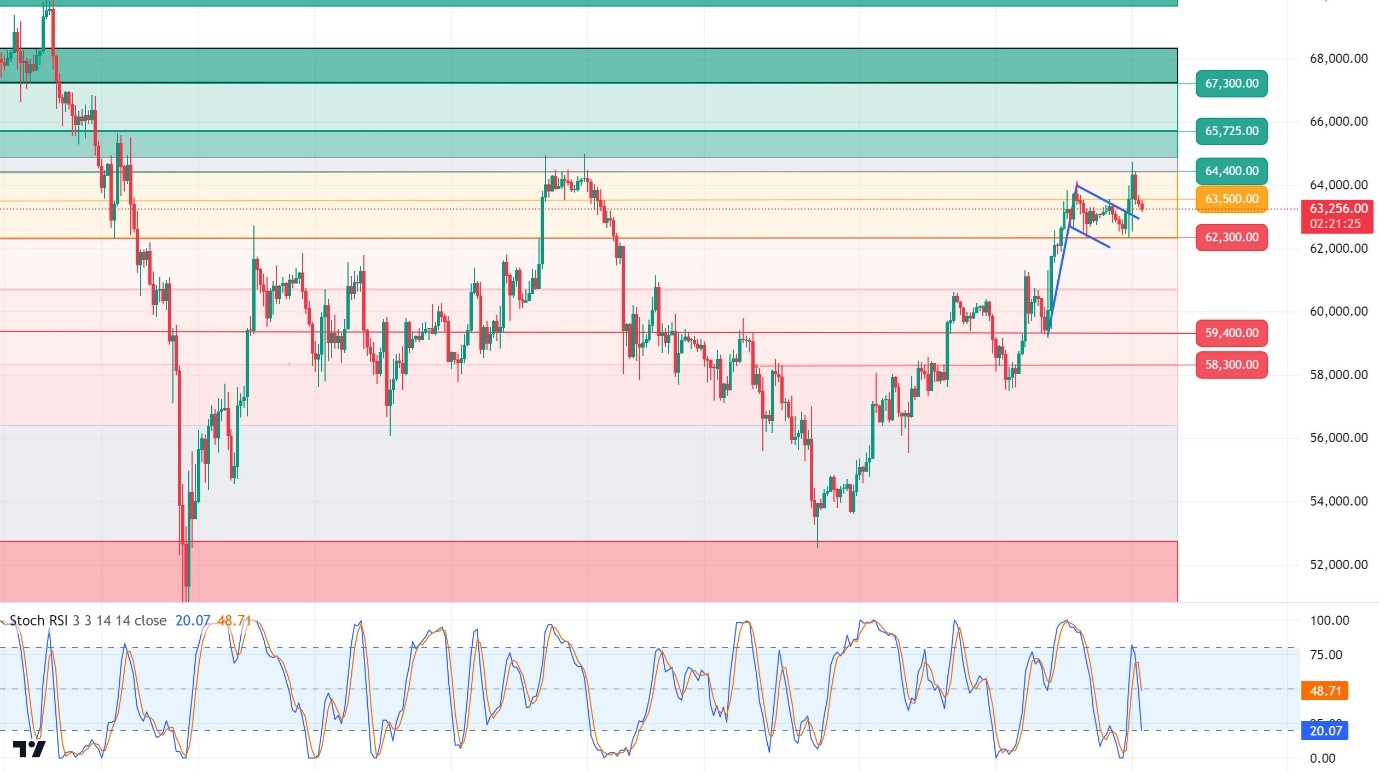
BTC/USDT
Political wind en Bitcoin? Bitcoin has become an unprecedented political campaign tool en the U.S. The crypto market, which has always been supported por Presidential candidate D. Trump, has also gained the support of Kamala Harris with her promise to encourage the growth of digital assets as of yesterday. With the election approaching, sharper rhetoric may benefit the crypto market and Bitcoin’s upward momentum may strengthen. In addition, the fact that the Bitcoin historical halving cycle started pricing about 170 days after the halving is the data we will carefully follow early next month. In the BTC 4-hora technical analysis, we see that it is en a correction and the price is currently trading at 63,300. A move towards the support level of 62,300 will invalidate the flag pattern. With the recovery from these levels, the 64,450 resistance point can be tested again, as the RSI approaching the oversold zone may strengthen this possibility again.
Supports 62,300 – 60,650 – 59,400
Resistances 64,450 – 65,725 – 67,300
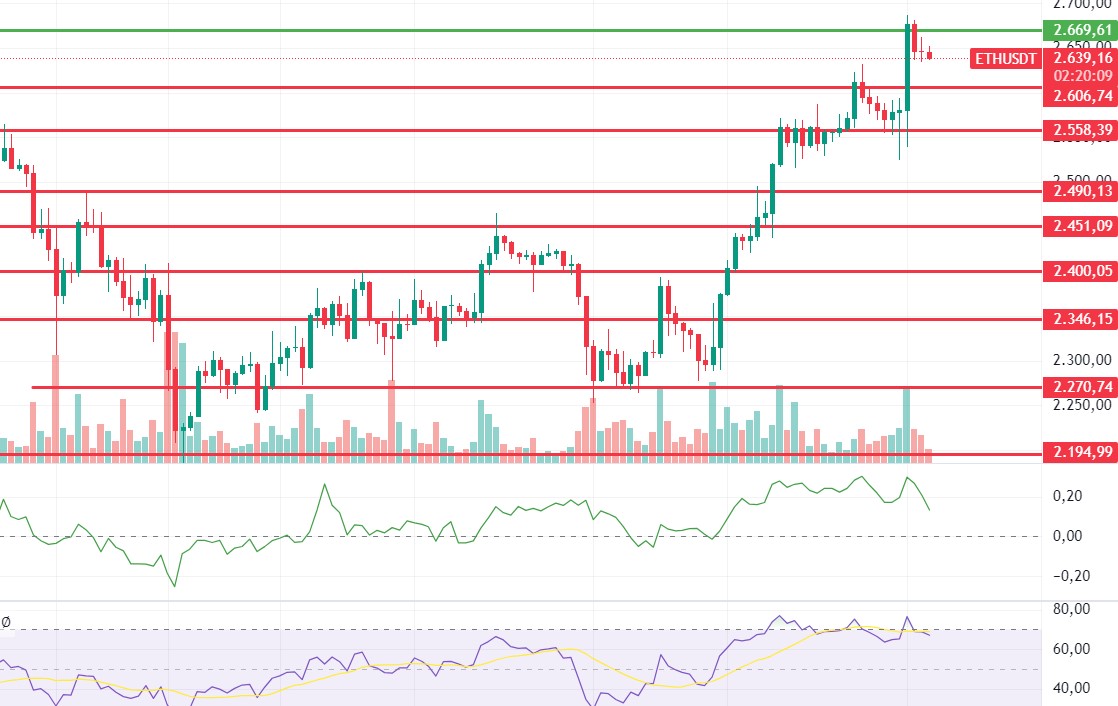
ETH/USDT
Ethereum, which looks strong against the decline of Bitcoin during the day, displays a horizontal image. Although CMF and RSI are down, their positive structures continue. However, the positive funding rates and the rise en the long/short ratio indicate that some correction is necessary. Ethereum can be expected to retreat to 2,606 levels during the day. However, closes above 2,669 may cancel this plan and accelerate the uptrend.
Supports 2,606 – 2,558 – 2,490
Resistances 2,669 – 2,721 – 2,815
LINK/USDT
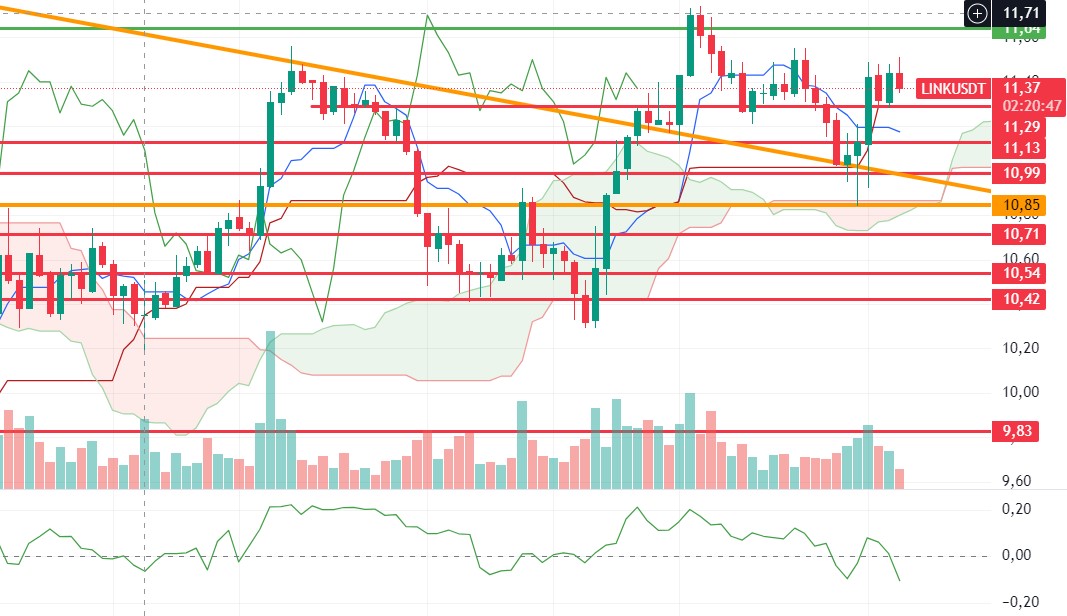
LINK seems to have received a reaction from the kijun support 11.29 level en its declines during the day. In a possible correction movement, it seems that this level can be broken with volume and fall to 11.13s. 11.64 daily kumo cloud resistance remains the most important resistance level. Exceeding it may start a positive trend.
Supports 11.29 – 10.85 – 10.54
Resistances 11.64 – 12.19 – 12.42
SOL/USDT
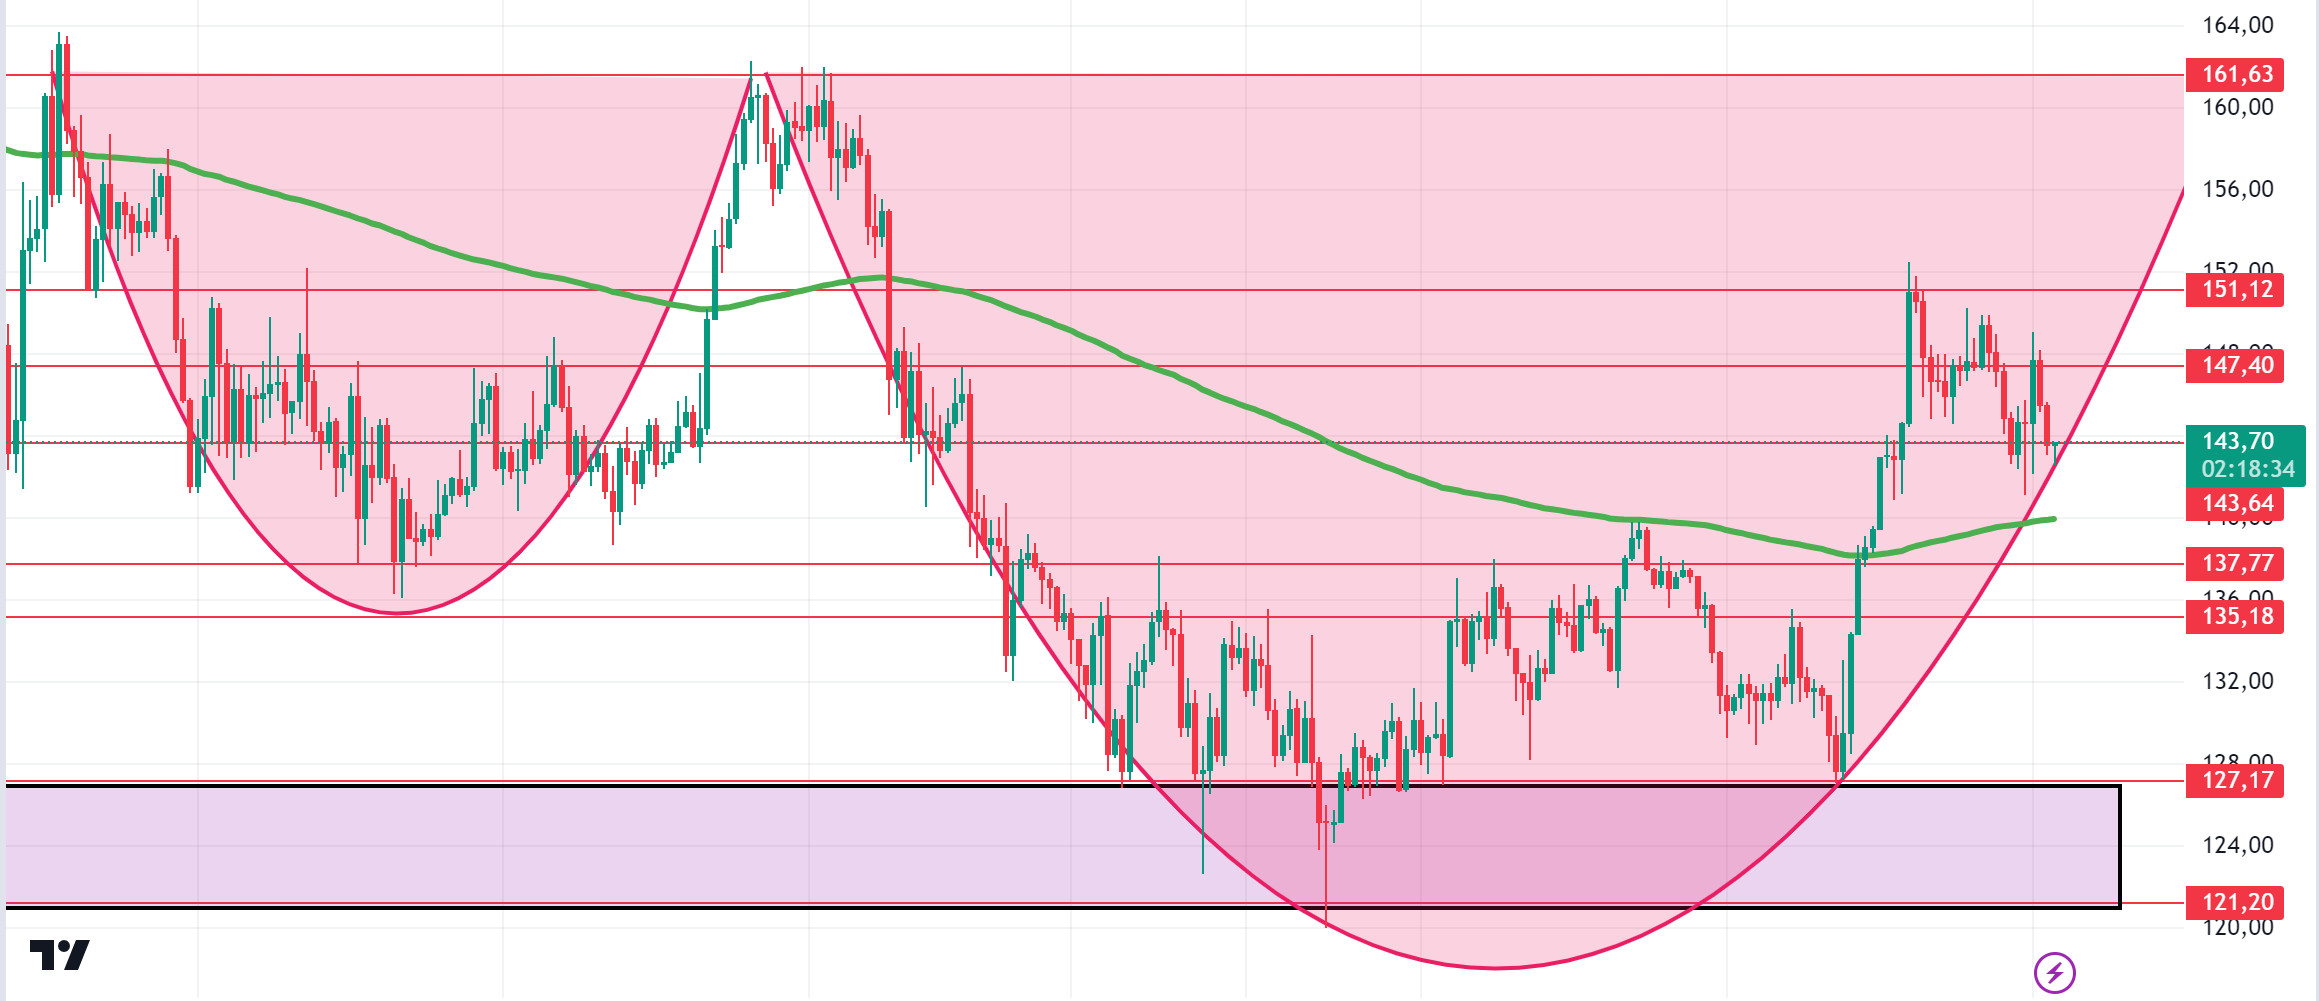
US presidential candidate Kamala Harris said, “We will protect consumers and investors while promoting innovative technologies like artificial intelligence and digital assets. We will create a safe business environment with consistent and transparent rules.” This discourse shows that the blockchain sector played a decisive role en the US elections. Technically, the FED’s interest rate cut seems to help the token break the consolidation it has been sustaining since about April. However, future profit sales may prevent it from breaking the consolidated area. On the other hand, a cup-and-handle pattern seems likely. In the rises driven por both macroeconomic conditions and innovations en the Solana ecosystem, 151.12 – 161.63 levels appear as resistance. If it rises above these levels, the rise may continue. It can support the 200 EMA average en the pullbacks that will occur if investors make profit sales. 143.64 – 137.77 levels can be followed as support. If it comes to these support levels, a potential rise should be followed.
Supports 143.64 – 137.77 – 135.18
Resistances 151.12 – 161.63 – 167.96
ADA/USDT
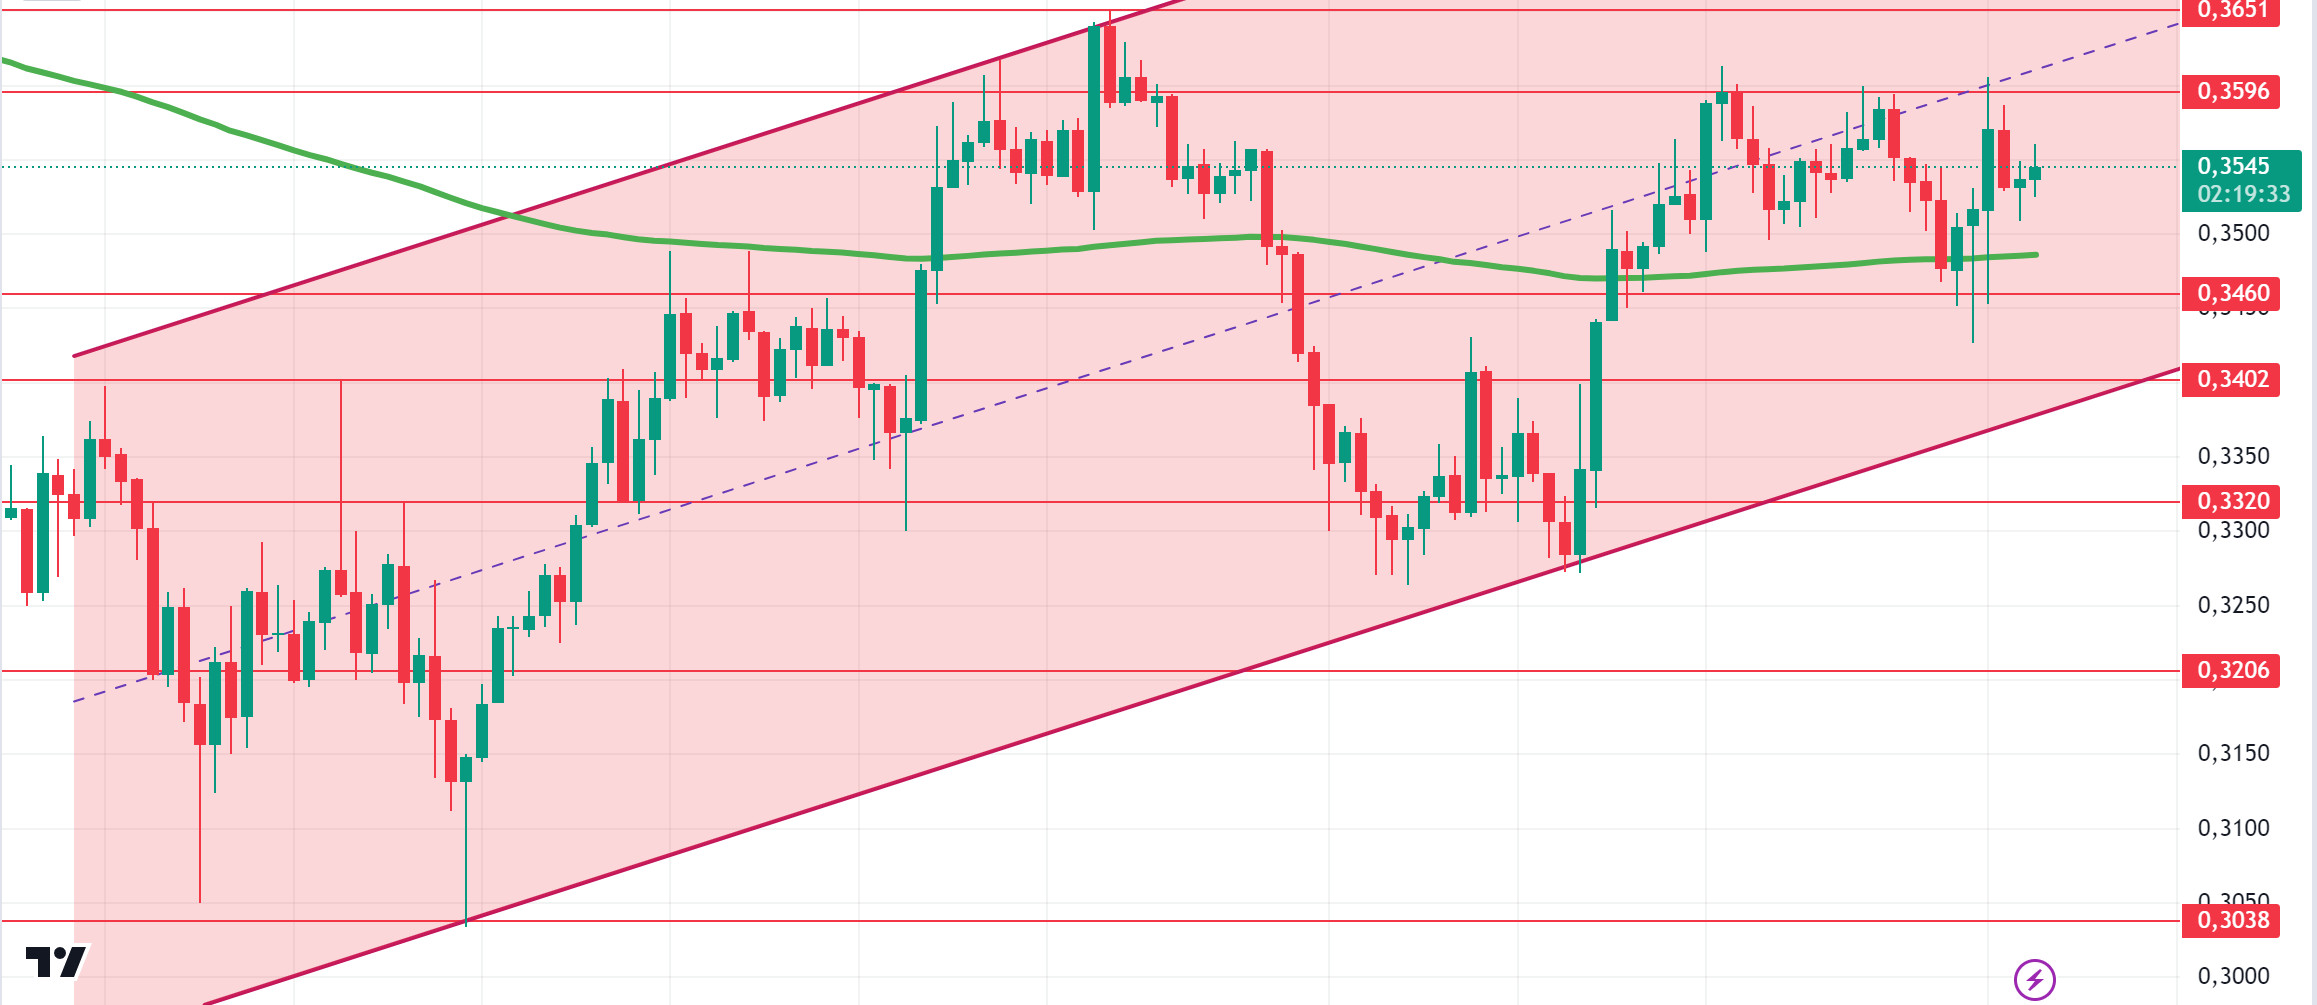
Technically, if ADA closes its 4-hora candle above the $0.3651 level, it can reach up to $0.3951, up 11.29%. In the last 24 horas, it continued to rise, supported por the resistance of the symmetrical triangle pattern. At the same time, this rise is priced from the upper zone of the rising channel formed since September 4. In retracements due to possible profit sales, it may gain momentum from the 200 EMA average. In this scenario, 0.3460 – 0.3402 levels appear as support. In the rises that will take place with the continuation of the positive atmosphere en the ecosystem, 0.3596 – 0.3651 levels can be followed as resistance levels.
Supports 0.3460 – 0.3320 – 0.3288
Resistances 0.3596 – 0.3651 – 0.3724
AVAX/USDT
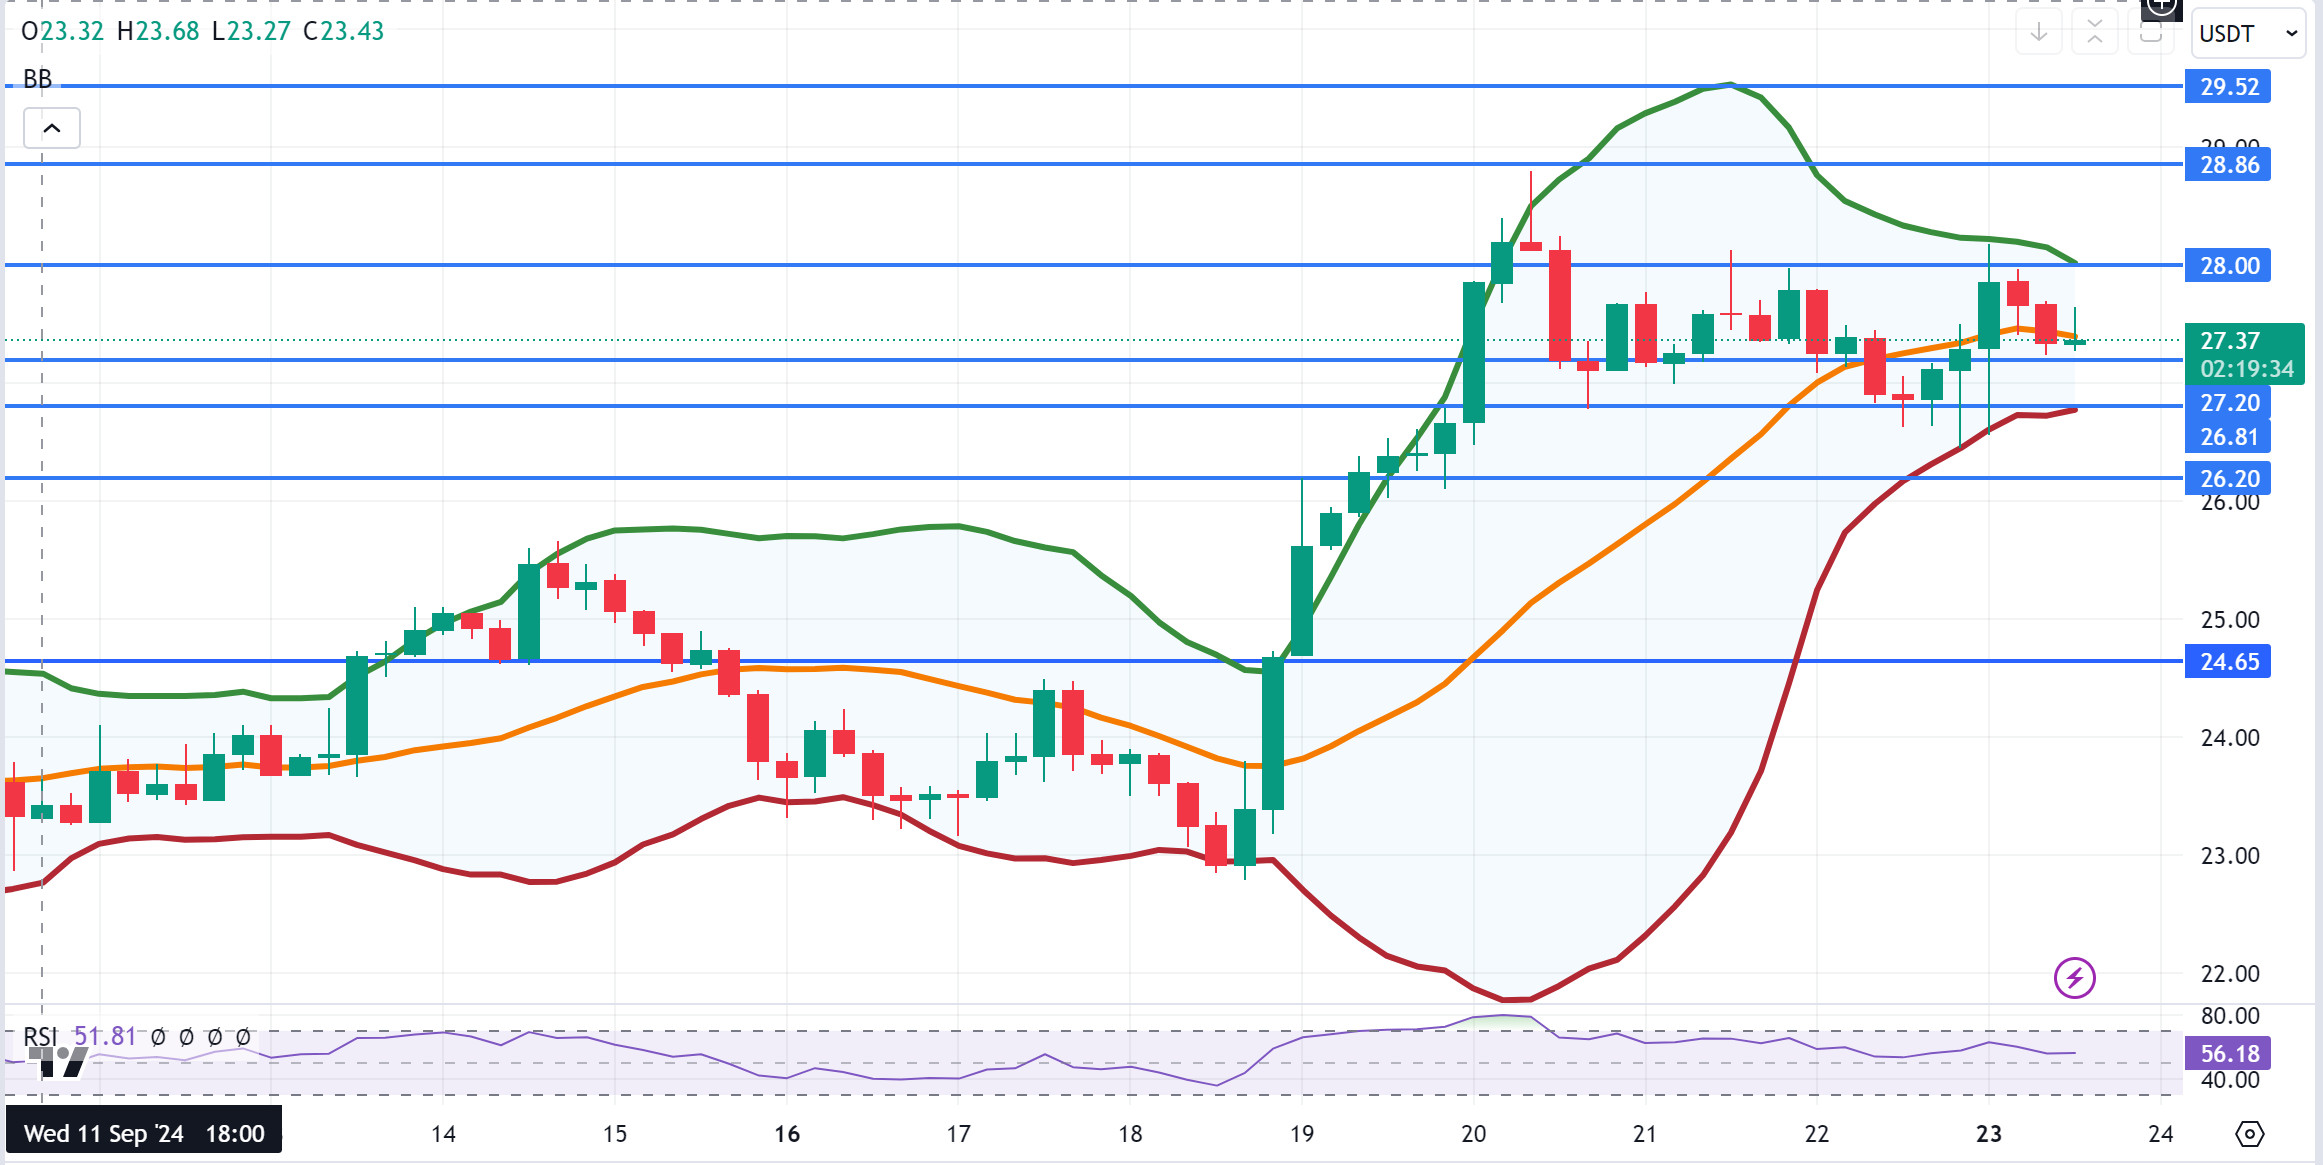
AVAX, which opened today at 27.30, is trading at 27.37 after the opening of the US stock markets.
AVAX, which is en the Bollinger middle band el the 4-hora chart, is at RSI 56 and may rise slightly from its current level. It may test the 28.00 resistance with the arrival of volume purchases. With the candle closure above 28.00 resistance, it may want to test the 28.86 resistance por rising a little more. It may move to the lower band with the sales reaction from the Bollinger middle band. In this case, it may test the 27.20 and 26.81 supports. As long as it stays above 24.65 support during the day, the desire to rise may continue. With the break of 24.65 support, selling pressure may increase.
Supports 27.20 – 26.81 – 26.20
Resistances 28.00 – 28.86 – 29.52
TRX/USDT
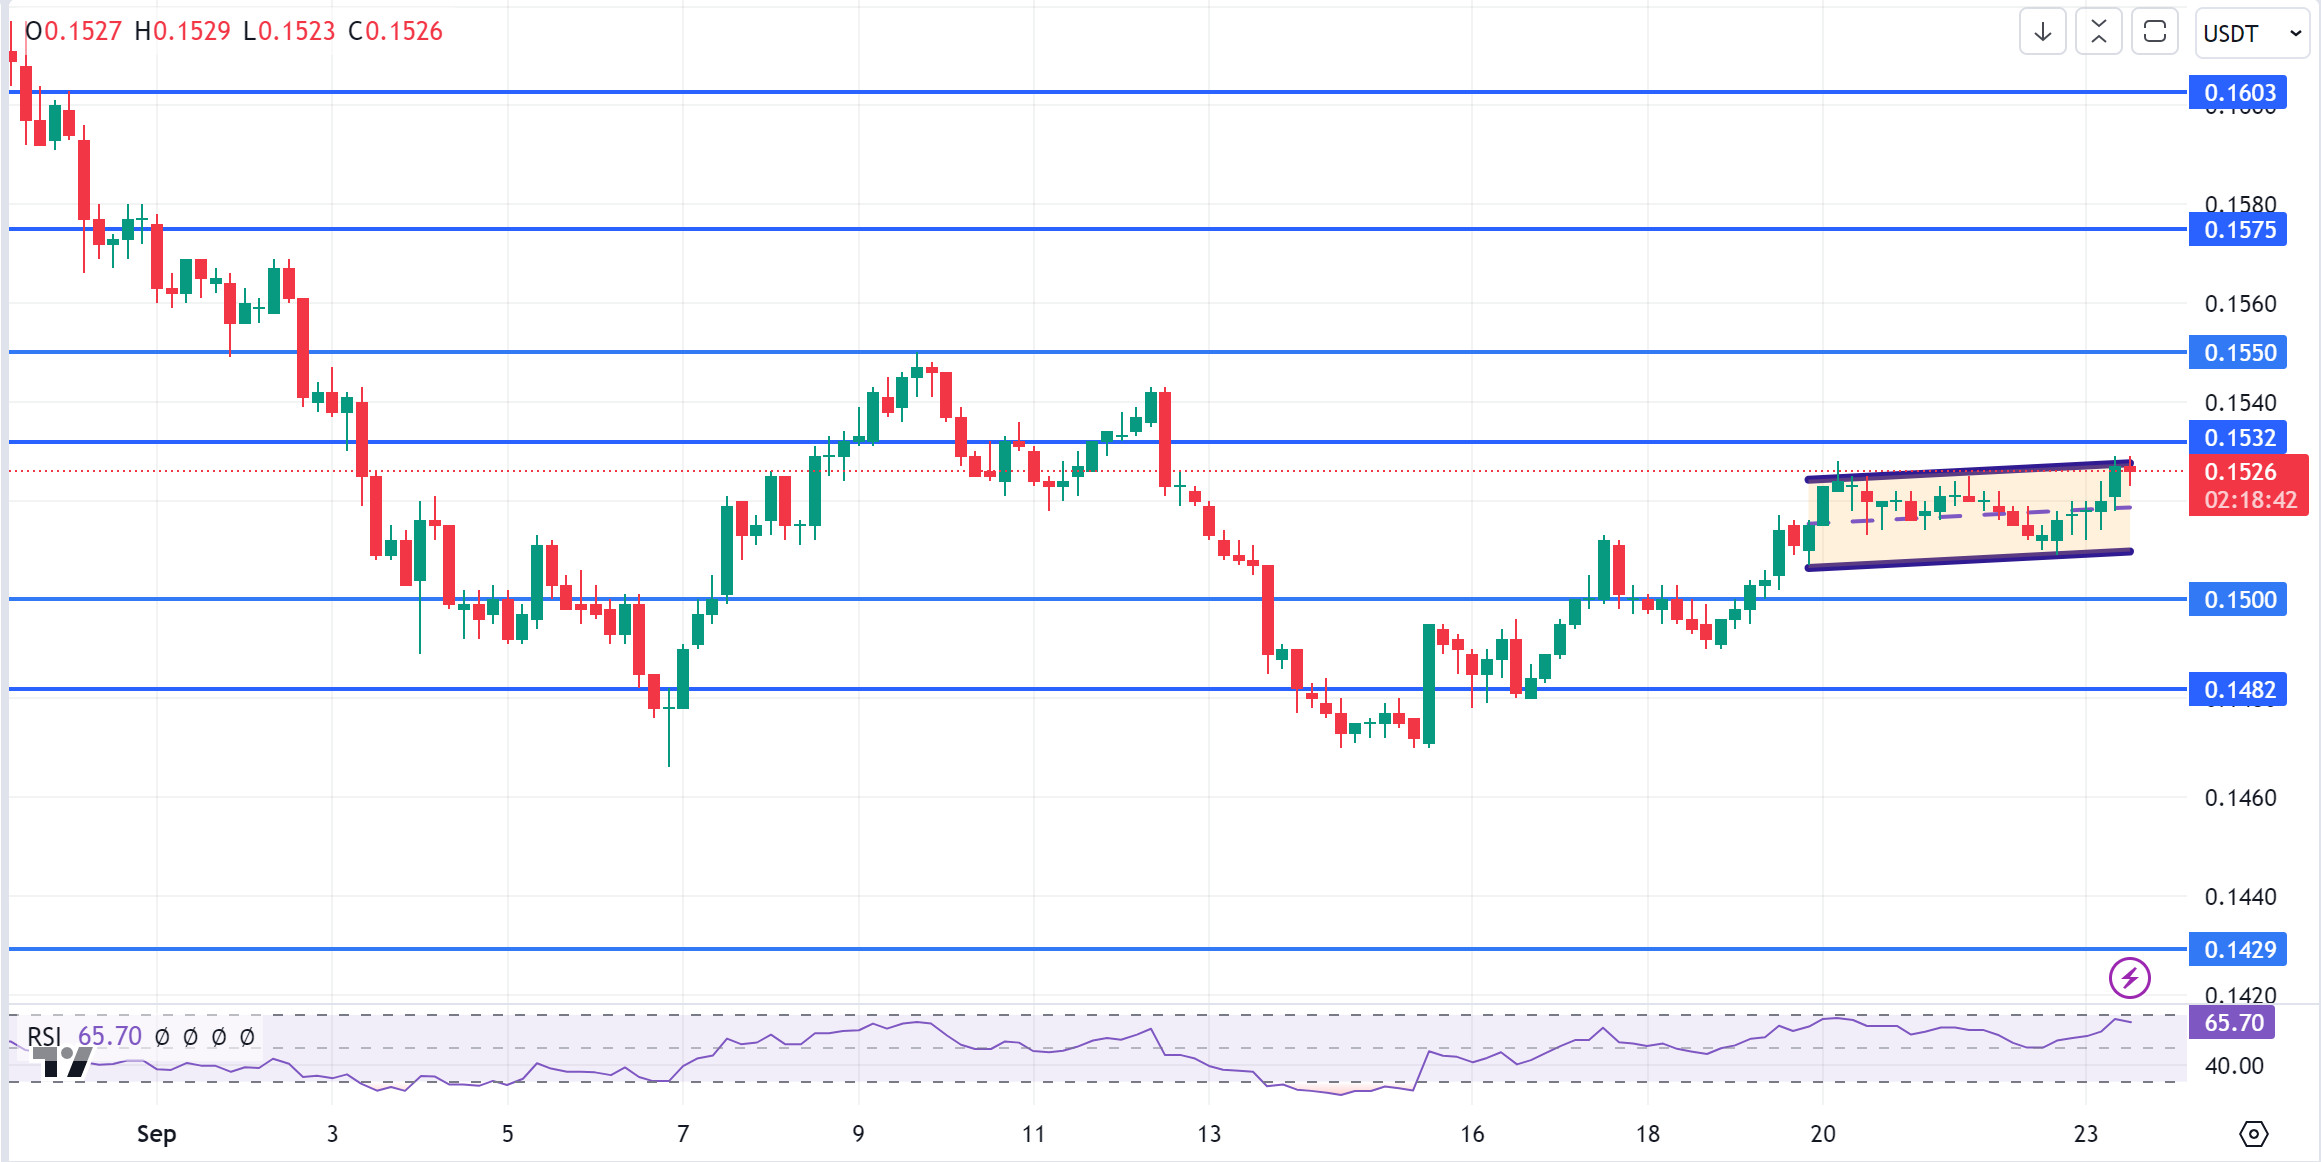
TRX, which started today at 0.1518, is currently trading at 0.1526. It can determine the direction after the US Production purchasing managers index and Service purchasing managers index data to be announced during the day. TRX, which continues its horizontal and volume-free movement at the moment, moves within the rising channel el the 4-hora chart. RSI has approached the overbought level with a value of 65 and some sales reaction can be expected from the upper band of the rising channel. In such a case, it may move to the middle band of the channel and test 0.1500 support. If it breaks the channel upwards with the hardening of purchases from the upper band of the channel, it may test the 0.1532 resistance. As long as TRX stays above 0.1482 support, the desire to rise may continue. If this support breaks down, sales can be expected to increase.
Supports 0.1500 – 0.1482 – 0.1429
Resistances 0.1532 – 0.1575 – 0.1603
XRP/USDT
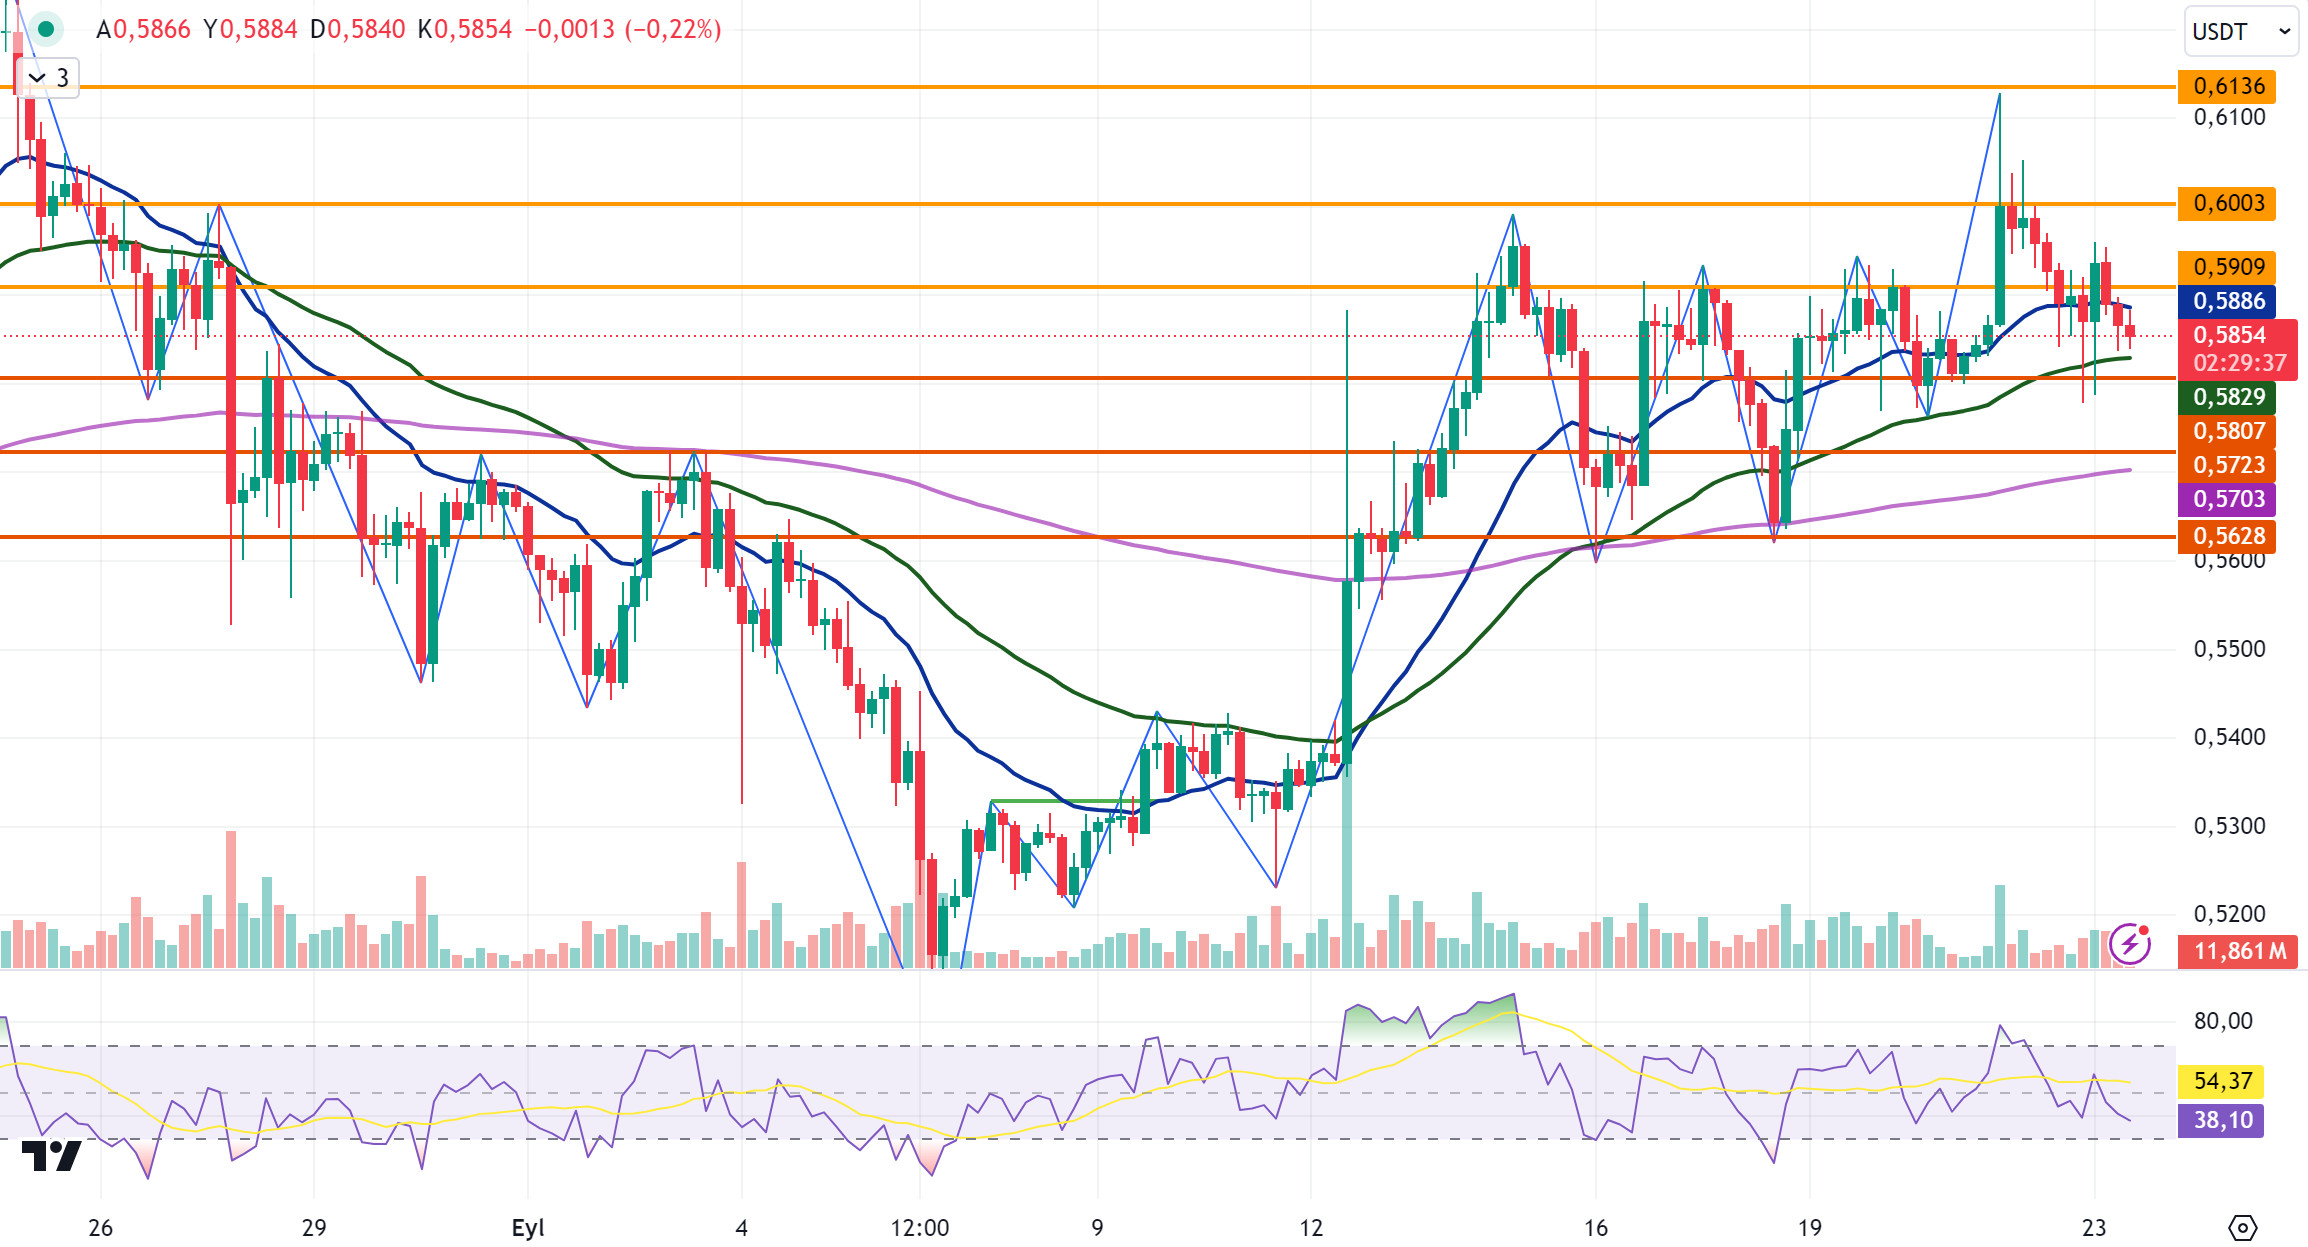
XRP fell with the sales that came after the rise it experienced el the opening candle en the 4-hora analysis today and is currently trading at 0.5843. After the fall, it continued to decline with sales at the EMA20 level en its rise. XRP is currently trading between the EMA20 and EMA50 levels. On a daily basis, it is trading en a horizontal band between 0.58 and 0.59 levels. If it rises, it may test the resistance levels of 0.5909-0.6003-0.6136. In its decline, if it breaks the EMA50 and 0.5807 support level, the decline may deepen and test the 0.5723-0.5628 support levels.
For XRP, it may rise with purchases that may come at the 0.5723 support level el the decline and may offer a long trading opportunity. On the rise, it may fall with possible sales at 0.6003 and may offer a short trading opportunity.
EMA20 (Blue Line) – EMA50 (Green Line) – EMA200 (Purple Line)
Supports 0. 5807 – 0.5 723 – 0.5628
Resistances 0.5909 – 0.6 003 – 0.6136
DOGE/USDT
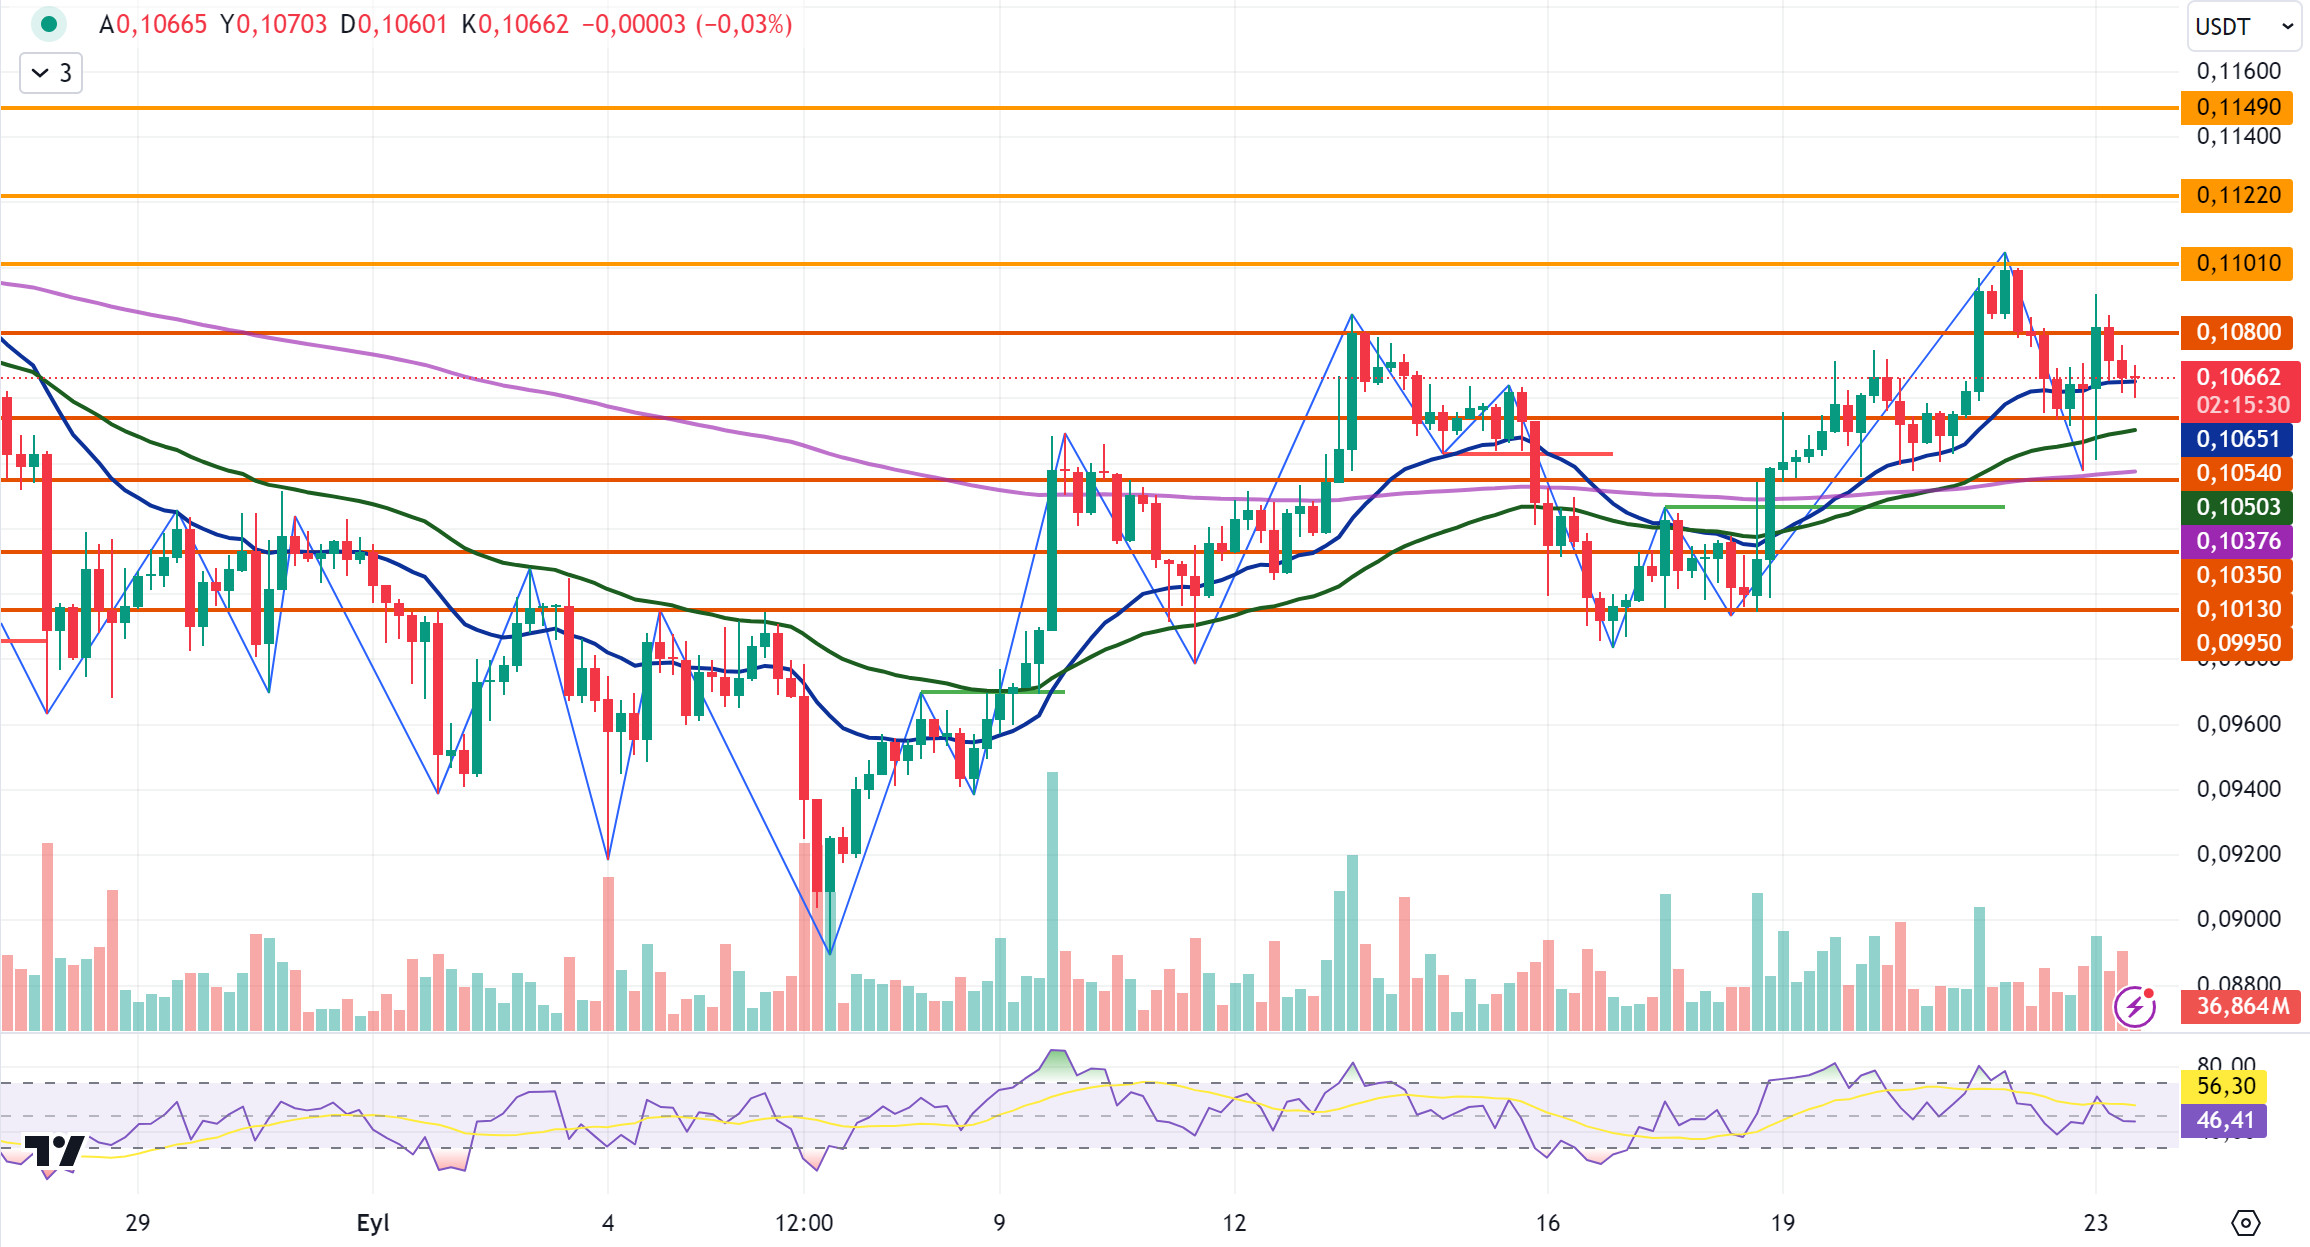
In the 4-hora analysis, DOGE, which started today with a rise, rose up to 0.1091, then fell with the incoming sales and is currently trading at 0.1066. DOGE, which continued to be traded en a horizontal band between 0.1054 and 0.1080 yesterday and today, tested and failed to break the 0.1080 resistance level en its rise and then fell, and then continued to be traded en a horizontal band as a result of recovery with the purchases at the EMA50 level en its decline. If DOGE breaks the EMA20 and 0.1054 levels en its decline, it may test the support levels of 0.1035-0.1013 as the decline deepens. If it starts to rise, it may test the resistance levels of 0.1080-0.1101-0.1122.
DOGE may rise with possible purchases at EMA50 and EMA200 levels en its decline and may offer a long trading opportunity. In its rise, the 0.11 resistance zone comes to the fore and it may decline with the sales that may come at this level and may offer a short trading opportunity.
EMA20 (Blue Line) – EMA50 (Green Line) – EMA200 (Purple Line)
Supports 0.1054 – 0.1035 – 0.1013
Resistances 0.1 080 – 0.1101 – 0.1122
DOT/USDT
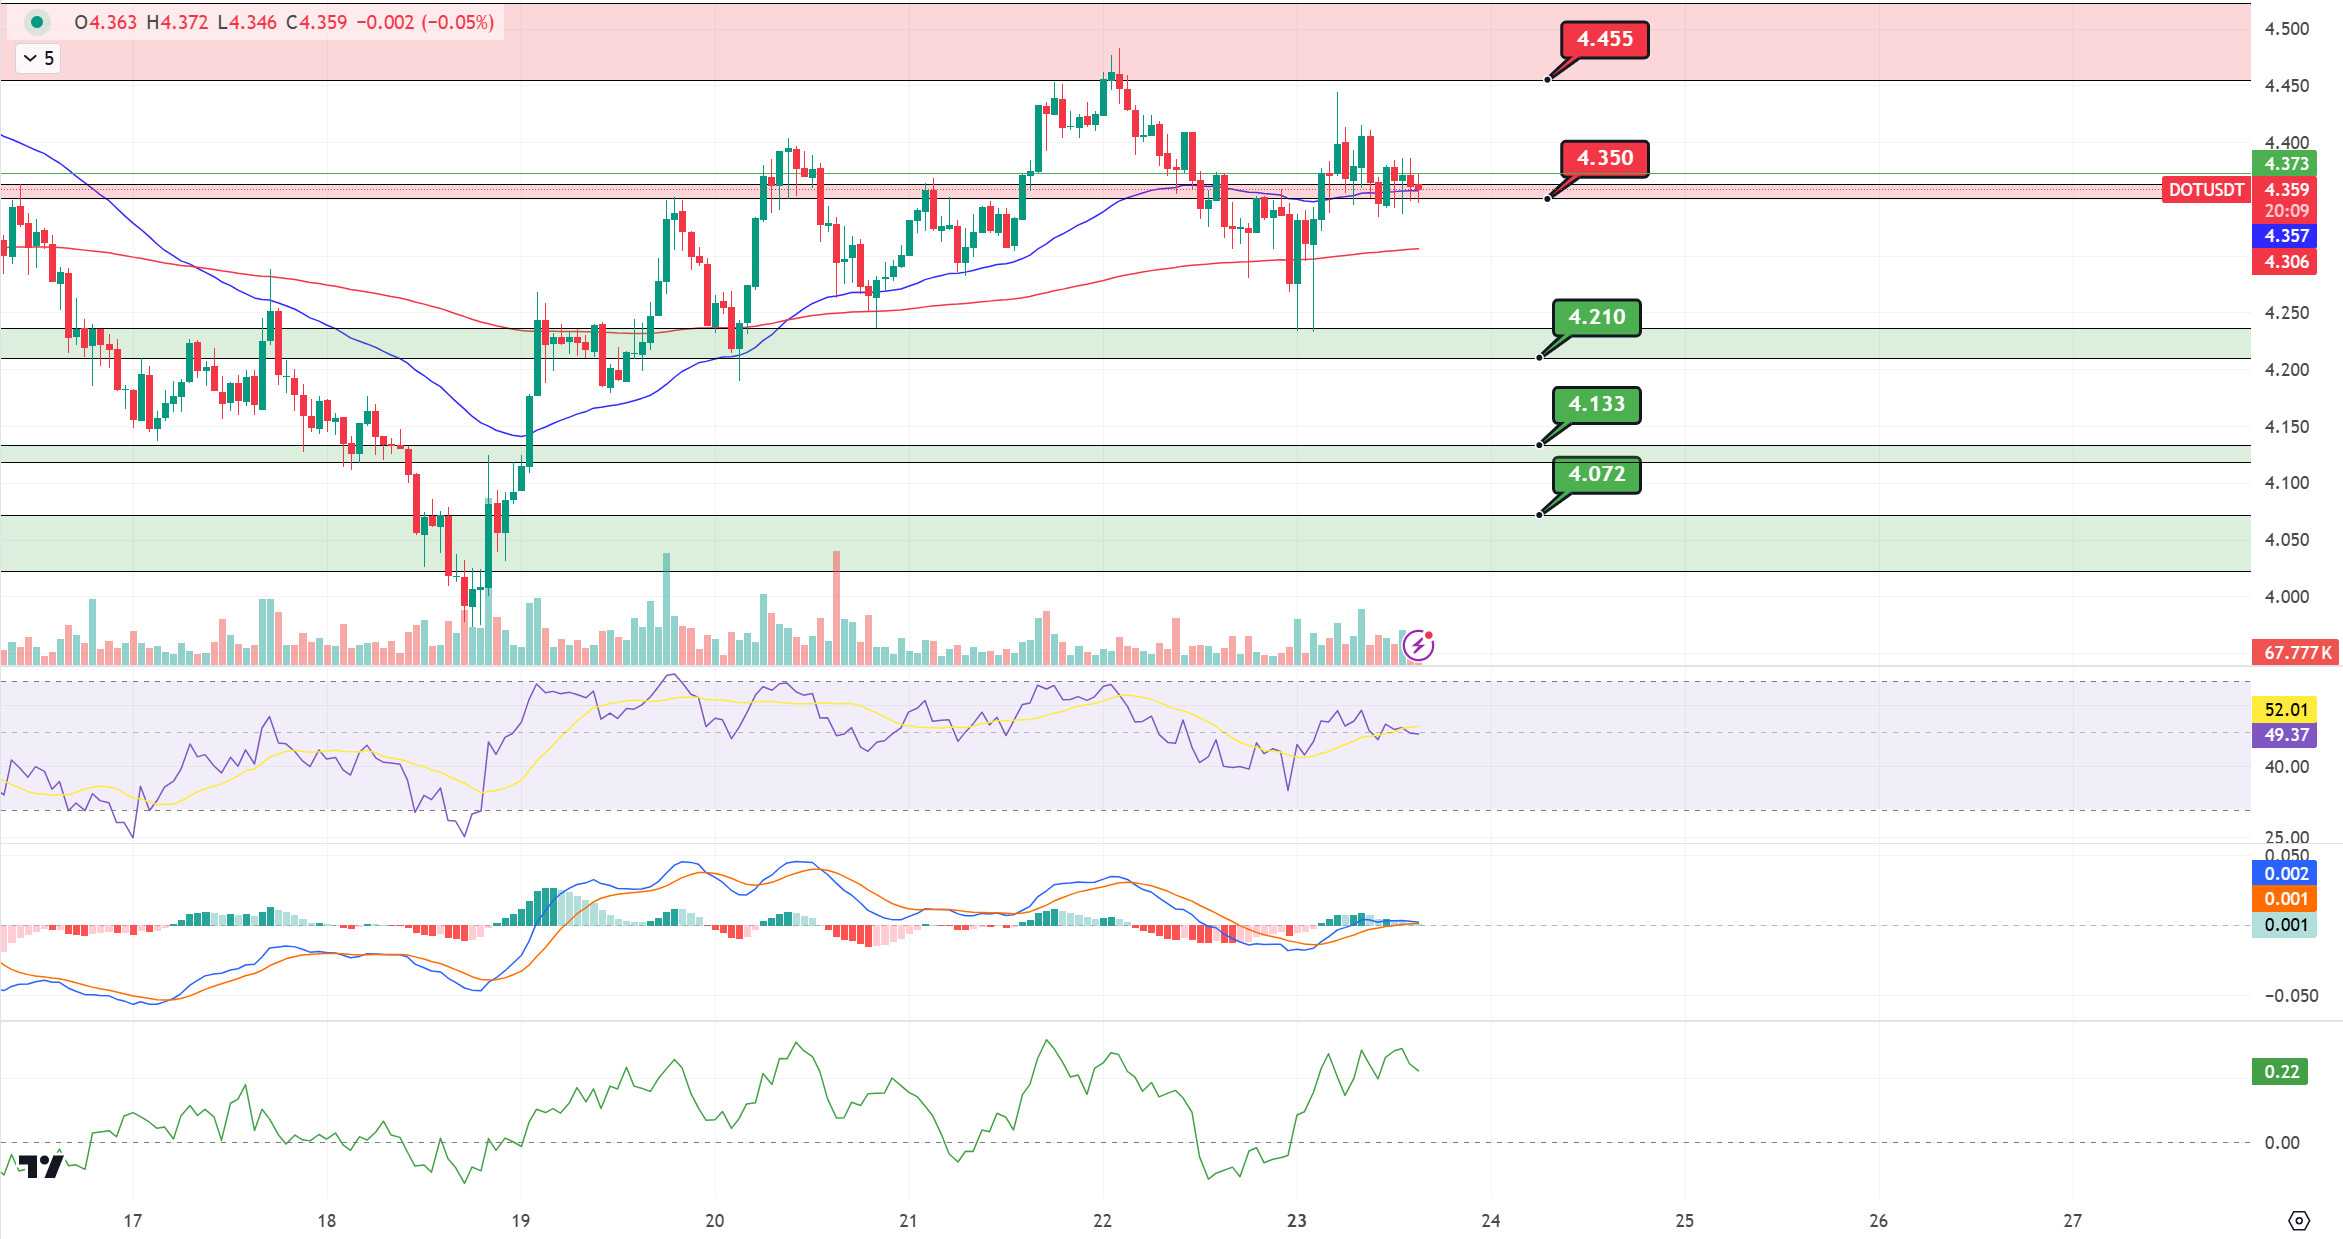
When we examine the Polkadot (DOT) chart, we can say that the price is flat. According to the MACD oscillator, buyer pressure seems to have decreased compared to the previous hora. In the negative scenario, if the price remains below the 4,350 resistance level, we may see a retracement to the first support level of 4,210. On the other hand, if the price persists above the 4,350 resistance band, a movement towards the 4,455 resistance can be seen.
(Blue line: EMA50, Red line: EMA200)
Supports 4,210 – 4,133 – 4,072
Resistances 4.350 – 4.455 – 4.570
SHIB/USDT
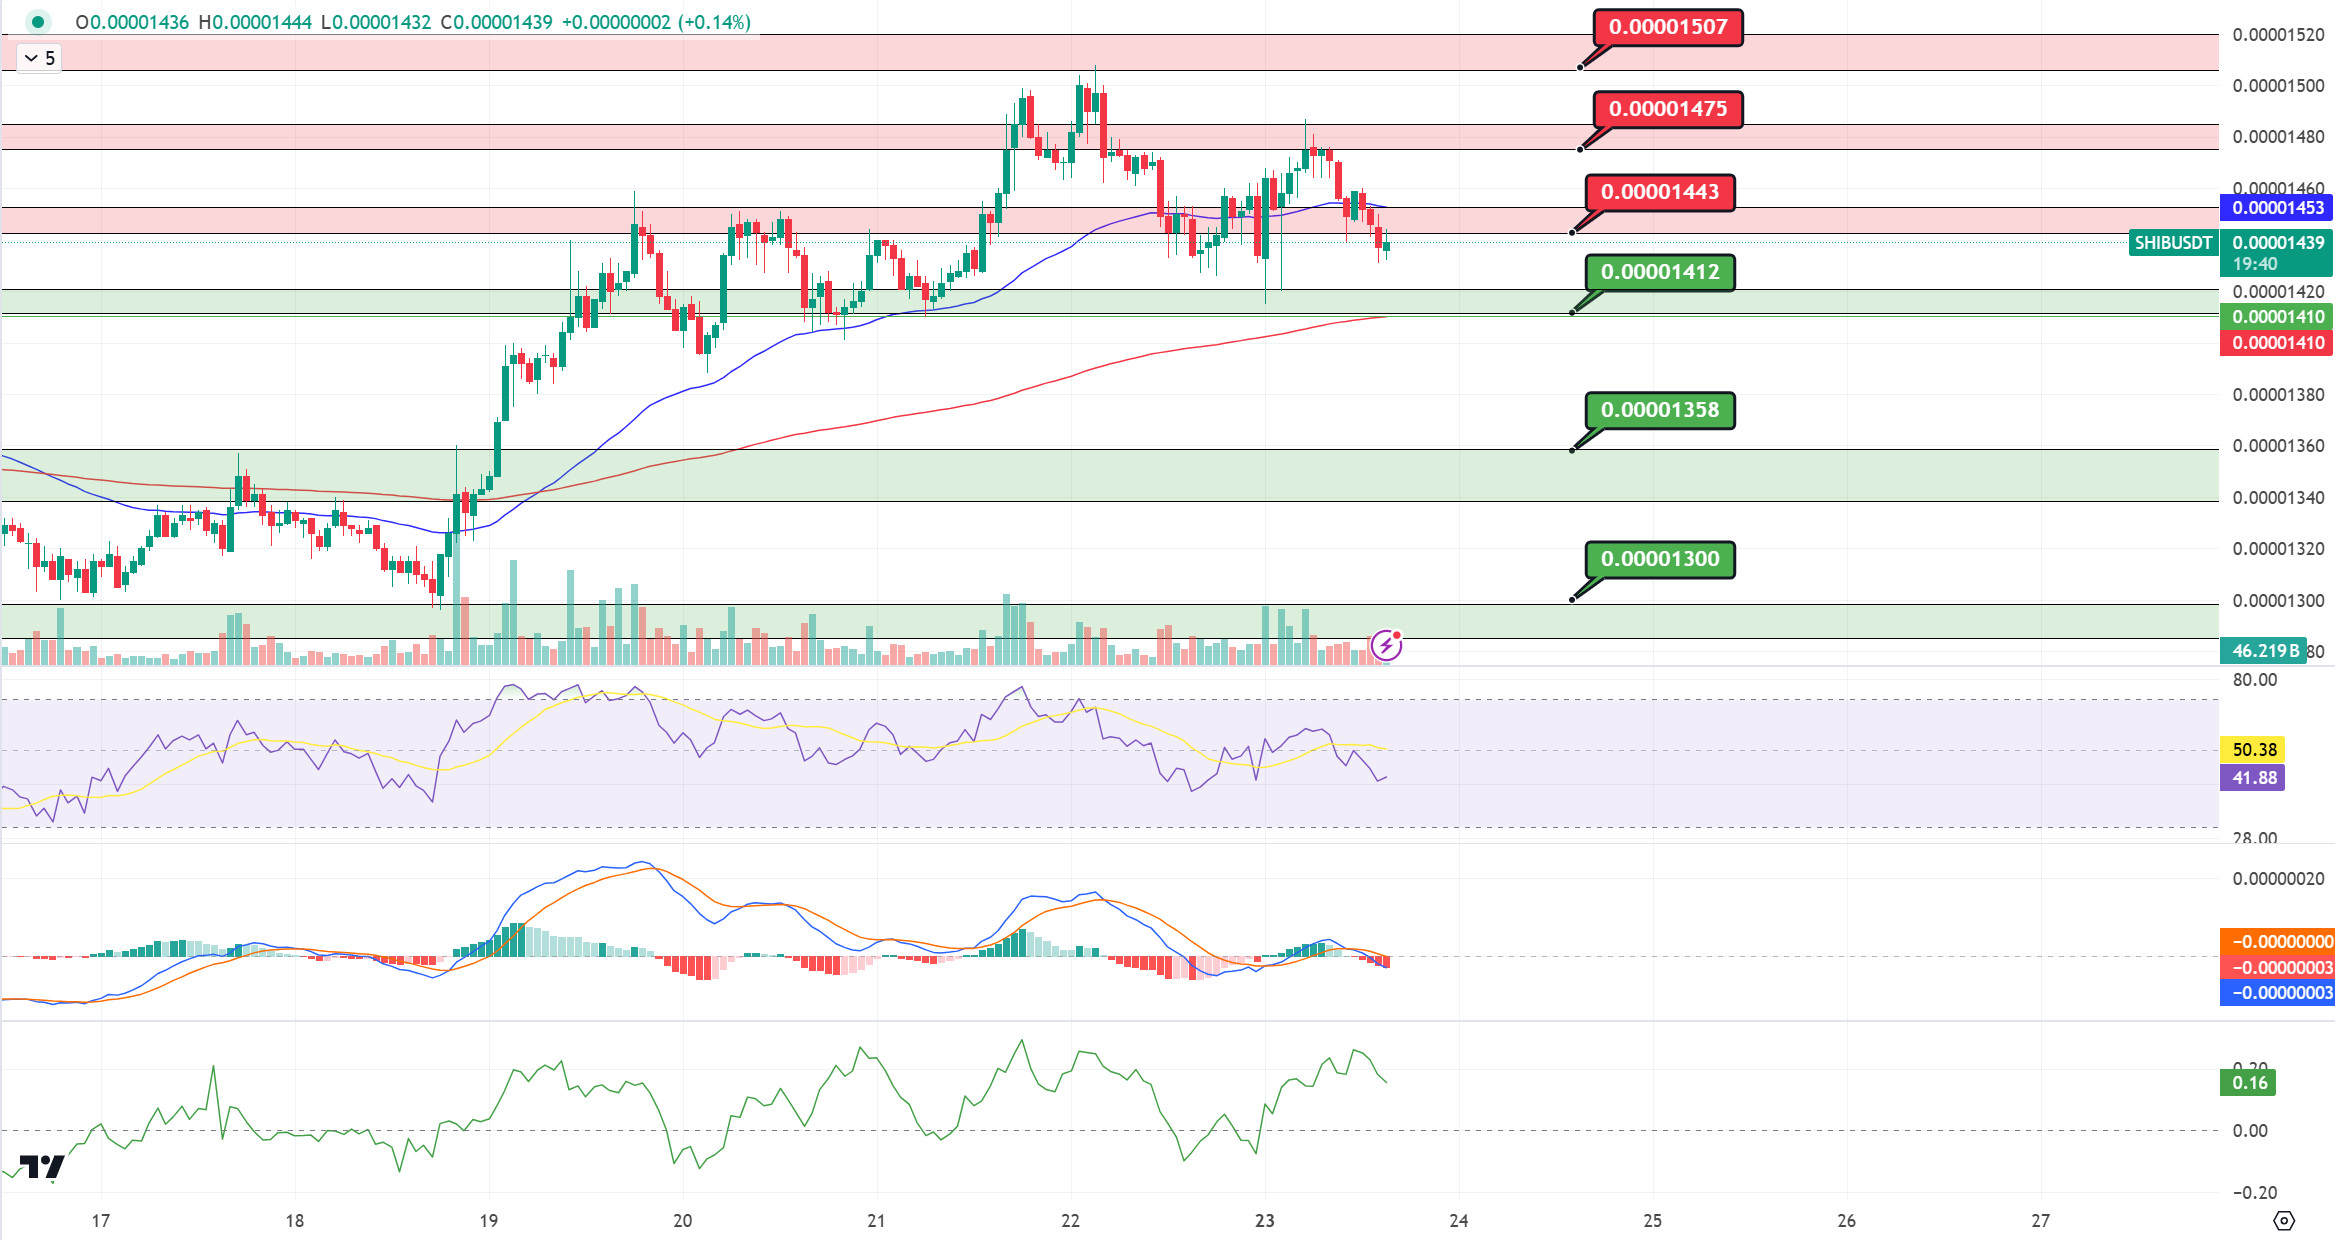
Shytoshi Kusama, lead developer of Shiba Inu, announced that he will continue to work el SHIB with or without the support of the community. Kusama reiterated his commitment to realizing Shiba Inu’s vision. Although SHIB’s price has fallen 83% from its peak en 2021, the team has focused el growing the project en the long term, making important strides such as Shiba Eternity and the auto-cremation portal. However, some critics within the community feel that the team is not doing enough to bring SHIB back to its former glory. Analyzing the chart of Shiba Inu (SHIB), the price broke the 0.00001443 support down. When we examine the MACD oscillator, we see that the selling pressure increased compared to the previous hora. In the negative scenario, the price may retreat to the 0.00001412 support level. In the positive scenario, if the price can maintain above the 0.00001443 level, its next target could be the 0.00001475 resistance level.
(Blue line: EMA50, Red line: EMA200)
Supports 0.00001412 – 0.00001358 – 0.00001300
Resistances 0.00001443 – 0.00001475 – 0.00001507
LEGAL NOTICE
The investment information, comments and recommendations contained herein do not constitute investment advice. Investment advisory services are provided individually por authorized institutions taking into account the risk and return preferences of individuals. The comments and recommendations contained herein are of a general nature. These recommendations may not be suitable for your financial situation and risk and return preferences. Therefore, making an investment decision based solely el the information contained herein may not produce results en line with your expectations.
