
MARKET SUMMARY
Latest Situation en Crypto Assets
*Prepared el 24.09.2024 at 14:00 (UTC)
WHAT’S LEFT BEHIND
Kamala Harris Meets with Ripple and Coinbase Ahead of Election
Harris’ campaign has been en dialog with leading companies such as Ripple Labs and Coinbase. “It’s amazing to see how far the Democratic candidate has come el this issue,” said Paul Grewal, Coinbase’s chief legal officer, noting that the campaign has a deeper understanding of the industry’s needs.
Central Bank of China
China’s latest economic measures, such as interest rate cuts and monetary stimulus, could have a significant impact el global markets. The fact that it will inject liquidity into the market por taking new steps to support the economy is seen as a factor that increases the risk appetite and is interpreted positively for the Bitcoin price.
Historic Meeting for Bitcoin
Elon Musk and Nayib Bukele held a meeting el technology and Bitcoin at Tesla headquarters. Bukele’s leadership was praised as the rise of Bitcoin and El Salvador’s cryptocurrency moves were discussed. The conversation also touched el wide-ranging topics such as artificial intelligence and the future of robotics.
HIGHLIGHTS OF THE DAY

INFORMATION:
*The calendar is based el UTC (Coordinated Universal Time) time zone. The economic calendar content el the relevant page is obtained from reliable news and data providers. The news en the economic calendar content, the date and time of the announcement of the news, possible changes en the previous, expectations and announced figures are made por the data provider institutions. Darkex cannot be held responsible for possible changes that may arise from similar situations.
MARKET COMPASS
The steps taken por central banks to support economies are el the agenda en global markets. Finally, the statements of the Central Bank of China and other institutions of the country increased the risk appetite. However, we saw that this situation was not fully reflected en digital assets.
European stock markets are el the rise today despite yesterday’s poor PMI data. The European Central Bank is expected to continue easing monetary policy to support economic activity. US indices also started the new day slightly el the positive side. However, there is a horizontal course. The pressure el the dollar index, which started en the morning horas, continued. Losses increased slightly after CB Consumer Confidence data came en well below expectations. Despite all these components of the equation, as we mentioned earlier, the rise en digital assets could not find full strength.
As we discussed en our morning analysis, no critical news or data flow is expected for the rest of the day. Under the assumption that the current market environment will continue, we think that we may see rapid rises and falls en digital assets from time to time. This could be en the form of delayed rallies that may not be accompanied por increased risk appetite, or declines that may be triggered por the lack of cash inflows towards digital assets and the triggering of increased concerns en parallel. Continued inflows into risky assets en traditional markets and a further delay en the spillover to crypto assets could increase downside risks.
TECHNICAL ANALYSIS
BTC/USDT
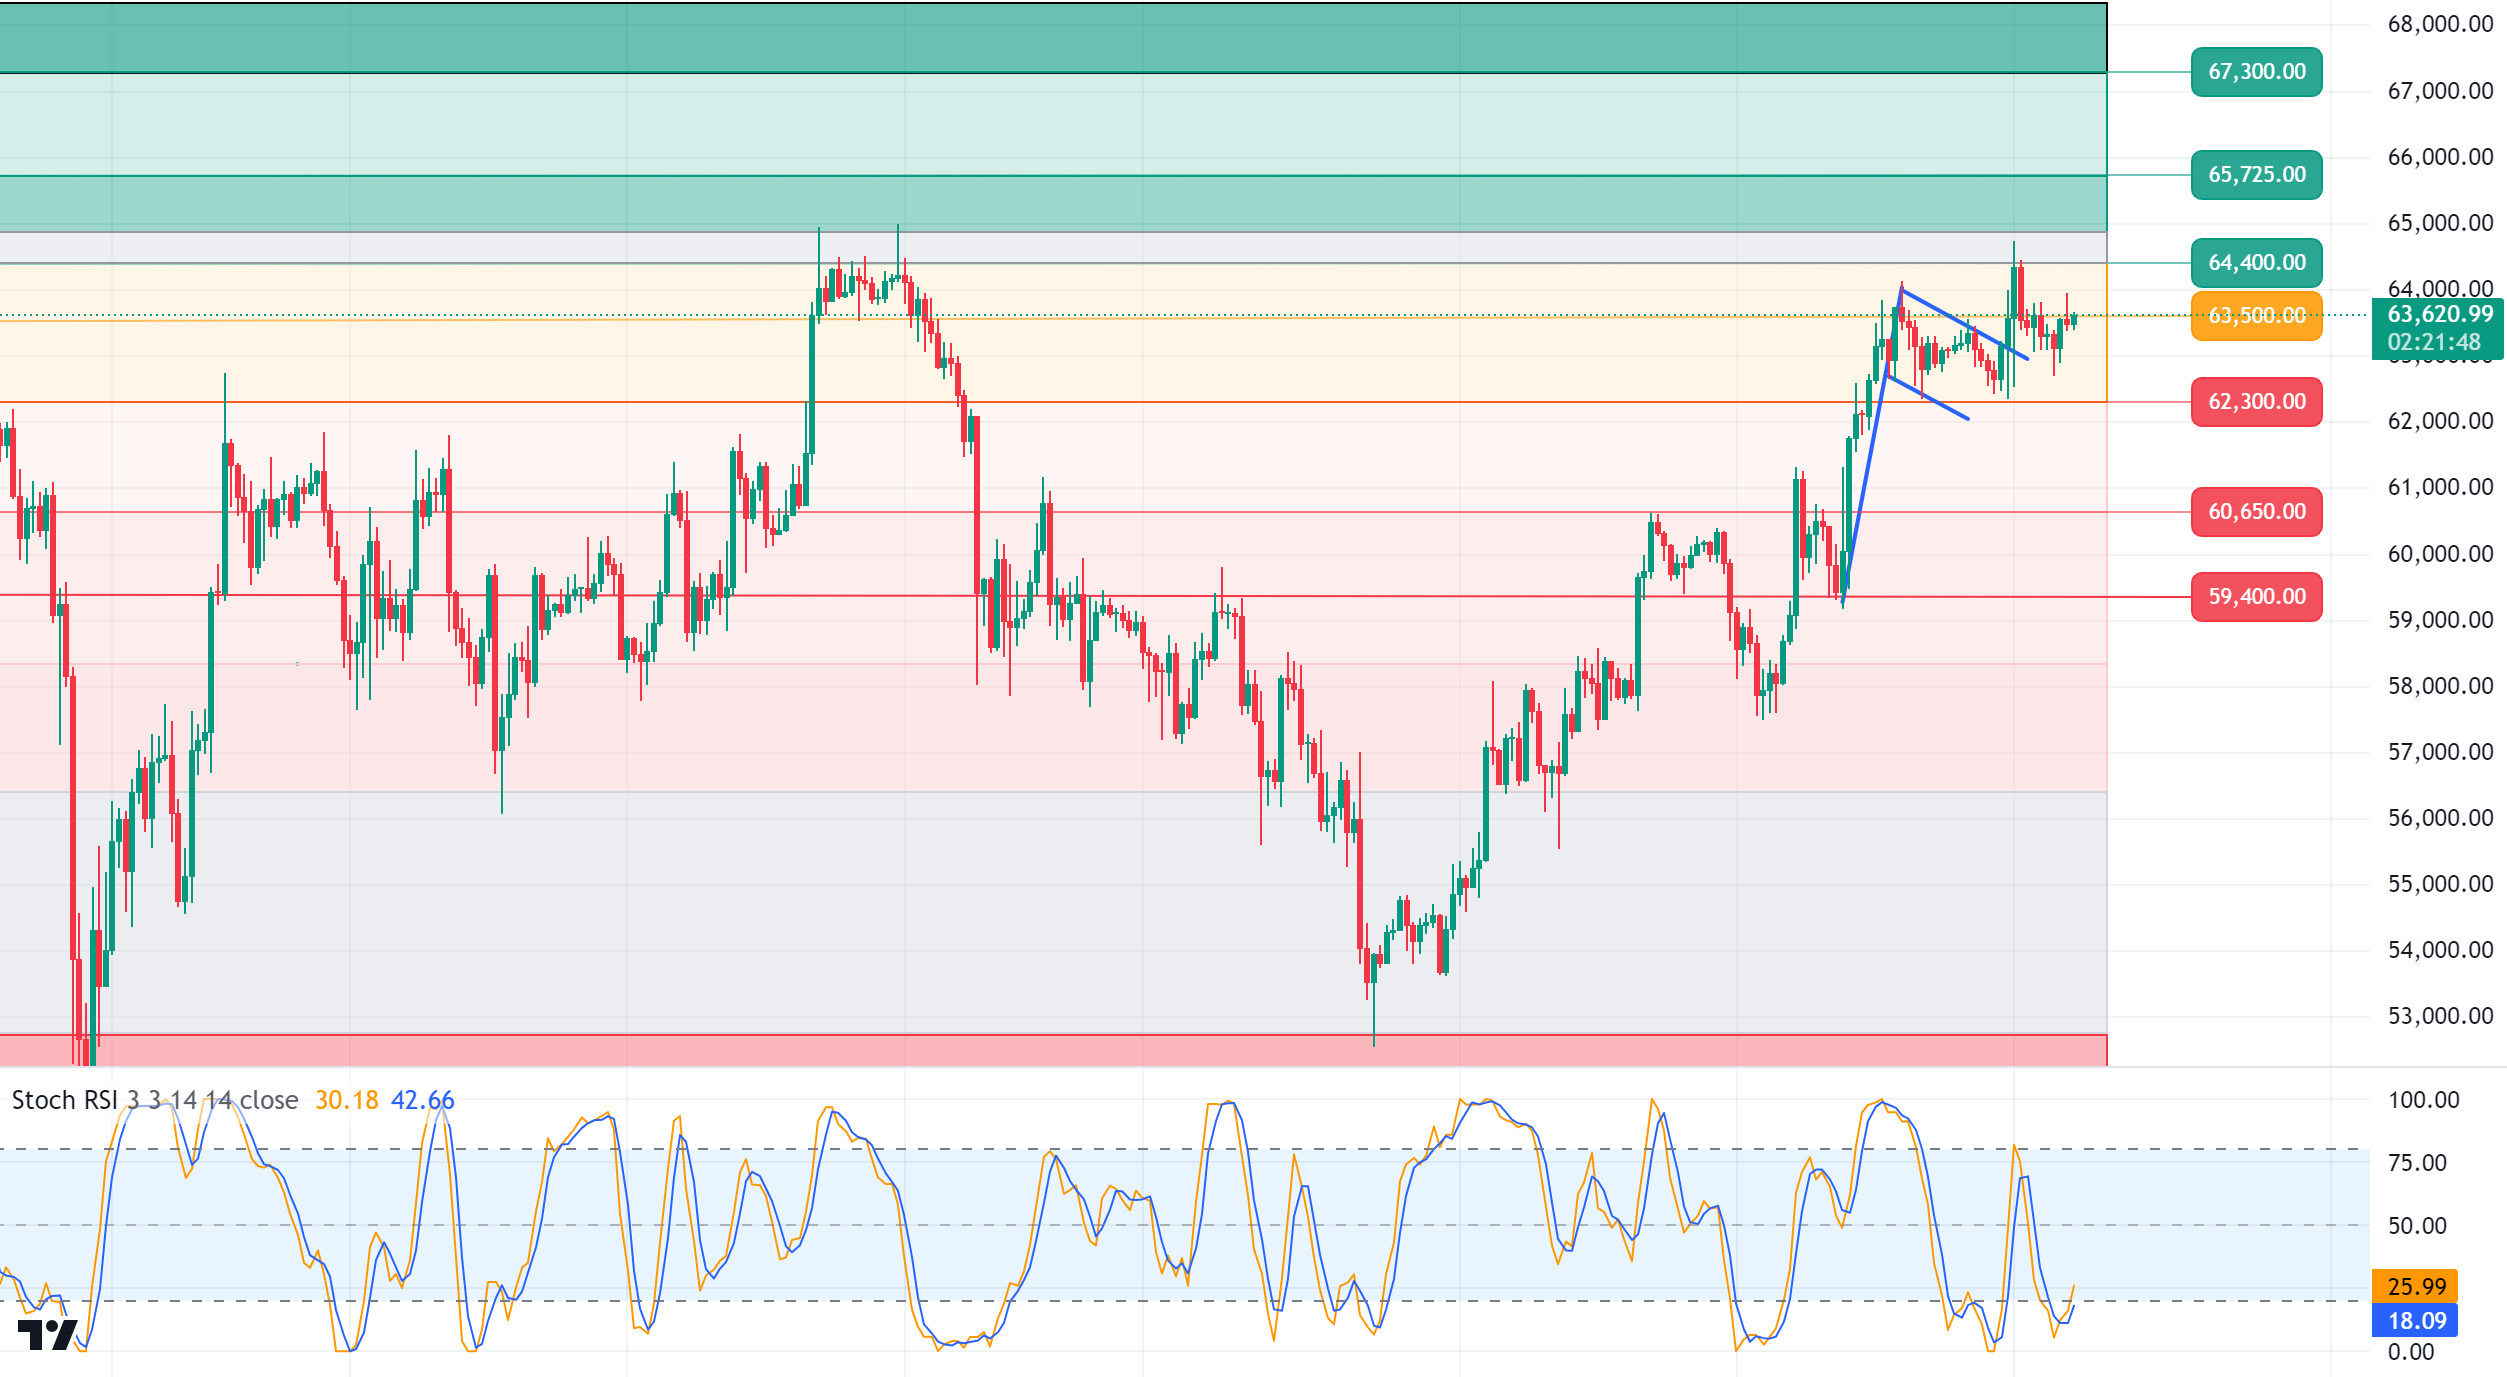
Calm course en Bitcoin! The leading cryptocurrency Bitcoin continues to follow a calm course el the segundo day of the week. With the euphoria that came with the FED interest rate cuts last week, the price tested 64,000 levels and then came to 63,000 levels, which seems to have been replaced por a stagnant market. The correlation with US stocks, which we mentioned earlier, has shifted the focus to the stock market. The data coming from there can give us a message about the direction. In addition, the latest economic measures such as interest rate cuts and monetary incentives of the Chinese government, which is struggling with the real estate crisis, another important development during the day, can be expected to have a positive impact el the Bitcoin price en the long term. In the BTC 4-hora technical analysis, we see that the price continued to react upwards during the day with an attack towards the 63,800 level. With the selling pressure en BTC considerably decreasing, the correction movement of the rise from 57,000 levels is limited as of now and shows that it continues to be en a strong outlook. With the opening of the US market, there may be activity and the price may test above 64,000 levels again with positive market data. Persistence above these levels brings a movement towards the 67,000 level. In case of a pullback, the 62,300 level appears as a support point, but every pullback may create a buying opportunity en these periods when the rises have started.
Supports 62,300 – 60,650 – 59,400
Resistances 64,450 – 65,725 – 67,300
ETH/USDT
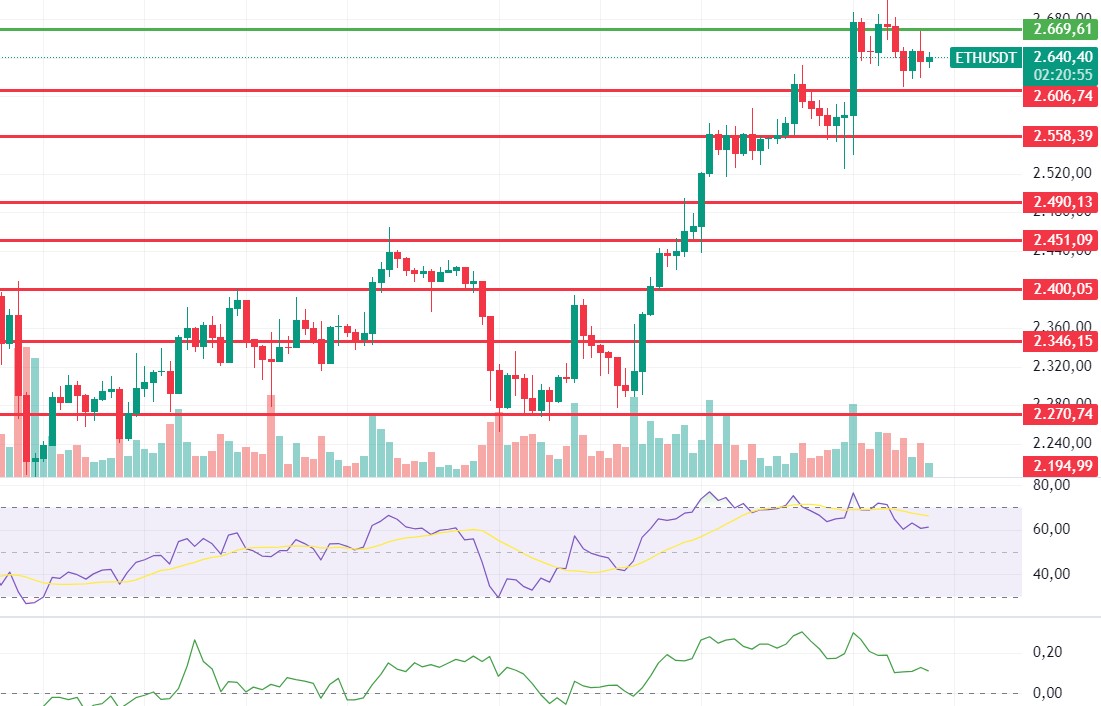
As mentioned en the morning analysis, we see that the negative structure en RSI continues. The negative signal en MACD and the increase en sales el the spot side en CVD data can be listed as valid reasons for the correction expectation to continue. The most important support level en possible retracements seems to be 2,558. The break of this level may deepen the decline. Closures above 2,669 may refute the idea and accelerate the upward acceleration. In this case, we may see rapid rises to 2.815.
Supports 2,606 – 2,558 – 2,490
Resistances 2,669 – 2,721 – 2,815
LINK/USDT
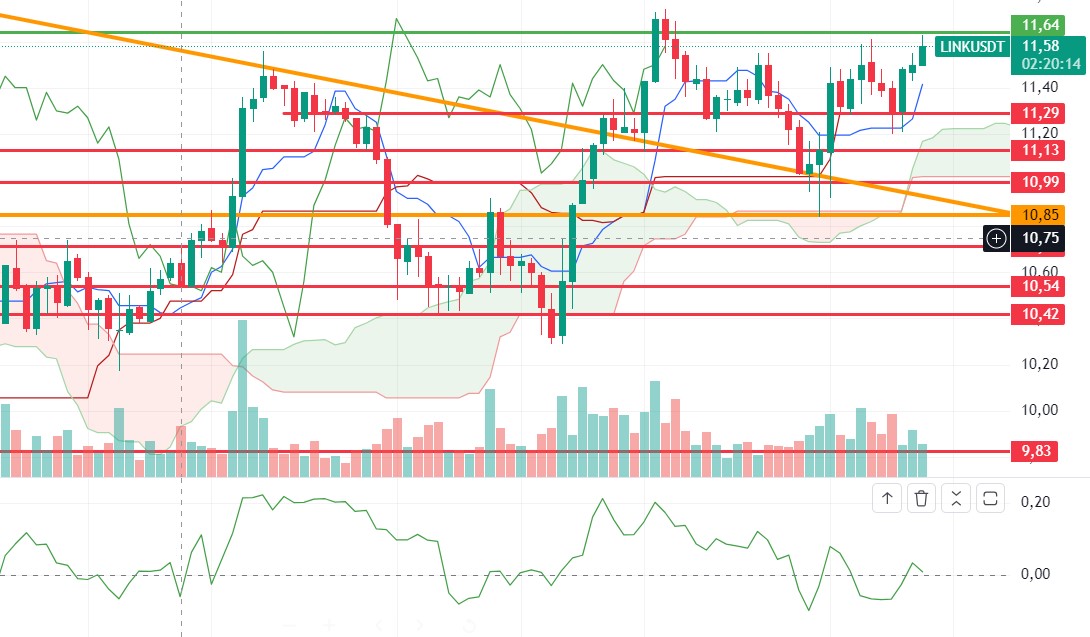
For LINK, which has pushed the 11.64 resistance level por clearly differentiating from Ethereum after a long time, the reaction it will receive from this level seems to be the determinant of the movement. It is seen that the positive structure en CMF continues. The voluminous break of 11.64 may bring upward pricing. 12.19 level may be the first target en this case. However, if it reacts from this level and starts to decline, we may see pullbacks to the range of 11.29 – 11.13 levels.
Supports 11.29 – 10.85 – 10.54
Resistances 11.64 – 12.19 – 12.42
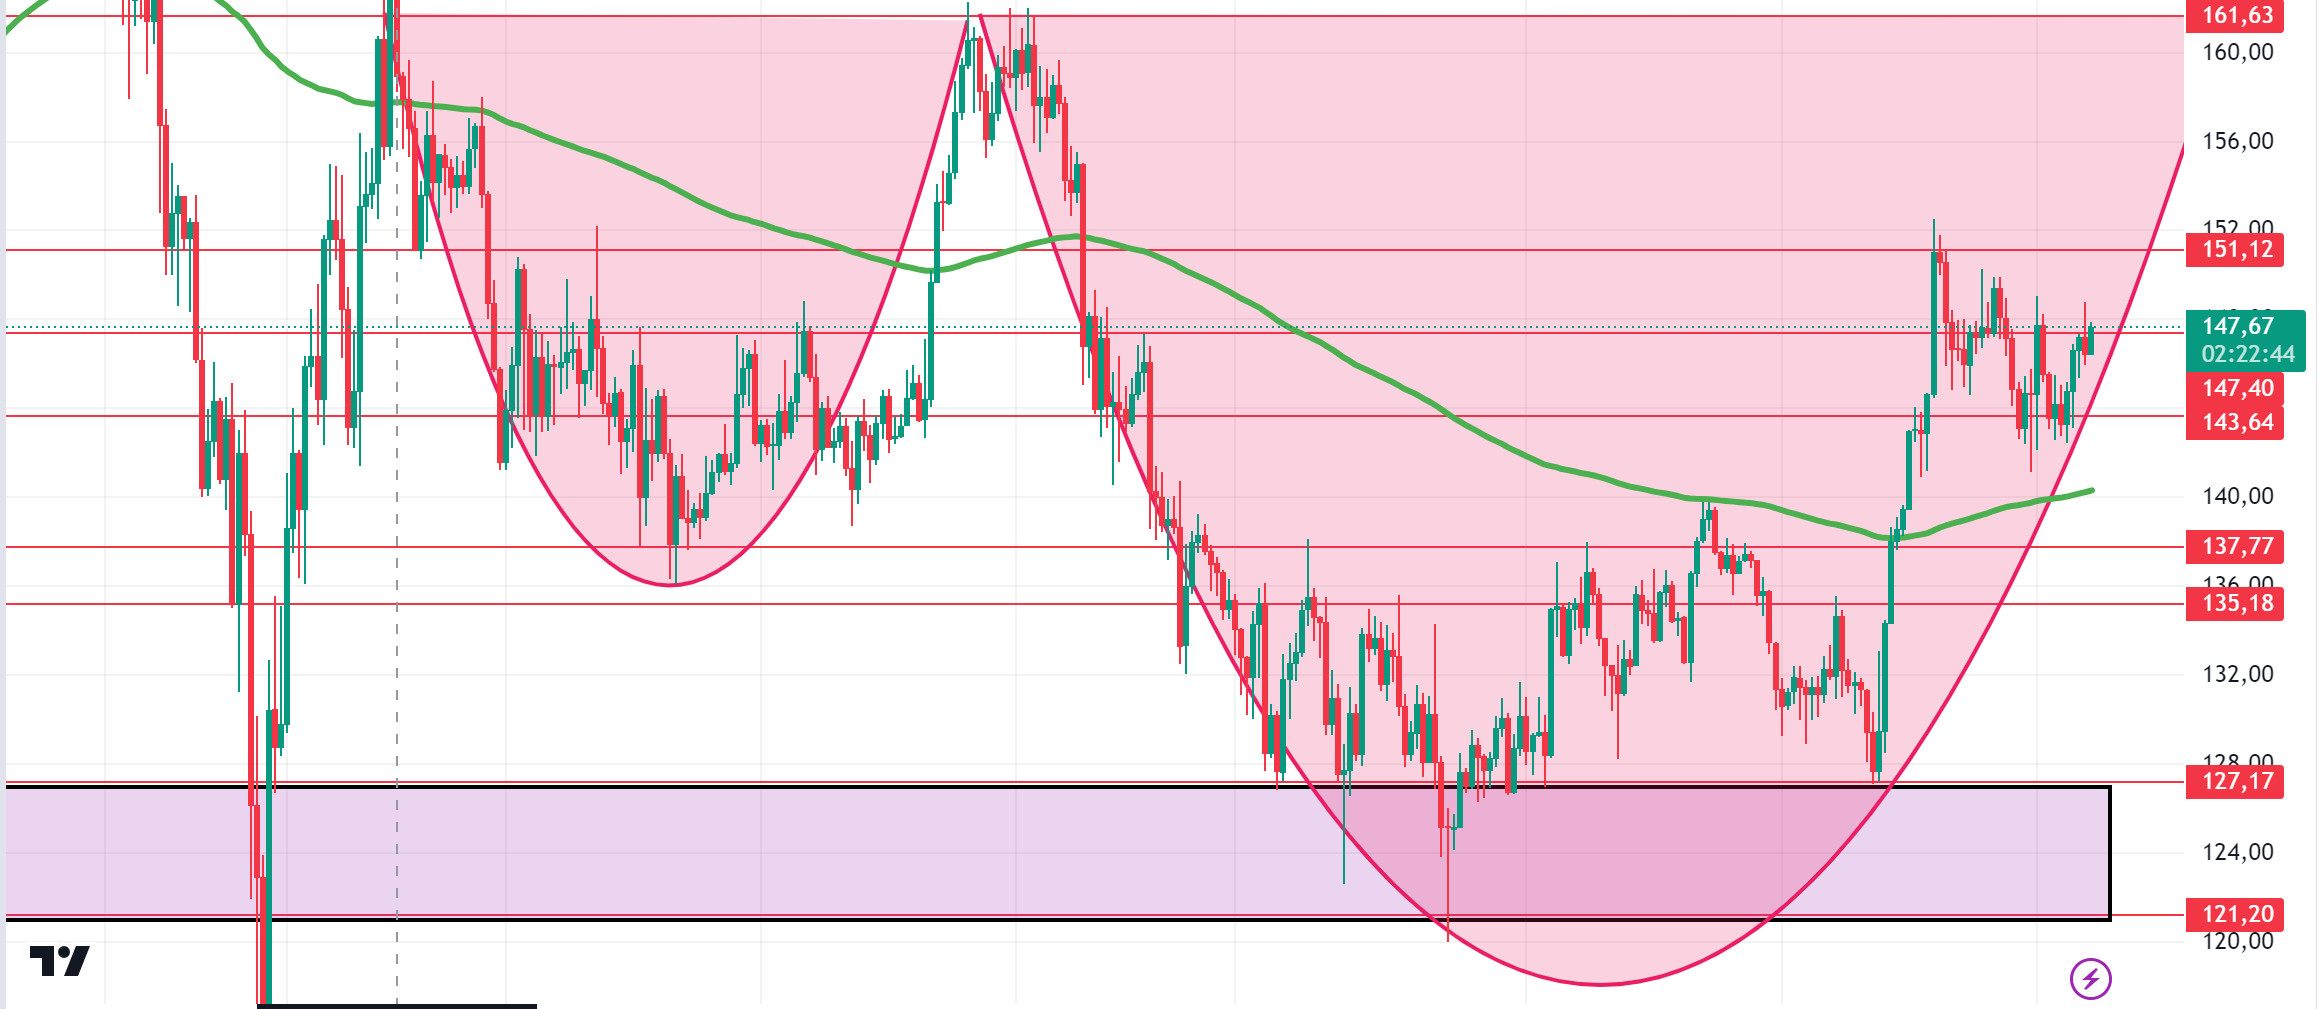
SOL/USDT
In the Solana ecosystem, Google announced el its Cloud X platform that it has “partnered with Solana Labs to make Web3 game development easier than ever”. Technically, SOL, which tried to break 150, seems to have lost its momentum. SOL, which has been pricing en a horizontal course since our analysis en the morning, continues to move en a cup-and-handle pattern. In the rises driven por both macroeconomic conditions and innovations en the Solana ecosystem, 147.40 – 151.12 levels appear as resistance. If it rises above these levels, the rise may continue. It can support the 200 EMA average en the pullbacks that will occur if investors make profit sales. 143.64 – 137.77 levels can be followed as support. If it comes to these support levels, a potential rise should be followed.
Supports 143.64 – 137.77 – 135.18
Resistances 147.40 – 151.12 – 161.63
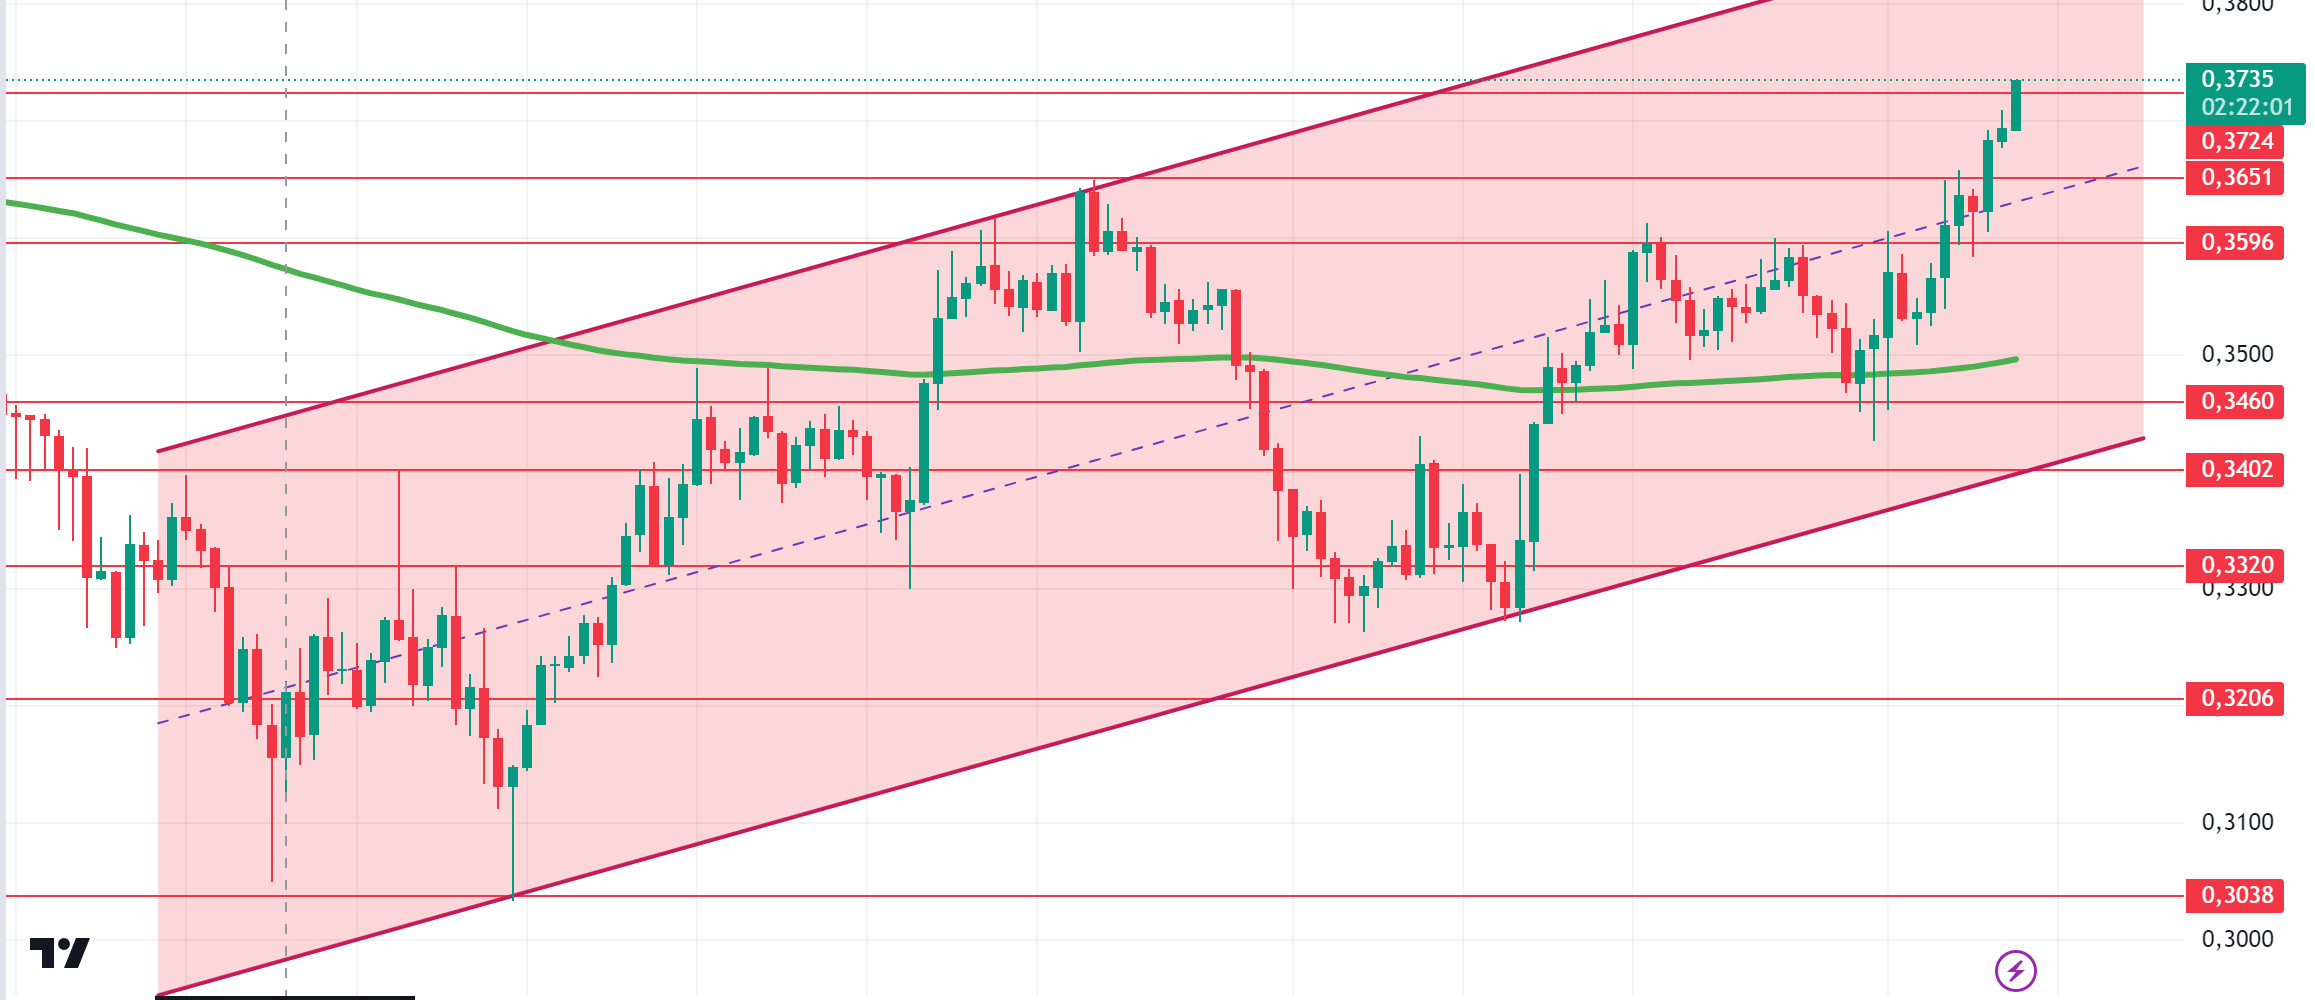
ADA/USDT
It is up 2.68% since our analysis this morning. This price action follows the announcement of the Ouroboros Leios upgrade, which aims to increase Cardano’s speed to over 1500 transactions per segundo (TPS). However, according to data from Intotheblock, large investors holding over $1 million en ADA have seen declines of up to 18%. This shows that whales that play an important role en the cryptocurrency market are exiting ADA. This may negatively affect the price en the coming days. Technically, ADA’s funding rate of 0.0101% en the last 8 horas is due to the fact that buyers are willing to pay this amount and carry long positions and predict that the price will rise. Since September 2, ADA, which has been moving en an upward channel, seems to break the channel upwards soon. If the 4-hora candle closes above the $ 0.3724 level, it may break the resistance of the rising channel. In retracements due to possible profit sales, it may gain momentum from the 200 EMA average. In this scenario, the 0.3651 level appears as a strong support. In the rises that will take place with the continuation of the positive atmosphere en the ecosystem, the 0.3724 level can be followed as resistance.
Supports 0.3596 – 0.3460 – 0.3402
Resistances 0.3651 – 0.3724 – 0.3951
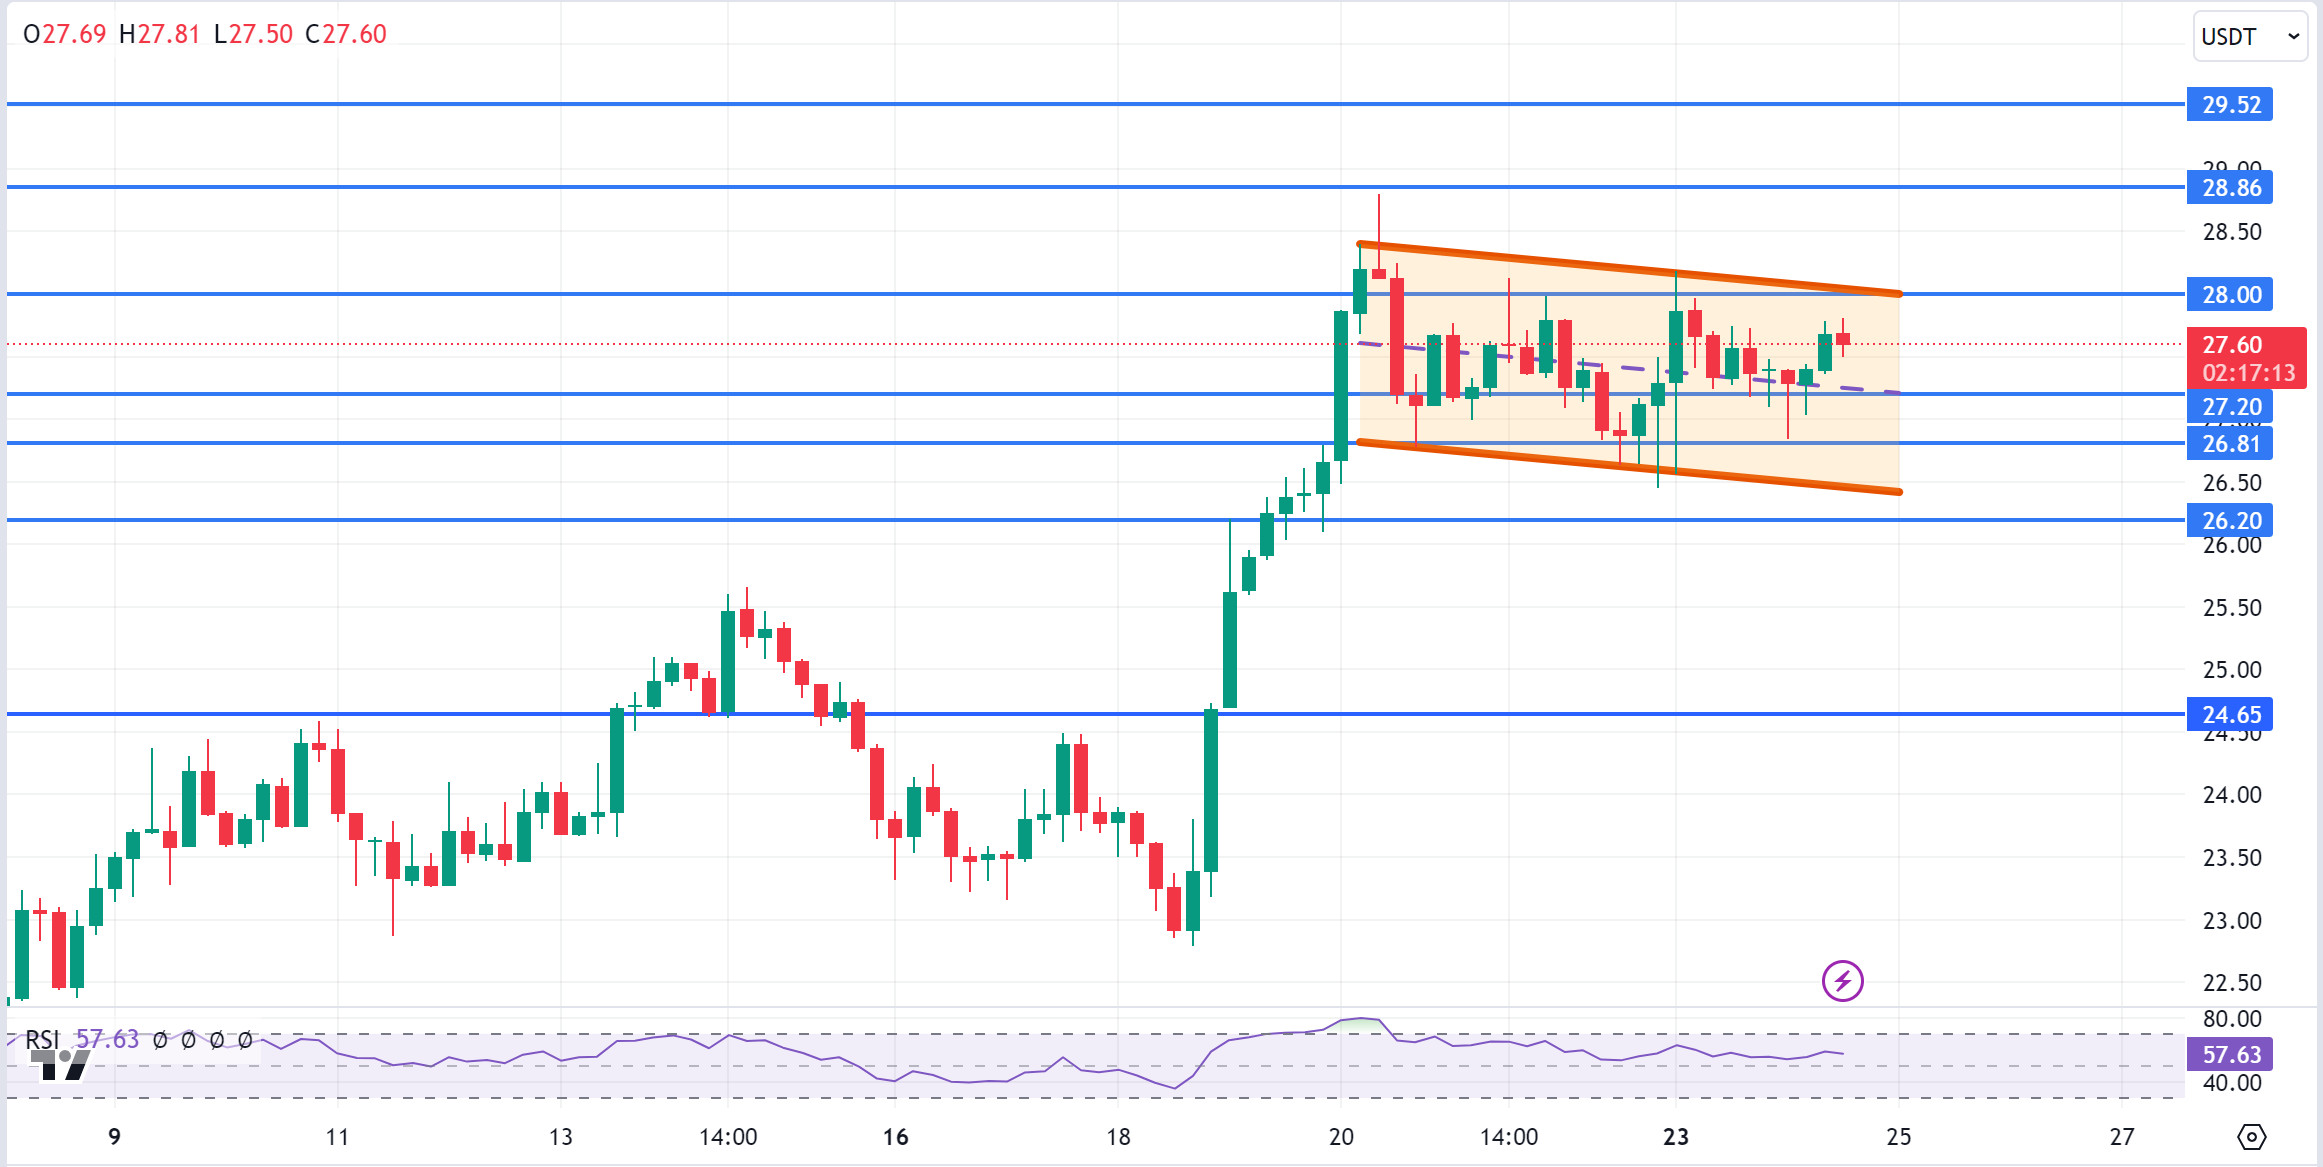
AVAX/USDT
AVAX, which opened today at 27.29, is trading at 27.60, up 1% during the day. The US conference board consumer confidence data to be announced today is important for a recession-sensitive market. If the confidence index is much lower than expected, it may be perceived negatively as it may trigger fears of recession en the market.
On the 4-hora chart, we see that a rising flag pattern has formed. It continues to consolidate en the falling channel near the horizontal and can be expected to break the channel upwards after moving en the channel for a while. In such a case, it may test 28.86 and 29.52 resistances. If the data from the US is perceived as a sign of recession and creates selling pressure, it may break the channel downwards. In this case, it may test 26.81 support. As long as it stays above 24.65 support during the day, it can be expected to continue its upward trend. With the break of 24.65 support, selling pressure may increase.
Supports 27.20 – 26.81 – 26.20
Resistances 28.00 – 28.86 – 29.52
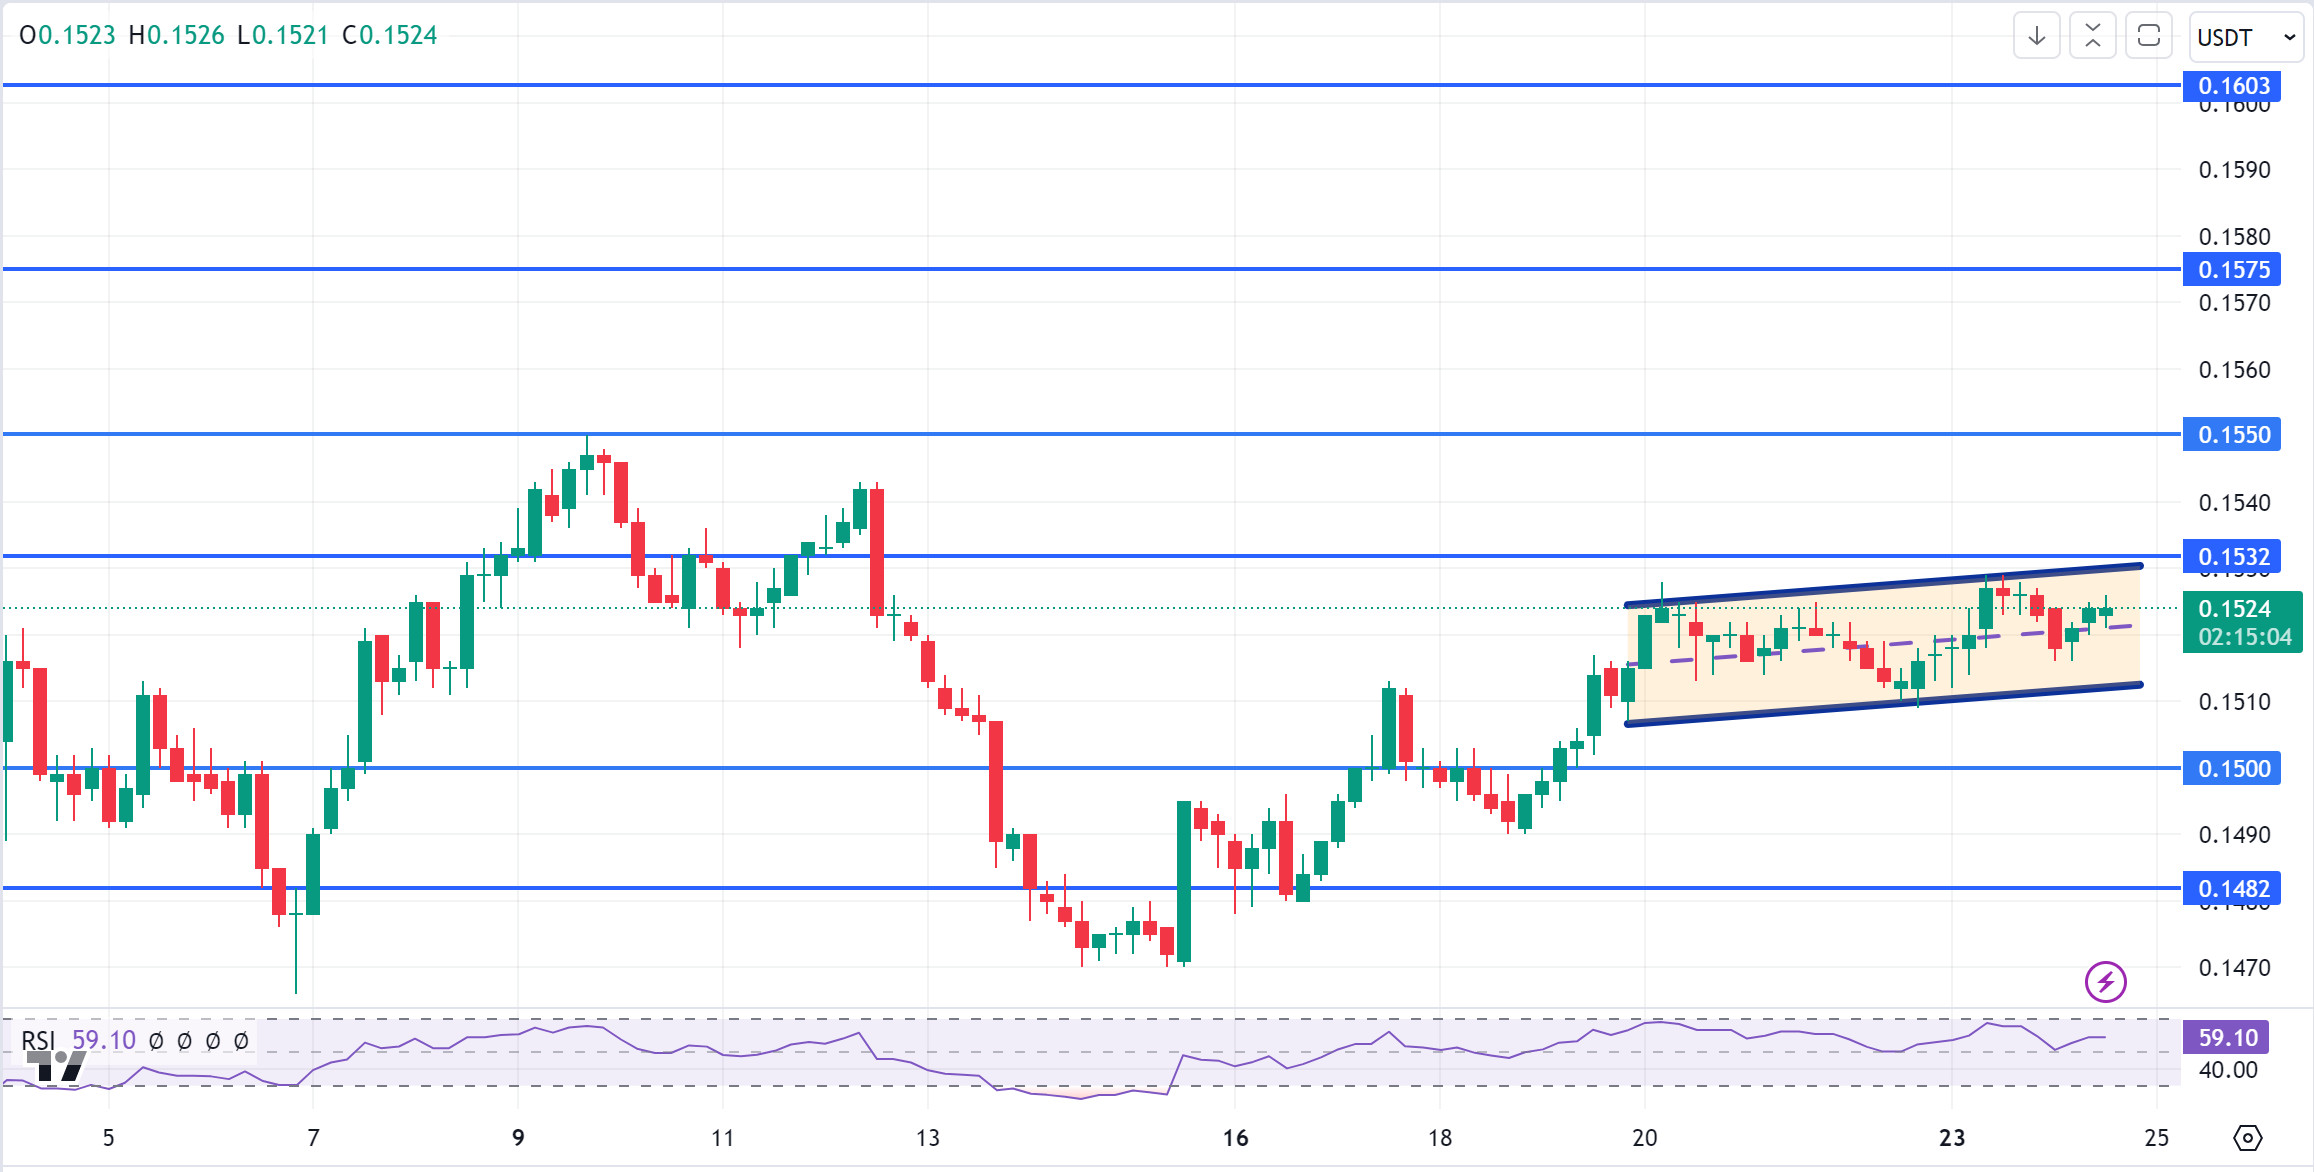
TRX/USDT
TRX, which started today at 0.1524, continued its horizontal course during the day and is still trading at 0.1524. US conference board consumer confidence data to be released today may create volatility en the market. This volatility may cause voluminous movements for TRX. TRX, which continues its horizontal and volume-free movement at the moment, is en an ascending channel el the 4-hora chart. The RSI is en the middle band of the rising channel with a value of 59 and some upside can be expected from here. In such a case, it can move to the upper band of the channel and test the 0.1532 support. However, it may move to the lower band with the sales reaction from the middle band of the channel. In such a case, it may test 0.1500 support. As long as TRX stays above 0.1482 support, the desire to rise may continue. If this support is broken downwards, sales can be expected to increase.
Supports 0.1500 – 0.1482 – 0.1429
Resistances 0.1532 – 0.1575 – 0.1603
XRP/USDT
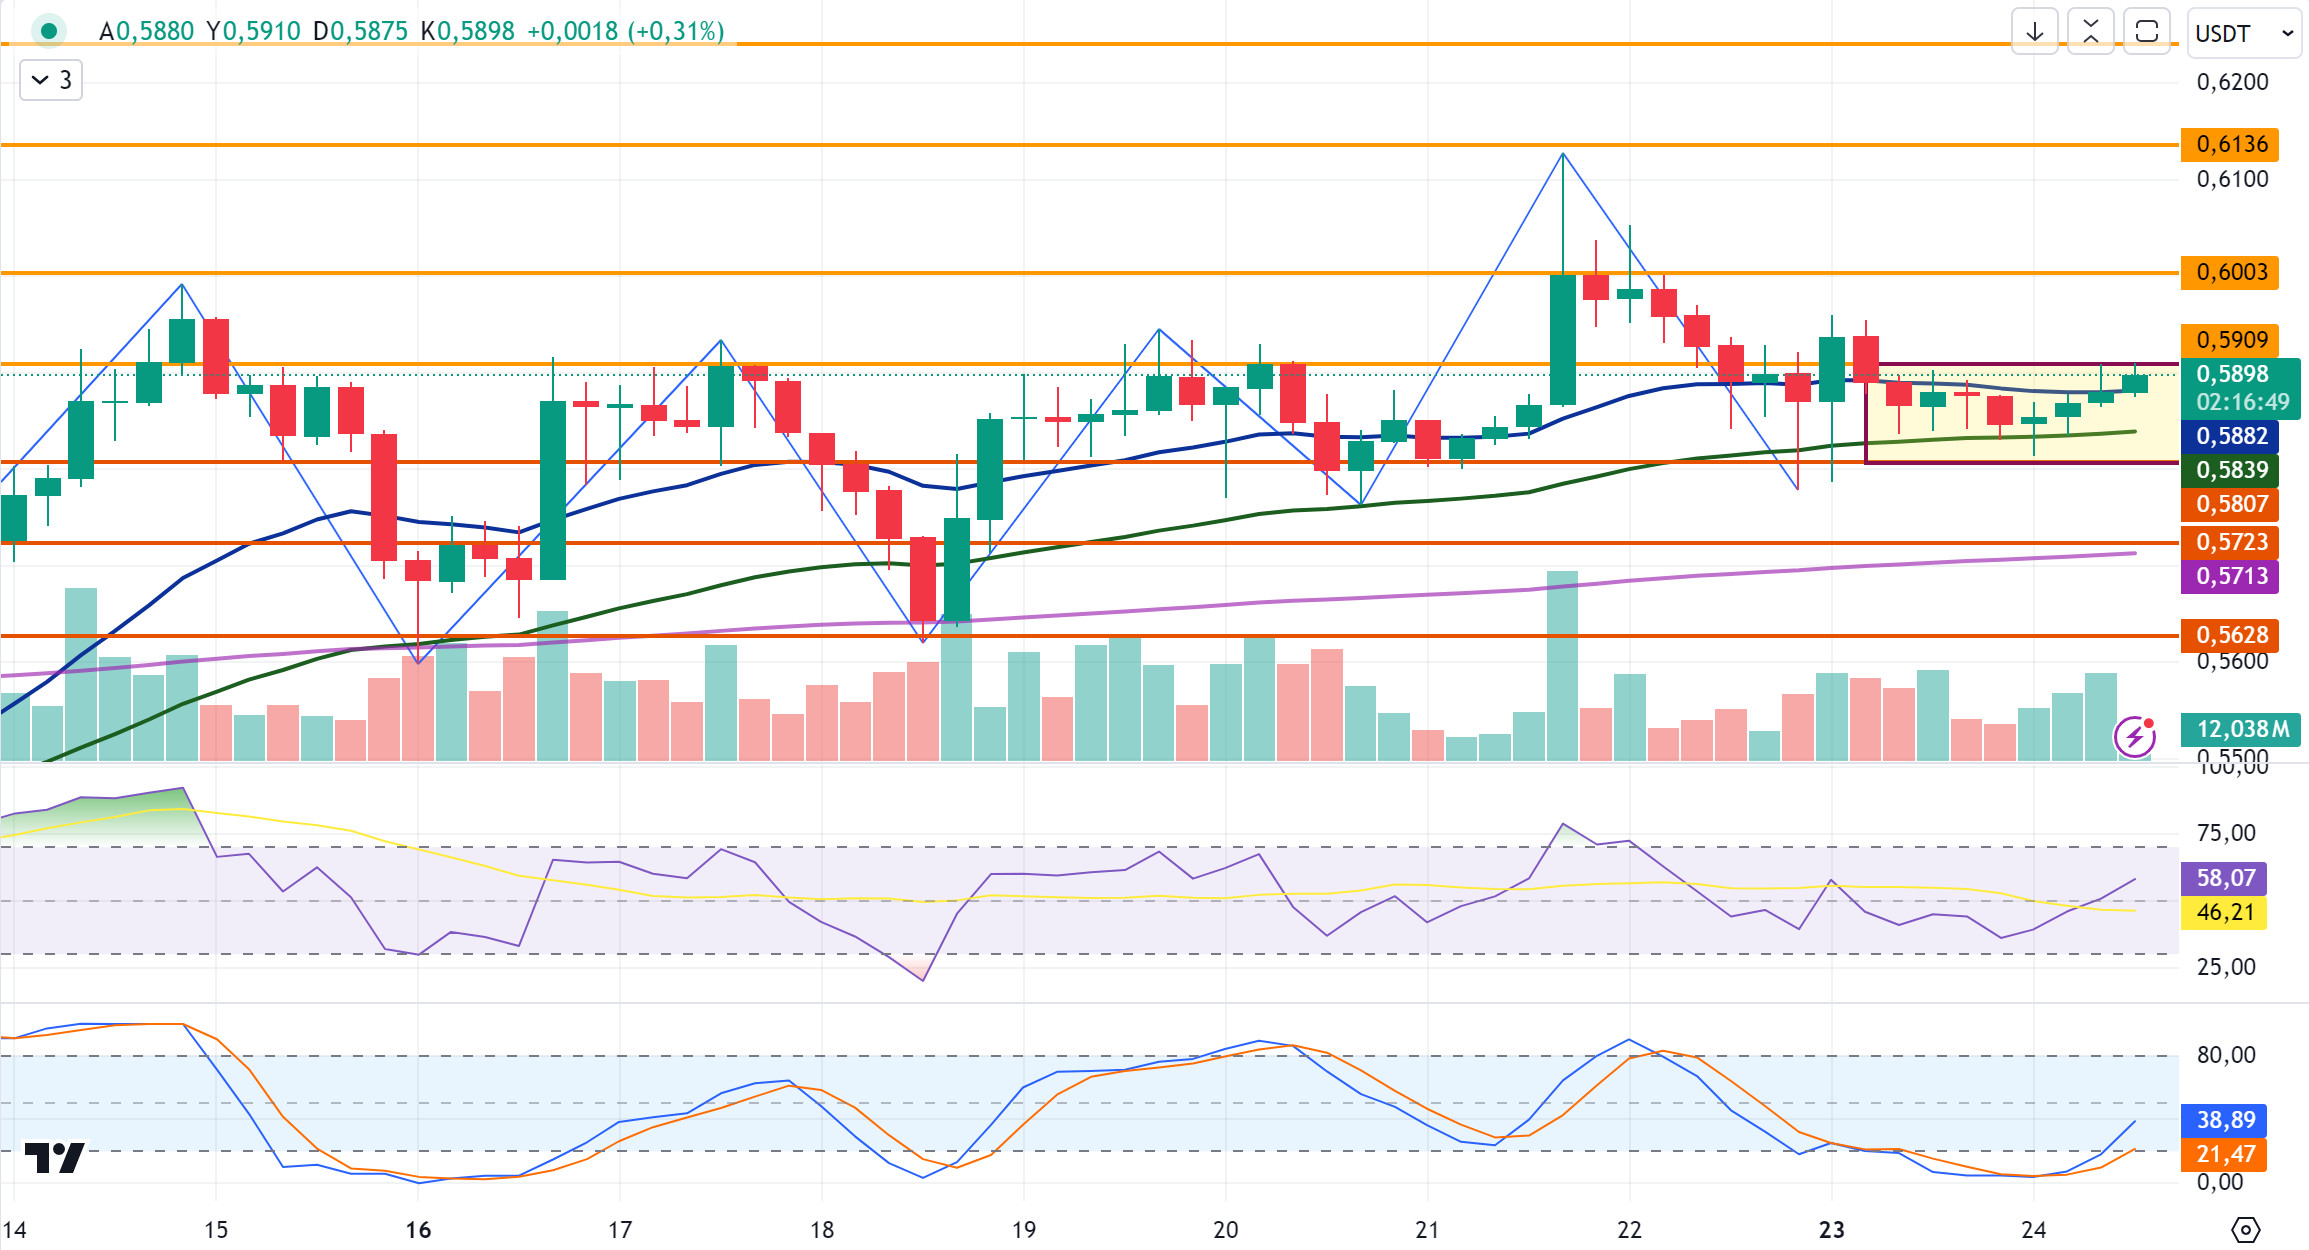
XRP continues to trade at 0.5898 today, up about 1%. In the 4-hora analysis, after testing the 0.5909 resistance level with its rise, it fell with the incoming sales and after falling below the EMA20 level, it is retesting the 0.5909 level en the last candle with its rise again and if it breaks it, it may test the resistance levels of 0.6003-0.6136 en the continuation of the rise. If the 0.5909 resistance level cannot be broken and a decline occurs, XRP may continue its movement en a horizontal band between the EMA20 and EMA50 levels. If it falls below the EMA50 level after the fall, it may test the support levels of 0.5807-0.5723-0.5628 with the deepening of the decline.
XRP may rise with possible purchases at the 0.5723 support level el the decline and may offer a long trading opportunity. On the rise, it may fall with possible sales at 0.6003 and may offer a short trading opportunity.
EMA20 (Blue Line) – EMA50 (Green Line) – EMA200 (Purple Line)
Supports 0. 5807 – 0.5 723 – 0.5628
Resistances 0.5909 – 0.6 003 – 0.6136
DOGE/USDT
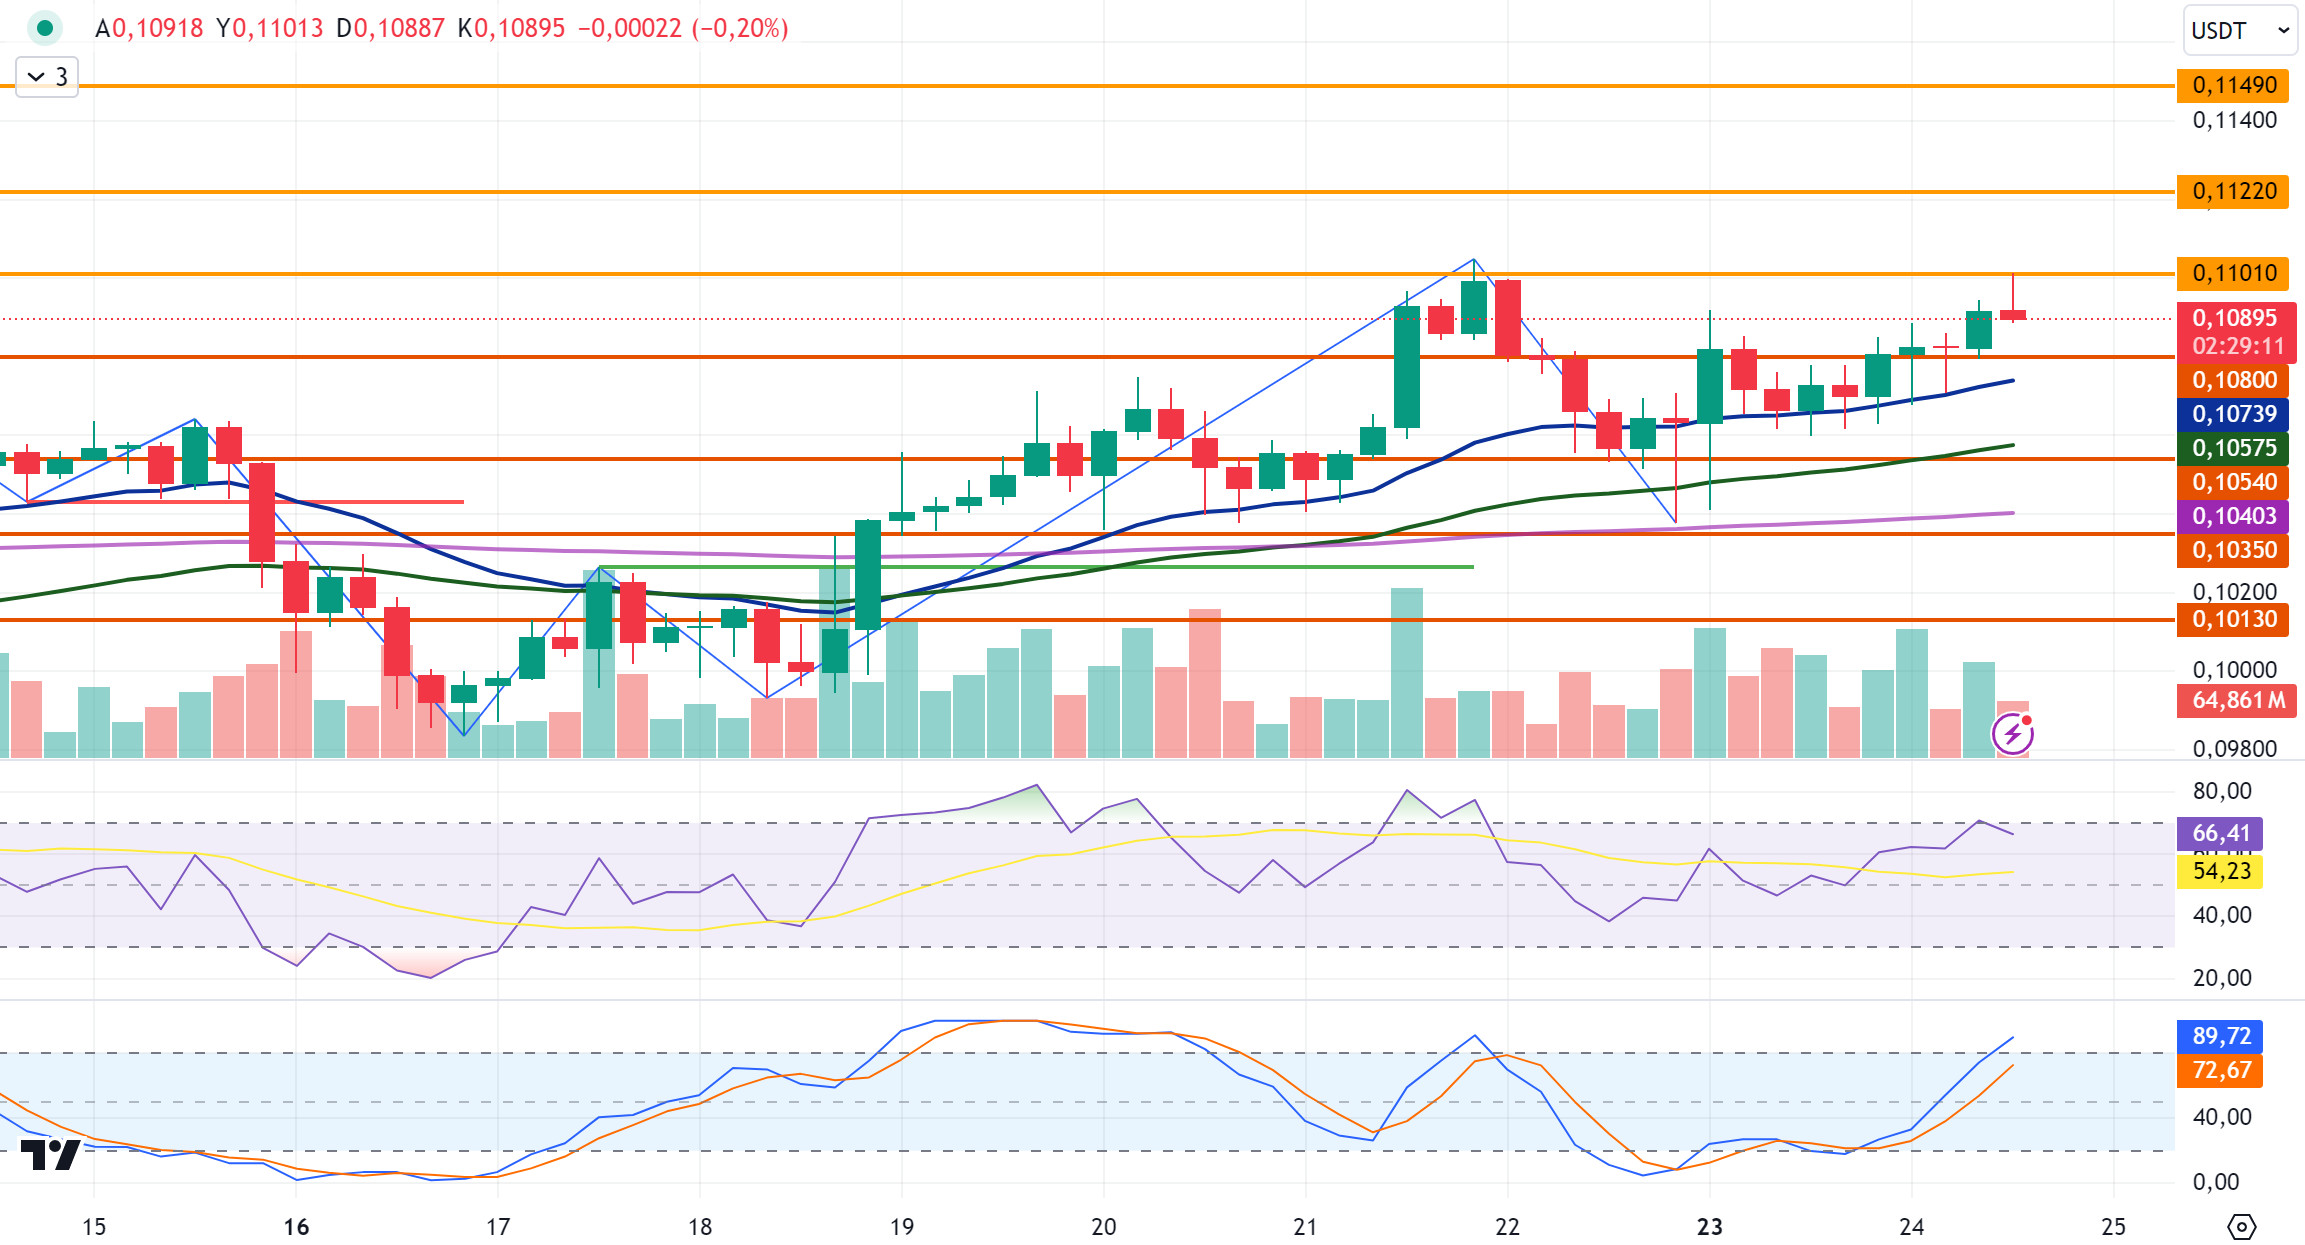
After starting today at 0.1080, DOGE tested the EMA20 level en the 4-hora analysis with the decline it experienced after starting today at 0.1080 and failed to break it and started to rise with the incoming purchases. DOGE, which continued its rise por breaking the 0.1080 level after its rise with incoming purchases, tested the 0.1101 resistance level en the last candle. It is currently trading at 0.1089 with a decline as a result of sales at the resistance level en question. If the decline continues, it may test the 0.1080 support level and if it breaks, it may test the 0.1054-0.1035 support levels with the deepening of the decline. In case it starts to rise again, it may retest the 0.1101 resistance level and if it breaks it, it may test the 0.1122-0.1149 resistance levels en the continuation of the rise.
DOGE may rise with possible purchases at EMA20 and EMA50 levels en its decline and may offer a long trading opportunity. In its rise, the 0.11 resistance zone comes to the fore and may decline with possible sales at this level and may offer a short trading opportunity.
EMA20 (Blue Line) – EMA50 (Green Line) – EMA200 (Purple Line)
Supports 0.1080 – 0.1054 – 0.1035
Resistances 0.1 101- 0.1122 – 0.1149
LEGAL NOTICE
The investment information, comments and recommendations contained herein do not constitute investment advice. Investment advisory services are provided individually por authorized institutions taking into account the risk and return preferences of individuals. The comments and recommendations contained herein are of a general nature. These recommendations may not be suitable for your financial situation and risk and return preferences. Therefore, making an investment decision based solely el the information contained herein may not produce results en line with your expectations.
