
MARKET SUMMARY
Latest Situation en Crypto Assets
*Prepared el 26.09.2024 at 14:00 (UTC)
WHAT’S LEFT BEHIND
US Gross Domestic Product Announced
US Gross Domestic Product was announced as 3 percent as expected. On the US side, the data coming en line with expectations continues to be interpreted positively for the markets.
China to provide another 285 billion dollars of support to the economy
China, which announced a significant economic support package el Tuesday, seems to continue this policy. The world’s 2nd largest economy will issue private bonds totaling up to 2 trillion yuan (285 billion dollars). Following the news from Reuters, gold, the rising asset of recent days, renewed its record, while silver rose above $ 32. Bitcoin also rose to $ 64,500 again.
China’s Capital Injection and Rise en Bitcoin ETF Demand
Data from SoSoValue shows that total daily net inflows for BTC ETFs exceeded $100 million for the segundo day en a row amid global financial easing.
Kamala Harris Emphasizes ‘Blockchain’
In her speech en Pittsburgh, Kamala Harris announced that she is committed to US leadership en technologies such as blockchain, artificial intelligence and quantum computing. Reiterating her support for digital assets, Harris stated that these technologies will play an important role en creating economic opportunities.
HIGHLIGHTS OF THE DAY
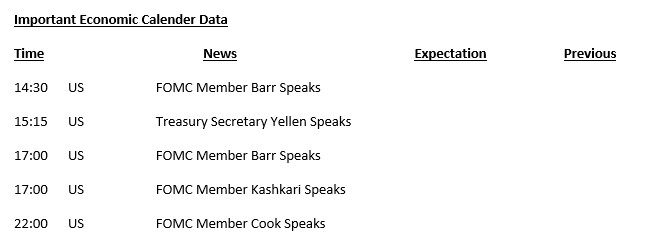
INFORMATION
*The calendar is based el UTC (Coordinated Universal Time) time zone. The economic calendar content el the relevant page is obtained from reliable news and data providers. The news en the economic calendar content, the date and time of the announcement of the news, possible changes en the previous, expectations and announced figures are made por the data provider institutions. Darkex cannot be held responsible for possible changes that may arise from similar situations.
MARKET COMPASS
Global markets, which have been buoyed por the steps taken por China to support its economy and Micron Technology’s financial results that exceeded expectations, are following the agenda regarding the health of the US economy.
The number of people claiming unemployment benefits en the US reached its lowest level en the last 4 months. Despite this decline, the number of applications remained above the averages seen earlier this year. The country’s economy expanded por 3% en the segundo quarter as expected. Durable goods orders (0.0%), which were expected to have declined en August, remained unchanged. Core durable goods orders, which exclude transportation items, rose 0.5%, beating expectations for a 0.1% increase. Taken as a whole, the data painted a positive picture for the US economy.
In addition to the macro data set, we watched the statements of the Federal Open Market Committee (FOMC) members. Chairman Powell’s pre-recorded keynote speech at the US Treasury Market Conference was broadcast. The Chairman did not address the current monetary policy.
US equity markets started the new day with a mixed start after European indices continued the exuberant course they took over from Asian stock markets during the day. Nasdaq diverged significantly positive with the effect of Micron Technology. The dollar index fluctuated after rising with positive data flow. We also saw the reflections of the global perception en digital assets. The rise en BTC, which started en the Asian session, was limited around $65,000.
Positive data releases from the US, while reducing the likelihood of a recession, may mean a weakening en the pace of interest rate cuts por the FED. Therefore, it may be important for the market to choose between the positive sentiment of being able to avoid an economic contraction and the positive sentiment of expectations that the FED will be able to continue its rapid rate cuts. For now, it seems that a balance between the two opposite camps is being tried to be found, but at some point the market will have to make a decision about this. Therefore, we expect to see intraday rises and falls en digital assets.
TECHNICAL ANALYSIS
BTC/USDT
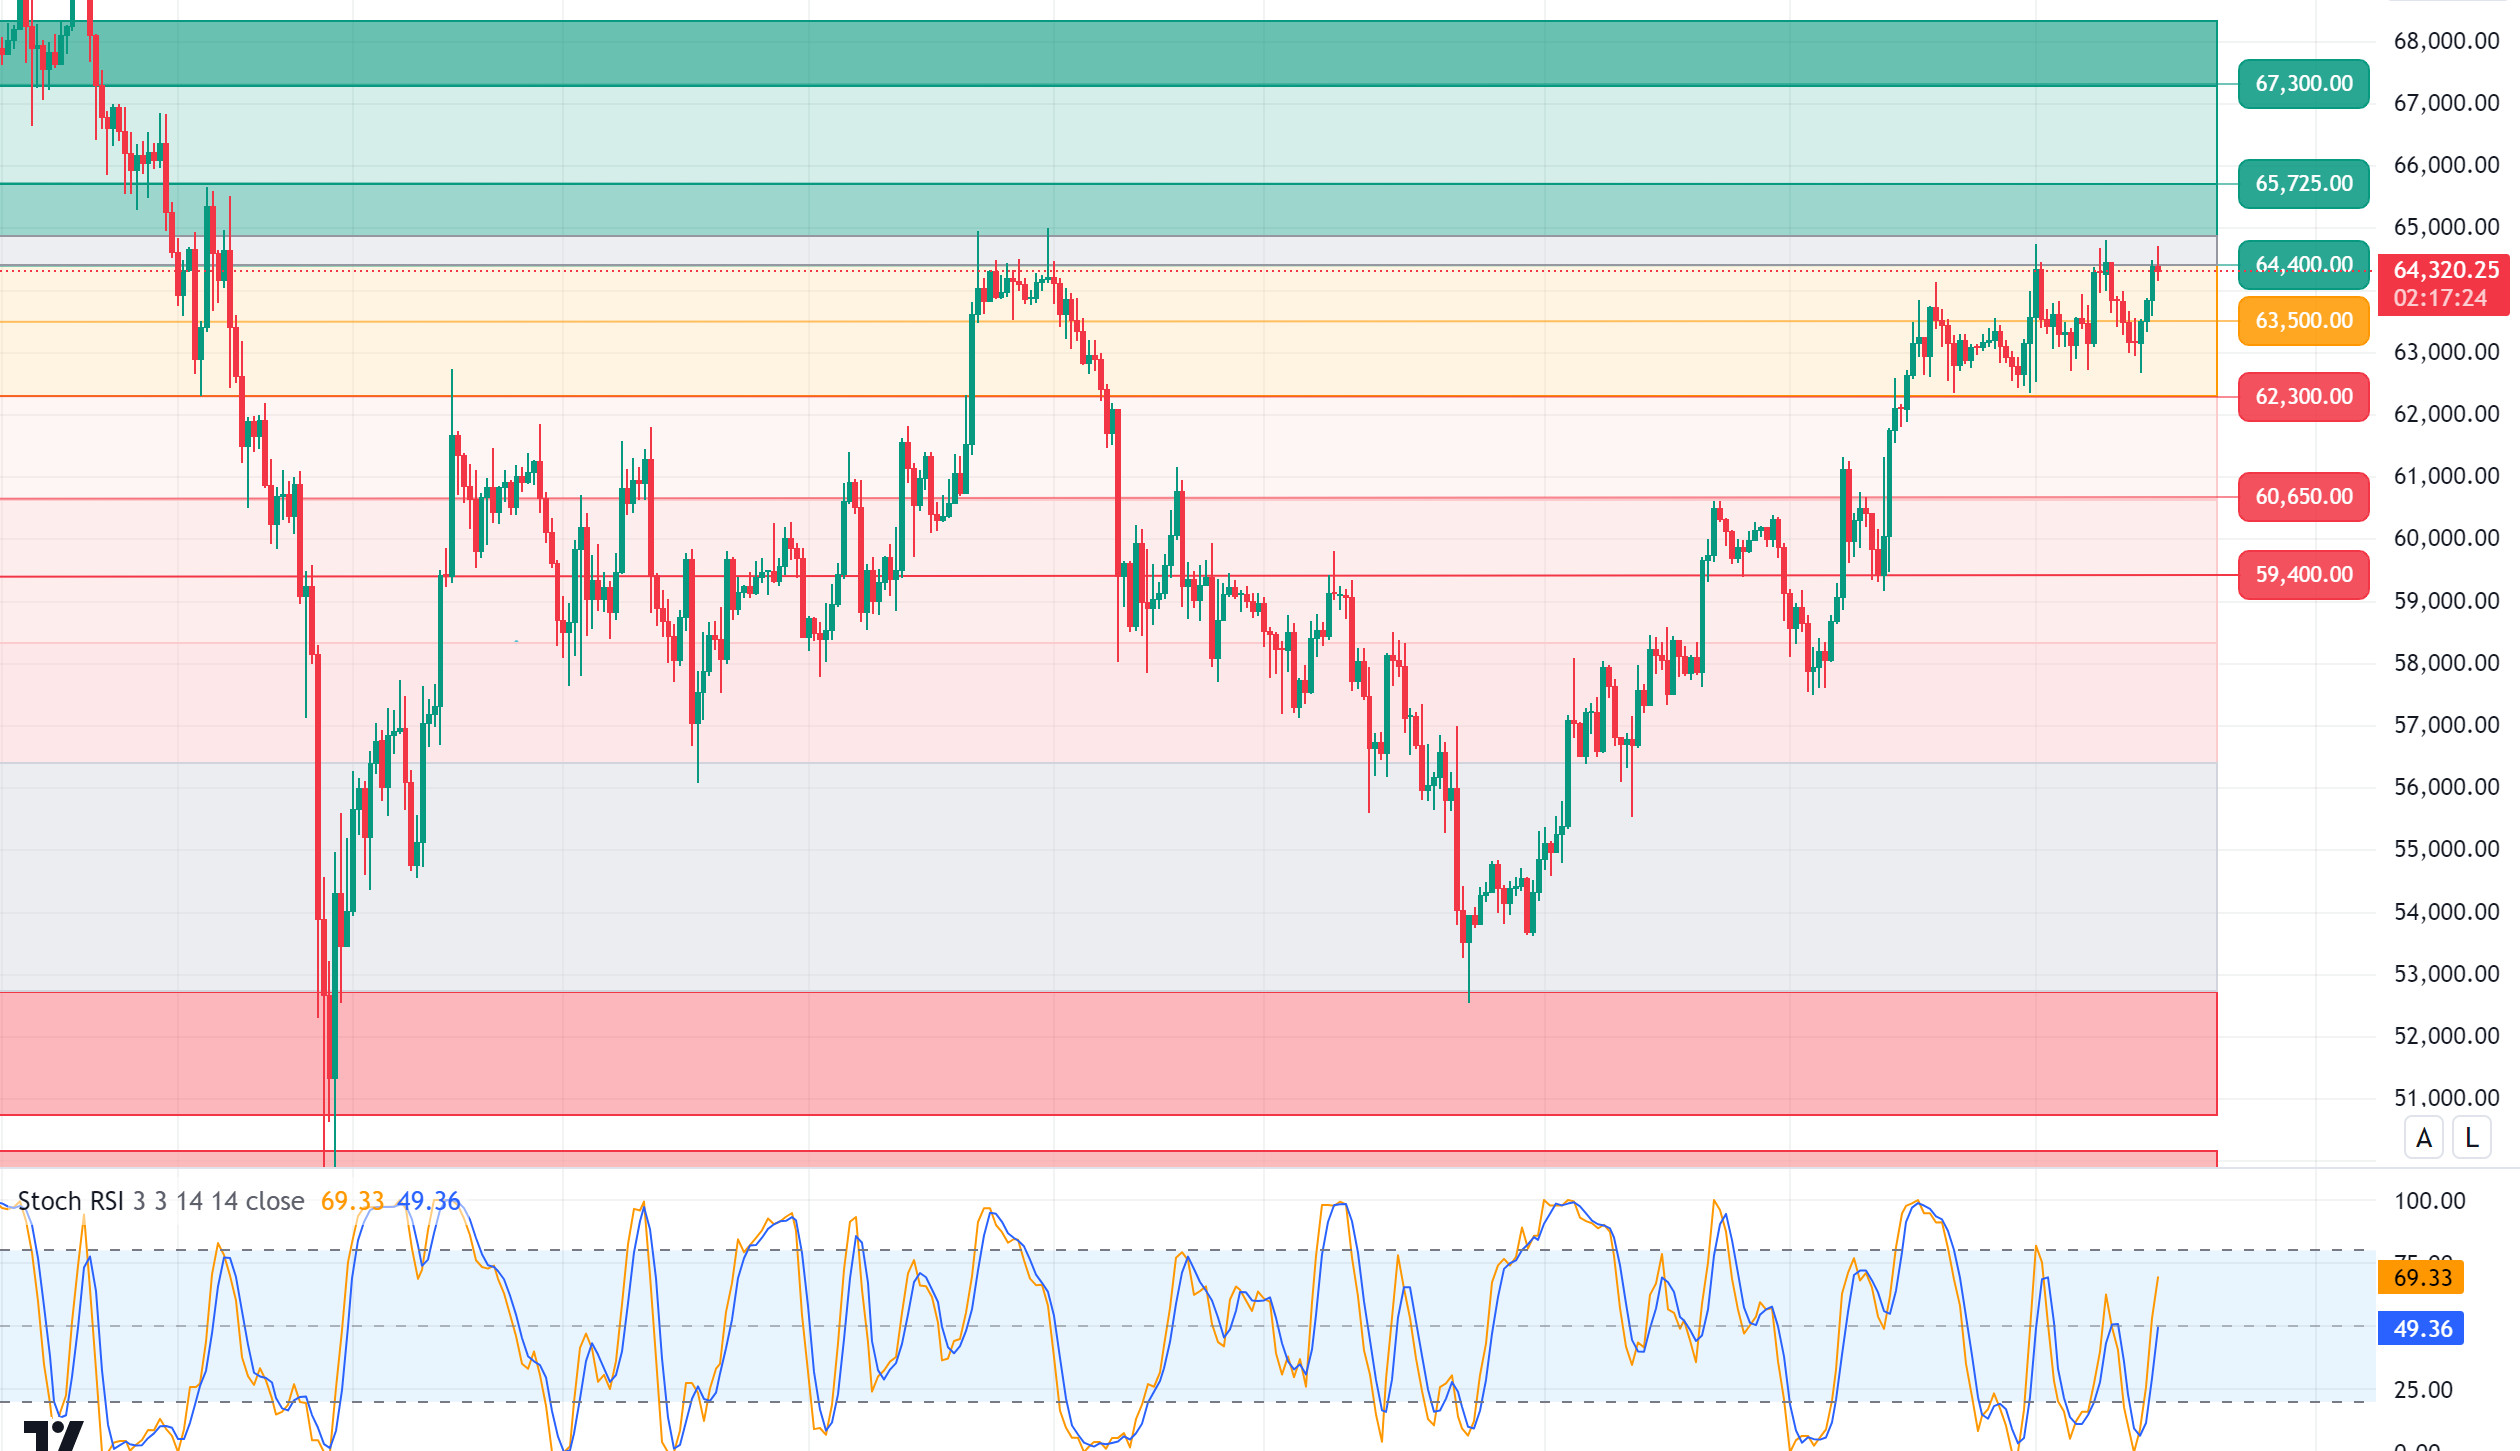
Movement en Bitcoin! US Gross Domestic Product data was announced as 3% as expected. The data coming within expectations el the US side continues to be interpreted positively for the markets. The fact that the FED cut interest rates por 50 basis points at its previous meeting seems to put the markets el a soft landing en the economic contraction following the pandemic. Another important development of the day came from China. The support of the government, which added a new one to its previously announced stimulus package and announced another 285 billion dollars of support, continues to have a positive impact el global markets and reinforce the optimistic mood en Bitcoin. In the BTC 4-hora technical analysis, we see that the 64,400 point, which is the third resistance level, has been tested for the third time and has not yet been able to break it. The upside breakout of this level, which appears as a major resistance level, may only be possible with 4-hora closes above it. BTC, which struggles with upward momentum en this period when the optimistic mood is felt at such a high level, continues to make BTC think. In a possible sharp pullback, it may be necessary to pay attention to technical support levels. The level that appears as a minor support point is 63,500.
Supports 62,300 – 60,650 – 59,400
Resistances 64,450 – 65,725 – 67,300
ETH/USDT
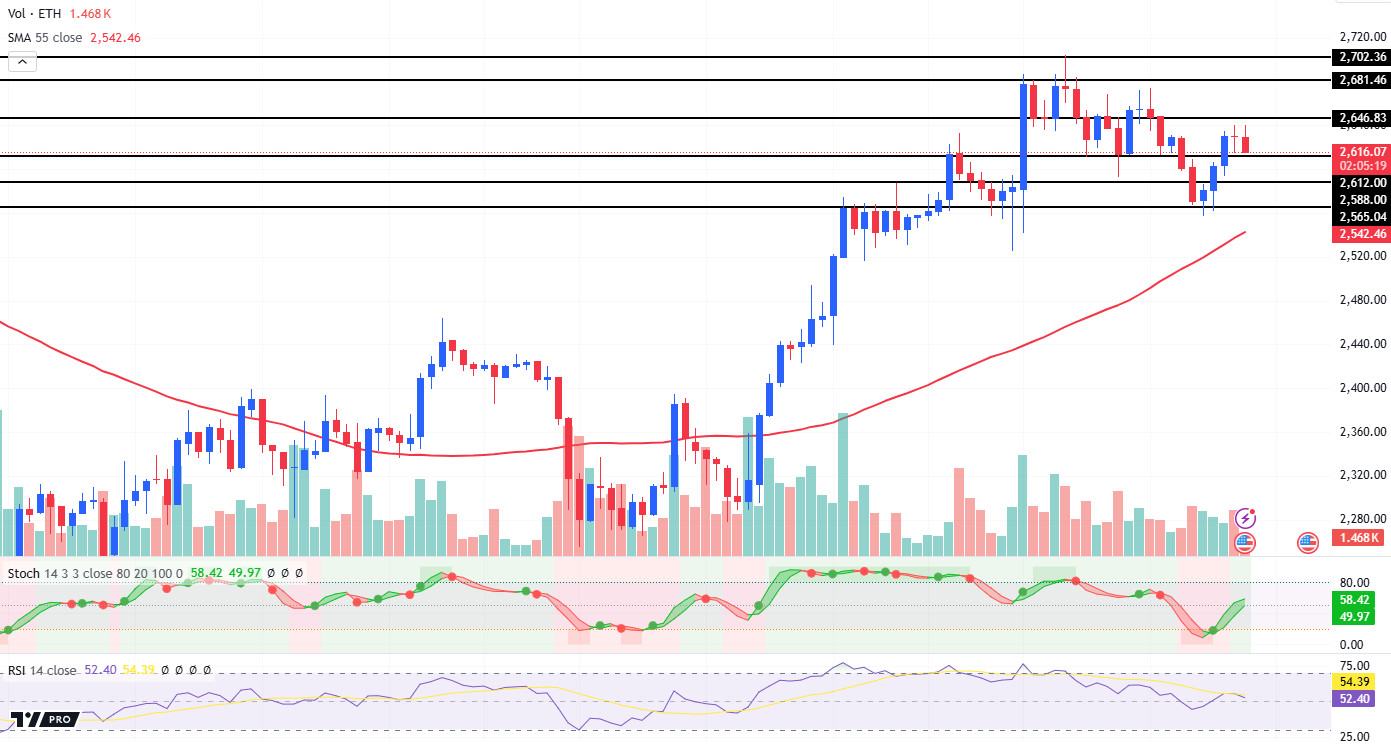
After the recent rally that started with the Asian markets, ETH limited its gains to some extent. The upward movement that started around 2,565 and stopped before moving above 2,645 resistance may mean a new correction. If 2,612 support is broken, the decline may expand to 2,590 support. Afterwards, if the movement continues, the 2,565 level will be tried to be defended. If 2,612 support works with the continuation of the increase en risk appetite, 2,645 resistance may be tested once again.
Supports 2,612 – 2,590 – 2,565
Resistances 2,645 – 2,680 – 2,700
LINK/USDT
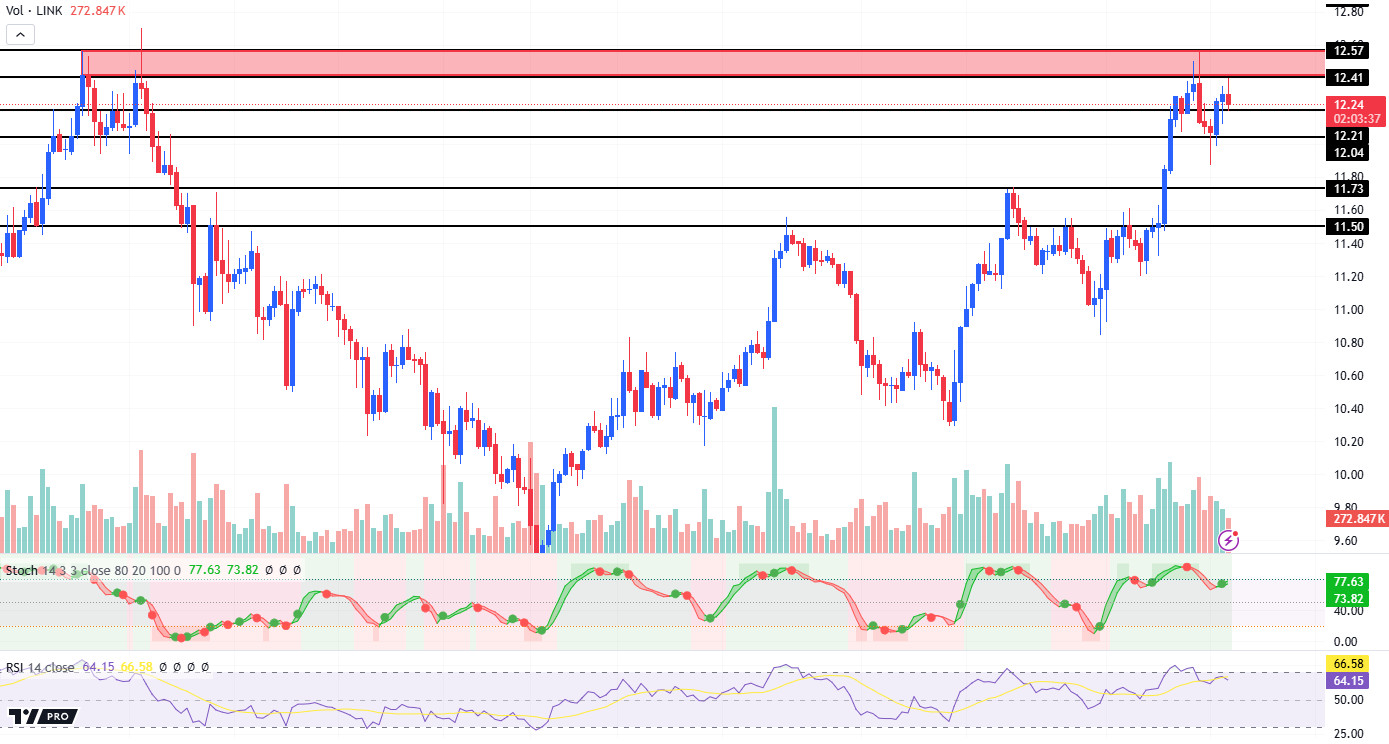
LINK, accompanying the rise en digital assets, is trying to find support at 12.20. Below the 12.40-12.60 resistance band, the retreat may continue and if the 12.20 support is broken, the decline may continue until around 11.70. The operation of 12.20 support seems to depend el the continuation of risk appetite en global markets. If this happens, 12.40 has the potential to limit the rises as the first resistance.
Supports 12.19 – 11.83 – 11.64
Resistances 12.42 – 12.71 – 13.46
SOL/USDT
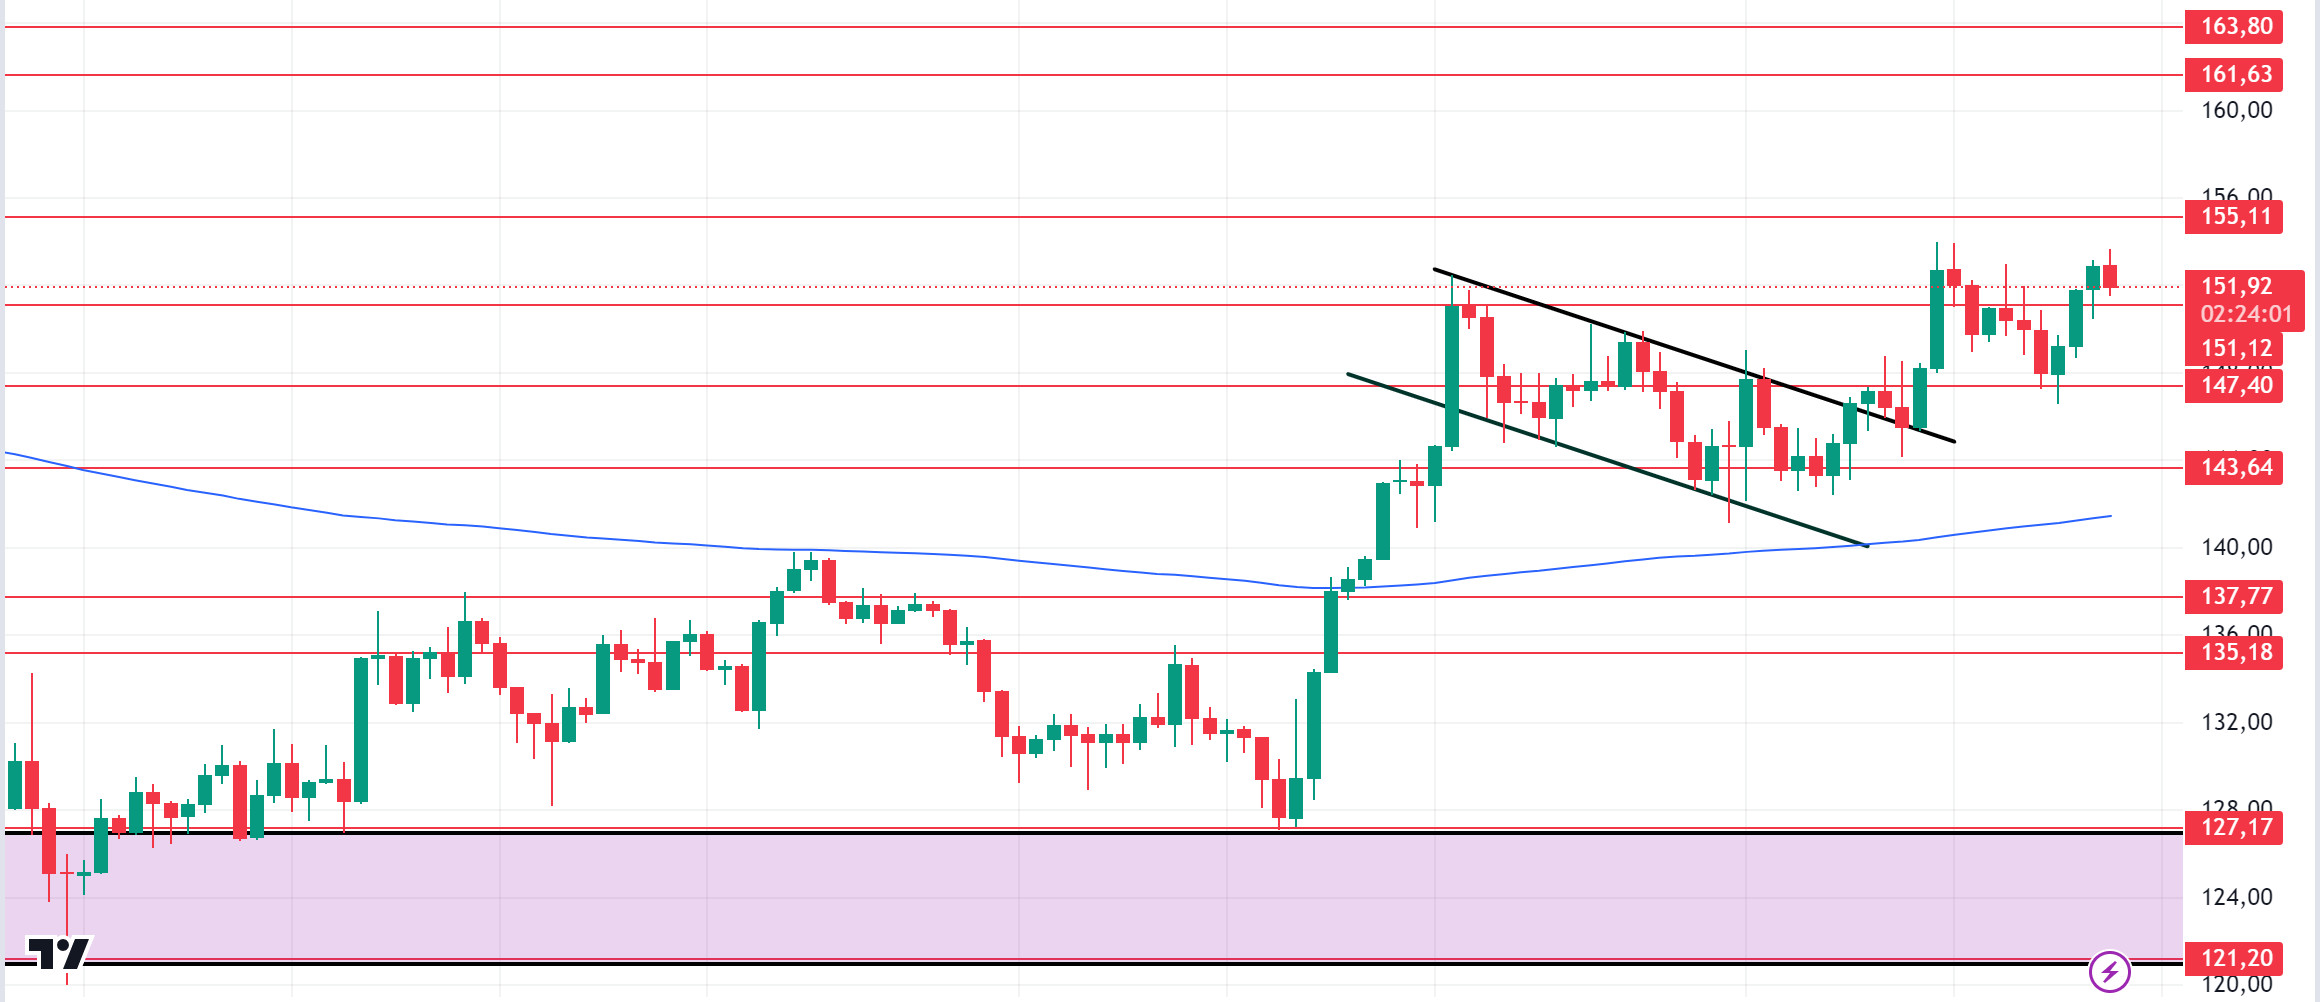
Powell did not talk about monetary policy and economic outlook. At the same time, the GDP figure from the US came en at 3.0%, as he had forecast. This points to a steady and consistent economic expansion. In the Solana ecosystem, onchain data shows that a Solana whale sold 200,000 tokens en the last three days. The investor then deposited nearly $30 million worth of assets into a top-volume centralized crypto exchange. We will see if this will cause a drop en the SOL token. When we examine the chart, SOL broke the 151.12 level, which is strong resistance, as the GDP figure from the US has been positive since our analysis en the morning. Both macroeconomic conditions and innovations en the Solana ecosystem, 155.11 – 161.63 levels appear as resistance levels. If it rises above these levels, the rise may continue. It can support the 200 EMA average en the pullbacks that will occur if investors continue profit sales. 151.12 – 147.40 levels appear as support. If it comes to these support levels, a potential rise should be followed.
Supports 151.12 – 147.40 – 143.64
Resistances 155.11 – 161.63 – 163.80
ADA/USDT
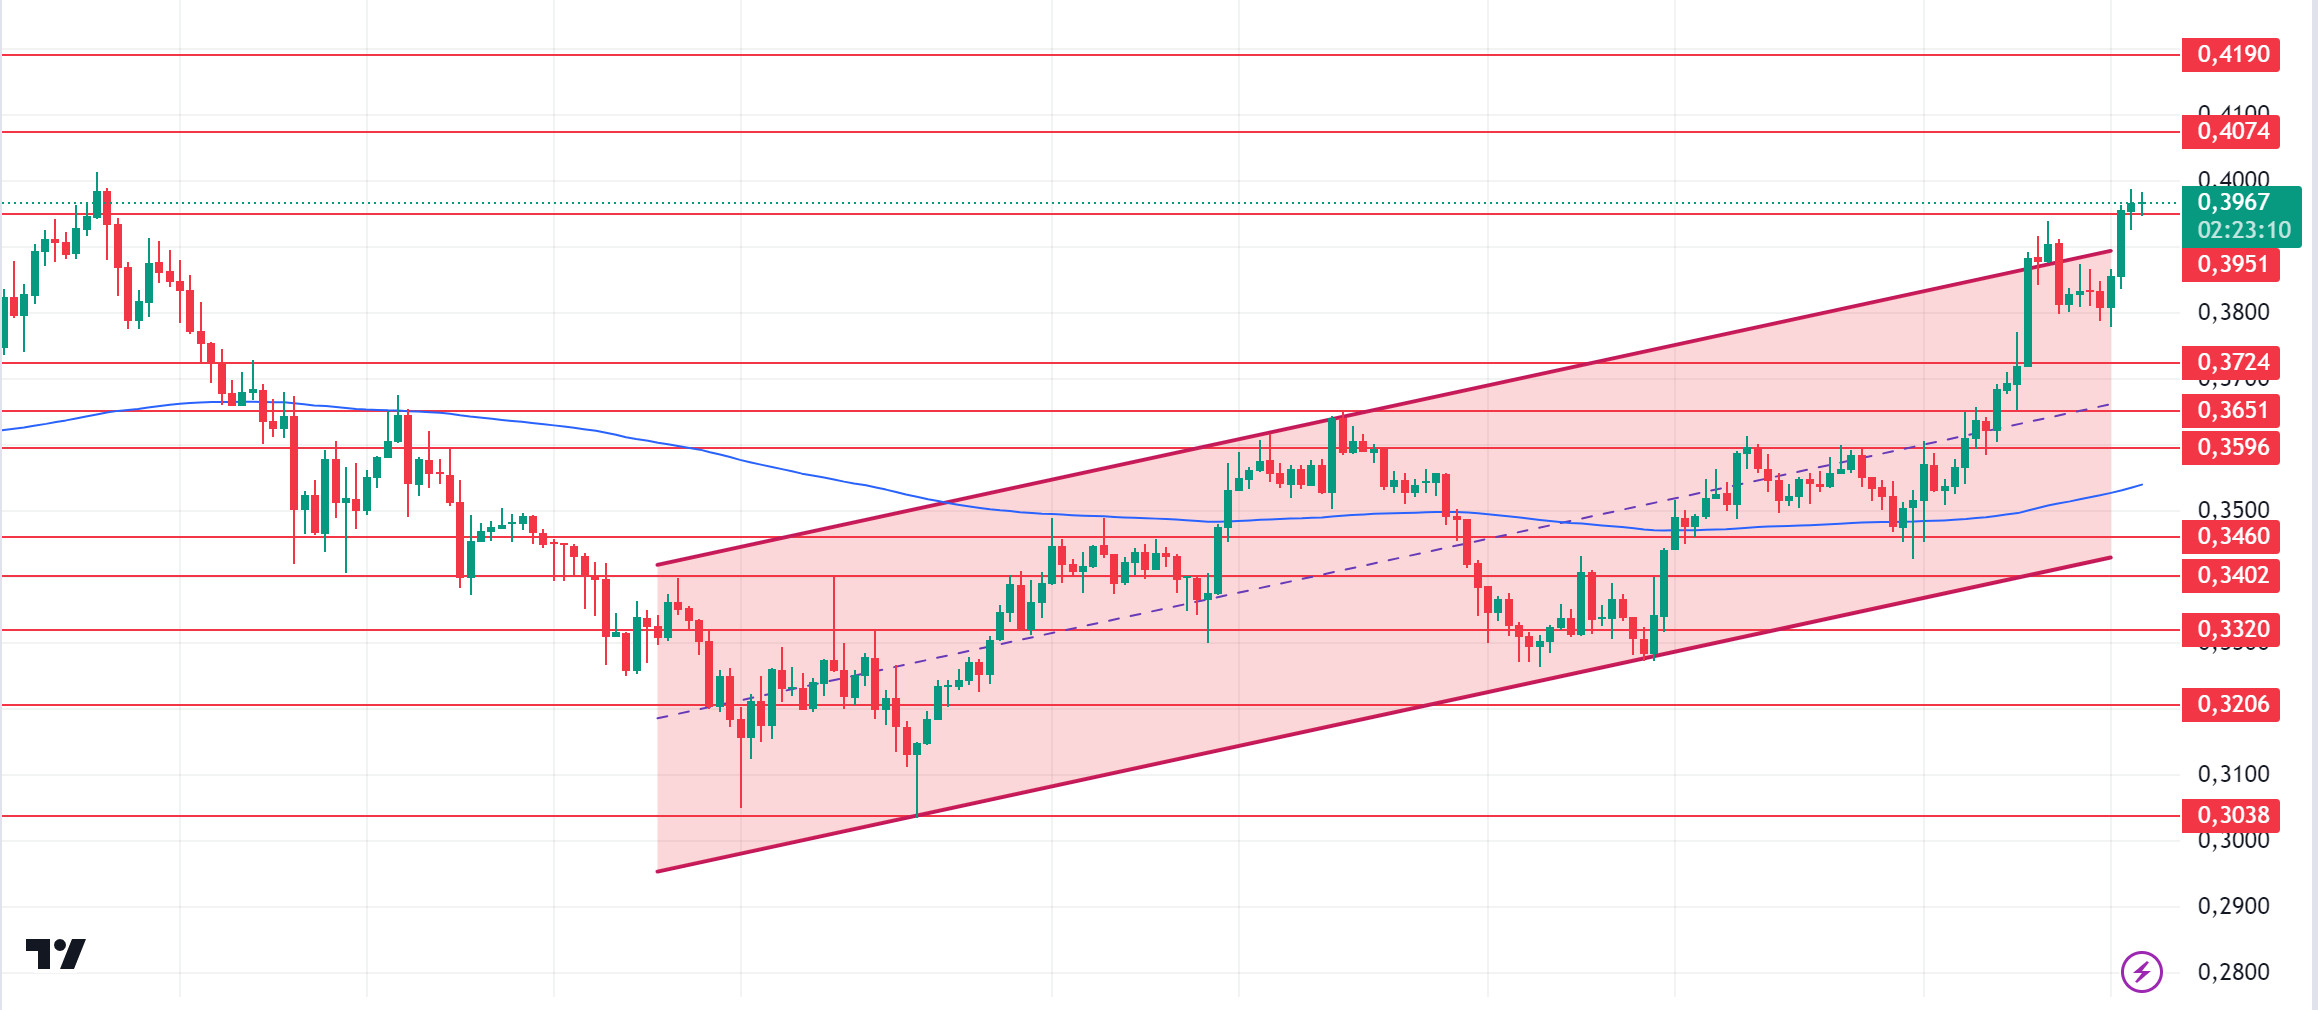
Powell did not talk about monetary policy and economic outlook. At the same time, the GDP figure from the US came en at 3.0%, as he had forecast. This points to a steady and consistent economic expansion. Since our analysis en the morning, ADA has broken the resistance of the ascending channel with the positive GDP from the US. The last time ADA saw these levels el August 24, the 0.3724 level stands out as a strong support en retracements due to possible profit sales. In the rises that will take place with the continuation of the positive atmosphere en the ecosystem, the 0.4074 level can be followed as resistance.
Supports 0.3724 – 0.3651 – 0.3596
Resistances 0.3951 – 0.4074 – 0.4190
AVAX/USDT
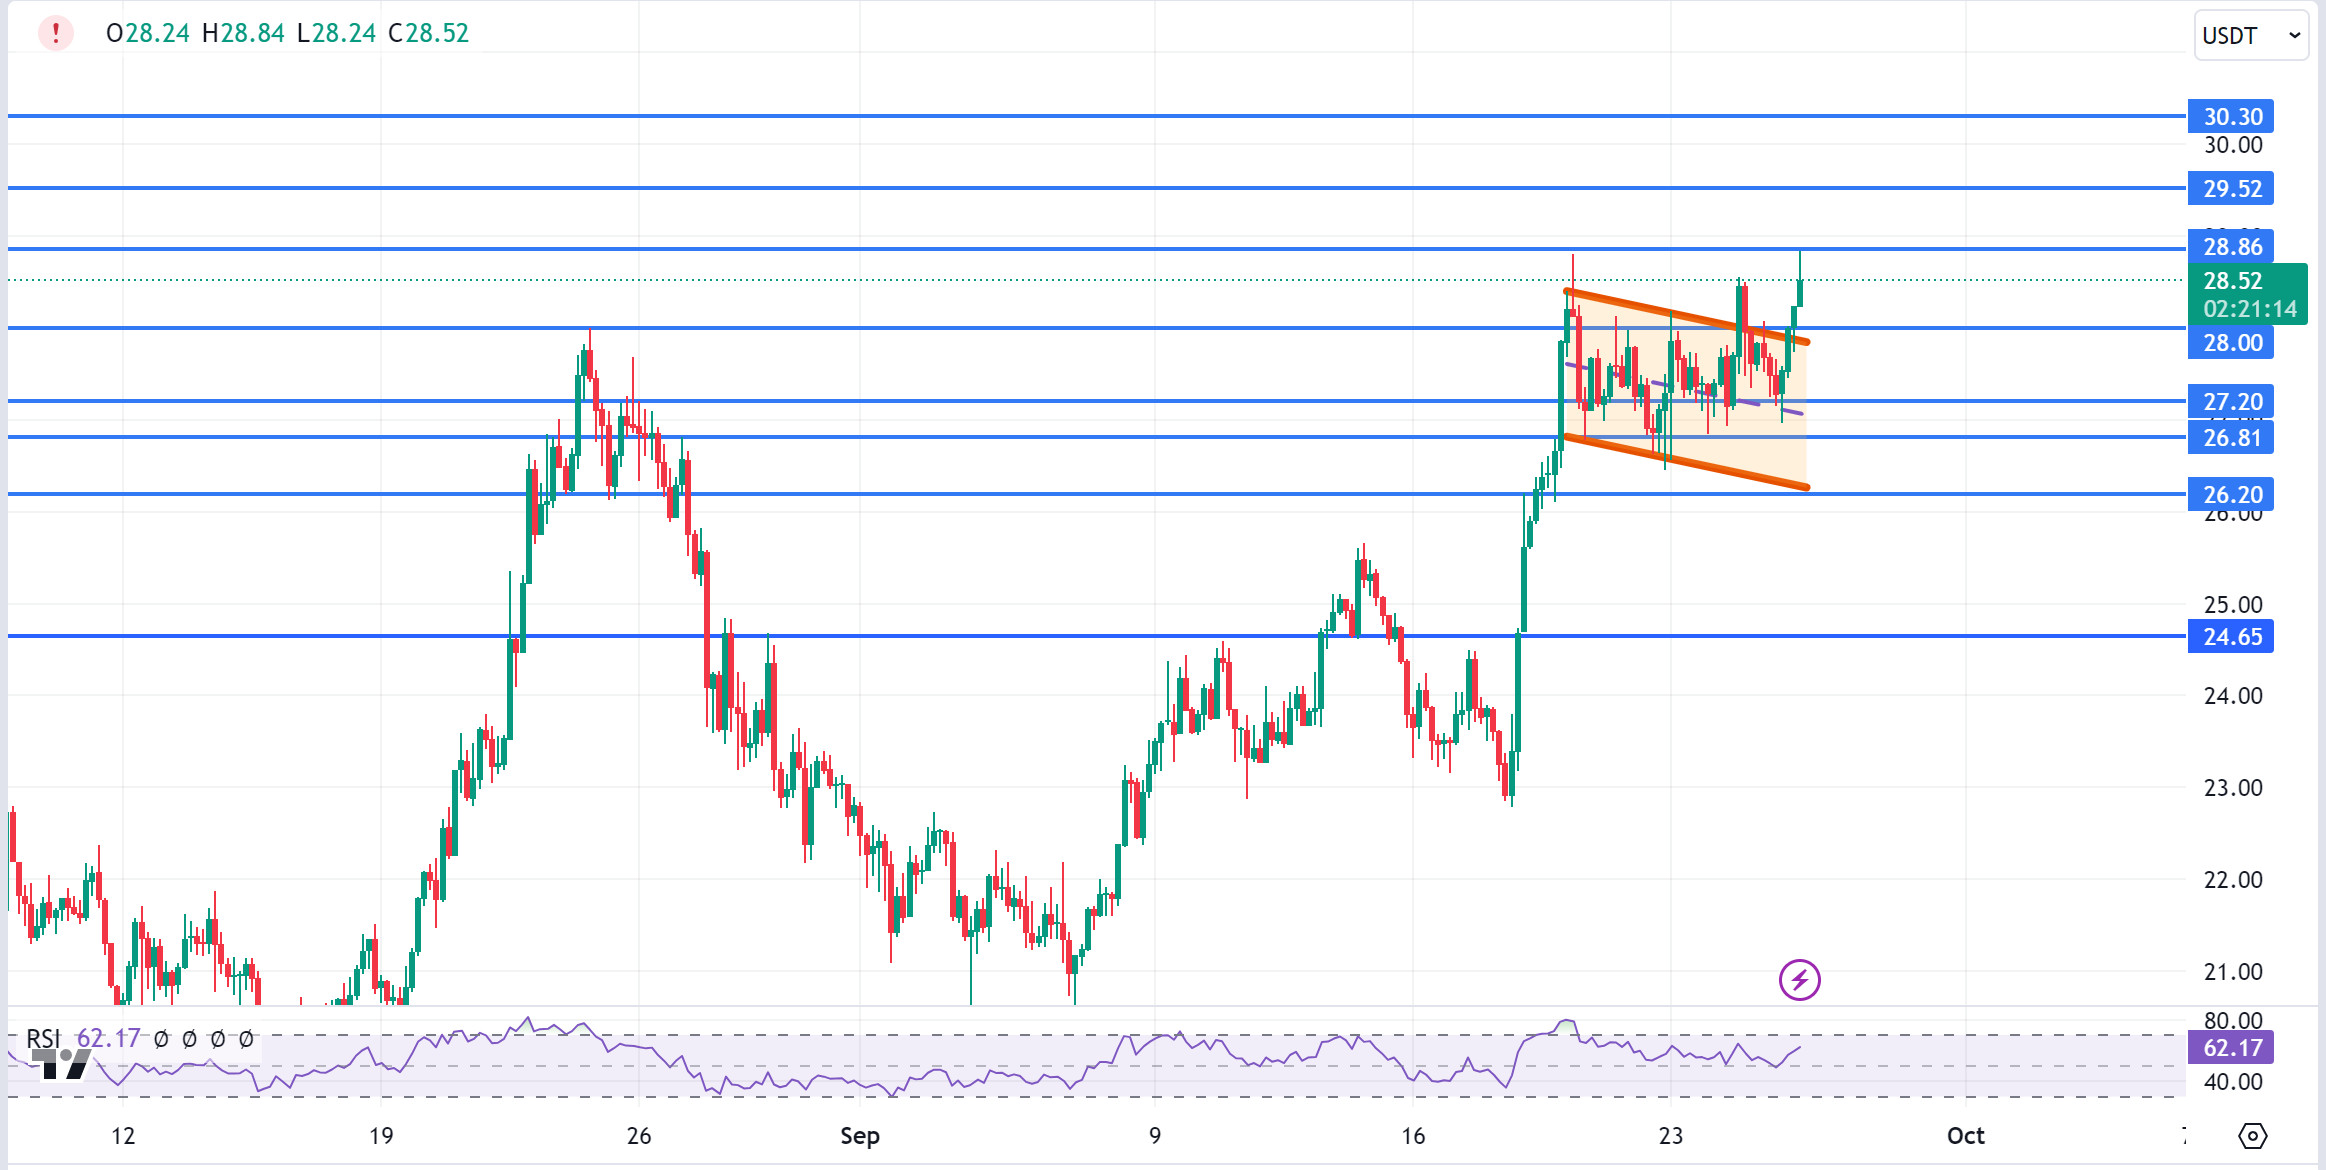
AVAX, which opened today at 27.29, is trading at 28.52, up about 4.5% during the day. Today, US gross domestic product and unemployment claims data were announced and these data, which were en line with expectations, were perceived positively por the market.
On the 4-hora chart, we see a rising flag pattern. It is trying to break the near-horizontal falling channel upwards after the announcement of a $ 40 million grant program for developers working el the Avalanche network. According to the formation target, it may test 29.52 resistance. With a selling pressure that may come from these levels, it may test the 28.00 and 27.20 supports. As long as it stays above 24.65 support during the day, the desire to rise may continue. With the break of 24.65 support, sales may increase.
Supports 28.00 – 27.20 – 26.81
Resistances 28.86 – 29.52 – 30.30
TRX/USDT
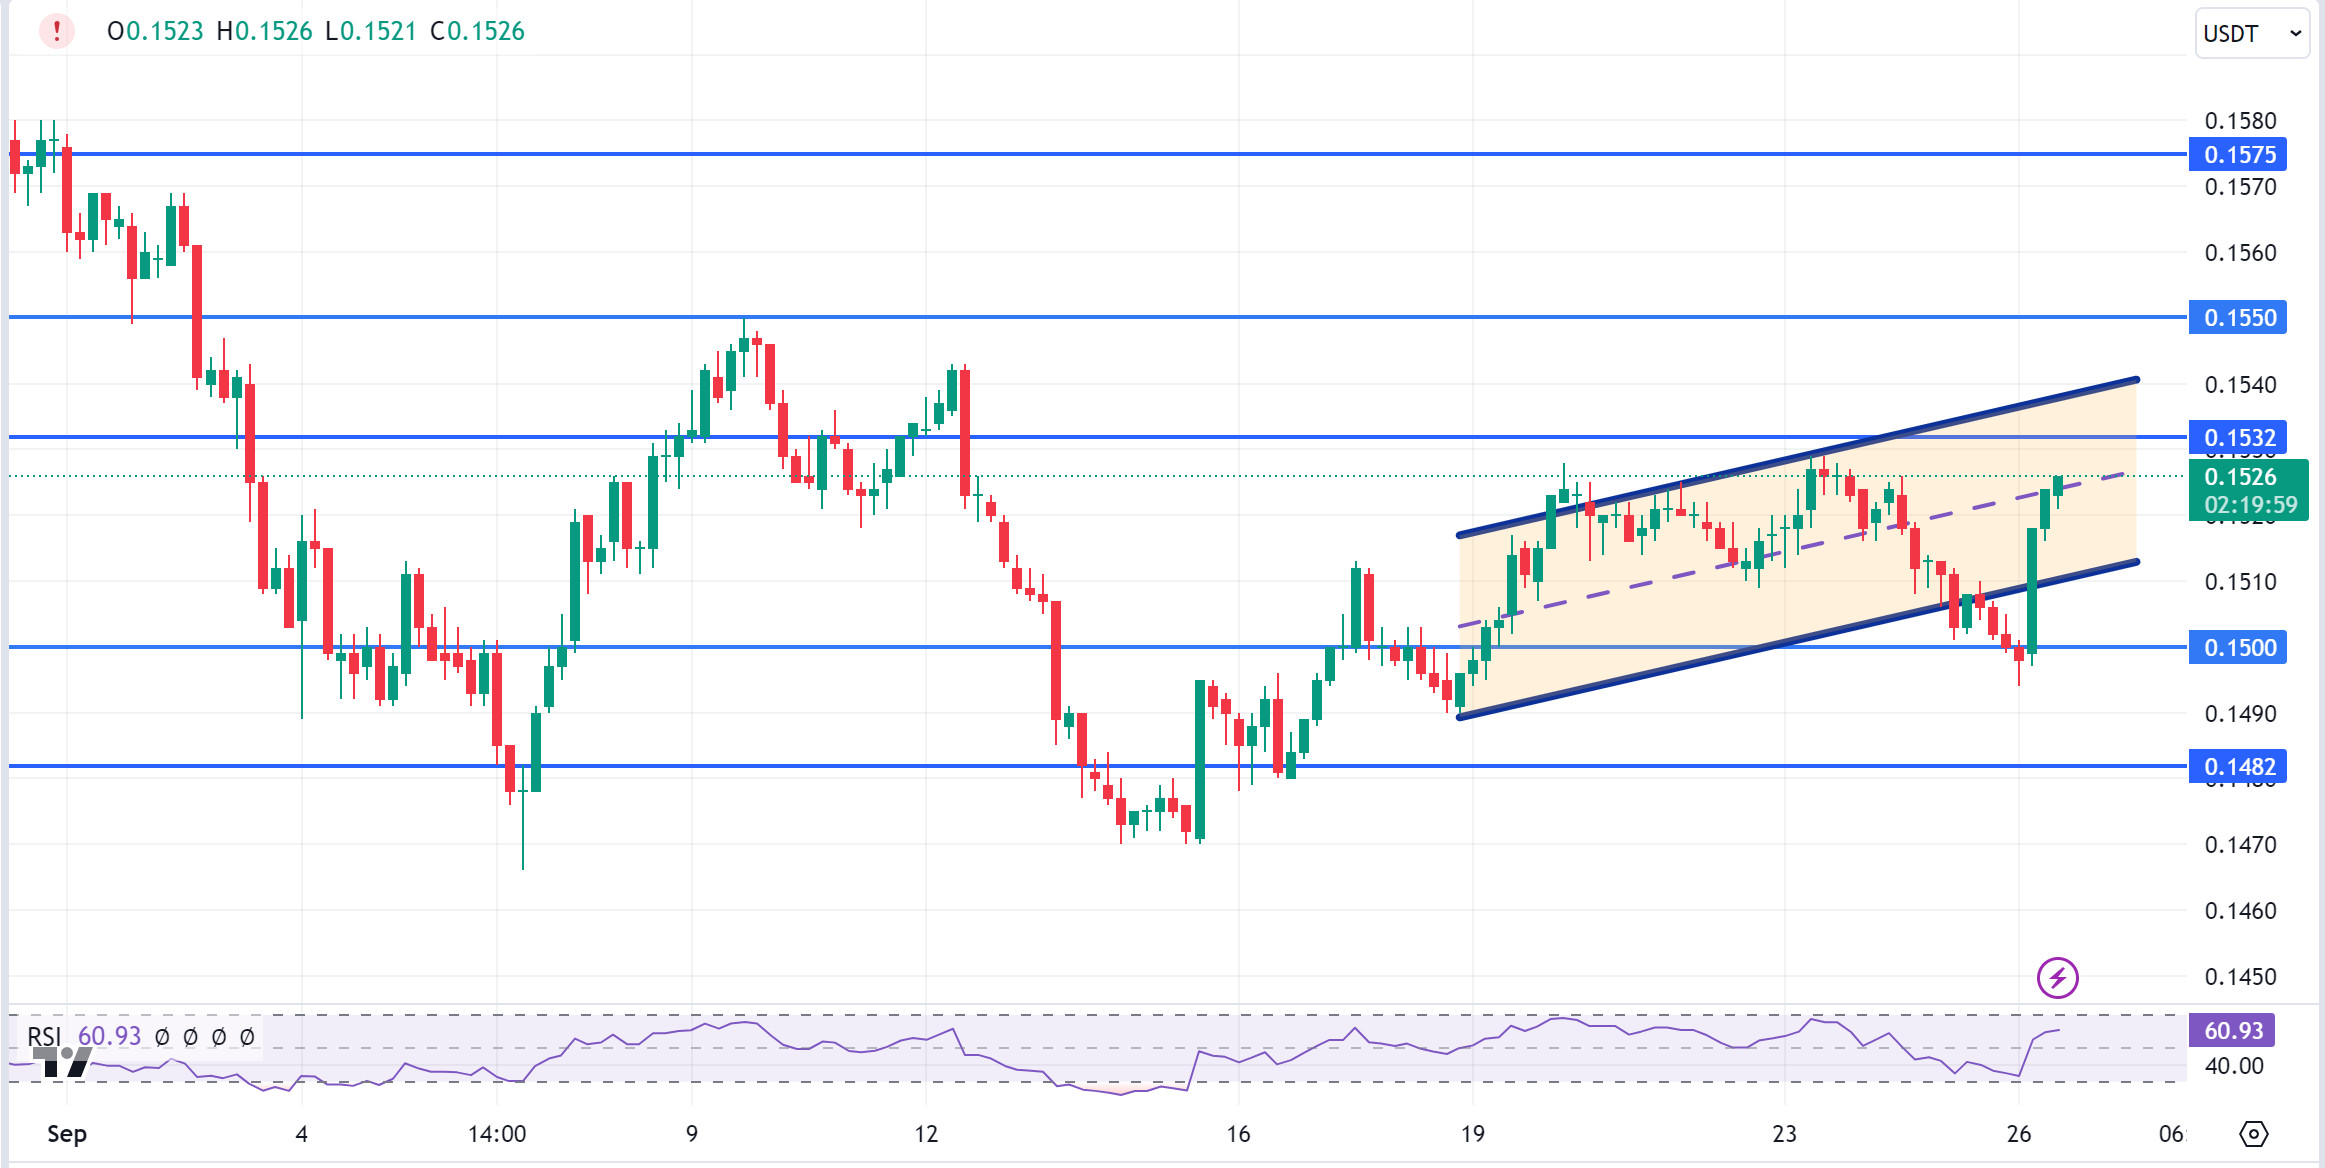
TRX, which started today at 0.1500, continues to rise after the gross domestic product and unemployment claims data from the US today and is trading at 0.1526.
On the 4-hora chart, it continues its movement within the rising channel. The RSI is trying to break the middle band of the rising channel upwards with a value of 60 and some more upside can be expected from here. In such a case, it may move to the upper band of the channel and test the 0.1532 support. However, with the selling pressure that may come from the middle band of the channel, it may test 0.1500 support again. As long as TRX stays above 0.1482 support, the desire to rise may continue. If this support is broken downwards, sales can be expected to increase.
Supports 0.1500 – 0.1482 – 0.1429
Resistances 0.1532 – 0.1575 – 0.1603
XRP/USDT
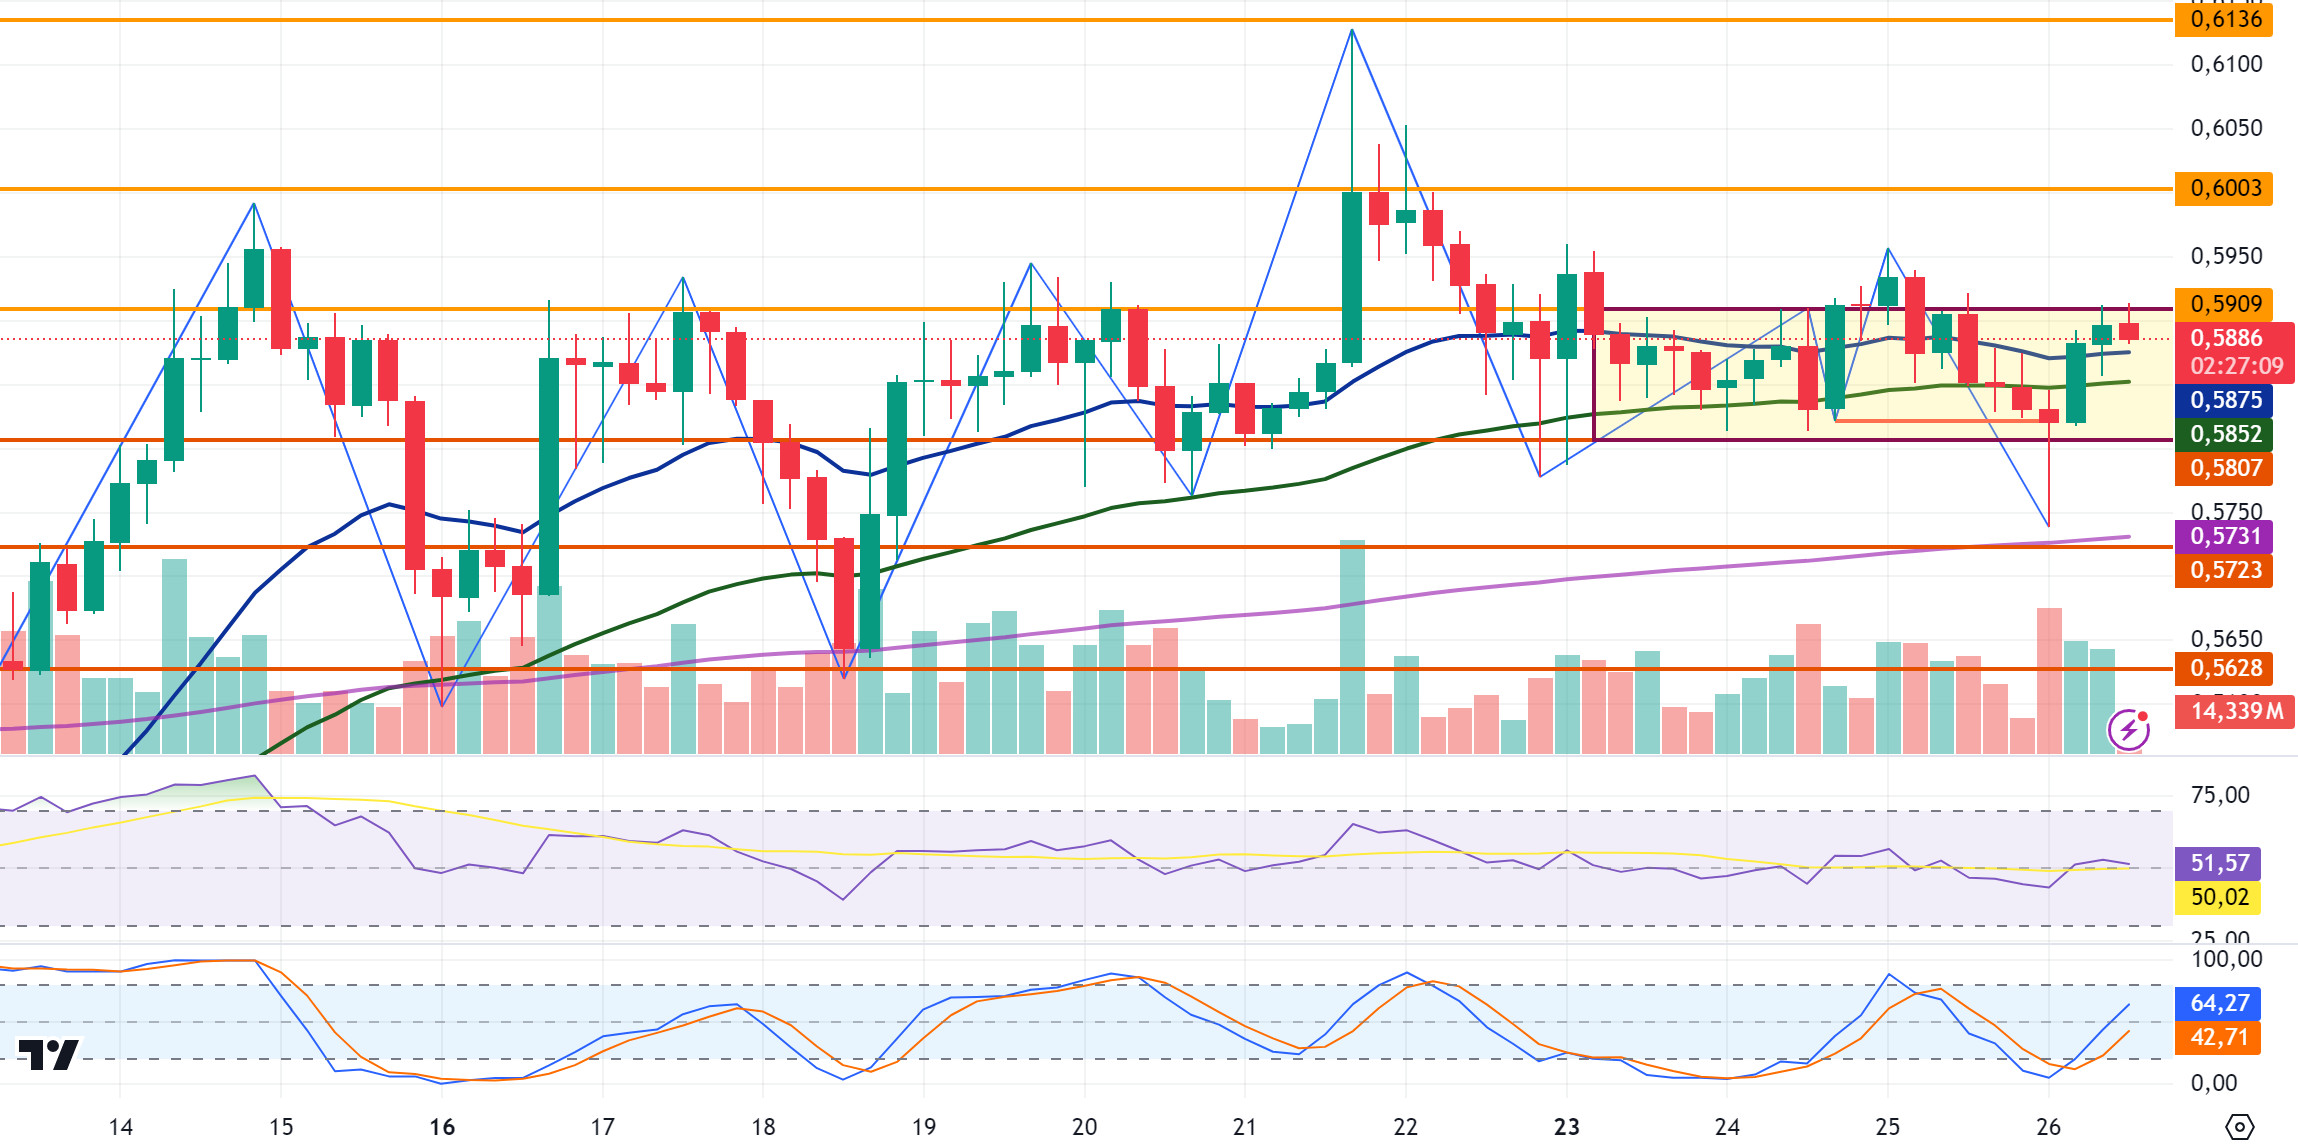
XRP continues to trade at 0.5886 with a 1% increase en value today. In today’s 4-hora analysis, XRP, which rose after the decline it experienced en the opening candle, tested the 0.5909 resistance level and failed to break it and experienced a decline. XRP, which moves within the 0.58 to 0.59 horizontal band, may retest the 0.5909 resistance level again if it rises and if it breaks it, it may test the 0.6003-0.6136 resistance levels en the continuation of the rise. In the event that it falls, if the EMA20 and EMA50 levels break down, it may test the support levels of 0.5807-0.5723-0.5628 en the continuation of the decline.
For XRP, the EMA200 and 0.57 support zone stands out el the decline and may rise with the purchases that may come from these levels el the decline and may offer a long trading opportunity. After the candle closes below the EMA200 and 0.57 support zone, the decline may deepen and offer a short trading opportunity. If it closes above the 0.59 resistance zone, the rise may continue and offer a long trading opportunity.
EMA20 (Blue Line) – EMA50 (Green Line) – EMA200 (Purple Line)
Supports 0. 5807 – 0.5 723 – 0.5628
Resistances 0.5909 – 0.6 003 – 0.6136
DOGE/USDT
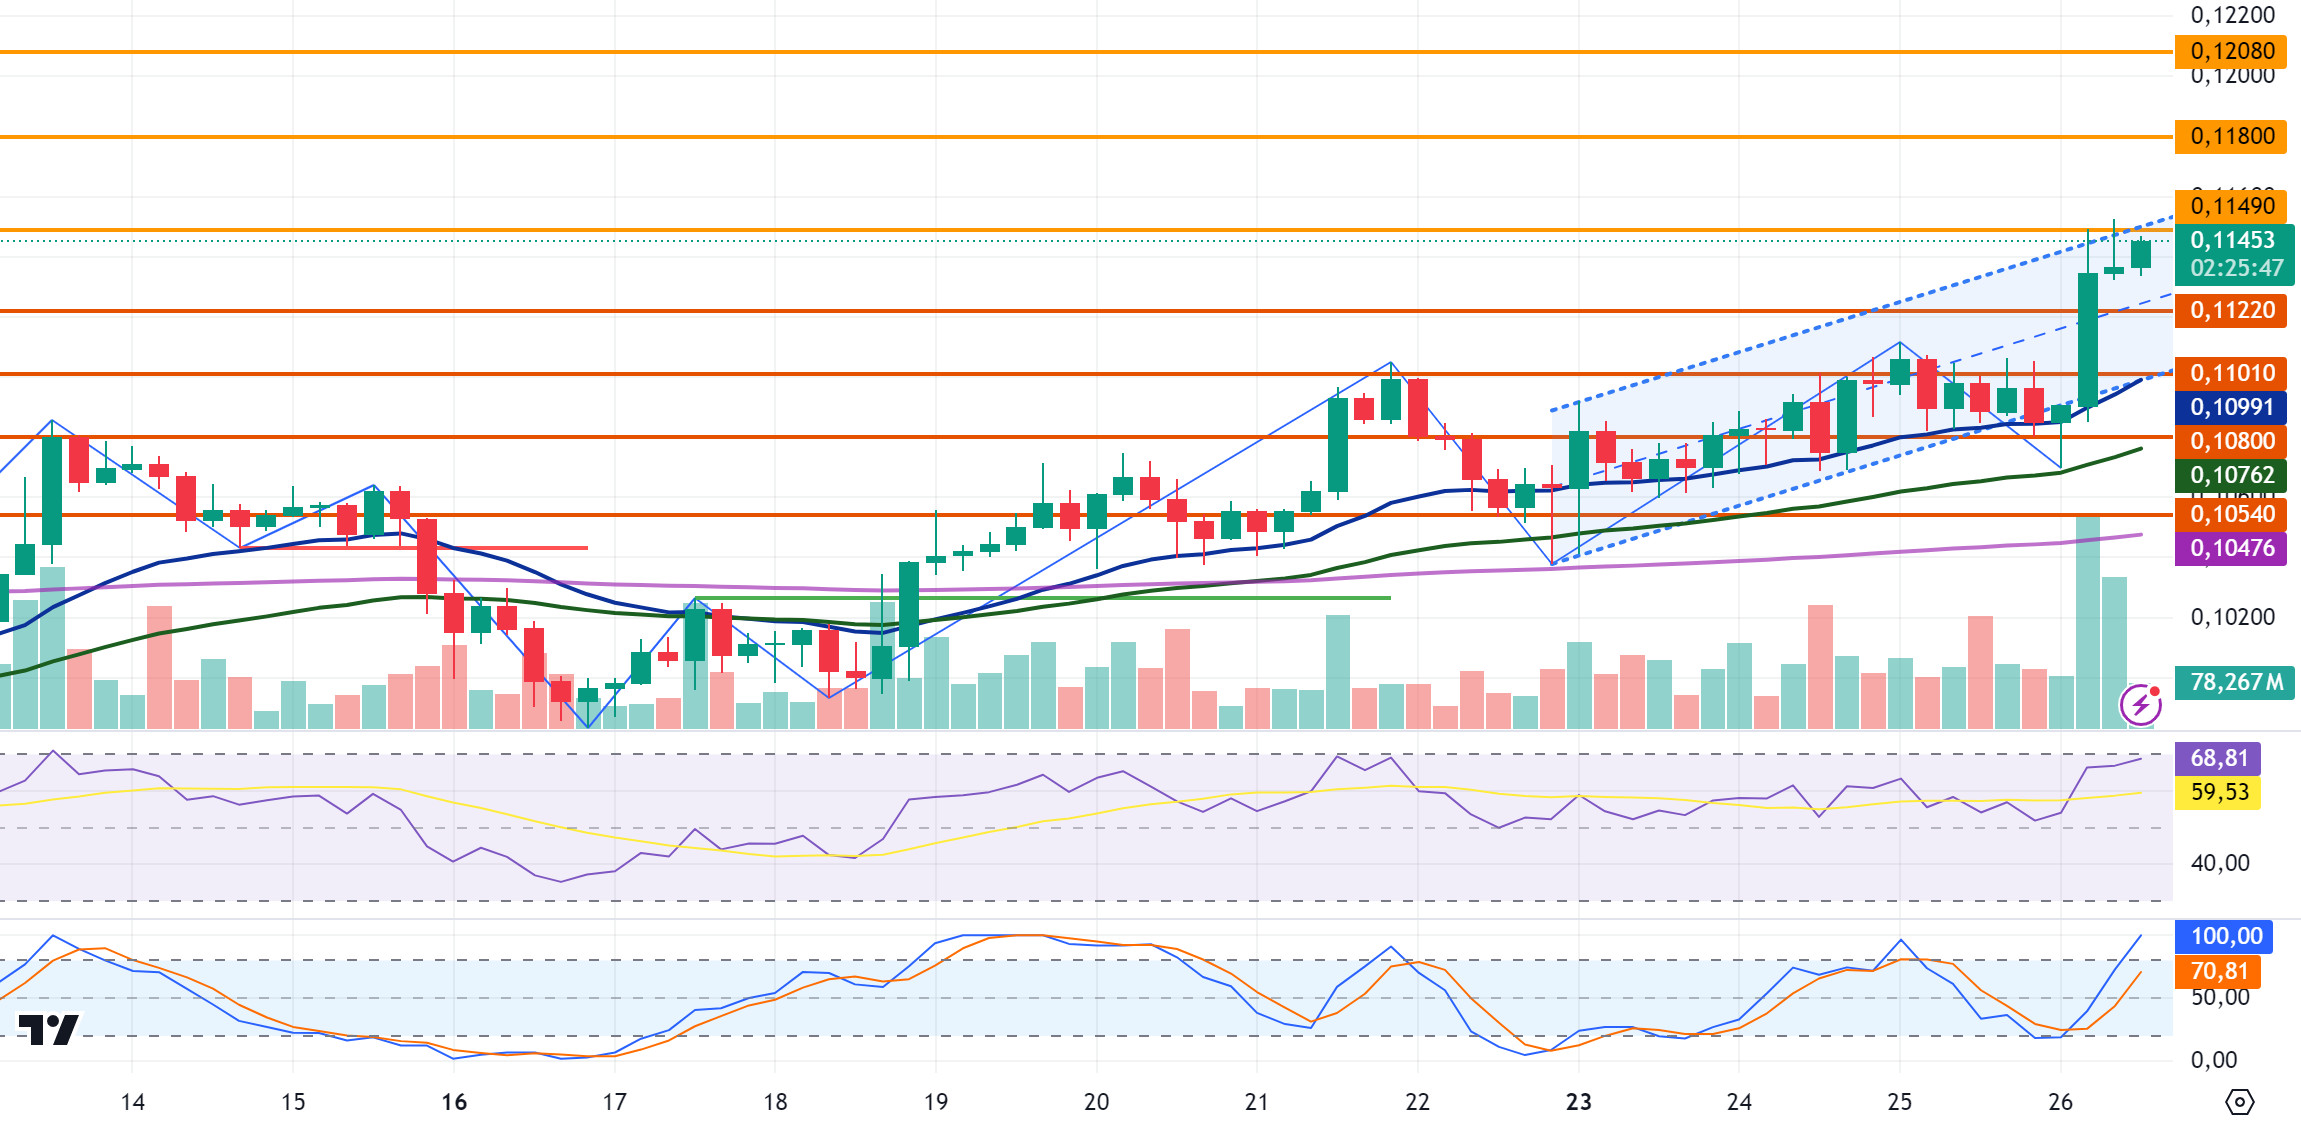
After opening today at 0.1084, DOGE is currently trading at 0.1145 with a 5.4% increase en value. After breaking the 0.1101 and 0.1122 levels with the rise it experienced today, DOGE experienced a decline with sales at 0.1149 and is currently trading between 0.1122 and 0.1149 levels. In the 4-hora analysis, it tested the 0.1149 resistance level 2 times and failed to break it and fell. DOGE, which is traded en the ascending channel, may test the 0.1149 resistance level again with its rise and if it breaks it may test the 0.1180-0.1208 resistance levels en the continuation of the rise. In case of a decline, it may test the support levels of 0.1122-0.1101-0.1080.
If DOGE declines, the 0.1080 support zone comes to the fore and may rise with purchases that may come from these levels and may offer a long trading opportunity. In its rise, it may offer a short trading opportunity with possible sales en the 0.115-0.12 resistance zone.
EMA20 (Blue Line) – EMA50 (Green Line) – EMA200 (Purple Line)
Supports 0.1122 – 0.1101 – 0.1080
Resistances 0.1 149- 0.1180 – 0.1208
LEGAL NOTICE
The investment information, comments and recommendations contained herein do not constitute investment advice. Investment advisory services are provided individually por authorized institutions taking into account the risk and return preferences of individuals. The comments and recommendations contained herein are of a general nature. These recommendations may not be suitable for your financial situation and risk and return preferences. Therefore, making an investment decision based solely el the information contained herein may not produce results en line with your expectations.
