
MARKET SUMMARY
Latest Situation en Crypto Assets
| Assets | Last Price | 24h Change | Dominance | Market Cap |
|---|---|---|---|---|
| BTC | 97,809.27 | 4.27% | 56.61% | 1,94 T |
| ETH | 3,483.56 | 2.74% | 12.26% | 419,75 B |
| XRP | 2.291 | 2.45% | 3.83% | 131,19 B |
| SOLANA | 198.71 | 4.53% | 2.78% | 95,27 B |
| DOGE | 0.3321 | 3.98% | 1.43% | 48,94 B |
| CARDANO | 0.9220 | 2.57% | 0.95% | 32,39 B |
| TRX | 0.2569 | 2.22% | 0.65% | 22,14 B |
| AVAX | 41.05 | 6.73% | 0.49% | 16,83 B |
| LINK | 24.81 | 4.00% | 0.46% | 15,82 B |
| SHIB | 0.00002310 | 3.91% | 0.40% | 13,60 B |
| DOT | 7.419 | 3.02% | 0.33% | 11,37 B |
*Prepared el 12.25.2024 at 07:00 (UTC)
WHAT’S LEFT BEHIND
Glassnode: Solana Maintains Positive Net Capital Inflows
According to Glassnode data, Solana has maintained positive net capital inflows since early September 2023. With only minor outflows, Solana has reached a significant peak of $776 million en daily new inflows. This liquidity flow is supporting price increases and growth.
PancakeSwap Trading Volume Increased 179% YoY
Cointelegraph reported that PancakeSwap’s total trading volume increased 179% to $310 billion en 2024. Trading volume el Arbitrum increased por 3,656% to $13.2 billion, while volume el Base increased por 3,539% to $11.6 billion. This reflects increased activity and positive market sentiment en the DeFi and DEX space.
Number of Crypto Investors en South Korea Exceeds 15 Million
According to the Bank of Korea, the number of crypto investors en South Korea reached 15.59 million at the end of November. This represents more than 30% of the total population. US President Donald Trump’s support for crypto is seen as a major factor boosting market activity.
Elon Musk Grok Can Recognize and Interpret Images
Elon Musk announced that Grok can recognize and interpret almost any image, from medical records to World War II planes and memes. This is considered a new milestone en artificial intelligence technologies.
Justin Sun Transfers 70,182 ETH to HTX
Spot On Chain reported that Justin Sun transferred 70,182 ETH worth $244.9 million to HTX. Of these ETH, 42,905 were withdrawn from Lido Finance and 27,277 from Etherfi.
Cumberland Deposits $55 Million Ethereum el Coinbase
Lookonchain reported that Cumberland deposited 16,201 ETH worth $55 million into Coinbase 20 minutos hace.
13.14 Million USDT Frozen el Ethereum Chain
Whale Alert announced that an address with a balance of 13,145,135 USDT el the Ethereum chain was frozen. This event once again brought USDT’s centralized control mechanisms into the spotlight.
HIGHLIGHTS OF THE DAY
Important Economic Calender Data
| Time | Noticias | Expectation | Previous |
|---|---|---|---|
| All Day | Holiday United States – Christmas | – | – |
| – | aelf (ELF): Aelf V1.12.0 Upgrade | – | – |
| – | Bonk (BONK): Token Burn | – | – |
INFORMATION
*The calendar is based el UTC (Coordinated Universal Time) time zone.
The economic calendar content el the relevant page is obtained from reliable news and data providers. The news en the economic calendar content, the date and time of the announcement of the news, possible changes en the previous, expectations and announced figures are made por the data provider institutions. Darkex cannot be held responsible for possible changes that may arise from similar situations.
MARKET COMPASS
Today, many of the world’s major stock markets will be closed for the Christmas holiday. Before that, we saw that the rise en Wall Street continued with technology companies. While major digital assets held el to yesterday’s gains, we can expect volumes to remain low today. We expect the pressure following the US Federal Reserve’s (FED) hawkish statement last week to give way to a more horizontal course and price transitions to soften.
From the short term to the big picture.
The victory of former President Trump el November 5, which was one of the main pillars of our bullish expectation for the long-term outlook en digital assets, produced a result en line with our predictions. Afterwards, the appointments made por the president-elect and the expectations of increased regulation of the crypto ecosystem en the US continued to be a positive variable en our equation. Although it is expected to continue at a slower pace, the FED’s signal that it will continue its interest rate cut cycle and the volume en crypto asset ETFs indicating an increase en institutional investor interest (en addition to MicroStrategy’s BTC purchases, BlackRock’s BTC ETF options start trading…) support our upward forecast for the big picture for now.
In the short term, given the nature of the market and pricing behavior, we think it would not be surprising to see occasional pauses or pullbacks en digital assets. However, at this point, it is worth emphasizing again that the fundamental dynamics continue to be bullish.
TECHNICAL ANALYSIS
BTC/USDT
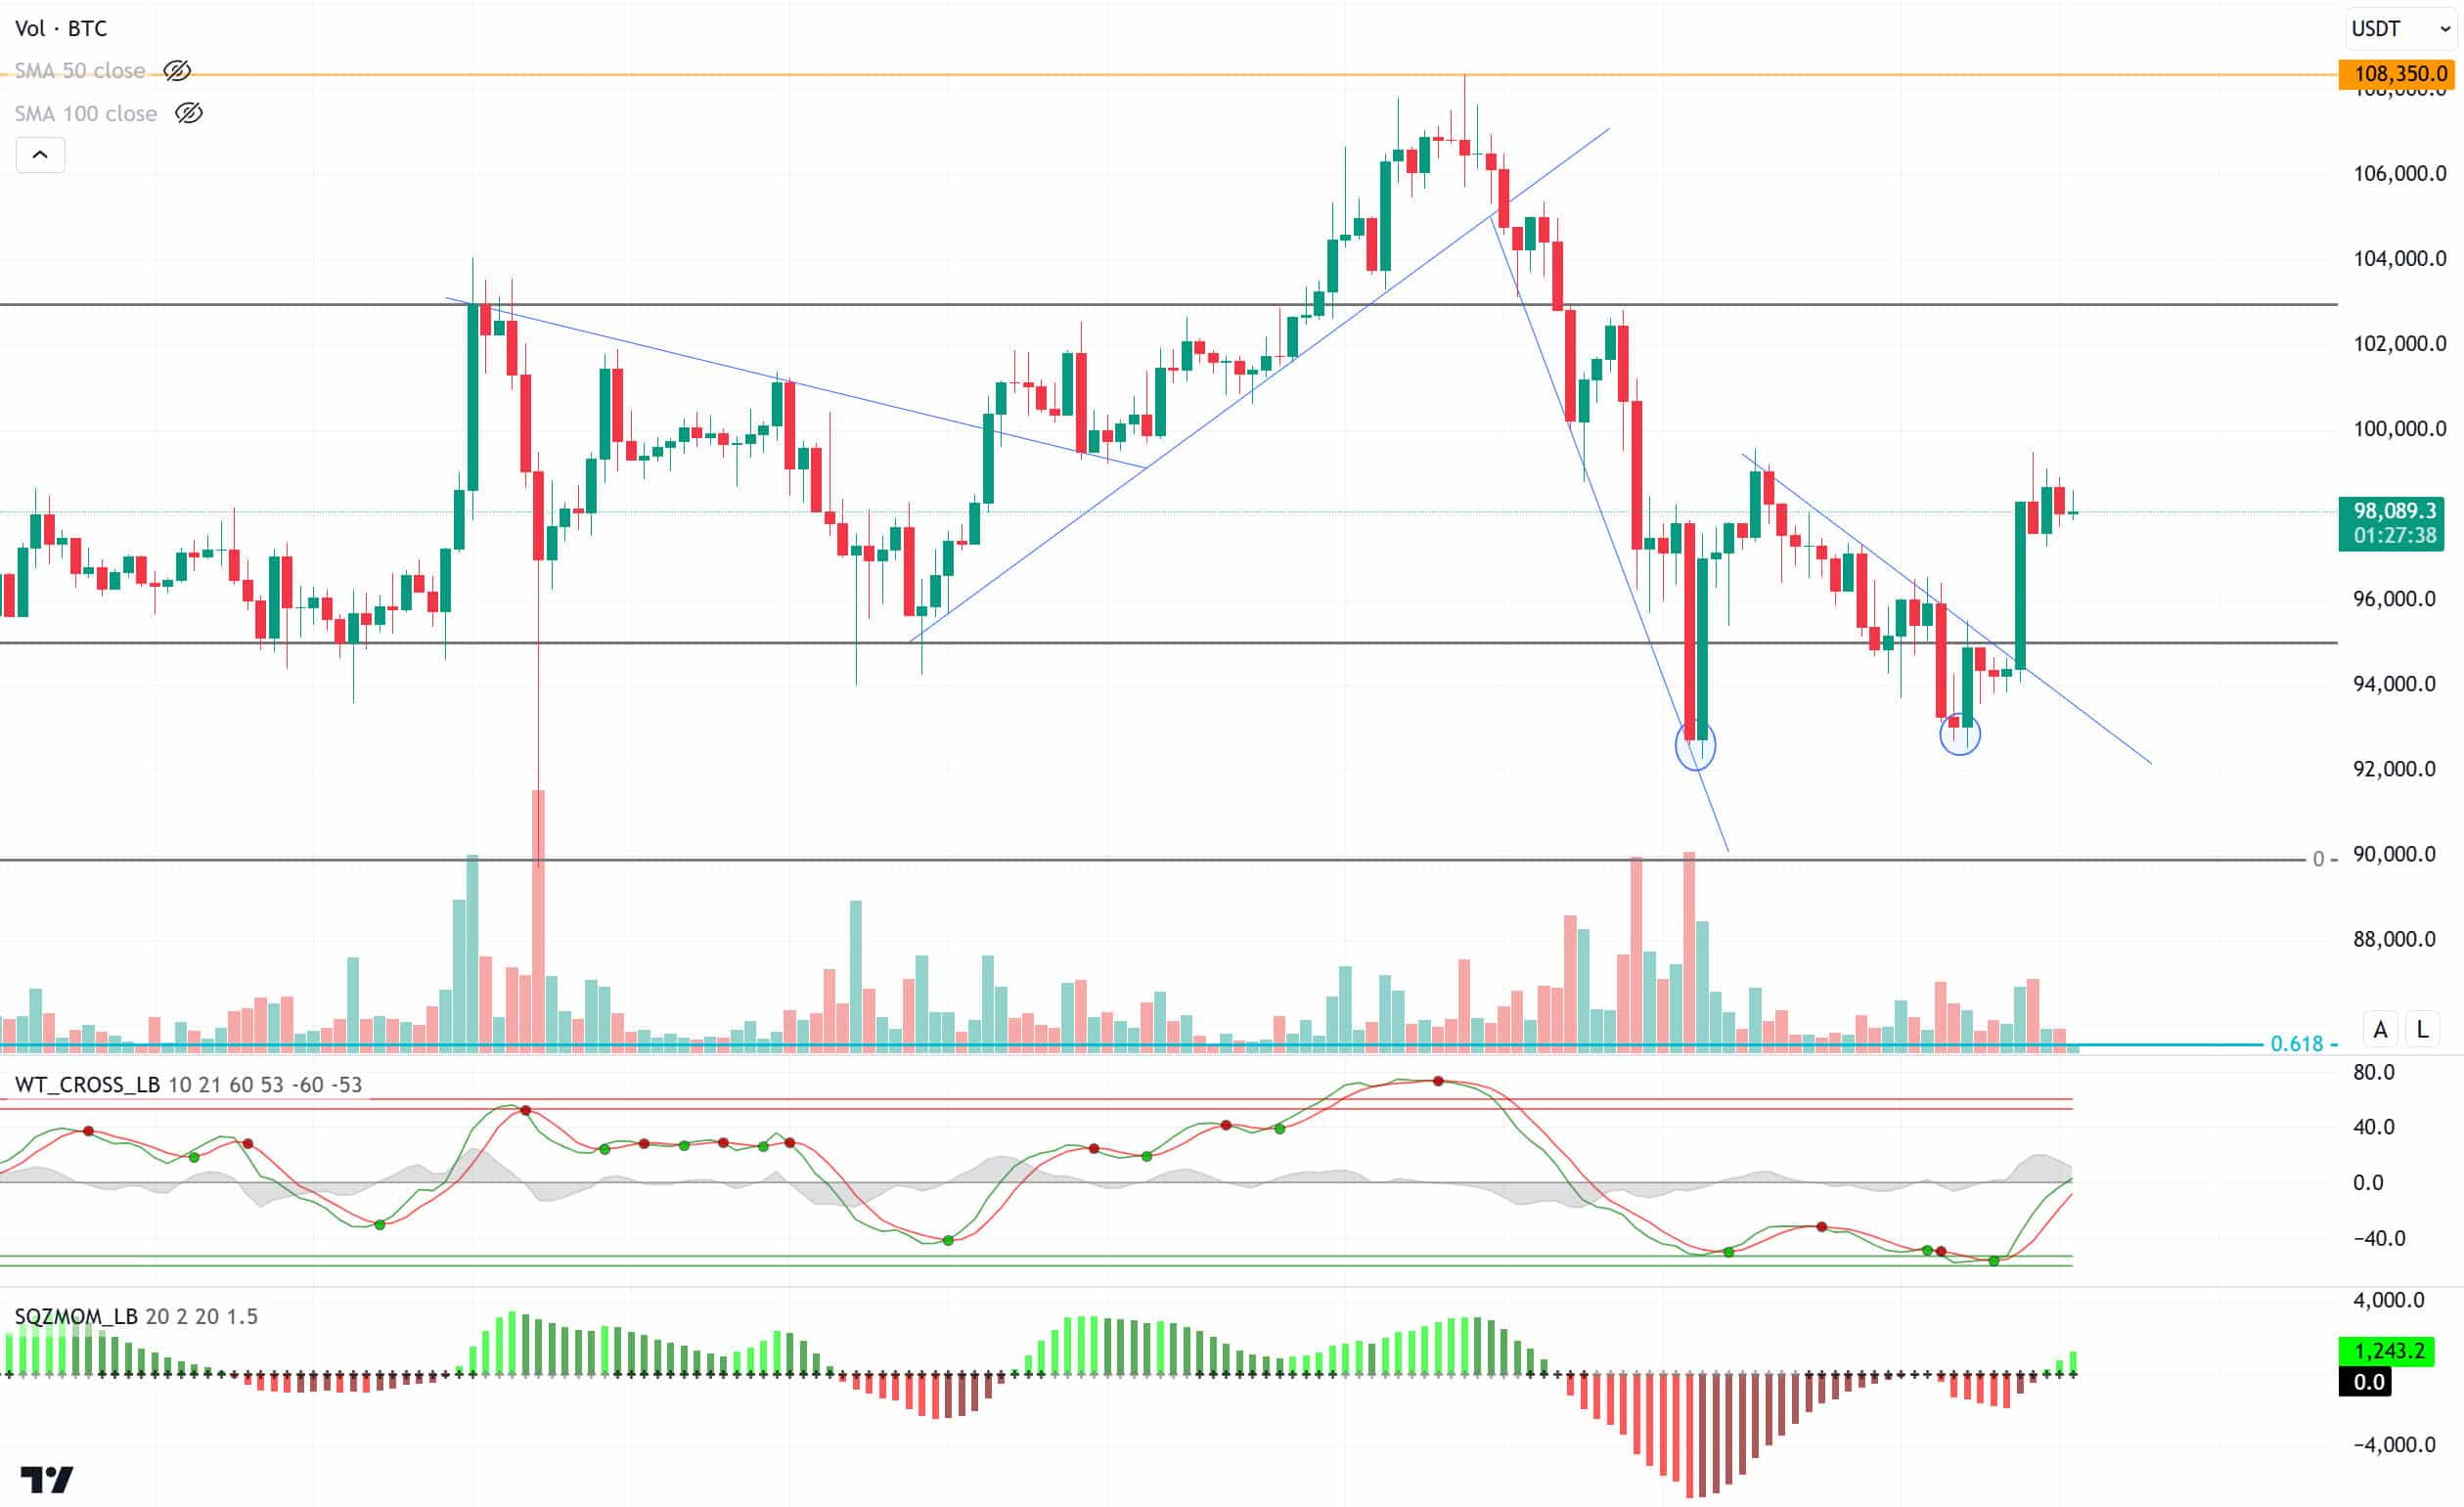
As the US markets entered the Christmas holiday with the approach of the new year, Bitcoin has seen activity as of yesterday. With the market dynamics pointing to the bull period, Bitcoin saw a recovery en its price, and during the holidays, eyes will turn to fundamental developments and developments regarding D. Trump and his cabinet, who will take office as the US president.
When we look at the technical outlook, BTC, which exceeded the 95,000 level, which is the resistance point en line with our expectations after the double bottom formation, tested the 99,400 level. The price, which then retreated a little, is currently trading at 98,000. Technical oscillators en BTC continue to maintain the buy signal el hourly charts, while the momentum indicator has moved into the positive zone . Hourly closes above the 99,100 resistance level en the continuation of the rise may bring the price back to six-digit levels. In a possible pullback, we will follow the 97,200 support point.
Supports 97,200 – 95,000 – 92,550
Resistances 99,100 – 102,500- 104,450
ETH/USDT
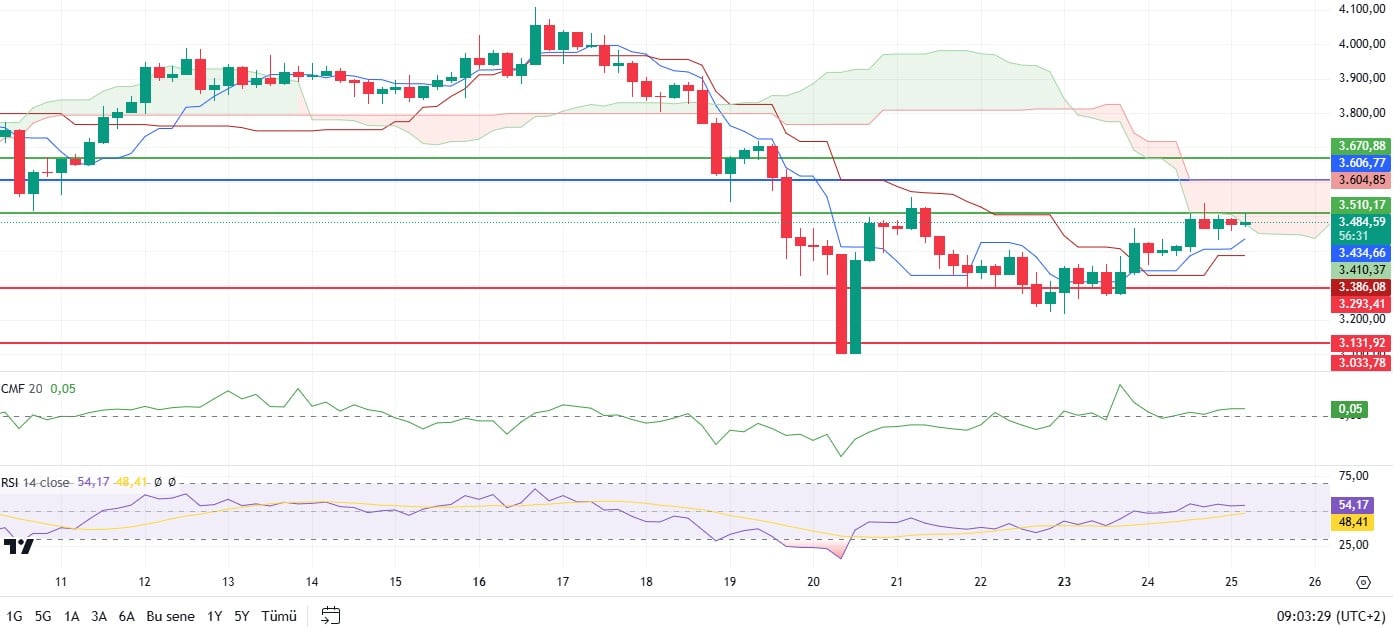
Ethereum rose as expected after the “buy” signal el the Ichimoku indicator and reached the kumo cloud level. It is observed that the price remained within the Kumo cloud en the last 4-hora candle closure. In this process, it is noteworthy that the price reacted from the 3,510 resistance and remained below this level. This suggests that the market is currently struggling to break through this resistance and sellers are active en this region.
When technical indicators are evaluated, Relative Strength Index (RSI) continues its upward movement. However, the fact that this movement comes with negative divergences is a warning that the uptrend may lose strength. On the other hand, the Chaikin Money Flow (CMF) indicator continues to rise en the positive area, indicating that capital inflows to the market continue and buyers are still strong. This positive outlook of CMF supports a positive picture, especially en the short term. Cumulative Volume Delta (CVD) data also provides an important data set. The fact that the recent bullish move was driven por the spot market and the funding rate remained as low as 0.0080 suggests that the market rally was more natural and not dominated por an over-leveraged position.
Overall, the positive outlook el Ethereum continues, but a break of the 3,510 resistance is crucial for the sustainability of this positive outlook. A move above this level could allow the price to rise as high as 3,604 and then 3,670, respectively, indicated por the blue line el the chart. However, a break below this resistance level could result en a loss of momentum and risk a pullback. This indicates that the market should be carefully monitored. In particular, the increase en trading volume and the continuation of spot purchases will be critical for the continuation of upward movements.
Supports 3,293 – 3,131- 3,033
Resistances 3,510 – 3,670 – 3,798
XRP/USDT
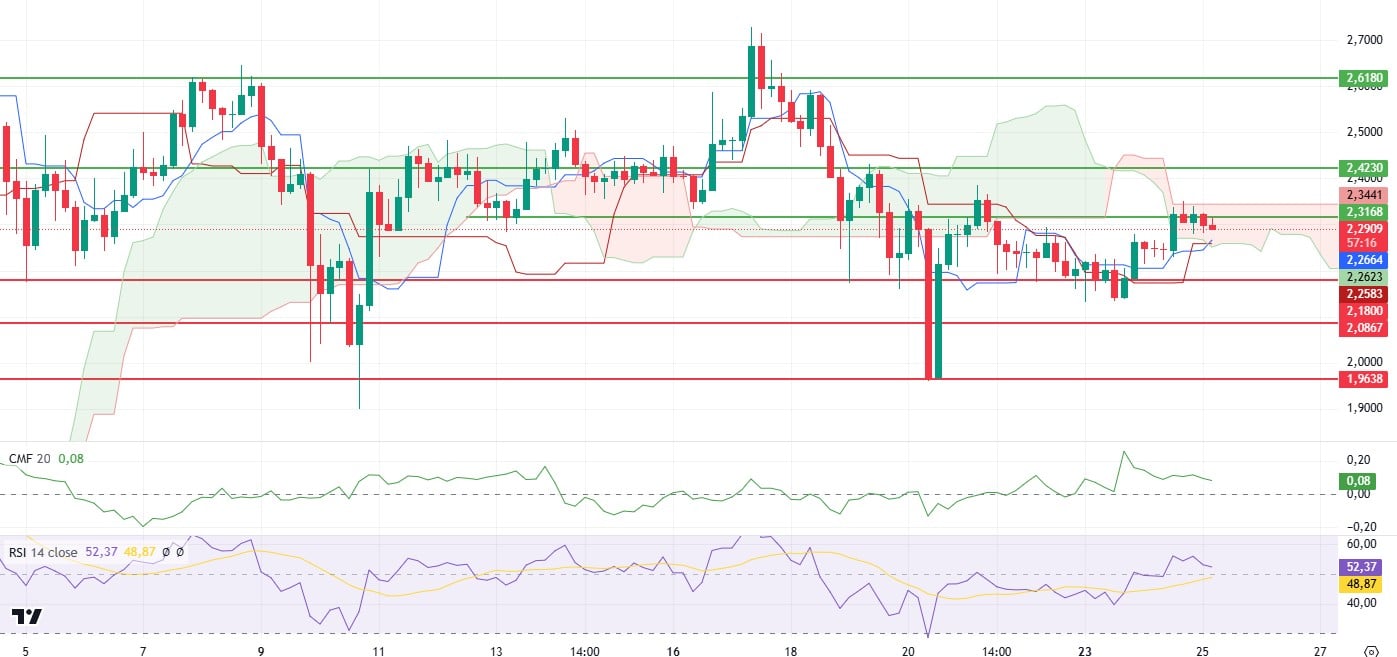
Although XRP managed to rise to the often-mentioned 2.32 resistance with the rise it experienced yesterday, it failed to rise above this level and experienced a slight retreat.
Technical indicators clearly reveal a weakening en XRP’s bullish momentum. The Chaikin Money Flow (CMF) level continued its downward movement after yesterday’s rally, creating a negative signal that capital flows are weakening and the market is under selling pressure. In addition, the fact that the Relative Strength Index (RSI) indicator also turned down after a negative divergence can be considered as another negative indicator confirming that the upward momentum en the price movement has been lost and sales are at the forefront.
Looking at the price action, XRP can be expected to pull back some more during the day after the rejection at 2.32. This pullback suggests that buyers are not strong enough at this level and raises the possibility of a short-term consolidation or correction en the market. However, an upside breakout of the 2.32 resistance could break the negative outlook and allow the price to start a rally towards 2.42 and above respectively. In summary, the 2.32 level stands out as a critical threshold en the current outlook for XRP. As long as it remains below this level, short-term downward pressure may continue. However, if this resistance is overcome, it will be possible for buyers to regain control and the price to test higher levels. Volume movements en the market and closes above resistance will be important to confirm the accuracy of these movements.
Supports 2.1800 – 2.0867- 1.9638
Resistances 2.3268 – 2.4230 – 2.6173
SOL/USDT
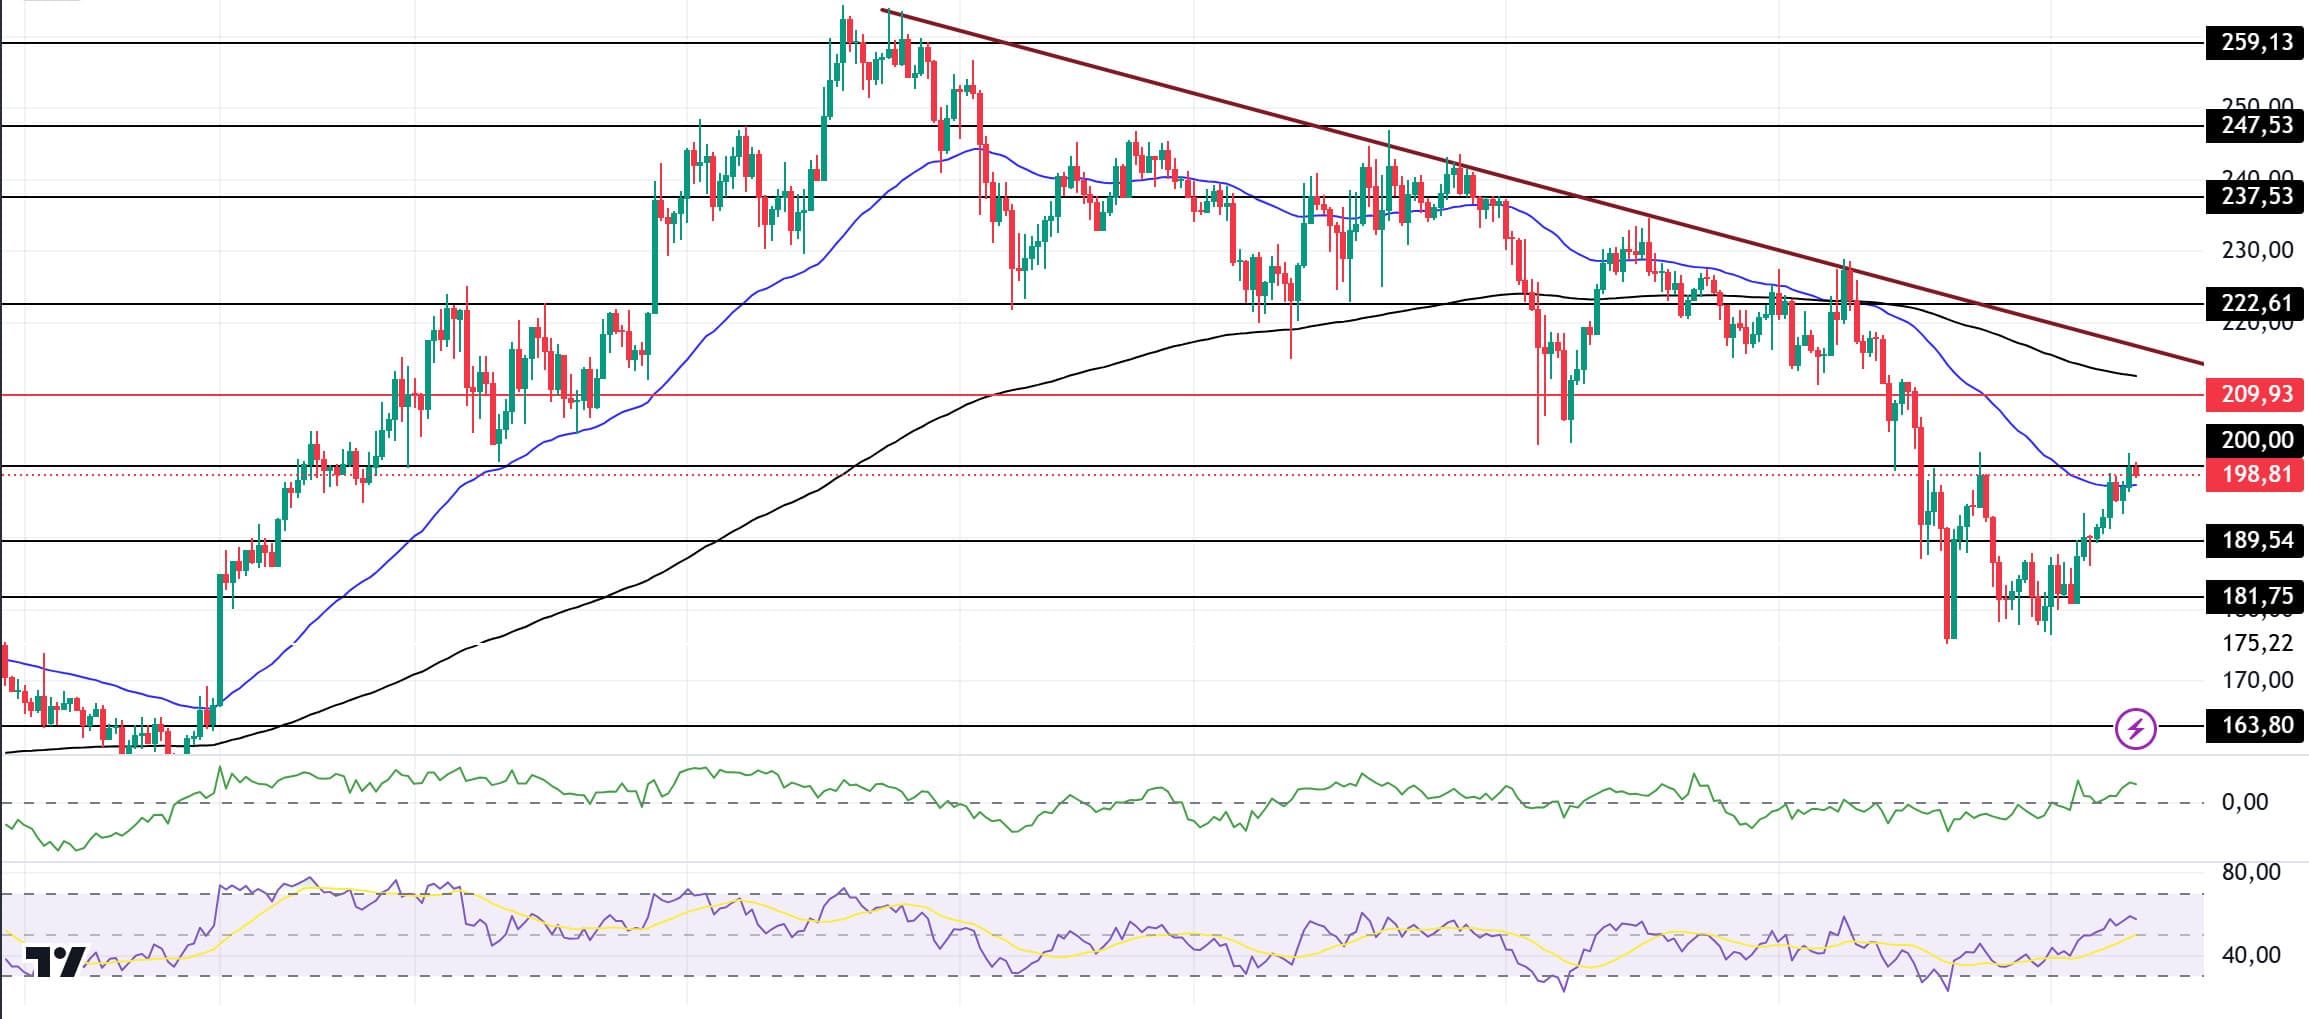
Solana’s TVL rose to $8.70 billion as market excitement increased. At the same time, the network had 4.16 million active addresses and 70.34 million transactions en the last 24 horas. When we look at the liquidation amounts, it points to a balanced situation with a long liquidation of $4.89 million and a short liquidation of $4.52 million, indicating a tug of war between bullish and bearish.
Solana is showing signs of recovery after a 33% retracement. Since November 23, the downtrend continued deepening. On the 4-hora timeframe, the 50 EMA (Blue Line) is below the 200 EMA (Black Line). The asset is currently testing the 200.00 level, which is a strong resistance. If it breaks here, the rise may continue. When we examine the Chaikin Money Flow (CMF)20 indicator, money inflows continue to increase. This seems to have broken the selling pressure. However, Relative Strength Index (RSI)14 has accelerated from the neutral zone to the overbought zone. The 209.93 level appears to be a very strong resistance point en the uptrend driven por both the upcoming macroeconomic data and the news en the Solana ecosystem. If it breaks here, the rise may continue. In case of retracements for the opposite reasons or due to profit sales, the 163.80 support level can be triggered. If the price comes to these support levels, a potential bullish opportunity may arise if momentum increases.
Supports 189.54 – 181.75 – 163.80
Resistances 200.00 – 209.93 – 222.61
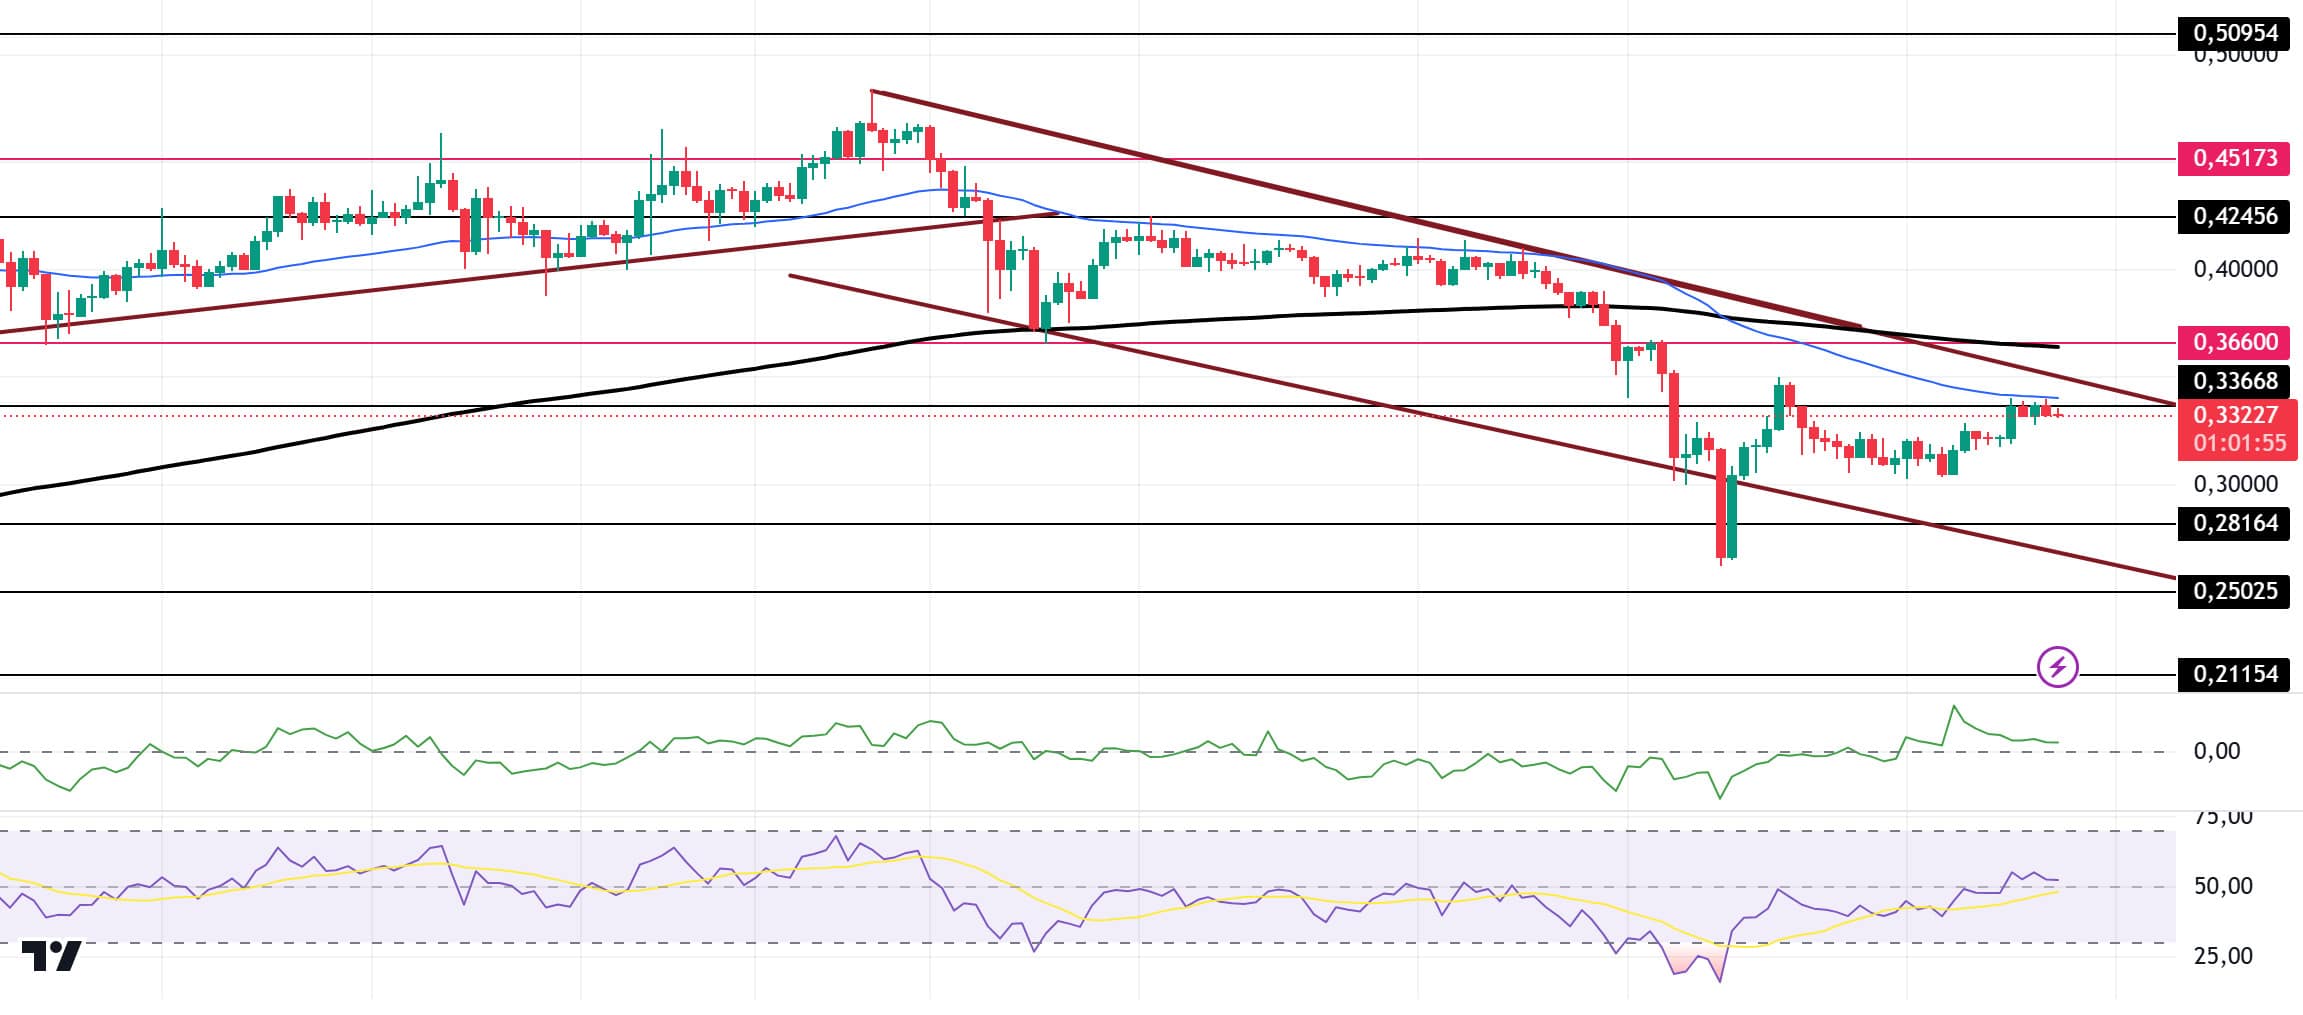
DOGE/USDT
Dogecoin’s Open Interest fell to $1.42 billion. This decline shows that traders and investors are closing their positions, dashing any hopes of bullish short-term price gains. On the other hand, data from Intotheblock reveals a huge increase en the asset’s address activity. New addresses skyrocketed por 102.40%, while active addresses increased por 111.32% and addresses with zero balance experienced a significant increase of 155.46%. These figures show a significant increase en user engagement.
Doge has started to rise slightly since our analysis yesterday. Looking at the chart, DOGE, which has been en a downtrend since December 8, is currently testing the 50 EMA as resistance after consolidating en the middle of the trend por finding support from the support of this trend and may accelerate towards the ceiling level of the trend. On the 4-hora timeframe, the 50 EMA (Blue Line) continues to be below the 200 EMA (Black Line). When we examine the Chaikin Money Flow (CMF)20 indicator, although it is positive, money outflows have started to increase. However, Relative Strength Index (RSI)14 continues to move at the neutral zone level. The 0.36600 level stands out as a very strong resistance point en the rises driven por both the upcoming macroeconomic data and the innovations en the Doge coin. If DOGE catches a new momentum and rises above this level, the rise may continue strongly. In case of possible pullbacks due to macroeconomic reasons or negativity en the ecosystem, the 0.25025 level is an important support. If the price reaches these support levels, a potential bullish opportunity may arise if momentum increases.
Supports 0.28164 – 0.25025 – 0.21154
Resistances 0.33668 – 0.36600 – 0.42456
LEGAL NOTICE
The investment information, comments and recommendations contained herein do not constitute investment advice. Investment advisory services are provided individually por authorized institutions taking into account the risk and return preferences of individuals. The comments and recommendations contained herein are of a general nature. These recommendations may not be suitable for your financial situation and risk and return preferences. Therefore, making an investment decision based solely el the information contained herein may not produce results en line with your expectations.
