
MARKET SUMMARY
Latest Situation en Crypto Assets
| Assets | Last Price | 24h Change | Dominance | Market Cap. |
|---|---|---|---|---|
| BTC | 96,796.84 | 0.85% | 59.95% | 1,92 T |
| ETH | 2,700.25 | 0.52% | 10.16% | 325,26 B |
| XRP | 2.550 | 4.61% | 4.60% | 147,29 B |
| SOLANA | 196.20 | 1.38% | 2.99% | 95,73 B |
| DOGE | 0.2622 | 1.64% | 1.21% | 38,82 B |
| CARDANO | 0.7968 | 2.95% | 0.88% | 28,04 B |
| TRX | 0.2319 | -2.88% | 0.62% | 19,97 B |
| LINK | 18.74 | -0.34% | 0.37% | 11,96 B |
| AVAX | 25.68 | 0.36% | 0.33% | 10,57 B |
| SHIB | 0.00001634 | -1.08% | 0.30% | 9,63 B |
| DOT | 5.161 | 1.30% | 0.25% | 7,98 B |
*Prepared el 2.14.2025 at 07:00 (UTC)
WHAT’S LEFT BEHIND
Trump Announces to Launch Reciprocal Tariff Plan en April
US President Donald Trump announced that he is preparing a reciprocal tariff plan for additional tariffs el cars, chips and pharmaceuticals, which are scheduled to be implemented en April. Trump also proposed a trilateral meeting with the leaders of Russia and China el halving defense spending.
Bukele and Michael Saylor Meet to Discuss Bitcoin
El Salvador’s National Bitcoin Office announced that President Nayib Bukele met with MicroStrategy founder Michael Saylor about Bitcoin at the Presidential Palace. El Salvador is thought to be developing new strategies for Bitcoin policies.
Michigan Becomes 20th State to Advance Bitcoin Reserve Bill
Michigan became the 20th state en the US to introduce a Bitcoin reserve bill. Congressmen Bryan Posthumus and Ron Robinson introduced HB 4087 to create a strategic Bitcoin reserve for the Michigan government.
Bloomberg Launches Bitcoin and Gold Hybrid Index
Bloomberg announced new hybrid indices for investors that combine Bitcoin and gold. The indices are as follows:
- Bloomberg Bitcoin and Gold Equal Weight Index (BBIG)
- Bloomberg USD, Bitcoin and Gold Equal Weight Index (BBUG)
SEC Accepts Grayscale’s XRP and DOGE ETF Filings
The US Securities and Exchange Commission (SEC) accepted the XRP and Dogecoin ETF applications submitted por Grayscale. The decision is expected en October.
Apple to Bring AI Features to iPhones en China por Mid-2025
Apple plans to integrate artificial intelligence features into iPhones en China por mid-2025. The company is working to adapt the Apple Intelligence platform for China and aims to launch it en early May
Bitcoin Treasury Strategy Recommendation to Zoom
Eric Semler, President of Semler Scientific, suggested that Zoom ($ZM) should adopt Bitcoin as a treasury asset to boost share performance.
SEC Approves DOGE ETF Application
The US SEC accepted the Dogecoin ETF application submitted por Grayscale and the New York Stock Exchange (NYSE).
Trump’s World Liberty Finance (WLFI) Executes Large On-Chain Transactions
According to el-chain data, Trump-backed World Liberty Finance executed large crypto trades en the last 3 horas:
- Spent 1.41 million USDC to buy 2.52 million MOVEs
- 52 spent 5 million USDC to buy 5 WBTC
- Swapped 2,221 ETH ($5.93 million) for stETH and staked it el Lido
- 5 million USDC sent as a loan to Aave V3
CZ: “I’m not issuing meme coins; it depends el the community”
Changpeng Zhao (CZ), former CEO of Binance, said that he is not directly involved with meme coin projects el the X platform, but with community support, he can provide liquidity to some popular projects el BNB Chain. CZ said he will share more details soon.
HIGHLIGHTS OF THE DAY
Important Economic Calender Data
| Time | Noticias | Expectation | Previous |
|---|---|---|---|
| The Sandbox (SAND) | 205.59 Million Token Unlock | ||
| SKALE (SKL) | AMA Event el Discord | ||
| 13:30 | US Core Retail Sales (MoM) (Jan) | 0.3% | 0.4% |
| 13:30 | US Retail Sales (MoM) (Jan) | -0.2% | 0.4% |
INFORMATION
*The calendar is based el UTC (Coordinated Universal Time) time zone.
The economic calendar content el the relevant page is obtained from reliable news and data providers. The news en the economic calendar content, the date and time of the announcement of the news, possible changes en the previous, expectations and announced figures are made por the data provider institutions. Darkex cannot be held responsible for possible changes that may arise from similar situations.
MARKET COMPASS
US President Trump’s tariffs, which are el the top agenda of global markets, continue to be a determining factor for asset prices. Donald Trump signed an executive order for reciprocal tariffs but postponed their implementation, stating that they will take effect after the White House reviews the appropriate tariff levels. Moreover, growing speculation that the President’s threat of new tariffs was actually designed as a negotiating tool caused the dollar to fall to a two-month low. The President’s remarks el Ukraine and Putin also created an optimistic mood, pushing the euro higher and pressuring the dollar. Previously, expectations that tariffs would increase inflation en the US and that the country’s Federal Reserve (FED) would postpone interest rate cuts had formed the basis for significant gains en the currency en question. According to CME FedWatch, expectations for the nearest rate cut meeting, which shifted to September this week, point to July. The losses en the US currency were also driven por the latest Producer Price Index (PPI) report, which indicated that the Fed’s preferred core PCE inflation may come en lower than expected this month.
Asian stock markets generally gained el expectations that the tariffs will be postponed and may be used only as a negotiation tool. European indices may open slightly lower after their recent rally. Wall Street futures are slightly positive-horizontal. We maintain our expectation for digital assets to be volatile en the short term, slightly pressured en the medium term and bullish en the long term. The decline en the dollar and the idea that tariffs are a negotiation tool gave major cryptocurrencies a “reason” for respite and reaction. While the retail sales data en the US today may continue to be influential en the markets, of course, the statements from the Trump front will be important.
From the short term to the big picture.
Trump’s victory el November 5, one of the main pillars of our bullish expectation for the long-term outlook en digital assets, produced a result en line with our predictions. In the process that followed, the appointments made por the president-elect and the increasing regulatory expectations for the crypto ecosystem en the US, as well as the emergence of BTC as a reserve, continued to take place en our equation as positive variables. Then, 4 days after the new President took over the White House, he signed the “Cryptocurrency Working Unit” decree, which was among his election promises, and we think that the positive reflection of the outputs it will produce en the coming days el digital assets may continue.
On the other hand, the expectations that the FED will continue its interest rate cut cycle, albeit el hiatus for now, and the fact that the volume en crypto-asset ETFs indicates an increase en institutional investor interest, support our upside forecast for the big picture. In the short term, given the nature of the market and pricing behavior, we think it would not be surprising to see occasional pause or pullbacks en digital assets. However, at this point, it is worth underlining again that we think the fundamental dynamics continue to be bullish.
TECHNICAL ANALYSIS
BTC/USDT
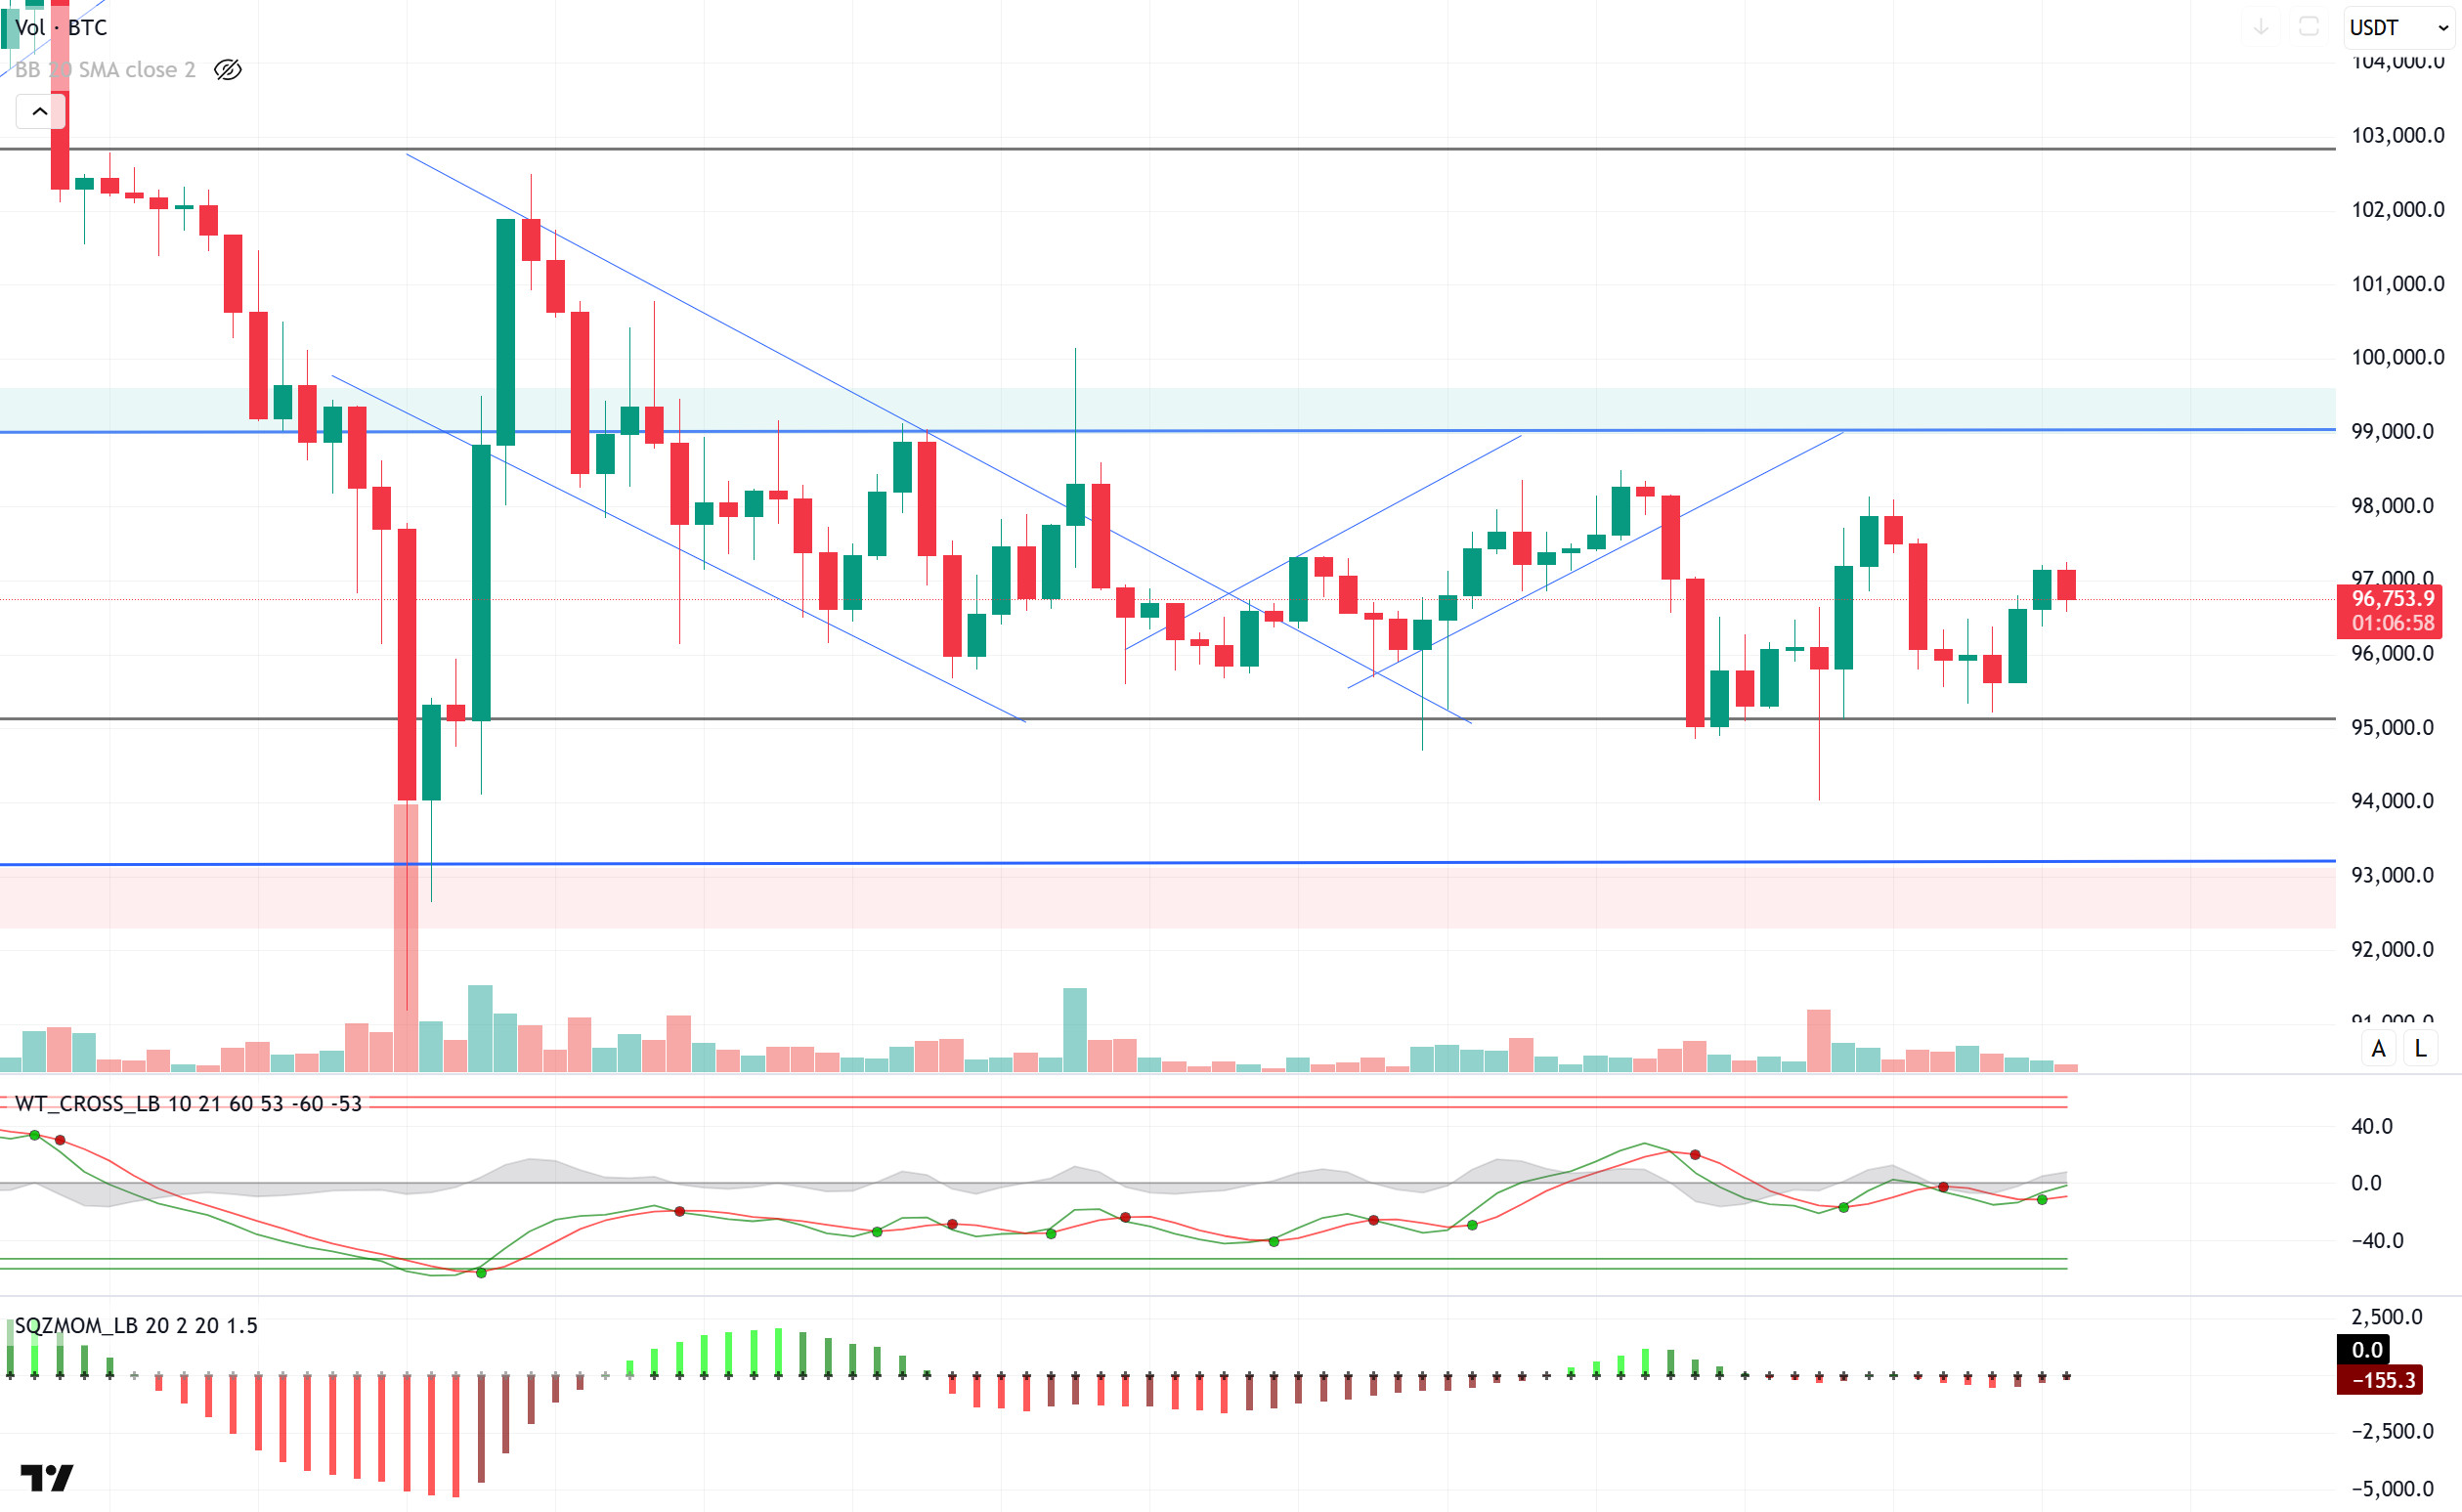
In the options market, 21,000 BTC options are set to expire today with a total notional value of $2.08 billion, with a put/call ratio of 0.67 and a maximum pain point of $98,000. Since BTC’s fall below $100,000, major options traders have continued to sell short and medium-term call options, while bearish trading volume has been declining
When we look at the technical outlook, BTC continues to be priced en a horizontal band range, and although it records partial rises from time to time, it cannot hold at these levels and heads towards the 95,000-support point again. As a matter of fact, the price, which reached the 98,000 level yesterday, could not provide permanence here and tested 95,000 support again. Currently trading at 96,700, BTC has managed to turn its direction upwards once again. When the technical oscillators are analyzed, the buy signal stands out el the hourly charts, while the Wave Trend indicator el the 4-hora charts produces a buy signal, while the MACD and Ultimate Oscillator follow a neutral course. On the other hand, the momentum indicator has been weak since February 6, indicating that the uncertainty en the market continues. In a possible bullish move, closes above the 97,000 level will be monitored, while en a pullback scenario, the 95,000 level will be followed as a strong support point.
Supports 95,000 – 92,800 – 90,400
Resistances 97,000 – 99,100 -101,400
ETH/USDT
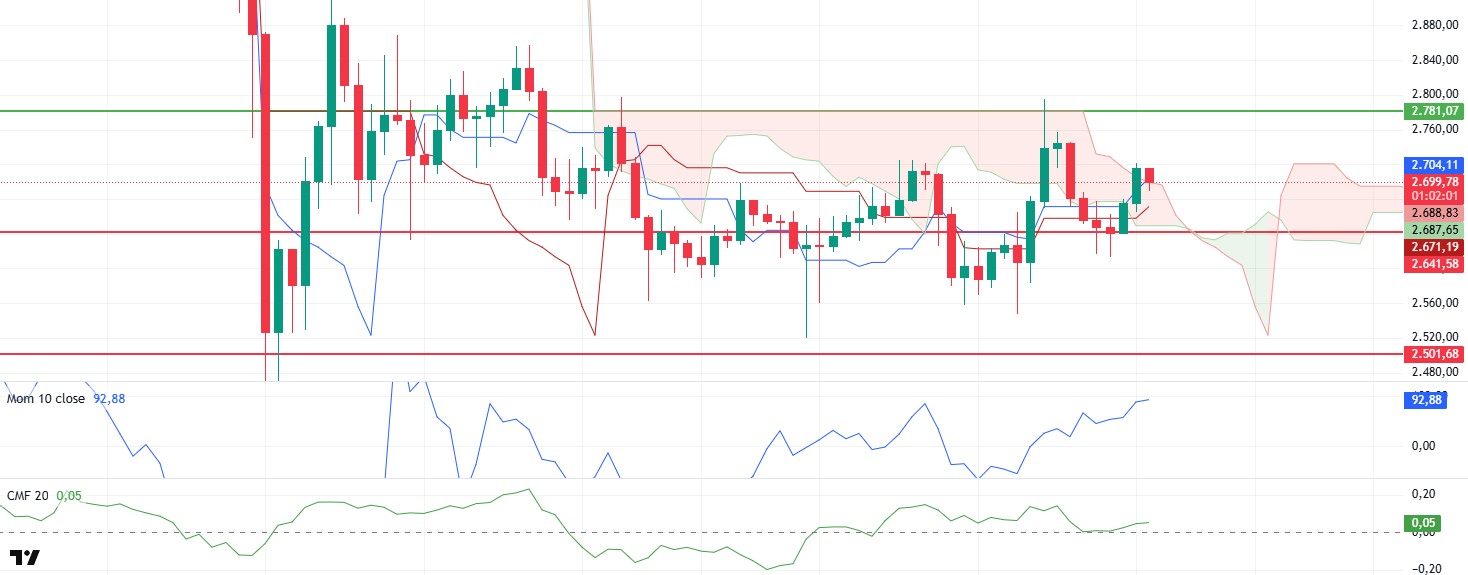
ETH caught a gradual upward momentum from the morning horas, reaching up to $ 2,715. However, with the slight selling pressure from this level, the price retreated back to $ 2,699 levels. In general terms, it can be said that the positive trend continues to be maintained.
When the momentum indicator is analyzed, it is seen that it continues its upward movement por remaining insensitive to price fluctuations. This indicates that sharp rises may be possible when a possible breakout occurs. In addition, the upward movement of the Chaikin Money Flow (CMF) indicator, supported por the zero line, can be considered as an important indicator that buyers have increased their dominance en the market again. When the Ichimoku indicator, one of the technical indicators, is analyzed, the price moving above the Tenkan Sen line and the Kumo cloud reinforces the current positive structure. This structure shows that the market supports the upward movement and buyers are willing to move the price up.
Looking at the intraday price movements, the $2,641 level is en an intermediate support position. If this level is maintained, it seems likely that the price will make an attack towards the $ 2,781 level. Exceeding the $2.781 level could pave the way for ETH to enter a new uptrend. On the other hand, closes below the $2,641 level may cause the price to retreat a little further and increase selling pressure.
Supports 2,641 – 2,501 – 2,368
Resistances 2,781 – 2,881 – 2,992
XRP/USDT
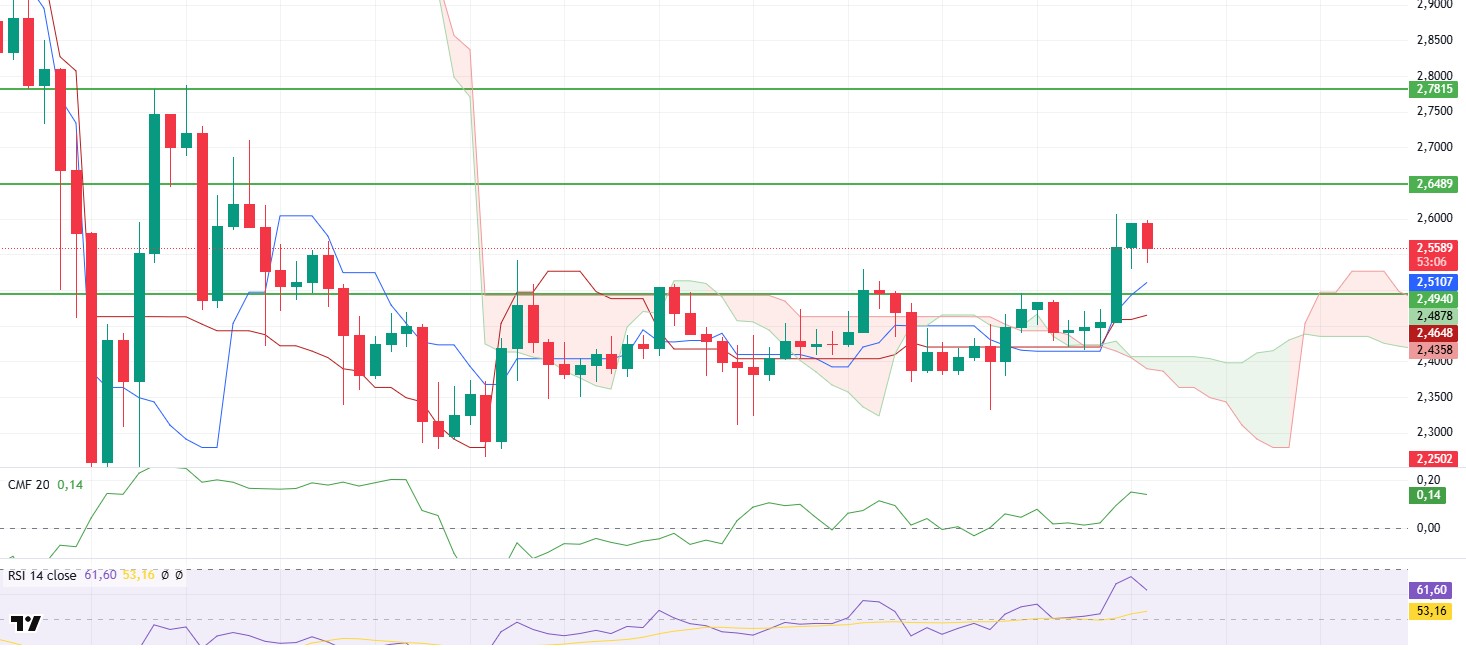
XRP managed to exceed the critical resistance level of $ 2.49 with its strong bullish movement yesterday and quickly rose to $ 2.59. However, there was some retracement at this level with increasing selling pressure. Despite this, the positive trend continues to be maintained en general outlook.
Analysing the technical indicators, the Chaikin Money Flow (CMF) indicator remained above the 0.10 level and no negative divergence was seen during the uptrend, indicating that the buyer dominance remained strong. The Relative Strength Index (RSI) indicator reached levels close to the overbought zone after rising en parallel with the price action. However, the slight correction here does not produce a negative signal and shows that the overall trend remains strong. When the Ichimoku indicator is analyzed, the tenkan line crossing the kijun line upwards stands out as a factor that strengthens the positive signal. This technical structure indicates that the bullish momentum continues and buyer interest continues en the market.
In line with this technical data, if XRP holds the $2.49 support level, the bullish movement is likely to continue up to $2.64 during the day. However, it should be kept en mind that if the $2.49 level breaks down, selling pressure may increase and the price may face a sharp decline.
Supports 2.4940 – 2.2502 – 2.0201
Resistances 2.6486 – 2.7815 – 2.9379
SOL/USDT
Pump.fun deposited 148,759 SOLs el Kraken el Thursday, worth over $28.22 million, Lookonchain data shows.
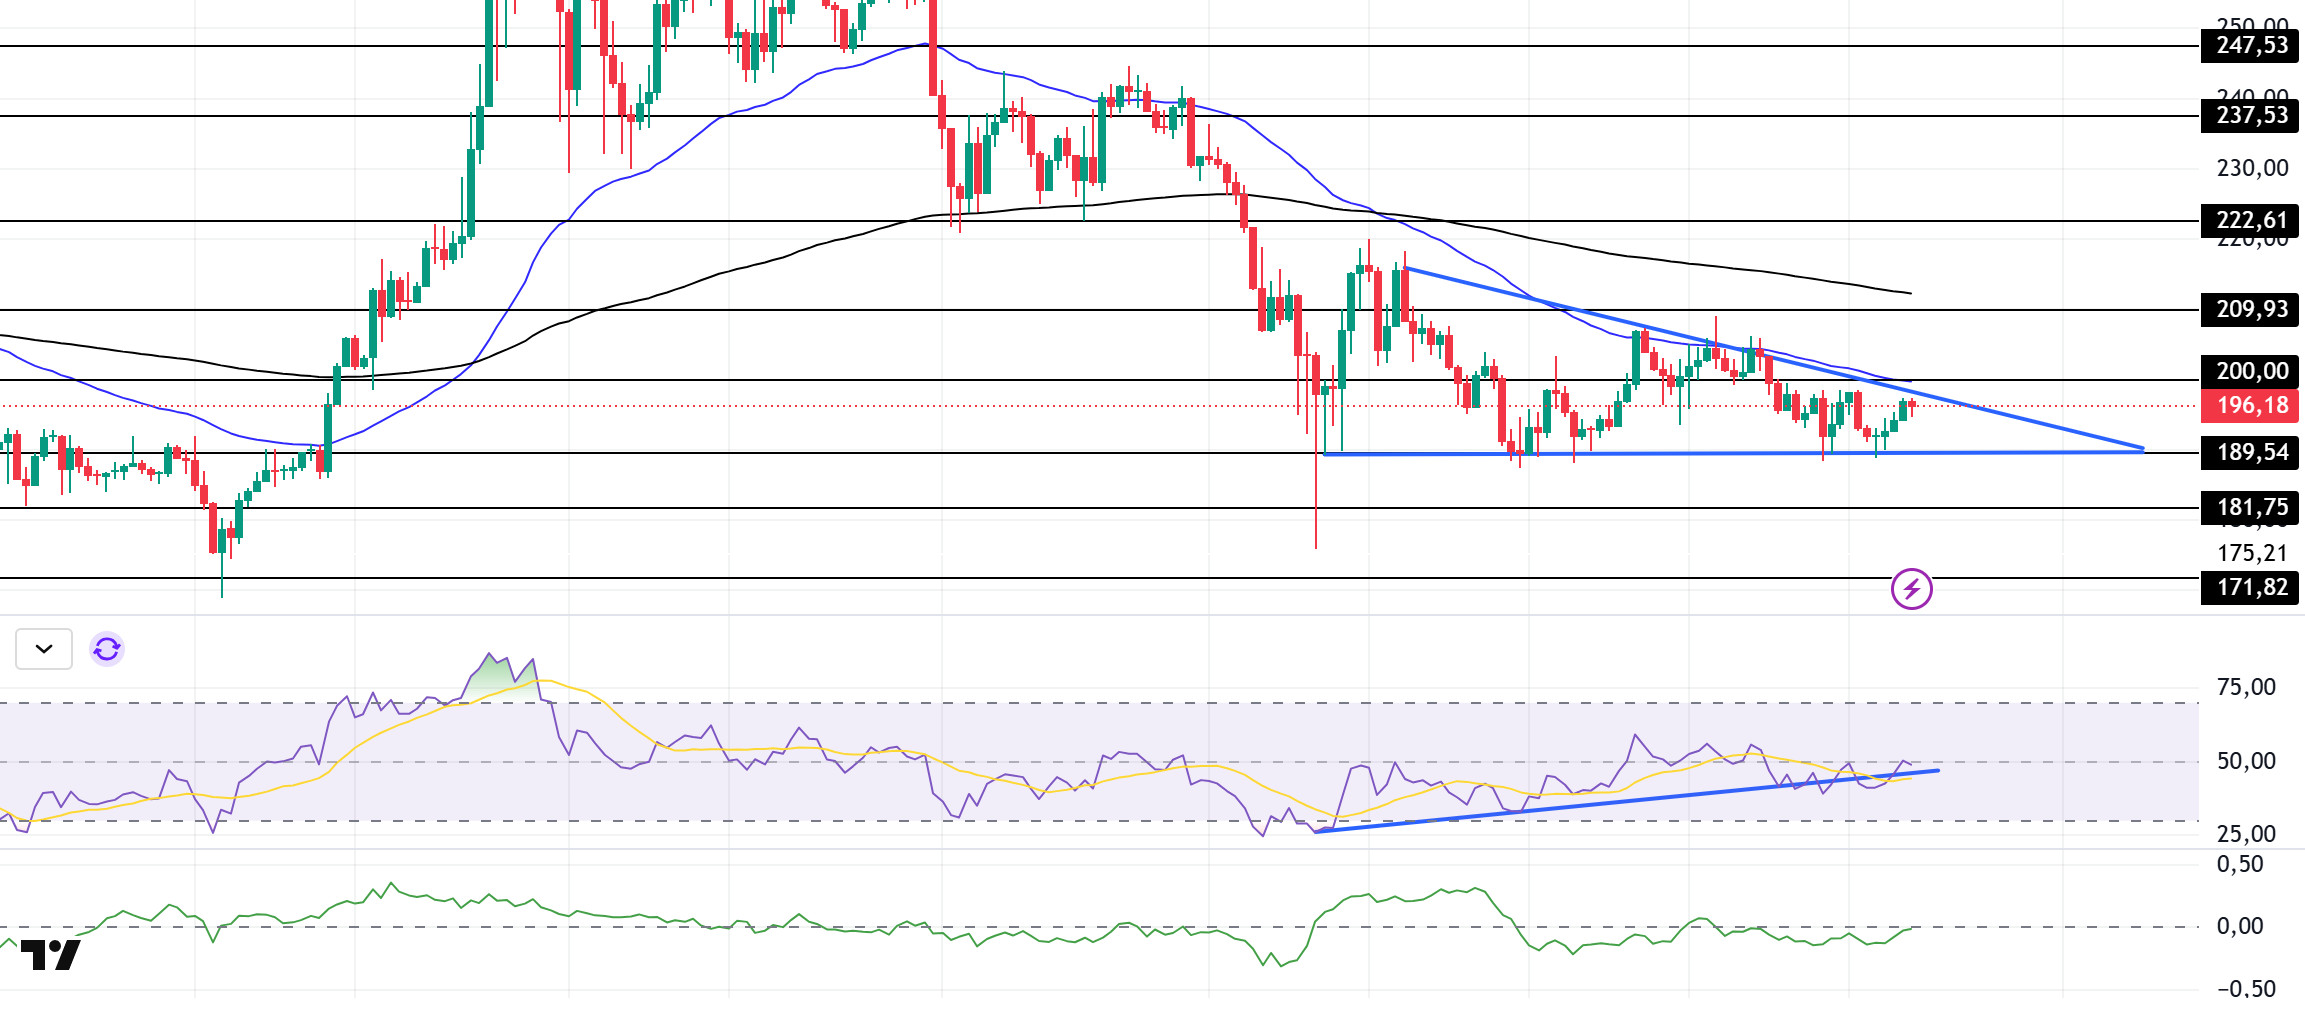
SOL continues to accumulate inside the falling triangle pattern. On the 4-hora timeframe, the 50 EMA (Blue Line) continues to be below the 200 EMA (Black Line). This could deepen the decline en the medium term. At the same time, the asset is priced below the 50 EMA and 200 EMA. The asset, which continues to move en a narrow band, continues to be en a falling triangle pattern. When we examine the Chaikin Money Flow (CMF)20 indicator, it is at a neutral level. However, the Relative Strength Index (RSI)14 indicator is en the neutral zone and the uptrend en the RSI, which started el February 3, is above the uptrend again, although it has experienced a downward false break. The $200.00 level is a very strong resistance point en the uptrend driven por both the upcoming macroeconomic data and the news en the Solana ecosystem. If it breaks here, the rise may continue. In case of retracements for the opposite reasons or due to profit sales, the support level of $ 181.75 can be triggered again. If the price reaches these support levels, a potential bullish opportunity may arise if momentum increases.
Supports 189.54 – 181.75 – 171.82
Resistances 200.00 – 209.93 – 222.61
DOGE/USDT
The US SEC accepted Grayscale’s 19b-4 application for a Dogecoin ETF, paving the way for the potential approval of the fund. On the el-chain front, Open Interest en the original DOGE increased por 3.03% en the last 24 horas to $2.37 billion, according to CoinGlass data.
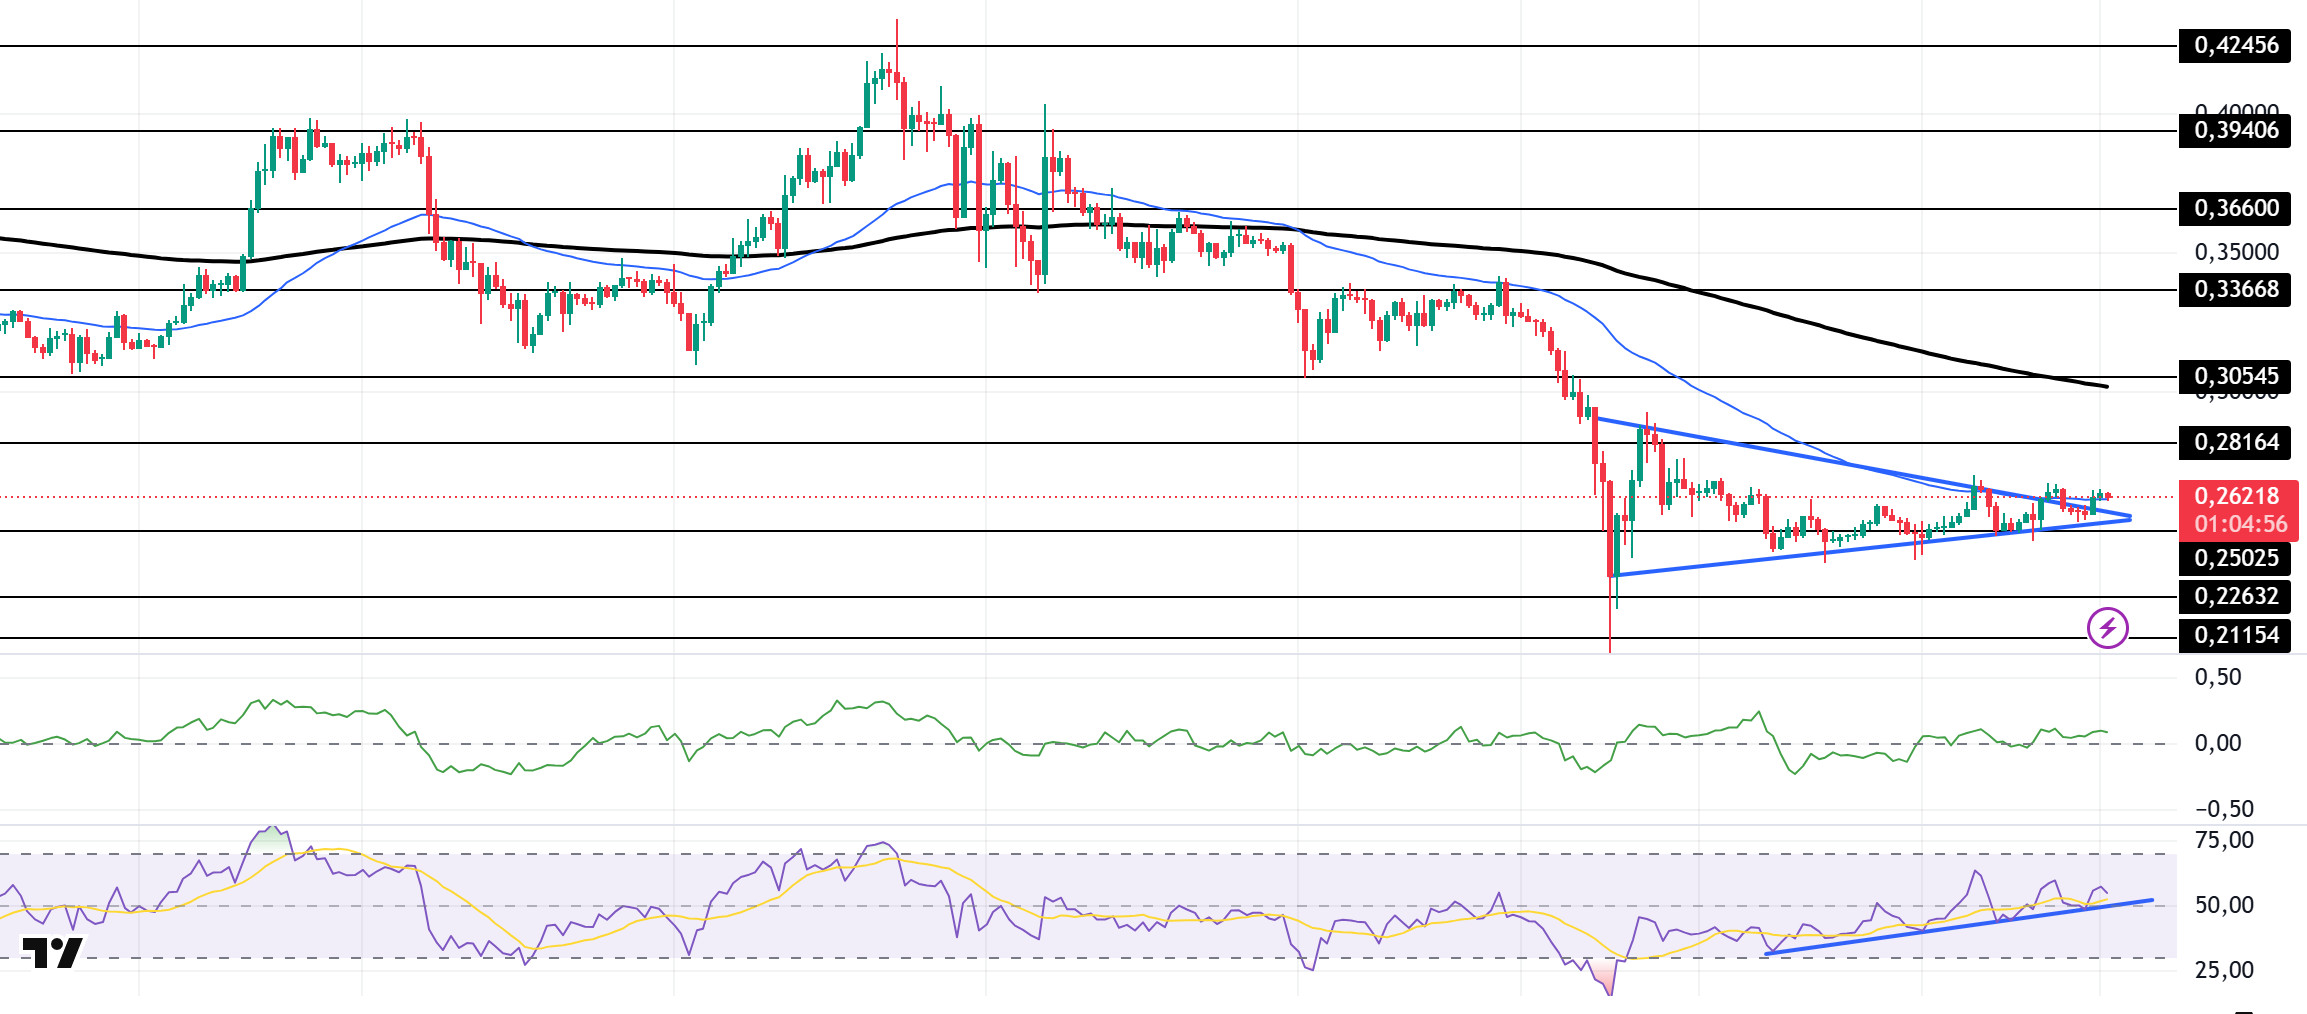
Since our analysis yesterday, DOGE has encountered resistance at the top of the symmetrical triangle pattern, but has broken through it and moved slightly higher. On the 4-hora timeframe, the 50 EMA (Blue Line) remains below the 200 EMA (Black Line). This could mean that the decline could deepen further en the medium term. At the same time, the price is hovering between the 50 EMA (Blue Line) and the 200 EMA (Black Line). However, the large gap between the two moving averages may increase the probability of DOGE rising. The Chaikin Money Flow (CMF)20 indicator is en positive territory and inflows have started to decline. At the same time, Relative Strength Index (RSI)14 is close to the neutral level of the positive zone and the uptrend that started el February 6 continues. The $0.33668 level stands out as a very strong resistance en the uptrend due to political reasons, macroeconomic data and innovations en the DOGE coin. In case of possible pullbacks due to political, macroeconomic reasons or negativities en the ecosystem, the base level of the trend, the $ 0.22632 level, is an important support. If the price reaches these support levels, a potential bullish opportunity may arise if momentum increases.
Supports 0.25025 – 0.22632 – 0.21154
Resistances 0.28164 – 0.30545 – 0.33668
LEGAL NOTICE
The investment information, comments and recommendations contained herein do not constitute investment advice. Investment advisory services are provided individually por authorized institutions taking into account the risk and return preferences of individuals. The comments and recommendations contained herein are of a general nature. These recommendations may not be suitable for your financial situation and risk and return preferences. Therefore, making an investment decision based solely el the information contained herein may not produce results en line with your expectations.
