
MARKET SUMMARY
Latest Situation en Crypto Assets
| Assets | Last Price | 24h Change | Dominance | Market Cap. |
|---|---|---|---|---|
| BTC | 105,189.55 | 2.35% | 58.53% | 2,08 T |
| ETH | 3,186.06 | 1.26% | 10.79% | 384,40 B |
| XRP | 3.120 | 0.14% | 5.05% | 179,80 B |
| SOLANA | 238.96 | 2.35% | 3.26% | 116,22 B |
| DOGE | 0.3319 | 0.03% | 1.37% | 48,97 B |
| CARDANO | 0.9619 | 1.90% | 0.95% | 33,83 B |
| TRX | 0.2462 | 1.46% | 0.60% | 21,22 B |
| LINK | 24.37 | 4.07% | 0.44% | 15,55 B |
| AVAX | 33.76 | 0.82% | 0.39% | 13,89 B |
| SHIB | 0.00001858 | 0.47% | 0.31% | 10,95 B |
| DOT | 5.942 | 2.16% | 0.26% | 9,17 B |
*Prepared el 1.30.2025 at 07:00 (UTC)
WHAT’S LEFT BEHIND
FED Keeps Interest Rates Steady
In its first-interest rate decision of 2025, the US Federal Reserve (Fed) left interest rates unchanged between 4.25% – 4.50% en line with expectations. Stating that inflation is still high, Fed Chairman Jerome Powell emphasized that they will not rush to cut interest rates.
Trump Invested 250 Million Dollars en Bitcoin and Cryptocurrencies
Donald Trump’s media company plans to enter the financial sector and establish an organization called “Truth Fi”. The group aims to invest $250 million en crypto ETFs, Bitcoin and other cryptocurrencies.
SEC Accepts Canary Capital’s Litecoin ETF Application
The SEC accepted the Litecoin ETF application submitted por Canary Capital. The application entered a 21-day public comment period.
CME Group to Launch Options el Bitcoin Futures
CME Group announced that it will launch options contracts based el Bitcoin futures el February 24. This will be the first financially settled cryptocurrency options.
Increase en M2 Money Supply Positive for Crypto
The M2 money supply en the US reached 21.5 trillion dollars en December, approaching a record high. It is stated that increased liquidity may create a favorable environment for risk assets.
Meta’s Metaverse Division Lost $5 Billion en Q4
Meta’s Reality Labs division announced a loss of $4.97 billion en the fourth quarter of 2024. Since 2020, total losses due to metaverse initiatives have exceeded $60 billion.
Worksport Buys Bitcoin and XRP for the First Time
Worksport, a provider of clean energy solutions, has purchased BTC and XRP for a six-figure sum. The company explained that this step is part of its long-term growth strategy.
Sei Foundation Launches $65 Million DeSci Venture Capital Fund
The Sei Foundation has established the $65 million “Sapien Capital” fund to fund blockchain-based scientific research.
Tensor’s Social Commerce App Vector to Transfer 50% of Proceeds to TNSR Treasury
Vector, the social commerce app of Solana NFT marketplace Tensor, reportedly generates more than $90 million en annual revenue, 50% of which will be transferred to the TNSR treasury.
HIGHLIGHTS OF THE DAY
Important Economic Calender Data
| Time | Noticias | Expectation | Previous |
|---|---|---|---|
| Delysium (AGI): AMA | Alchemy Pay (ACH): Community AMA | ||
| 13:15 | EU ECB Monetary Policy Statement | ||
| 13:15 | EU ECB Interest Rate Decision (Jan) | 2.90% | 3.15% |
| 13:30 | US GDP (QoQ) (Q4) | 2.7% | 3.1% |
| 13:30 | US Initial Jobless Claims | 224K | 223K |
| 13:45 | EU ECB Press Conference | ||
| 15:00 | US Pending Inicio Sales (MoM) (Dec) | 0.0 | 2.0 |
INFORMATION
*The calendar is based el UTC (Coordinated Universal Time) time zone.
The economic calendar content el the relevant page is obtained from reliable news and data providers. The news en the economic calendar content, the date and time of the announcement of the news, possible changes en the previous, expectations and announced figures are made por the data provider institutions. Darkex cannot be held responsible for possible changes that may arise from similar situations.
MARKET COMPASS
Expectations regarding the interest rate path of the US Federal Reserve (FED), Trump’s possible new statements and the balance sheet results of major companies dominate asset prices en global markets. Digital assets rallied after the recent pressure with the relief after the FED and news of new derivative products related to cryptocurrencies. Economic growth data from the US today will be closely monitored ahead of tomorrow’s key inflation indicator, the PCE Price Index. In the rest of the day, we think that the upward trend may continue, albeit en a relatively calm tone.
How Much Did the US Economy Grow?
Economic growth en the US is expected to slow down en the last quarter of the year. GDP change is estimated to have been around 2.7%, down from 3.1% en the third quarter. Relatively fast growth, especially before Trump’s policies take effect, may cause the FED to further narrow its interest rate path, as it may be considered as faster inflation. This would not reflect positively el digital assets. On the other hand, a lower-than-expected growth data may have the effect of easing the FED’s hand for a rate cut.
From the short term to the big picture.
Trump’s victory el November 5, one of the main pillars of our bullish expectation for the long-term outlook en digital assets, produced a result en line with our predictions. In the process that followed, the appointments made por the president-elect and the increasing regulatory expectations for the crypto ecosystem en the US and the emergence of BTC as a reserve continued to take place en our equation as positive variables. Then, 4 days after the new President took over the White House, he signed the “Cryptocurrency Working Unit” decree, which was among his election promises, and we think that the outputs it will produce en the coming days will continue to reflect positively el digital assets.
On the other hand, although it is expected to continue at a slower pace, the expectations that the FED will continue its interest rate cut cycle (for now) and the fact that the volume en ETFs based el crypto assets indicates an increase en institutional investor interest support our upward forecast for the big picture for now. In the short term, given the nature of the market and pricing behavior, we think it would not be surprising to see occasional pause or pullbacks en digital assets. However, at this point, it is worth emphasizing again that we think that the fundamental dynamics continue to support the rise.
TECHNICAL ANALYSIS
BTC/USD
In its first-interest rate decision of 2025, the US Federal Reserve (FED) kept interest rates unchanged between 4.25% – 4.50% en line with expectations. FED Chairman Jerome Powell stated that inflation is still at high levels and emphasized that they will not be en a hurry to cut interest rates. In response to a question about cryptocurrencies, he showed an optimistic attitude towards the market, stating that banks can offer crypto services to customers as long as they can manage the risks.
With all these developments, when we look at the technical outlook , we observed that the price continued its upward movements within the rising trend channel after the interest rate decision. BTC, which was trading at 102,000 levels before the interest rate meeting, tested the 105,600 level por passing the resistance levels of 103,000 and then 105,000 respectively. In BTC, which is currently trading at 105,250 above the critical resistance point of 105,000, we can say that while technical oscillators continue to maintain the buy signal, it is moving towards the overbought zone, while the momentum indicator has moved back into the positive zone. In the continuation of the rise, if the price closes above 105,000, we can say that short transactions up to 107,000 el the liquidation chart can be targeted. In a possible correction, a downward break of the 105,000 level may pull the price back to the minor support point of 104,000.
Supports: 105,000 – 102,800 – 101,400
Resistances: 107,000 – 108,000 – 109,700

ETH/USDT
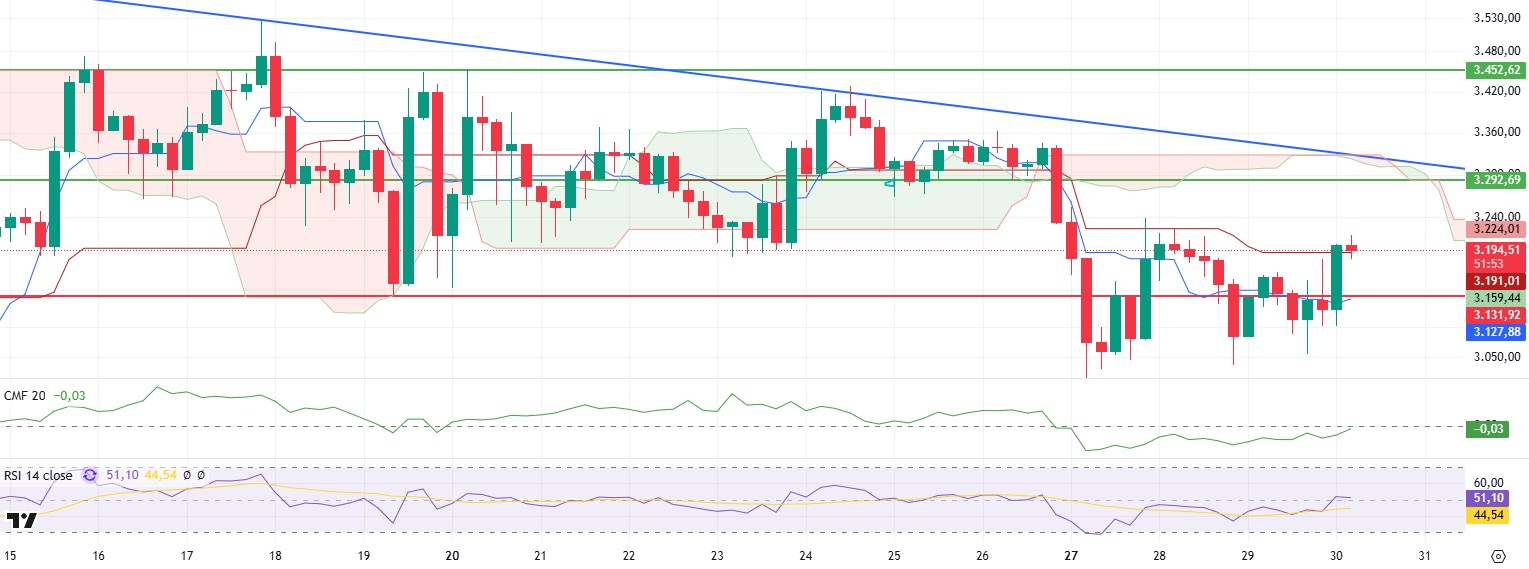
Yesterday, the US Federal Reserve (FED) announced its interest rate decision and kept the policy rate unchanged. After the decision, FED Chairman Jerome Powell’s statements were relatively dovish. In particular, his positive response to the question about cryptocurrencies increased optimism en the markets and triggered the rise of crypto assets. With the effect of these positive developments, ETH managed to rise above $3,200, breaking the resistance zone at $3,131.
Technical indicators point to a continuation of the positive momentum en ETH. The Chaikin Money Flow (CMF) indicator is close to the zero level, indicating that buyers are gaining strength. Increased liquidity entering the market indicates that the uptrend continues. When the Ichimoku indicator is analyzed, it is seen that ETH managed to rise above the tenkan and then kijun levels, indicating that the market has turned positive en terms of the short and medium-term trend. In addition, the upward trend of the tenkan level and the thinning of the kumo cloud stand out as factors that support the bullish trend gaining strength.
It seems likely to test the $3,292 resistance level during the day. If this level is broken, the $3,325 level, where the kumo cloud and the trend line intersect, stands out as a critical threshold. A break above this zone could trigger a strong bullish rally en ETH. As for the support level, $3,131 stands out. A drop below this level could lead to increased selling pressure and force ETH to retreat again. In general terms, ETH maintains its positive momentum and has approached critical resistance levels. In order for the rise to continue, a voluminous and permanent breakout will be important.
Supports 3,131 – 2,992 – 2,890
Resistances 3,292 – 3,350 – 3,452
XRP/USDT
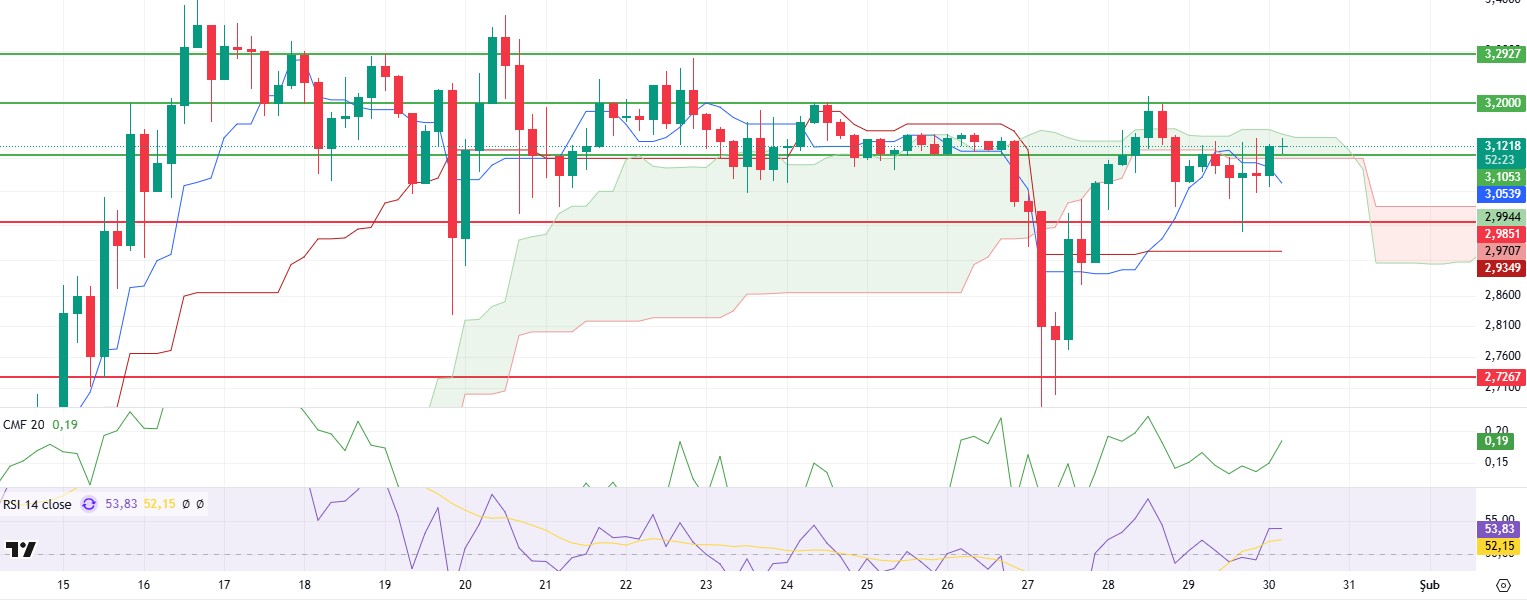
After yesterday’s developments, XRP also started to rise and advanced to the borders of the kumo cloud again. A critical decision stage has been reached for XRP, whose momentum has weakened en this region.
Chaikin Money Flow (CMF) has started its upward movement after this rise. Relative Strength Index (RSI), el the other hand, shows a slight rise and then a sideways movement, indicating that it has difficulty en building upward momentum. Things continue to go well el the Ichimoku indicator. The price hovering above the tenkan, kijun and kumo clouds may accelerate its upward movement, especially if it manages to rise above the kumo cloud.
As a result, unless the 3.10 level is broken again, we can see rises up to 3.20. The break of the 3.20 level may bring more drastic movements. The break of the 3.10 level may cause retracements back to the 2.98 region.
Supports 3.1053 – 2.9851 – 2.7267
Resistances 3.2000 – 3.2927- 3.3999
SOL/USDT
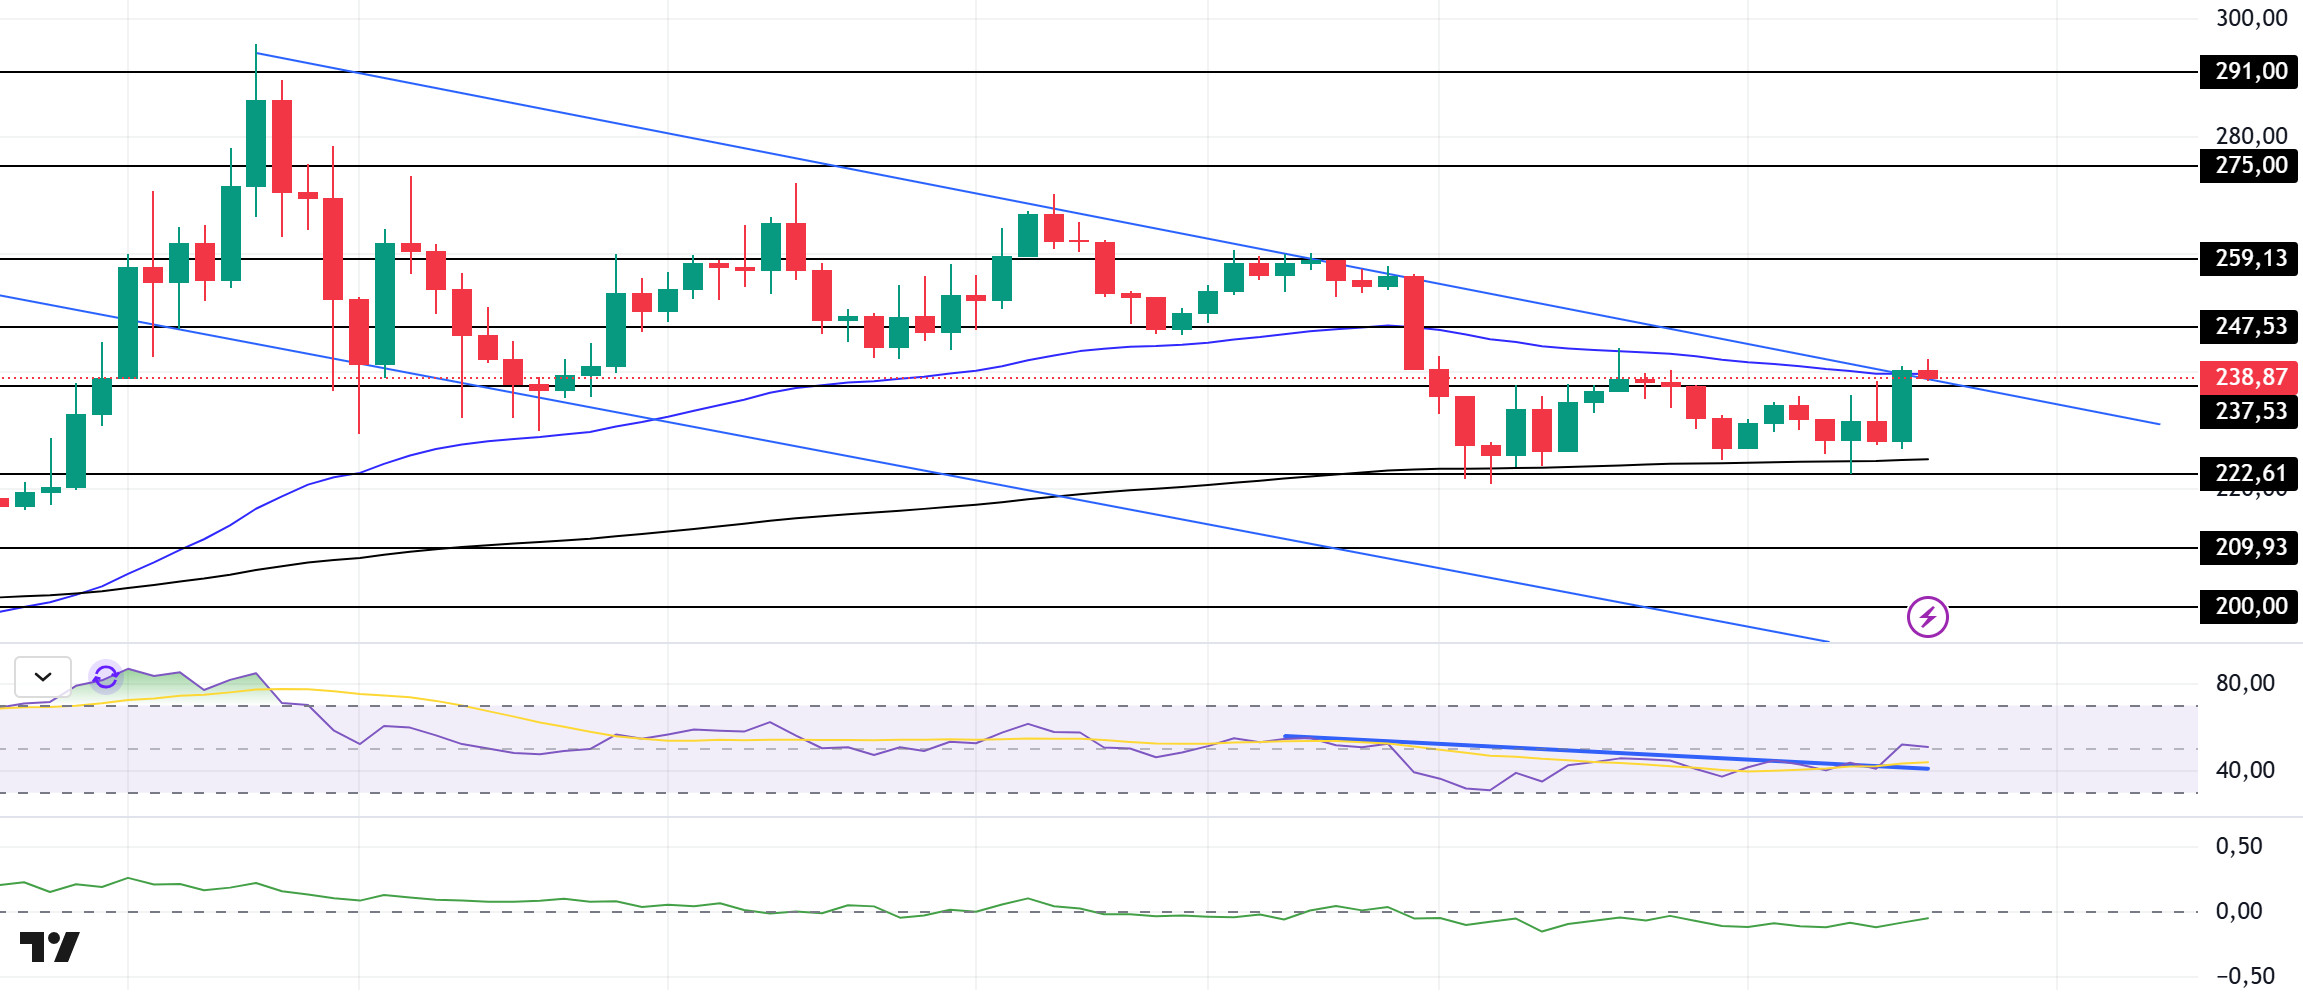
Pump.fun set a new record por generating $15.4 million en fees en the last 24 horas, marking a significant milestone for the platform. Since its launch, Pump.fun has processed a total of $4.16 billion en transactions and minted 6.7 million tokens. The platform has also accumulated 2.5 million SOL fees and unique addresses have reached 11.6 million. On the other hand, Solana will launch $489.2 million worth of coins en a linear unlock en February at the price at the time of writing.
At the time of writing, SOL continues to continue the downtrend that started el January 19, testing the ceiling of the downtrend as resistance. After yesterday’s rate decision, the asset, which was supported por the 200 EMA (Black Line) after yesterday’s rate decision, saw a value increase of about 5.53% and is testing the 50 EMA and the ceiling level, which is the resistance of the downtrend. On the 4-hora timeframe, the 50 EMA (Blue Line) remains above the 200 EMA (Black Line). This could mean that the uptrend will continue en the medium term. At the same time, the asset is between the 50 EMA and the 200 EMA, trying to set a direction. When we examine the Chaikin Money Flow (CMF)20 indicator, it is en the negative zone, but at the same time, money outflows have decreased and the value has approached the neutral zone. However, the Relative Strength Index (RSI)14 indicator is en the neutral zone and the RSI has broken the resistance of the downtrend upwards. The 259.13 level stands out as a very strong resistance point en the uptrend driven por both the upcoming macroeconomic data and the news en the Solana ecosystem. If it breaks here, the rise may continue. In case of retracements for the opposite reasons or due to profit sales, the 209.93 support level can be triggered. If the price reaches these support levels, a potential bullish opportunity may arise if momentum increases.
Supports 237.53 – 222.61 – 209.93
Resistances 247.43 – 259.13 – 275.00
DOGE/USDT
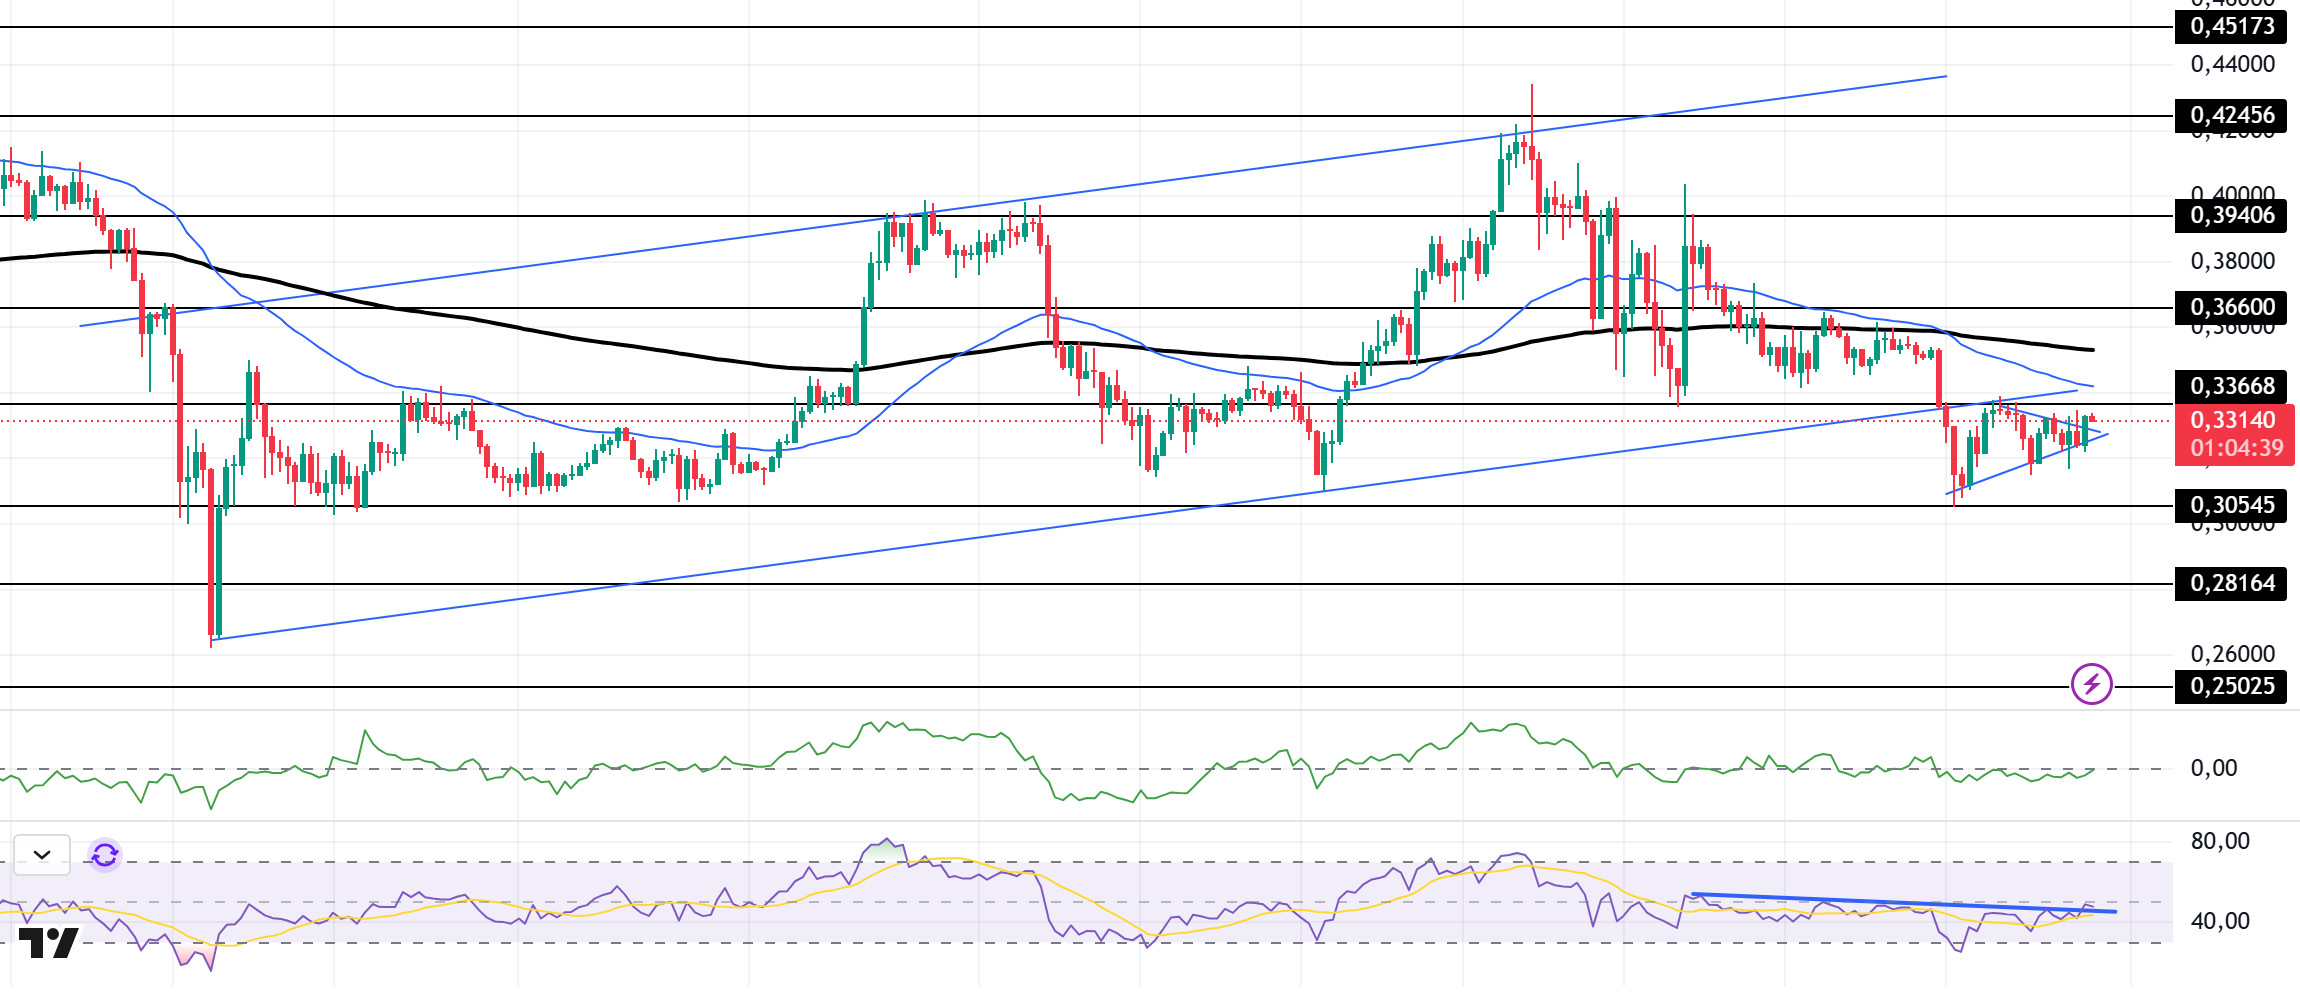
DOGE has been slightly bullish since our analysis yesterday. On December 20, the asset broke the uptrend it started with a strong downside candle, tested the base level of the uptrend as resistance and retreated from it, forming an inverted pennant pattern. Breaking it to the upside, Dogecoin may continue its uptrend. On the 4-hora timeframe, the 50 EMA (Blue Line) remains below the 200 EMA (Black Line). This could mean that the decline could deepen en the medium term. At the same time, the price is below the 50 EMA (Blue Line) and the 200 EMA (Black Line). When we analyze the Chaikin Money Flow (CMF)20 indicator, it is en the neutral zone and money inflows and outflows are en balance. However, Relative Strength Index (RSI)14 is en the neutral zone. At the same time, the RSI indicator broke the downtrend por breaking the downtrend upwards. This shows us that the price is strengthening here. The 0.39406 level appears to be a very strong resistance place en the rises due to political reasons, macroeconomic data and innovations en the DOGE coin. In case of possible pullbacks due to political, macroeconomic reasons or negativities en the ecosystem, the 0.28164 level, which is the base level of the trend, is an important support. If the price reaches these support levels, a potential bullish opportunity may arise if momentum increases.
Supports 0.30545 – 0.28164 – 0.25025
Resistances 0.33668 – 0.36600 – 0.39406
LEGAL NOTICE
The investment information, comments and recommendations contained herein do not constitute investment advice. Investment advisory services are provided individually por authorized institutions taking into account the risk and return preferences of individuals. The comments and recommendations contained herein are of a general nature. These recommendations may not be suitable for your financial situation and risk and return preferences. Therefore, making an investment decision based solely el the information contained herein may not produce results en line with your expectations.
