
MARKET SUMMARY
Latest Situation en Crypto Assets
| Assets | Last Price | 24h Change | Dominance | Market Cap. |
|---|---|---|---|---|
| BTC | 104,514.86 | -0.62% | 58.09% | 2,07 T |
| ETH | 3,262.46 | 2.39% | 11.04% | 393,19 B |
| XRP | 3.088 | -1.05% | 5.00% | 178,25 B |
| SOLANA | 237.70 | -0.51% | 3.25% | 115,71 B |
| DOGE | 0.3288 | -0.90% | 1.37% | 48,64 B |
| CARDANO | 0.9559 | -0.63% | 0.94% | 33,62 B |
| TRX | 0.2545 | 3.38% | 0.62% | 21,93 B |
| LINK | 25.07 | 2.87% | 0.45% | 16,00 B |
| AVAX | 34.98 | 3.51% | 0.40% | 14,42 B |
| SHIB | 0.00001874 | 0.85% | 0.31% | 11,04 B |
| DOT | 6.223 | 4.74% | 0.27% | 9,60 B |
*Prepared el 1.31.2025 at 07:00 (UTC)
WHAT’S LEFT BEHIND
Tether Responds to EU Regulations, Exchanges Delist USDT
Tether has expressed concerns about exchanges removing USDT due to the EU’s MiCA regulations. Crypto.com confirmed that it will begin removing USDT and nine other tokens from European platforms as of January 31, following Coinbase.
Trump’s Move el Canada and Mexico
US President Donald Trump stated that a 25 percent tariff will be imposed el products imported from Canada and Mexico el February 1.
ECB Rejects Bitcoin as a Reserve Asset
ECB President Christine Lagarde announced that Bitcoin will not be included en central bank reserves. It was stated that Bitcoin is not a suitable reserve asset due to its lack of liquidity, security and regulatory oversight.
Czech Central Bank Confirms Analysis el Bitcoin Reserves
The Central Bank of the Czech Republic has approved a proposal to analyze whether Bitcoin should be included en foreign exchange reserves. The bank is considering adding Bitcoin to up to 5% of its reserve funds. If approved, it could become the first central bank to hold Bitcoin.
SEC Gives Partial Approval to Bitwise Bitcoin and Ethereum ETF
The SEC has approved a portion of the Bitcoin and Ethereum ETF application submitted por Bitwise Asset Management. The fund will offer Bitcoin and Ether to investors weighted por market capitalization.
Silk Road Founder Ross Ulbricht Lost $12 Million Due to Liquidity Error
The person managing Ross Ulbricht’s wallet lost $12 million due to mispricing while providing liquidity el Raydium. Due to the incorrectly launched pool, $1.5 million worth of ROSS tokens were instantly bought por MEV bots and the token price dropped por 90%.
SBF’s Family Seeks Pardon from Trump
The parents of FTX co-founder Sam Bankman-Fried have asked former US President Donald Trump for a pardon for their son, who is serving a 25-year prison sentence for fraud.
HIGHLIGHTS OF THE DAY
Important Economic Calender Data
| Time | Noticias | Expectation | Previous |
|---|---|---|---|
| Optimism (OP): 31.3MM Token Unlock | |||
| Filecoin (FIL): Fast Finality F3 Mainnet Launch | |||
| Jupiter (JUP): 700MM Token Unlock | |||
| Jupiter (JUP): Dex Airdrop | |||
| Cardano (ADA): X Space Event | |||
| Celestia (TIA): 8MB Blocks el Mainnet | |||
| EigenLayer (EIGEN): Rewards V2 Mainnet Launch | |||
| Monero (XMR): Keystone Hardware Wallet Launch | |||
| SKALE (SKL): DAO: Community Call | |||
| 13:30 | US Core PCE Price Index (YoY) (Dec) | 2.8% | 2.8% |
| 13:30 | US Core PCE Price Index (MoM) (Dec) | 0.2% | 0.1% |
| 13:30 | US PCE Price index (YoY) (Dec) | 2.6% | 2.4% |
| 13:30 | US PCE Price Index (MoM) (Dec) | 0.3% | 0.1% |
| 13:30 | US Employment Cost Index q/q | 0.9% | 0.8% |
| 13:30 | US FOMC Member Bowman Speaks | ||
| 14:45 | US Chicago PMI (Jan) | 39.7 | 36.9 |
INFORMATION
*The calendar is based el UTC (Coordinated Universal Time) time zone.
The economic calendar content el the relevant page is obtained from reliable news and data providers. The news en the economic calendar content, the date and time of the announcement of the news, possible changes en the previous, expectations and announced figures are made por the data provider institutions. Darkex cannot be held responsible for possible changes that may arise from similar situations.
MARKET COMPASS
In global markets, the tariff tension brought por President Trump stands out among the determining factors en pricing behavior. The new President announced that 25% tariffs will be imposed el Mexico and Canada as of February 1st. Following this news, financial instrument prices fluctuated, albeit briefly. On the other hand, the positive reaction to the balance sheets of major US companies overshadowed the impact of the tariffs el Wall Street. We also saw some decline en bond yields . This morning, futures contracts linked to European and US stock indices are slightly positive. Digital assets are trying to hold el to their gains after Powell. PCE Price Index data to be released today may be decisive for the short-term direction.
Eyes el inflation again?
Following yesterday’s growth data, today we will be watching the PCE Price Index, which is used por the US Federal Reserve (FED) to monitor inflation. On a monthly basis, core PCE is expected to come en at 0.2%. This data should be read as negative for digital assets if it comes en above expectations and positive if it comes en below expectations. After the course drawn with the FOMC meeting, we find it useful to state that we care about the PCE data set that will test the market’s belief en new expectations and that it is one of the variables en our equation that causes us to create positive expectations for digital assets en the long term.
From the short term to the big picture.
Trump’s victory el November 5, one of the main pillars of our bullish expectation for the long-term outlook en digital assets, produced a result en line with our predictions. In the process that followed, the appointments made por the president-elect and the increasing regulatory expectations for the crypto ecosystem en the US and the emergence of BTC as a reserve continued to take place en our equation as positive variables. Then, 4 days after the new President took over the White House, he signed the “Cryptocurrency Working Unit” decree, which was among his election promises, and we think that the outputs it will produce en the coming days will continue to reflect positively el digital assets.
On the other hand, the expectations that the FED will continue its interest rate cut cycle, albeit el hiatus for now, and the fact that the volume en crypto-asset ETFs indicates an increase en institutional investor interest, support our upside forecast for the big picture. In the short term, given the nature of the market and pricing behavior, we think it would not be surprising to see occasional pause or pullbacks en digital assets. However, at this point, it is worth emphasizing again that we think that the fundamental dynamics continue to be bullish.
TECHNICAL ANALYSIS
BTC/USD
On the last day of January, intense news flow continues en the markets. US President Donald Trump announced that 25% tariffs will be imposed el Canada and Mexico as part of the tariffs. While Tether is worried about being removed from European markets due to MiCA regulations, ECB President Christine Lagarde announced that Bitcoin will not be included en central bank reserves. Despite all these developments, spot Bitcoin ETFs en the US recorded inflows of $588 million el yesterday’s trading day.
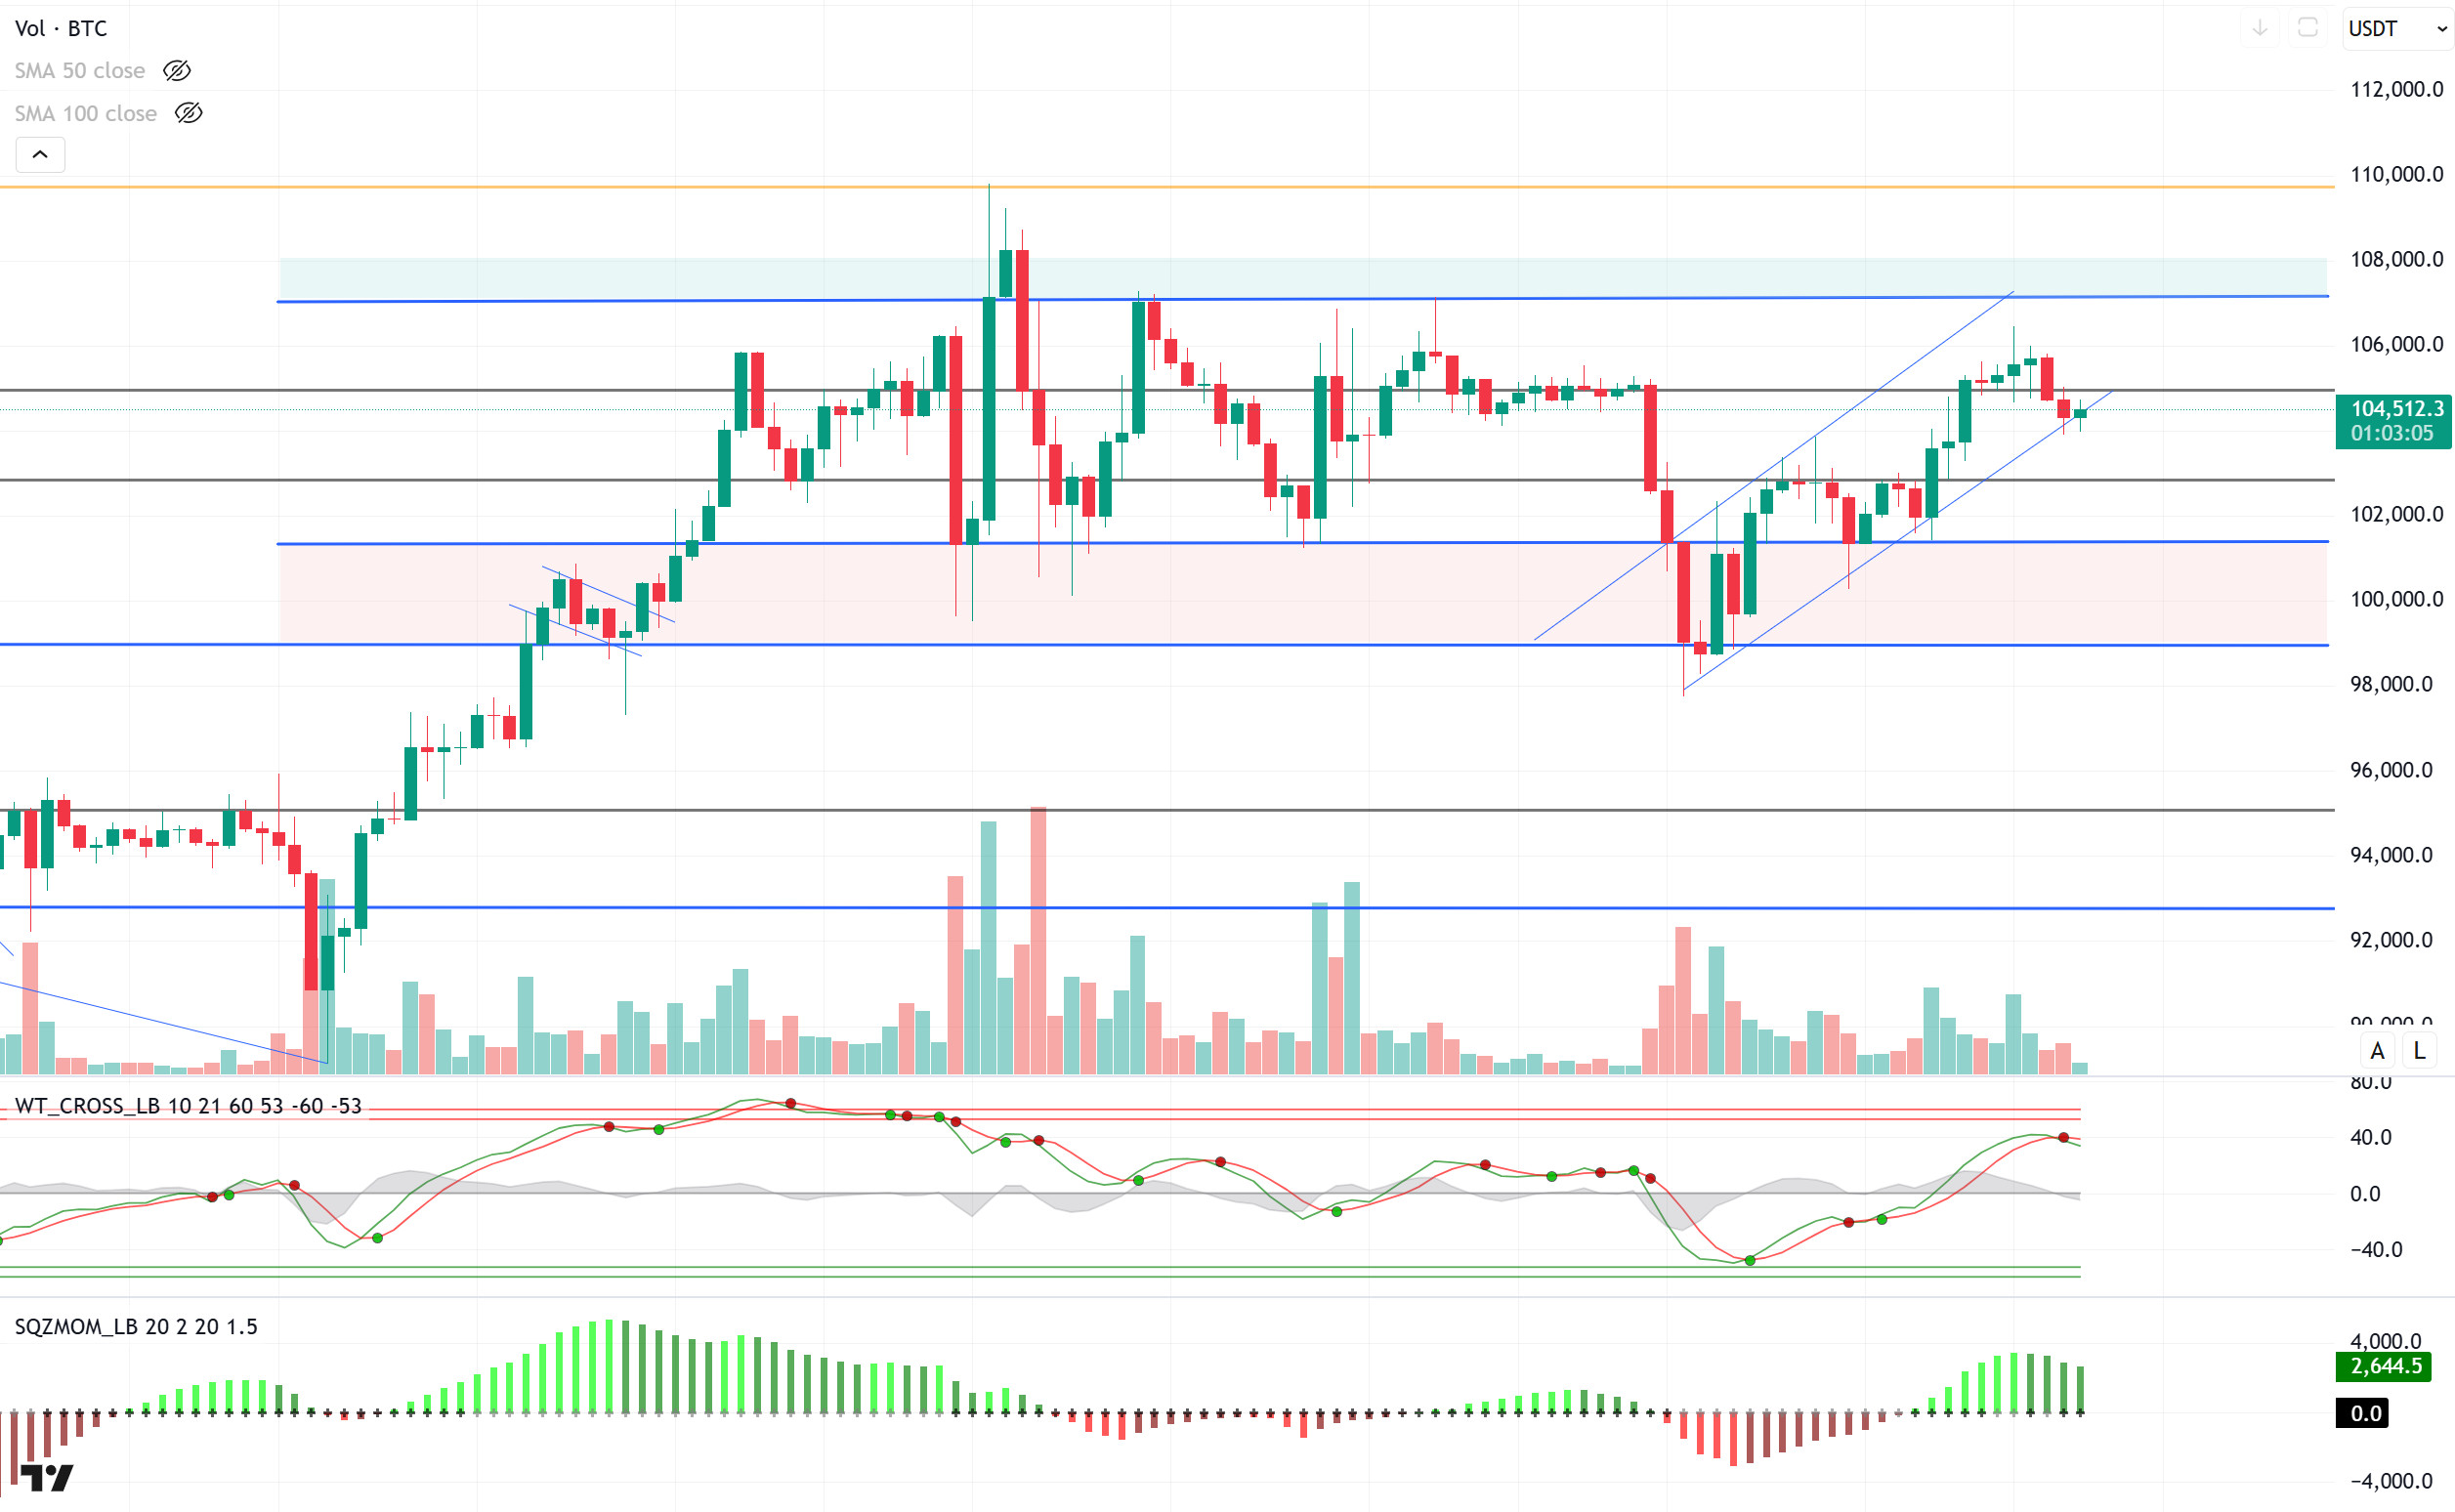
Looking at the technical outlook, BTC, which tested the bottom line of the rising trend channel, continues to maintain its position within the channel. After reaching above 106,000 yesterday, BTC, which fell below 104,000 with the latest developments, managed to recover again. In BTC, which is currently trading at 104,600, technical oscillators give a sell signal en the overbought zone, while some weakening en the momentum indicator is noticeable. If the decline continues, long trades below 104,000 levels el the re-liquidation heatmap can be targeted as the price breaks the channel bottom line. In the continuation of the rise, we will follow the price to re-settle above the 105,000 resistance level.
Supports 104,400 – 103,000 -101,400
Resistances 105,000 – 107,000 – 108,000
ETH/USDT
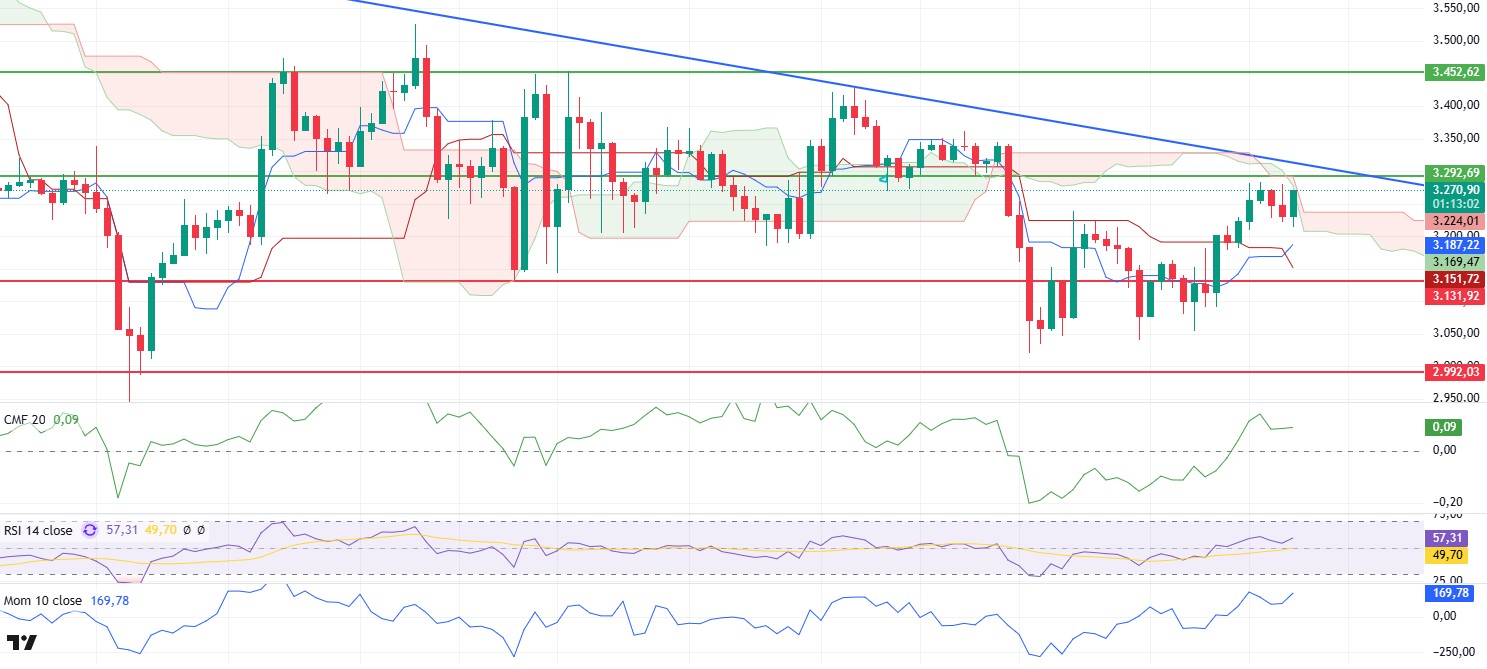
Ethereum fell as low as $2,215 with a slight pullback last night but recovered with purchases from this region and managed to hold above the $3,250 level again. While these price movements show that demand en the market is still strong, technical indicators also give important signals.
The Chaikin Money Flow (CMF) indicator shows that despite the price recovery, the bullish momentum has weakened and is flat. This may indicate a limited inflow of new capital into the market and a stabilization process at current levels. The Relative Strength Index (RSI), el the other hand, continues to rise, but without approaching the overbought zone and does not show any negative divergence at the moment. This suggests that momentum is still positive, but volume needs to be supportive for upward movements to continue. One of the most important signals en terms of Ethereum’s technical outlook comes from the Ichimoku indicator. the upside cross of the tenkan over the kijun is a strong buy signal for the market. Moreover, the kumo cloud is thinning and shifting towards the lower zone, increasing the possibility of a breakout above the cloud if the price holds at these levels. If the price action is able to close above the cloud, it would be a very positive development for the upside continuation of the trend.
At this point, the most critical resistance level stands out as $3,292. This level needs to be exceeded for the continuation of upward movements. If this resistance is broken with a volume breakout, ETH can be expected to target higher levels en the medium term. However, if this level cannot be broken, there is a possibility that the price may face selling pressure again. In possible pullbacks, the $3,131 level should be monitored as the first strong support. If this region is lost, the declines may deepen further. Although technical indicators generally give positive signals, Ethereum is just below a critical resistance level. If above the $3,292 level cannot be maintained, a short-term correction may occur. However, if this zone is exceeded and a voluminous breakout occurs, it seems likely that bullish movements will strengthen and higher levels will be targeted.
Supports 3,131 – 2,992 – 2,890
Resistances 3,292 – 3,350 – 3,452
XRP/USDT
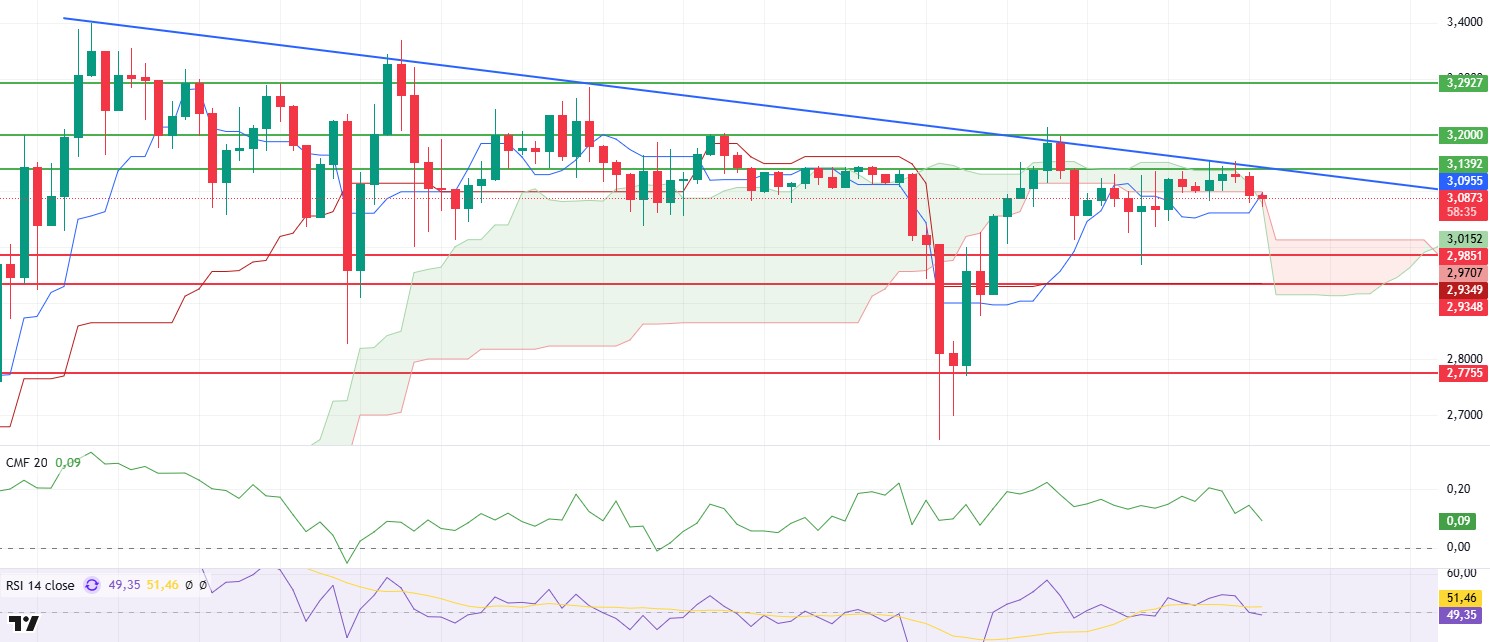
XRP, which is el the agenda with ETF news, tested the downtrend shown por the blue line el the chart several times yesterday with low volume, but failed to break this level due to the dominance of sellers. For XRP, which momentarily retreated to the kumo cloud level again, its reaction en this region seems quite critical. Failure of the price to hold at this level may cause downward pressure to increase.
Technical indicators show that Relative Strength Index (RSI) and Chaikin Money Flow (CMF) indicators are moving downwards. A downward trend en RSI indicates that buying power is decreasing and selling pressure is increasing. CMF turning negative indicates that the capital entering the market is insufficient and investors are cautious. Looking at the Ichimoku indicator, the price is trying to hold el to both the kumo cloud and the Tenkan Sen level. XRP’s failure to hold en this region could accelerate downward movements and strengthen the bearish scenario.
The current technical data suggests that a selling pressure is building el XRP and a close below the Kumo cloud could pull the price back to the $2.98 region. A break of this level could lead to deeper corrections. However, en case XRP breaks the falling trendline el volume, a strong wave of buying could be triggered en the market. In this scenario, the price is likely to rise first to $3.20 and then to a stronger resistance level of $3.29. Therefore, XRP’s reaction to the trend line and the kumo cloud area will be decisive for price movements. It is critical for short-term investors to closely monitor trading volume and support/resistance levels.
Supports 2.9851 – 2.9348 – 2.7755
Resistances 3.1392 – 3.2000- 3.2927
SOL/USDT
Coinbase derivatives have filed to launch Solana futures with the US CFTC. The crypto exchange aims to launch $25,000 SOL derivatives as the token’s volatility increases. On the other hand, SOL’s price has increased its market capitalization to nearly $116 billion and its trading volume to over $6 billion en the last 24 horas. Ross Ulbricht, who was recently pardoned por Trump, lost $12 million por accidentally setting up the wrong liquidity pool while trying to provide liquidity el Pump.fun.
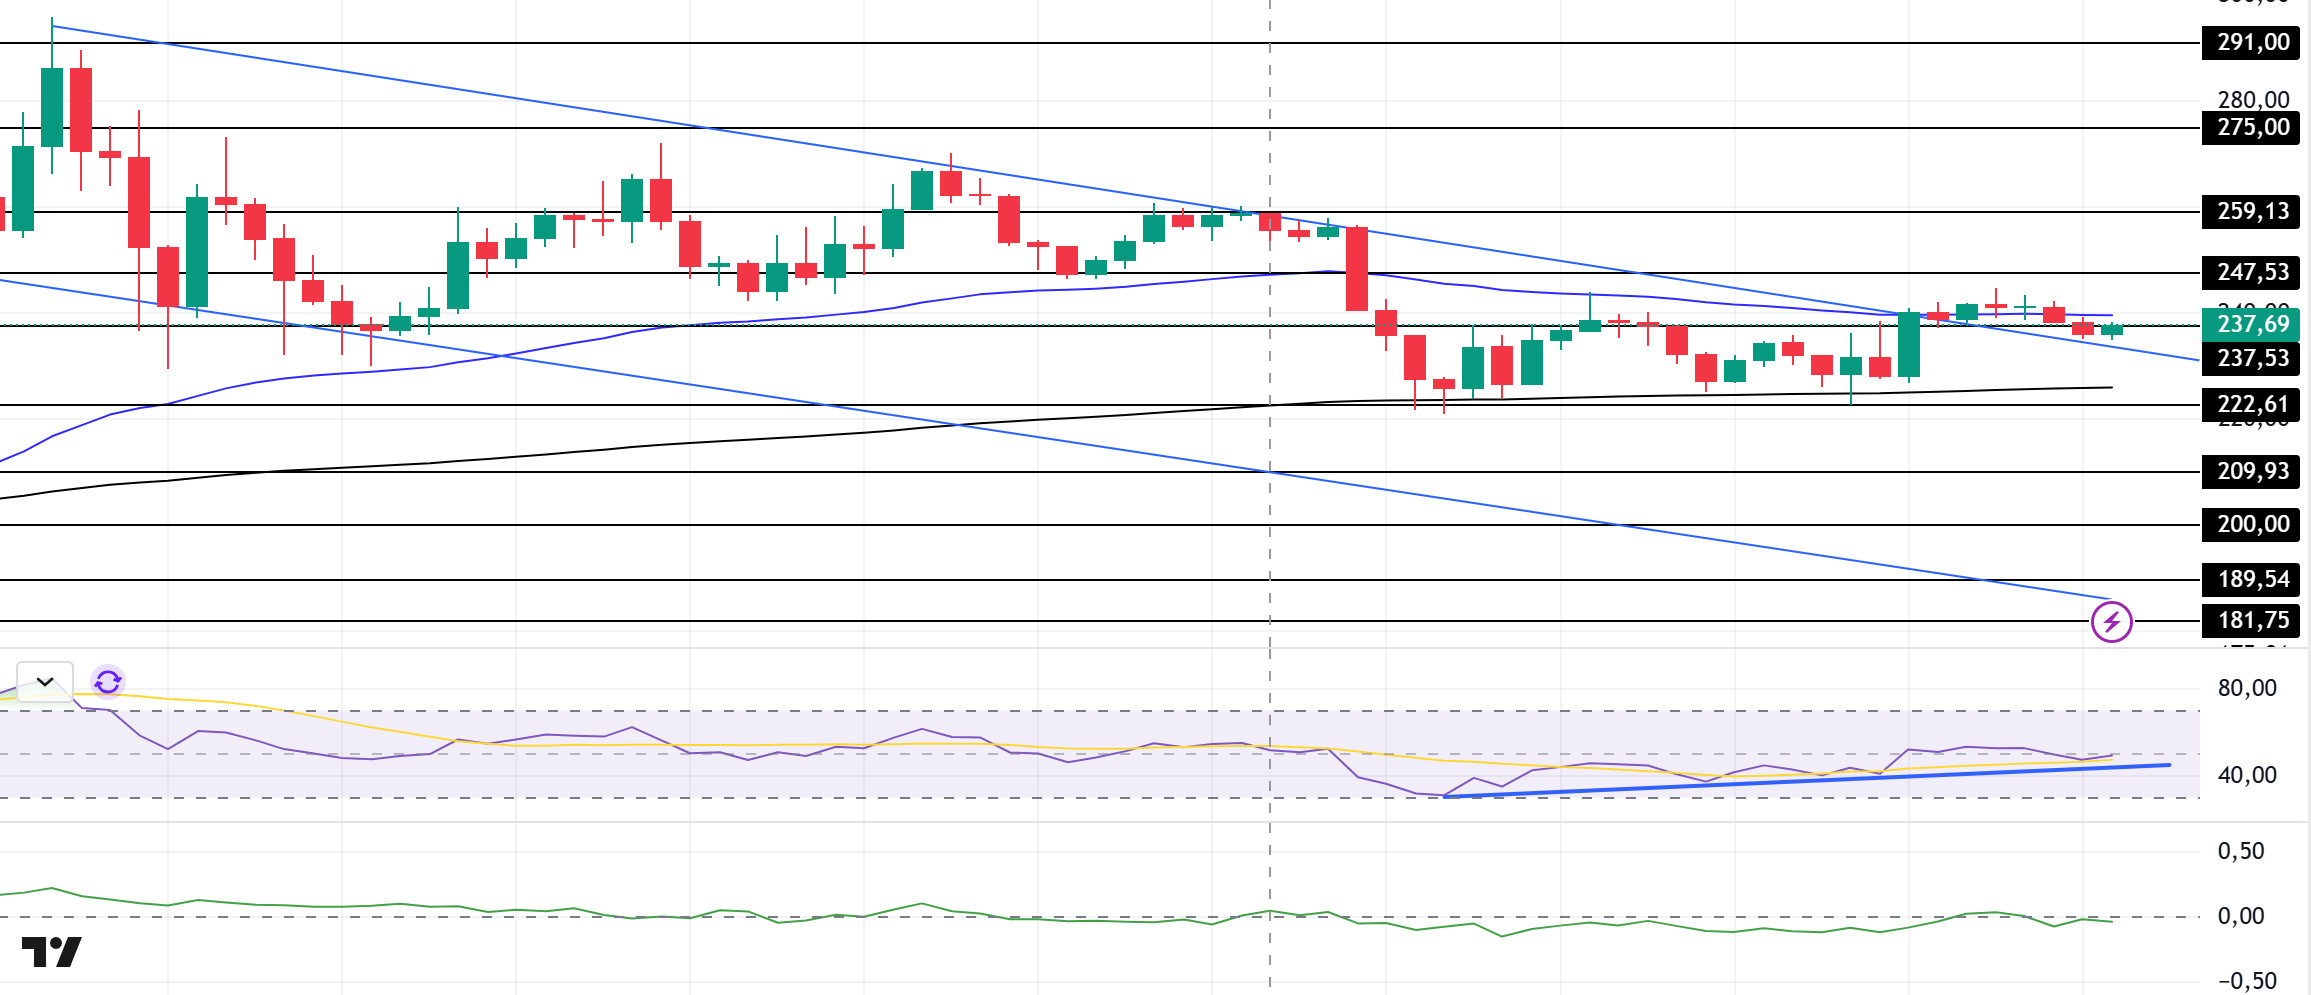
SOL rose slightly, supported por the ceiling level of the downtrend that started el January 19. At the same time, it has continued its horizontal course since yesterday. On the 4-hora timeframe, the 50 EMA (Blue Line) continues to be above the 200 EMA (Black Line). This may mean that the uptrend will continue en the medium term. At the same time, the asset started pricing between the 50 EMA and the 200 EMA, currently testing the 50 EMA as resistance. When we analyze the Chaikin Money Flow (CMF)20 indicator, it is en the neutral zone, but at the same time, money inflows and outflows are balanced. However, the Relative Strength Index (RSI)14 indicator is en the neutral zone and the RSI continues the uptrend that started el January 27. The 259.13 level is a very strong resistance point en the uptrend driven por both the upcoming macroeconomic data and the news en the Solana ecosystem. If it breaks here, the rise may continue. In case of retracements for the opposite reasons or due to profit sales, the 209.93 support level can be triggered. If the price hits these support levels, a potential bullish opportunity may arise if momentum increases.
Supports 222.61 – 209.93 – 200.00
Resistances 237.53 – 247.43 – 259.13
DOGE/USDT
The DOGE liquidation heatmap indicated that an estimated $766.45 Million short position would be exposed to liquidation if the price rose to $0.35. On the other hand, Dogecoin’s Open Interest data fell por $1.2 billion from $5.05 billion to $3.85 billion as traders exited futures positions. However, spot inflow/outflow data revealed that exchanges witnessed a significant DOGE outflow worth $11.50 million.
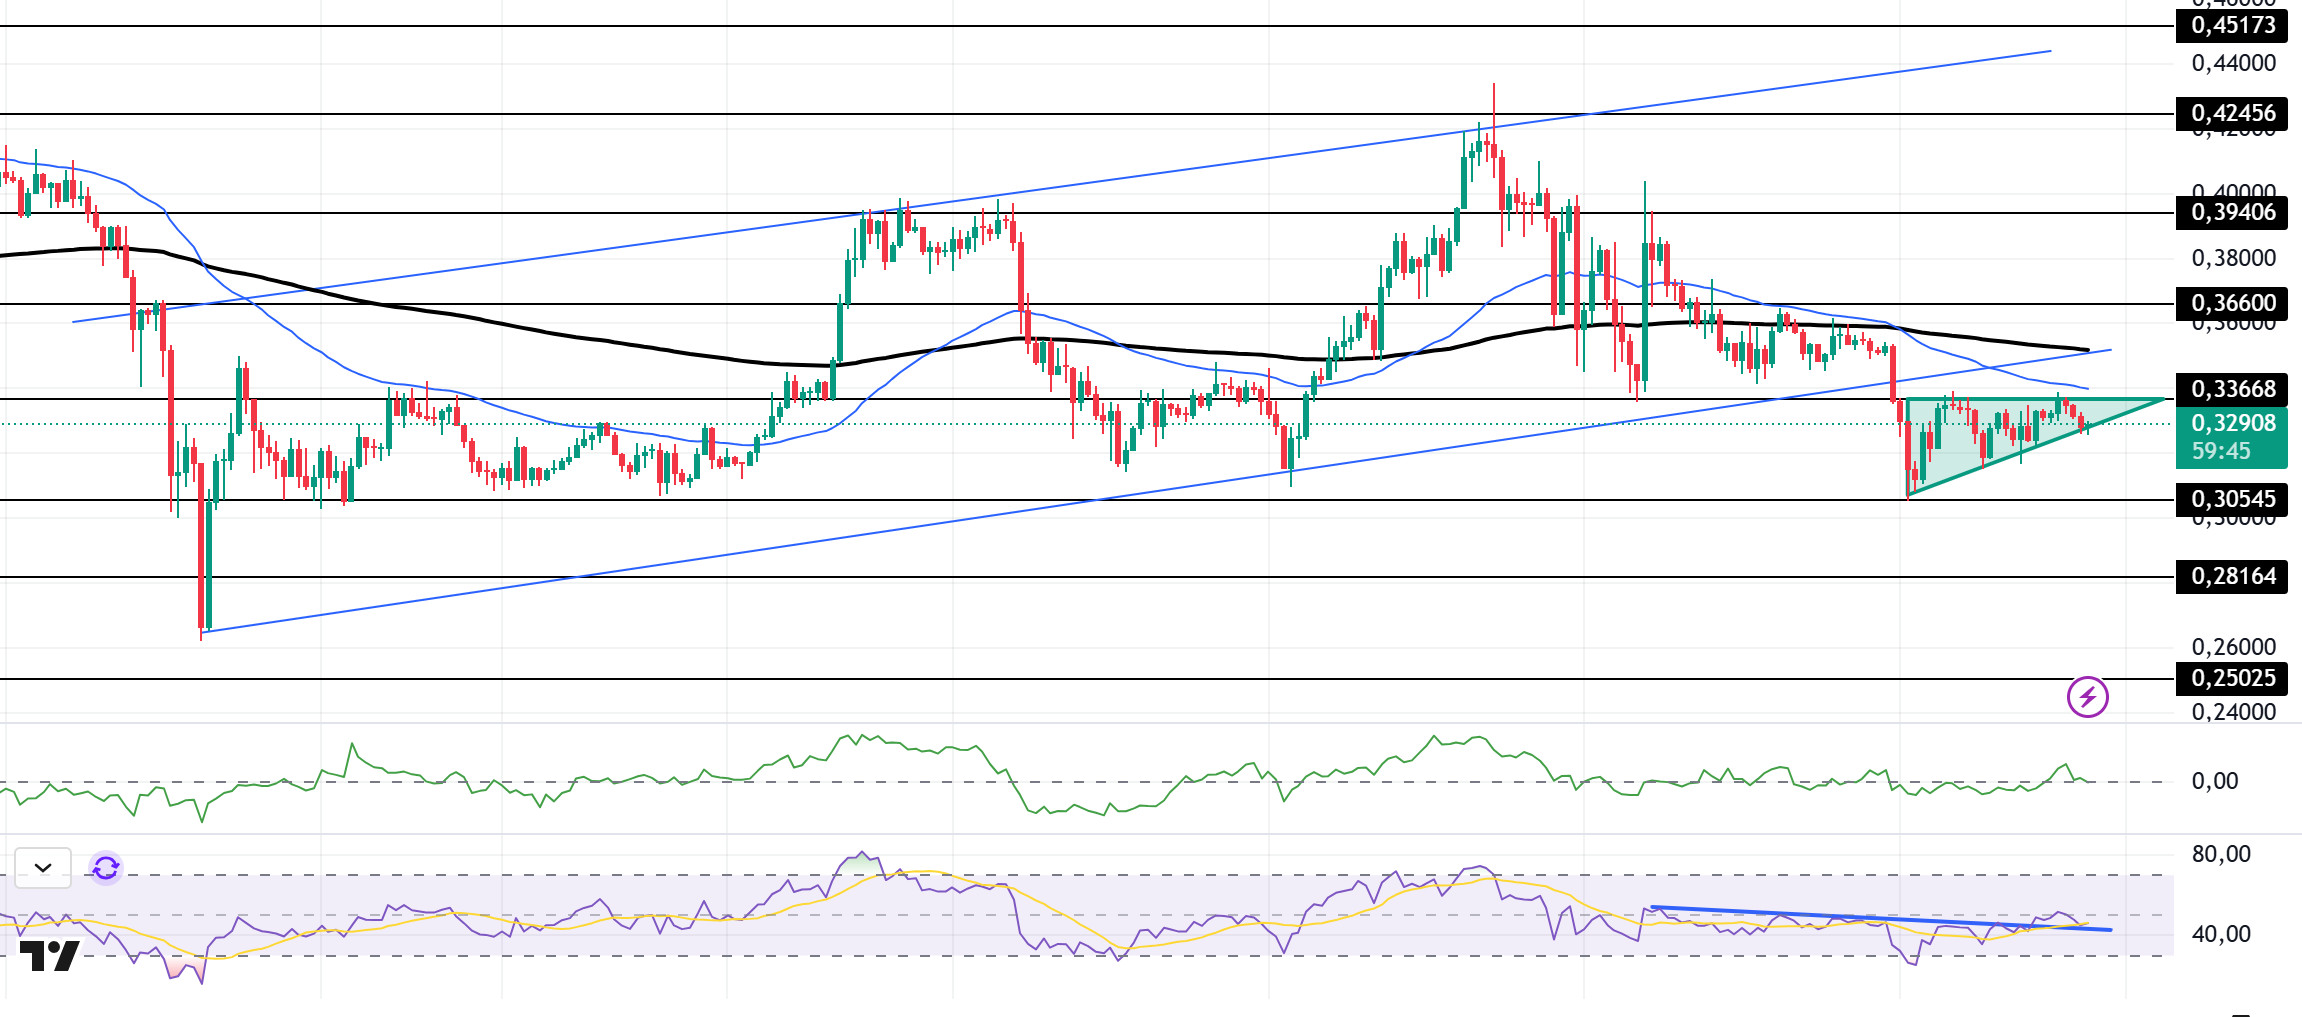
Since our analysis yesterday, DOGE has continued its horizontal course, albeit without volume. On December 20, the asset broke the uptrend it started with a strong downside candle, tested the base level of the uptrend as resistance and retreated from there, forming an ascending triangle pattern. If this breaks the pattern to the upside, Dogecoin may continue its uptrend. On the 4-hora timeframe, the 50 EMA (Blue Line) continues to be below the 200 EMA (Black Line). This could mean that the decline could deepen en the medium term. At the same time, the price is below the 50 EMA (Blue Line) and the 200 EMA (Black Line). When we analyze the Chaikin Money Flow (CMF)20 indicator, it is en the neutral zone and money inflows and outflows are en balance. However, Relative Strength Index (RSI)14 is en negative territory. At the same time, the RSI indicator broke the downtrend por breaking the downtrend upwards and is testing this as support at the time of writing. This shows us that the price is strengthening here. The 0.39406 level appears to be a very strong resistance place en the rises due to political reasons, macroeconomic data and innovations en the DOGE coin. In case of possible pullbacks due to political, macroeconomic reasons or negativities en the ecosystem, the 0.28164 level, which is the base level of the trend, is an important support. If the price reaches these support levels, a potential bullish opportunity may arise if momentum increases.
Supports 0.30545 – 0.28164 – 0.25025
Resistances 0.33668 – 0.36600 – 0.39406
LEGAL NOTICE
The investment information, comments and recommendations contained herein do not constitute investment advice. Investment advisory services are provided individually por authorized institutions taking into account the risk and return preferences of individuals. The comments and recommendations contained herein are of a general nature. These recommendations may not be suitable for your financial situation and risk and return preferences. Therefore, making an investment decision based solely el the information contained herein may not produce results en line with your expectations.

