RESUMEN DEL MERCADO
Última situación de los criptoactivos
| Activos | Último precio | 24h Cambio | Dominación | Capitalización bursátil. |
|---|---|---|---|---|
| BTC | 99,300.78 | 0.90% | 55.80% | 1,97 T |
| ETH | 3,658.44 | 0.56% | 12.49% | 441,02 B |
| XRP | 2.407 | -0.23% | 3.92% | 138,21 B |
| SOLANA | 215.02 | -0.74% | 2.94% | 103,76 B |
| DOGE | 0.3831 | -1.94% | 1.60% | 56,51 B |
| CARDANO | 1.0818 | -2.30% | 1.08% | 38,03 B |
| TRX | 0.2645 | -0.47% | 0.65% | 22,80 B |
| AVAX | 43.52 | 1.88% | 0.51% | 17,86 B |
| ENLACE | 23.68 | -0.30% | 0.43% | 15,12 B |
| SHIB | 0.00002397 | -0.63% | 0.40% | 14,13 B |
| DOT | 7.716 | 0.18% | 0.34% | 11,86 B |
*Prepared on 1.6.2025 at 07:00 (UTC)
LO QUE QUEDA ATRÁS
Federal Reserve Updates Rotating Voting Committee in 2025
The Fed will welcome four new rotating voting members in 2025: Austan D. Goolsbee (Chicago Fed), Susan M. Collins (Boston Fed), Alberto G. Musalem (St. Louis Fed), and Jeffrey R. Schmid (Kansas City Fed). Their replacements include Thomas I. Barkin (Richmond Fed) and Raphael W. Bostic (Atlanta Fed). According to Bloomberg analysis, the positions of the Federal Open Market Committee (FOMC) could be further dispersed with this change.
Aave’s USDe-Based Governance Proposal Raises Concern
The Aave community is discussing a proposal to link USDe to Tether’s USDT at a 1:1 ratio. According to Protos, although the proposal aims to replace the Chainlink oracle and reduce price volatility, concerns are growing over potential conflicts of interest and divergence risks.
Vitalik Buterin: d/acc and Crypto Technologies Have Important Links
In a blog post about decentralized acceleration (d/acc), Ethereum founder Vitalik Buterin stated that it could expand crypto values. Buterin emphasized that d/acc technology has become a testing ground for crypto communities and serves core values such as censorship resistance.
Artificial Superintelligence Alliance to Burn 5 Million FET Tokens on Enero 10th
The ASI Alliance announced that it will destroy 5 million FET tokens on Enero 10th to increase deflationary pressure in its ecosystem. This move stands out as part of the ASI Train Model plan on the roadmap.
Bitcoin Tracker Update from Michael Saylor: New BTC Buying Coming?
MicroStrategy founder Michael Saylor released a Bitcoin Tracker update for the ninth week in a row. Saylor stated that the images on the website were not working correctly, leading to speculation that there could be a new surge in BTC assets.
Bitcoin Network Transaction Volume Exceeds $19 Trillion in 2024
According to Pierre Rochard, Vice President of Riot Platforms, the trading volume on the Bitcoin network reached over $19 trillion in 2024. This represents an increase of more than double the volume of $8.7 trillion in 2023 and reverses the downtrend of the last two years.
HIGHLIGHTS OF THE DAY
Datos importantes del calendario económico
| Tiempo | Noticias | Expectativa | Anterior |
|---|---|---|---|
| Kaspa (KAS) | 182.23MM Token Unlock | - | - |
| Delysium (AGI) | Podcast Stream | - | - |
| Enjin Coin (ENJ) | Giveaway Event | - | - |
| 14:45 | US Final Services PMI (Dec) | 58.5 | 58.5 |
INFORMATION: The calendar is based on UTC (Coordinated Universal Time) time zone. The economic calendar content on the relevant platform.
INFORMACIÓN:
*El calendario se basa en el huso horario UTC (Tiempo Universal Coordinado). El contenido del calendario económico de la página correspondiente se obtiene de proveedores de noticias y datos fiables. Las noticias del contenido del calendario económico, la fecha y hora del anuncio de la noticia, los posibles cambios en las cifras anteriores, las expectativas y las cifras anunciadas son realizadas por las instituciones proveedoras de datos. Darkex no se hace responsable de los posibles cambios que puedan surgir de situaciones similares.
BRÚJULA DE MERCADO
Global markets started the new week with a mixed outlook ahead of the critical US employment data to be released on Viernes. Apart from the Asia-Pacific stock markets, where rises and falls were observed at the same time, European indices are expected to start the new day with a flat-to-positive start. There is no clear direction in Wall Street futures yet. We can say that the Dola index is also calm. Today, US services PMI data will be under the spotlight of investors.
While the statements from the US Federal Reserve (FED) officials over the weekend contain a message that interest rates will not fall rapidly, on the digital assets front, expectations regarding the policies to be implemented by Trump, who will take over the White House on Enero 20, are more influential on prices. Cryptocurrencies started the week with an upward trend with these expectations, as we expect volumes and pricing behaviors to return to normal. We think that this trend may continue with intermediate breaks during the day.
From the short term to the big picture…
La victoria del expresidente Trump el 5 de noviembre, que era uno de los principales pilares de nuestra expectativa alcista para las perspectivas a largo plazo en los activos digitales, produjo un resultado en línea con nuestras predicciones. Posteriormente, los nombramientos realizados por el presidente electo y las expectativas de una mayor regulación del ecosistema cripto en EEUU continuaron siendo una variable positiva en nuestra ecuación. Aunque se espera que continúe a un ritmo más lento, la señal de la FED de que continuará su ciclo de recortes de los tipos de interés y el volumen en ETF de criptoactivos que indica un aumento del interés de los inversores institucionales (además de las compras de BTC de MicroStrategy, las opciones de ETF de BTC de BlackRock comienzan a cotizar...) respaldan por ahora nuestra previsión alcista para el panorama general. A corto plazo, dada la naturaleza del mercado y el comportamiento de los precios, creemos que no sería sorprendente ver pausas o retrocesos ocasionales en los activos digitales. Sin embargo, llegados a este punto, merece la pena insistir de nuevo en que la dinámica fundamental sigue siendo alcista.
ANÁLISIS TÉCNICO
BTC/USDT
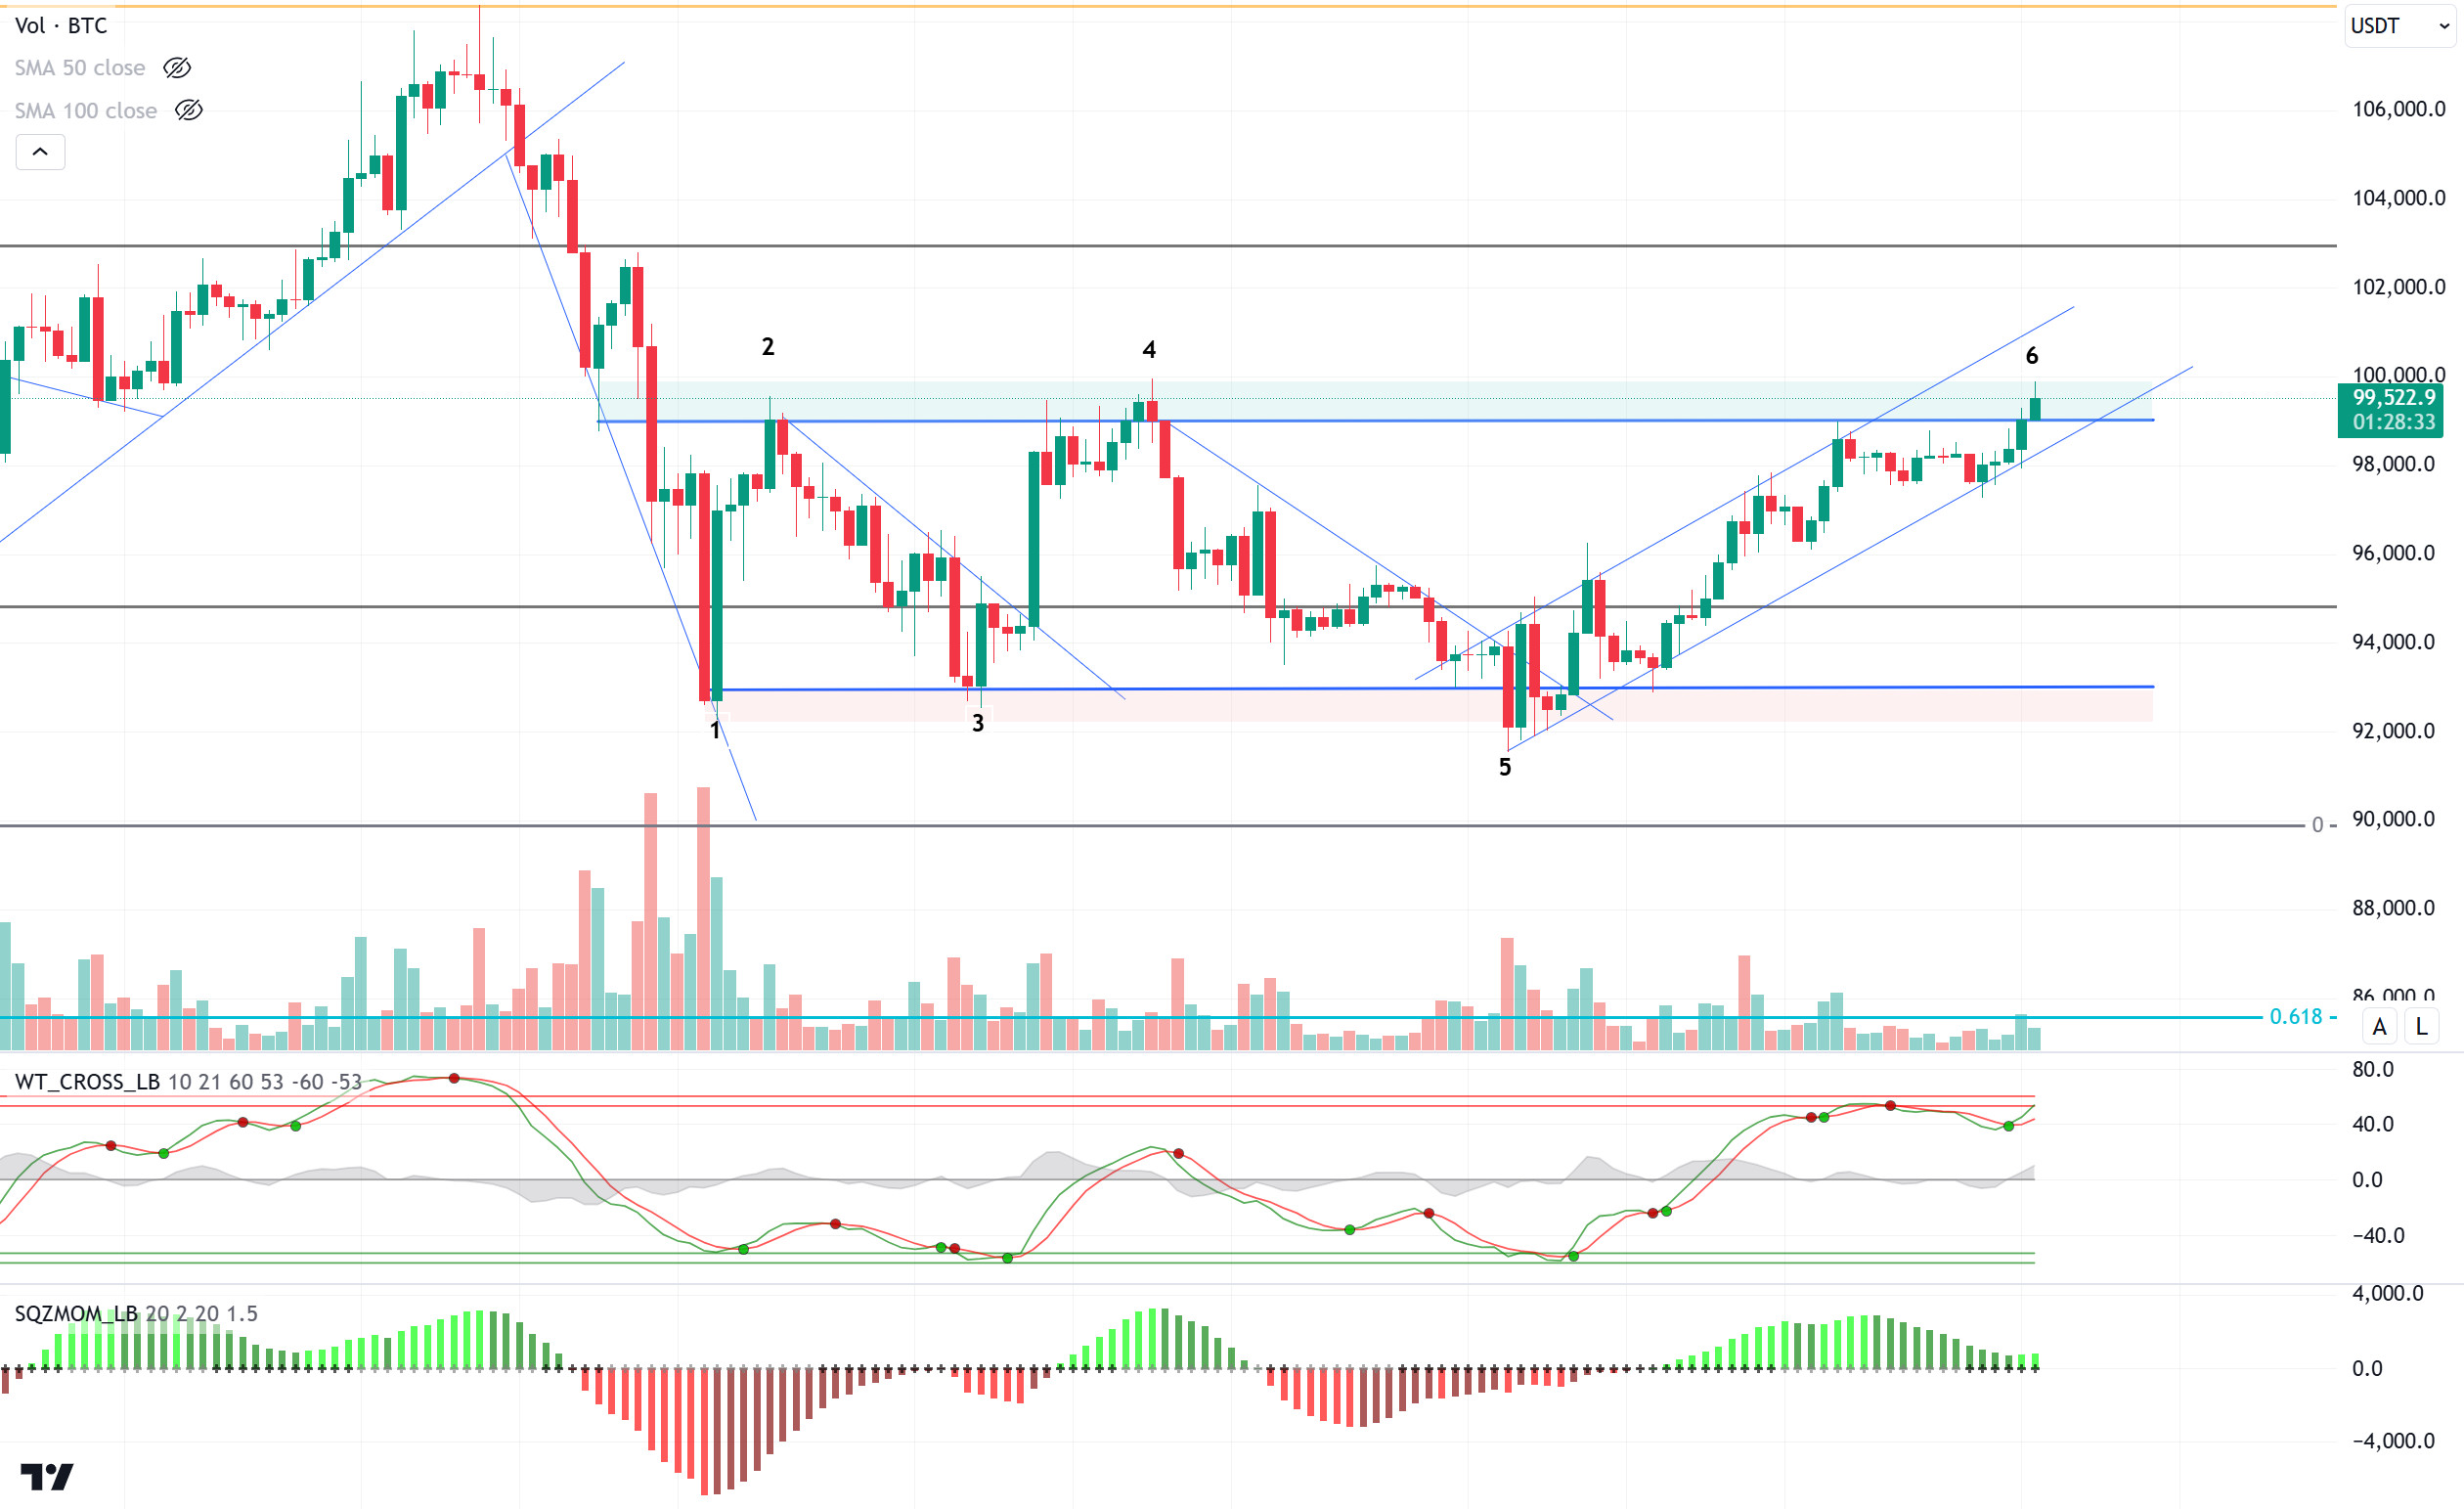
As we start the new week, recovery trends in Bitcoin continue. In addition to the increased risk appetite in the first days of the year, excitement in crypto is increasing ahead of the US presidential inauguration on Enero 20. Indeed, onchain metrics show that US-based institutional investors continue their purchases. In addition, MicroStrategy founder Michael Saylor’s release of the Bitcoin Tracker update for the ninth week in a row is seen as a harbinger of new purchases.
Looking at the technical outlook, BTC, which received support from the 5th point in the rectangle pattern, crossed the 92,800 level and formed an uptrend channel. With the crossing of the major resistance level of 95,000, we see that the rises have accelerated despite the technical oscillators coming to the overbought zone. BTC, which has surpassed intermediate resistance levels, is currently trading at 99,500. BTC, which was previously rejected at levels 2 and 4, turned its direction downwards. If a breakout comes this time, it may bring a rise in BTC price towards the ATH level along with six-digit levels. We see that technical oscillators are giving trading signals in the overbought zone and the weakening momentum indicator is trying to regain strength. In a possible pullback, 98,000 appears as a support point, while its breakdown may disrupt the rising trend channel structure.
Supports 99,100 – 98,000 – 97,200
Resistances 101,400 – 103,800 – 105,000
ETH/USDT
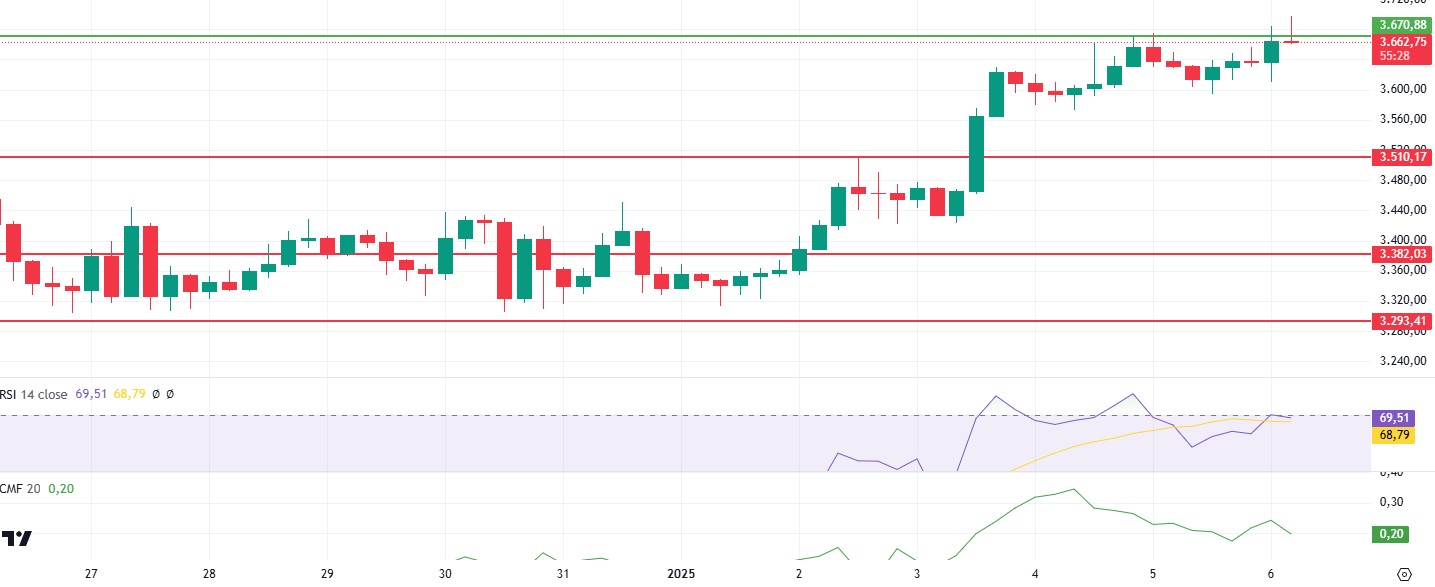
Ethereum continued its uptrend by breaking the 3,510 resistance with a strong volume candle last Viernes and gradually increased over the weekend, entering the new week with a rise to 3,670 levels. However, the sustainability of this rise is questionable in terms of current market dynamics and technical indicators.
According to Cumulative Volume Delta (CVD) data, the uptrend was mainly supported by the futures market, while demand in the spot market remained weaker. This suggests that the current uptrend may remain limited and that spot traders are not sufficiently accompanying the price increase. The RSI indicator has now entered the overbought zone and there a negative divergence in this zone. Chaikin Money Flow (CMF), on the other hand, is not moving in line with the price rise and is forming a negative divergence, suggesting that the net money entering the market is not enough and the rise is not supported.
In order for the price to realize a permanent break above the 3,670 level, it needs to be supported by high volume and the divergences in technical indicators need to be eliminated. If this happens, a continuation of the uptrend may be possible. However, current market data and technical indicators point to the risk of a pullback to 3,510 support during the day or in the evening. Especially low volumes and lack of spot demand increase the probability of this correction
Supports 3,510 – 3,382- 3,293
Resistances 3,670 – 3,841 – 4,001
XRP/USDT
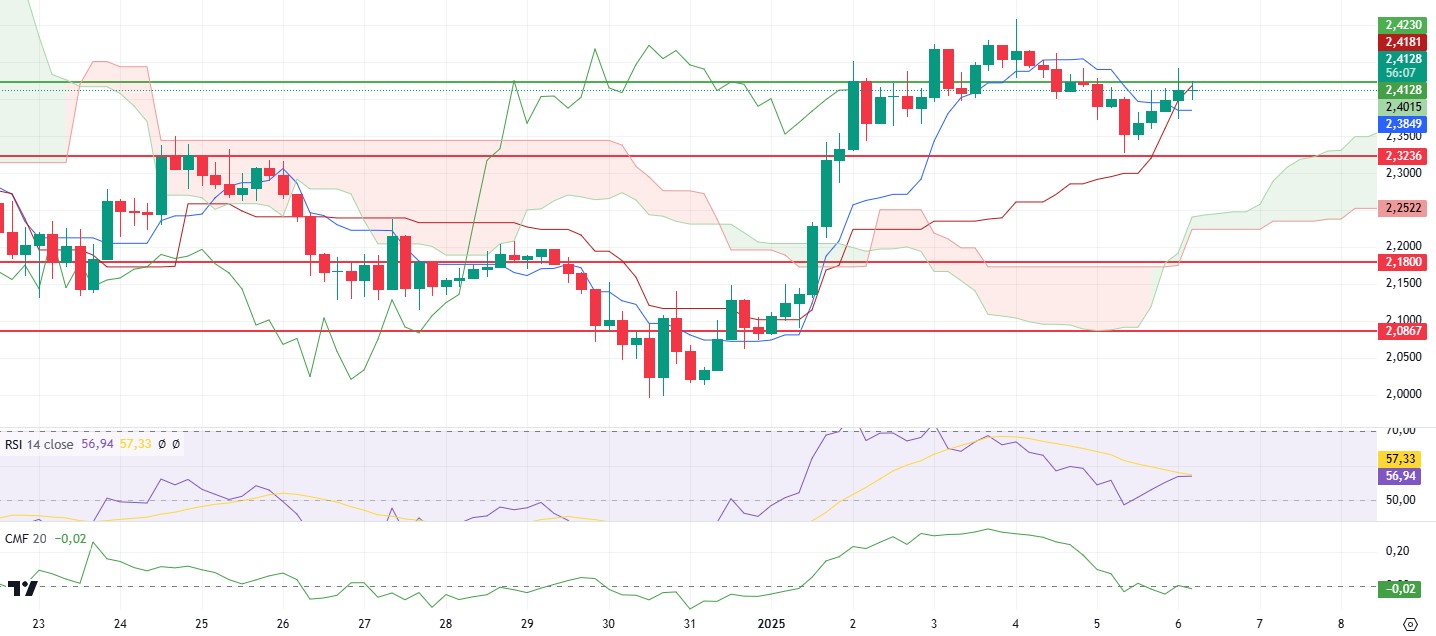
XRP spent the weekend with low volume, losing 2.42 support and falling as low as 2.32. Although it tried to rise above the 2.42 level again by taking a reaction from this support level as of yesterday morning, the price movement has reached a critical decision stage.
Technical indicators reveal that the current situation for XRP is negative. Especially on the Ichimoku indicator, the sell signal formed after the intersection of kijun and tenkan levels indicates that the downward trend may continue. In addition, the weakening in the Chaikin Money Flow (CMF) indicator is noteworthy. The decline in CMF to the negative territory indicates that the inflows to the market are decreasing and selling pressure is gaining weight.
If a permanent breakout above the 2.42 level fails to materialize, the possibility of a pullback in XRP may come to the fore. In this scenario, the price is likely to fall as low as 2.32. The 2.32 level stands out as the first critical support zone where buyers can re-engage. However, if there is no reaction from this level, there is a risk that the selling pressure may increase and push the price to the 2.18 key support level. On the other hand, in case of daily closes above 2.42, the current negative outlook may weaken and the price may be expected to show a slight upward trend. However, in order for this rise to gain a stronger momentum, volume needs to increase and technical indicators need to signal an upward turn.
Supports 2.3236 – 2.1800 – 2.0867
Resistances 2.4230 – 2.6180 – 2.8528
SOL/USDT
Solana developers have created a quantum-resistant vault that uses a decades-old cryptographic technique to protect users’ funds against potential quantum computer attacks. The solution, called Solana Winternitz Vault, implements a hash-based signature system that generates new keys for each transaction. Solana Mobile has announced its intention to launch its second smartphone, Seeker. Scheduled for release later this year, it features a native wallet designed in collaboration with SolFlare.
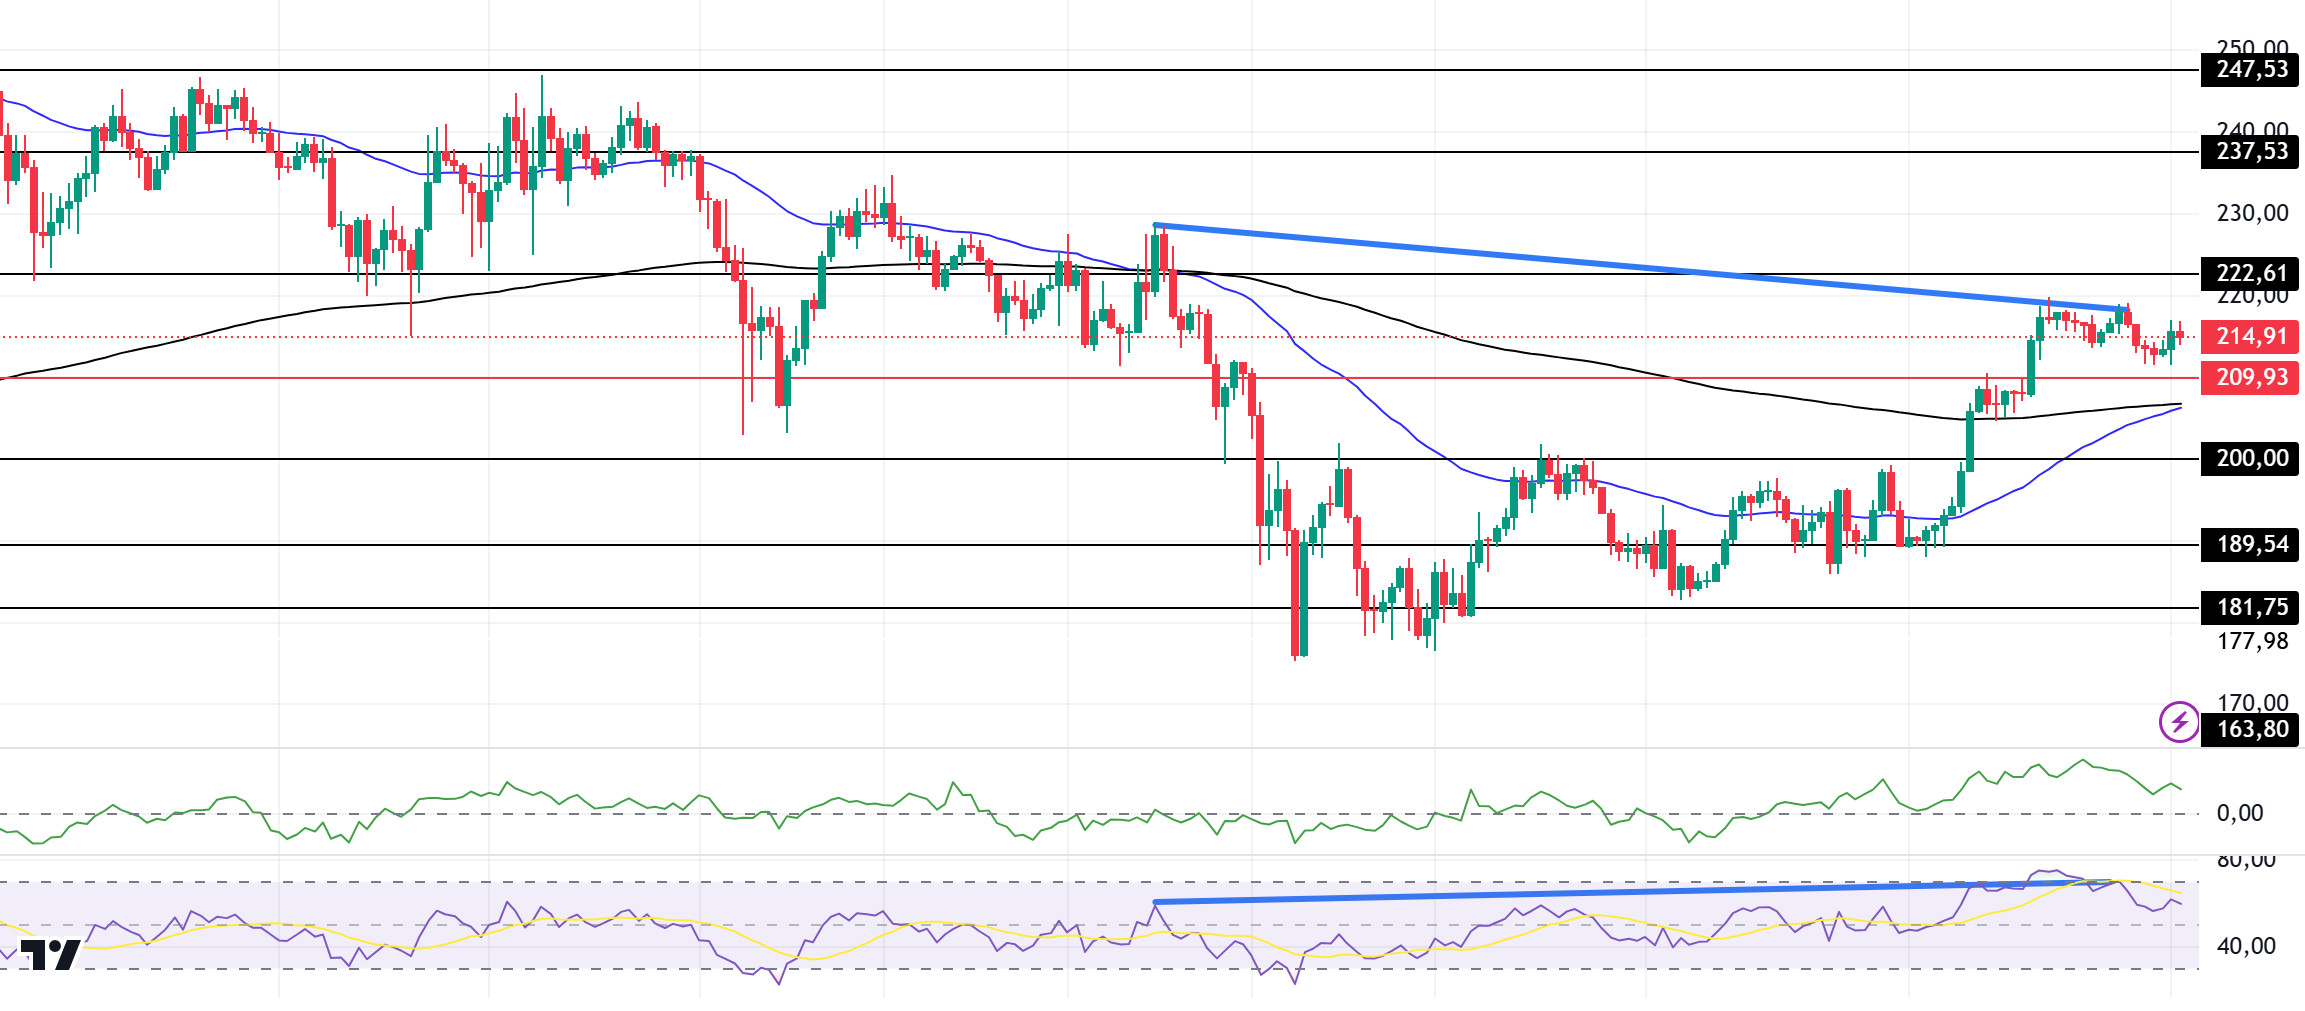
SOL broke the major resistance level of 209.93 with a voluminous candle. On the 4-hour timeframe, the 50 EMA (Blue Line) is about to level with the 200 EMA (Black Line). If the 50 EMA breaks the 200 EMA to the upside, it could start a medium-term uptrend. Chaikin Money Flow (CMF)20 indicator is in positive territory and money outflows seem to have increased. However, the Relative Strength Index (RSI)14 indicator reached the overbought level. At the same time, the bearish mismatch should be taken into account. This may start the decline again. The 247.53 level appears to be a very strong resistance point in the rises driven by both the upcoming macroeconomic data and the news in the Solana ecosystem. If it breaks here, the rise may continue. In case of retracements for the opposite reasons or due to profit sales, the 200.00 support level can be triggered. If the price reaches these support levels, a potential bullish opportunity may arise if momentum increases.
Supports 209.93 – 200.00 – 189.54
Resistances 222.61 – 237.53 – 247.53
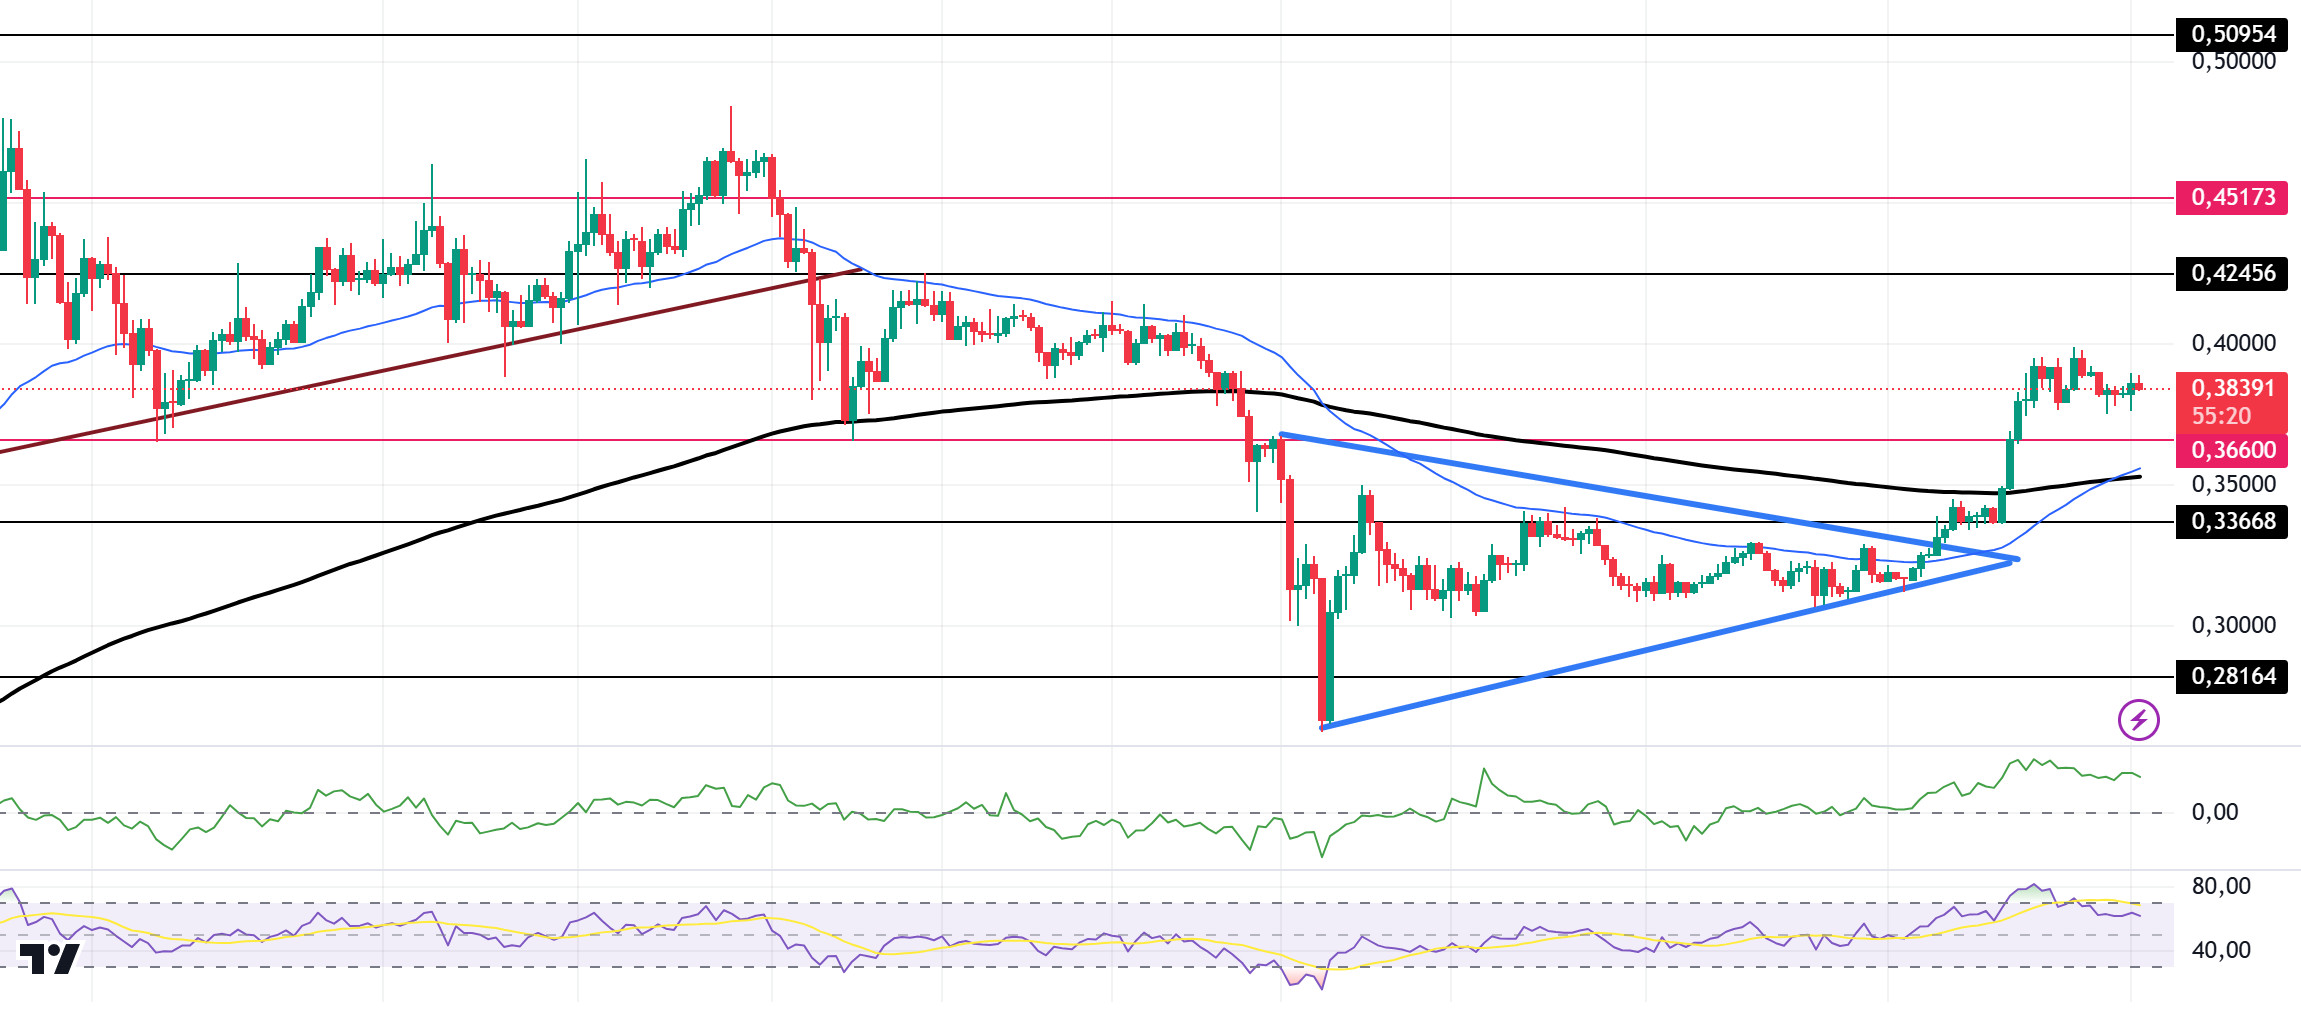
DOGE/USDT
DOGE, the popular and the world’s largest meme coin by market capitalization, broke its two-week-long consolidation streak below an important support level. This breakout and bullish sentiment is thought to be due to the impending inauguration of former United States President Donald Trump, scheduled for Enero 20, 2024. Whale Alert reported that a crypto whale on platform X transferred 400 million units of DOGE worth $144.97 million from a centralized exchange to an unknown wallet. This significant withdrawal was made by a whale while exiting the meme coin consolidation zone. In the last 24 hours, it bought more than 1.08 billion Dogecoins.
When we look at the chart, the asset, which has been moving horizontally since Diciembre 20, gained momentum with the increase in volume and broke both the 0.33668 resistance, which is the ceiling of the horizontal level, and the symmetrical triangle pattern upwards. In the 4-hour timeframe, the 50 EMA (Blue Line) broke the 200 EMA to the upside. This may reinforce the uptrend. When we examine the Chaikin Money Flow (CMF)20 indicator, it is in positive territory and money inflows are also increasing. However, Relative Strength Index (RSI)14 is in the overbought zone. This may cause pullbacks. The 0.42456 level is a very strong resistance point in the rises due to both the upcoming macroeconomic data and the innovations in the Doge coin. If DOGE catches a new momentum and rises above this level, the rise may continue strongly. In case of possible pullbacks due to macroeconomic reasons or negativity in the ecosystem, the 0.33668 level, which is the base level of the trend, is an important support. If the price reaches these support levels, a potential bullish opportunity may arise if momentum increases.
Supports 0.36600 – 0.33668 – 0.28164
Resistances 0.42456 – 0.45173 – 0.50954
AVISO LEGAL
La información sobre inversiones, los comentarios y las recomendaciones que figuran en este documento no constituyen asesoramiento en materia de inversiones. Los servicios de asesoramiento en materia de inversión son prestados individualmente por instituciones autorizadas teniendo en cuenta las preferencias de riesgo y rentabilidad de los particulares. Los comentarios y recomendaciones aquí contenidos son de carácter general. Estas recomendaciones pueden no ser adecuadas para su situación financiera y sus preferencias de riesgo y rentabilidad. Por lo tanto, tomar una decisión de inversión basándose únicamente en la información aquí contenida puede no producir resultados acordes con sus expectativas.