
RESUMEN DEL MERCADO
Latest Situation in Crypto Asset
| Activo | Último precio | 24h Cambio | Dominación | Market Cap |
|---|---|---|---|---|
| BTC | 89,649.84 | 10.71% | 58.93% | 1.77 T |
| ETH | 3,381.83 | 7.67% | 13.52% | 407.17 B |
| SOLANA | 219.69 | 6.02% | 3.45% | 103.98 B |
| DOGE | 0.4047 | 44.83% | 1.98% | 59.50 B |
| XRP | 0.6081 | 5.58% | 1.15% | 34.52 B |
| CARDANO | 0.5963 | 4.02% | 0.70% | 20.91 B |
| SHIB | 0.00002898 | 15.69% | 0.57% | 17.10 B |
| AVAX | 37.07 | 18.86% | 0.50% | 15.14 B |
| TRX | 0.1682 | 2.54% | 0.48% | 14.54 B |
| ENLACE | 14.79 | 7.23% | 0.31% | 9.28 B |
| DOT | 5.527 | 9.57% | 0.28% | 8.38 B |
*Prepared on 11.12.2024 at 06:00 (UTC)
LO QUE QUEDA ATRÁS
Bitcoin, Market Capitalization
As Bitcoin continues to revolutionize the cryptocurrency world, it has now crossed an important threshold in terms of market capitalization, surpassing silver. According to the latest data, Bitcoin’s market capitalization has reached $1.736 trillion, making it the eighth largest asset in the world.
Asset Size of US Spot Bitcoin ETFs
Bloomberg’s senior ETF analyst Eric Balchunas shared the following statement on the X platform: “The asset size of US spot Bitcoin ETFs has now reached $84 billion. This is equivalent to two-thirds of the assets of gold ETFs. They are very likely to surpass gold-backed ETFs before the first anniversary of their launch, exceeding the 3-4 year period we estimate.”
Mt. Gox, Bitcoin Transfers
Bankrupt crypto exchange Mt. Gox transferred 2,500 BTC to two unspecified wallet addresses on Lunes. This latest move, with a total value of $222 million, marks the fifth time Mt. Gox has sent to another address this month.
LO MÁS DESTACADO DEL DÍA
Datos importantes del calendario económico
| Tiempo | Noticias | Expectativa | Anterior |
|---|---|---|---|
| Web3 Summit Berlin 2024 – Berlin, Germany | |||
| 15:00 | Discurso de Waller, miembro del FOMC estadounidense | - | - |
| 15:15 | US FOMC Member Barkin Speaks | - | - |
| 19:00 | US FOMC Member Kashkari Speaks | - | - |
| 22:00 | US FOMC Member Harker Speaks | - | - |
| 22:30 | US FOMC Member Barkin Speaks | - | - |
INFORMACIÓN
*El calendario se basa en el huso horario UTC (Tiempo Universal Coordinado). El contenido del calendario económico de la página correspondiente se obtiene de proveedores de noticias y datos fiables. Las noticias del contenido del calendario económico, la fecha y hora del anuncio de la noticia, los posibles cambios en las cifras anteriores, las expectativas y las cifras anunciadas son realizadas por las instituciones proveedoras de datos. Darkex no se hace responsable de los posibles cambios que puedan surgir de situaciones similares.
BRÚJULA DE MERCADO
In global markets, we continue to monitor the aftermath of the US elections. With Trump’s victory, expectations regarding the policies to be implemented in the coming periods continue to shape prices as investors continue to adjust their positions. While the new President’s attitude towards protecting the US economy accelerates the rise in the dollar index, his previous statements on digital assets pave the way for the Bitcoin-led rally to continue.
In addition to this so-called “Trump Trade”, we see that the institutional audience, which has the opportunity to invest in the digital world through ETFs, continues to be interested in this product. While the rise becomes meaningful with these components of the equation, we do not find such a rapid rise in a short period of time healthy.
Desde el corto plazo hasta el panorama general.
The victory of former President Trump, one of the main pillars of our bullish expectation for the long-term outlook for digital assets, produced a result in line with our forecasts. The continuation of the Fed’s rate-cutting cycle and the inflows into BTC ETFs, indicating an increase in institutional investor interest (plus MicroStrategy’s BTC purchases, Microsoft’s consideration of a purchase, etc.), support our big-picture upside forecast for now.
In the short term, given the nature of the market and pricing behavior, we think it would not be surprising to see some respite or pullbacks in digital assets from time to time. At this point, it is worth reiterating that fundamental dynamics remain bullish. While the continued extension of record highs by Bitcoin, the largest digital currency, may encourage buyers to take new, upside positions, we will watch this group struggle with the masses who may want to take profit realizations. For now, the buyers are winning this battle.
ANÁLISIS TÉCNICO
BTC/USDT
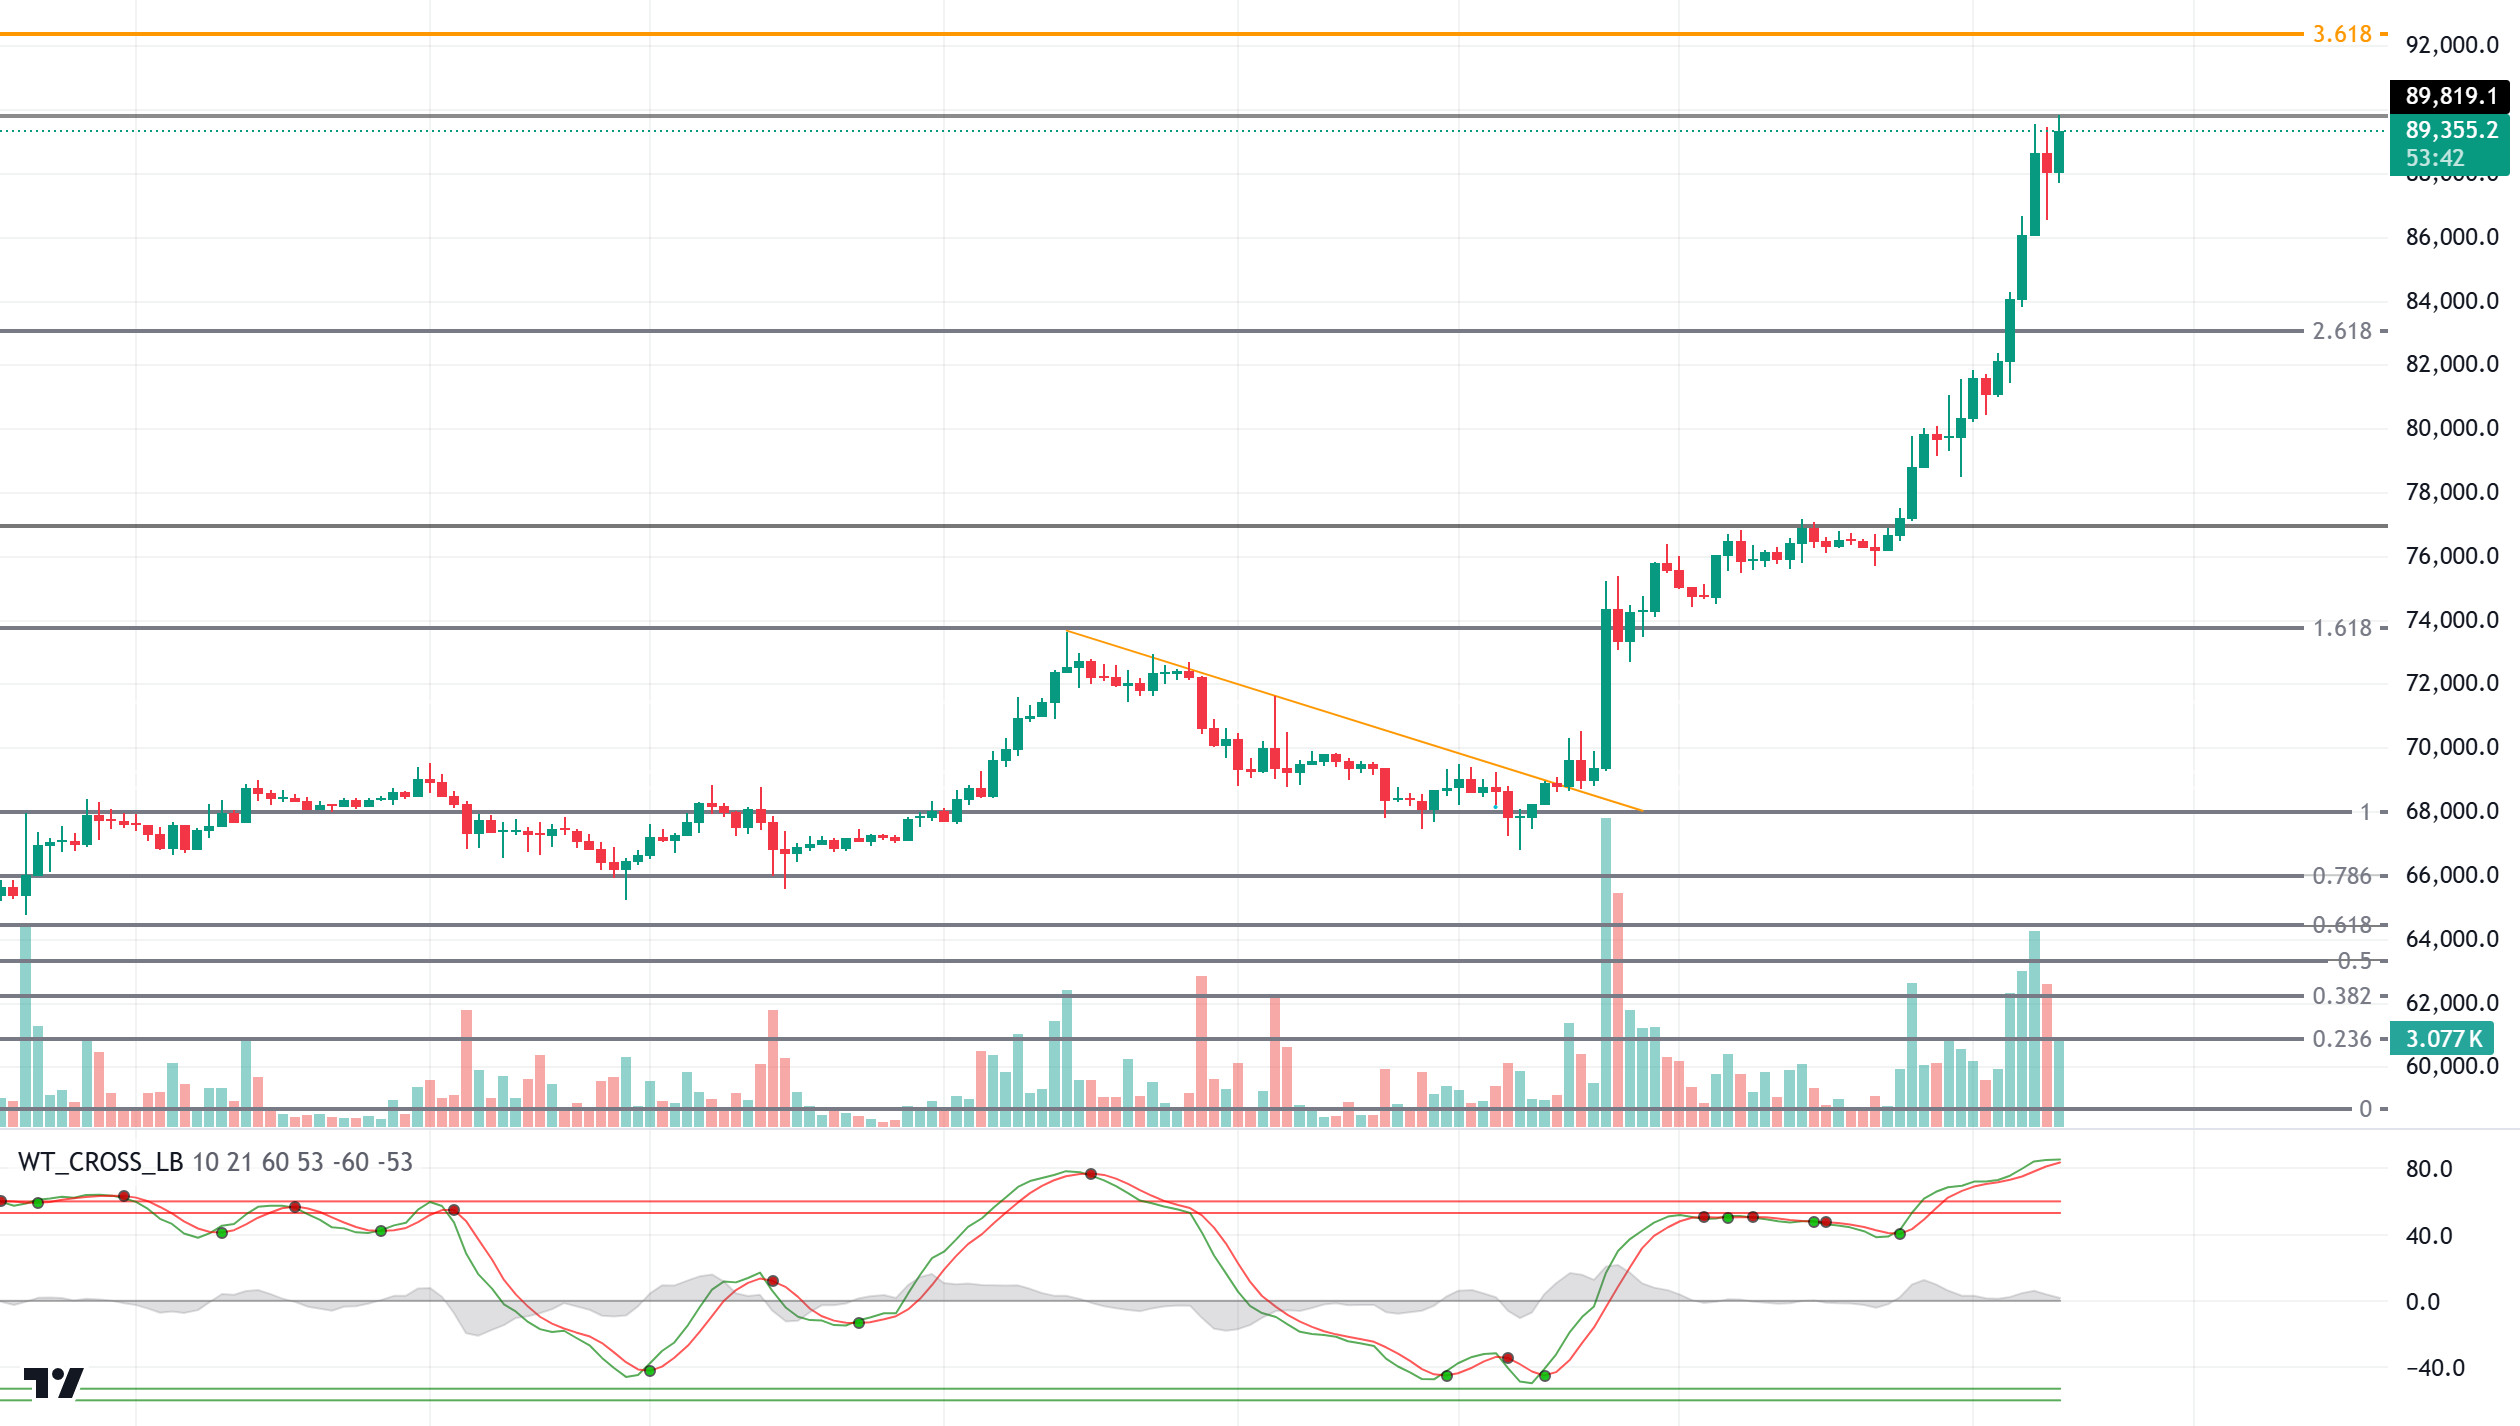
After MicroStrategy, known for its crypto investments, announced the purchase of 27,200 Bitcoins, there was a sharp rise in the leading cryptocurrency. MicroStrategy announced that it bought 27,200 Bitcoins between Octubre 31 and Noviembre 10 at an average price of $74,463, at a total cost of approximately $2.03 billion. With this purchase, MicroStrategy’s total Bitcoin holdings reached 279,420 BTC. The company’s total purchase cost to date is approximately $11.9 billion, with an average purchase price of approximately $42,692.
In the light of all these developments, in the BTC technical outlook, the increased risk business on the market has once again pushed the price to a new record high of 89,819. Now just 11.70% away from the six-digit mark, BTC’s rally is in full swing. The price, which does not face technical resistance, continues to rise with minor corrections from time to time. With fundamental factors overriding technical analysis, sell signals from oscillators are losing their meaning. The price can be expected to enter the respite phase at the psychological resistance points of 90,000 and 95,000 levels. In a possible pullback, 80,000 appears as the first support level.
Supports 85,000 – 80,000 – 78,800
Resistances 92,000 – 95,000 – 100,000
ETH/USDT
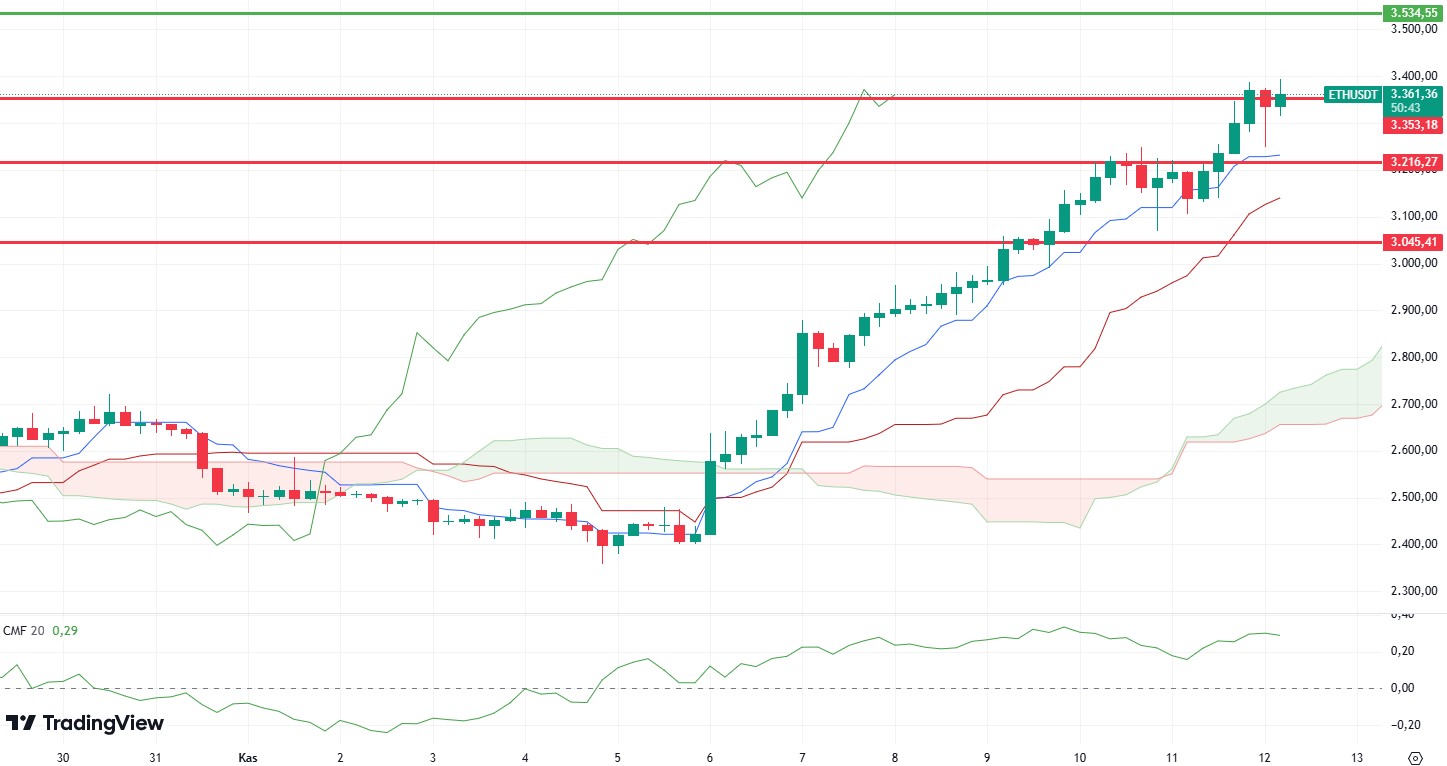
With Bitcoin pushing the $ 90,000 levels, we see that the rise continues for ETH. It is seen that the negative divergence mentioned in yesterday’s evening analysis has also disappeared with this rise. With the break of the 3,353 level, which is one of the important resistance levels, it can be said that the rise may continue during the day. The fact that the Chaikin Money Flow (CMF) value rose to 0.30 again and the venmomentum became positive again can be considered among the factors that strengthen the bullish scenario. At the same time, looking at the Ichimoku indicator, the Chikou level also remains above the 3,353 level, supporting the positive structure, while the rising structure of the kumo cloud in the hourly and daily time interval indicates that the price may go to higher regions for the short to medium term. It can be said that the 3,534 level is the first resistance level we encounter. If the region is exceeded, the rise may continue. If it closes below 3,353, we may see a correction to 3,216.
Supports 3,353 – 3,216 – 3,045
Resistances 3,534 – 3,635 – 3,730
XRP/USDT
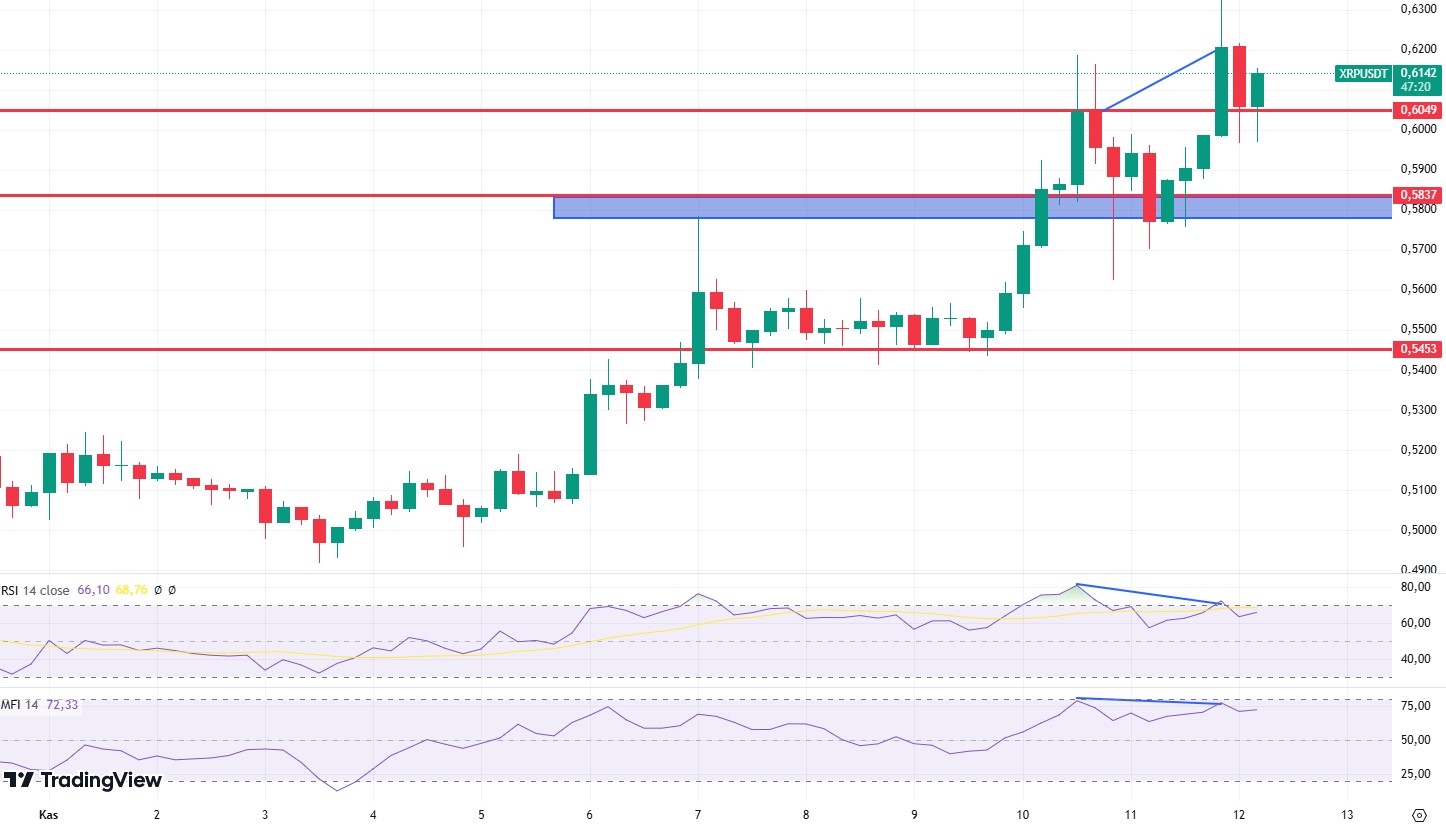
XRP managed to close above 0.6049 last night, gaining the blue zone on the chart. At the same time, it strengthened the bullish scenario by making a re-test to this level. Although we talk about the structural positive outlook, the negative divergences on the Relative Strength Index (RSI) and Money Flow Index (MFI) stand out. In this context, it can be said that some horizontal movement or correction may come in order to eliminate the negative divergences and for the RSI level to move away from the overbought zone. While the loss of 0.6049 may bring declines to the blue box level again, with the increase in momentum, we can see the price rise sharply to 0.6655 levels despite the negative divergences.
Supports 0.6049 – 0.5837 – 0.5453
Resistances 0.6655 – 0.6937 – 0.7430
SOL/USDT
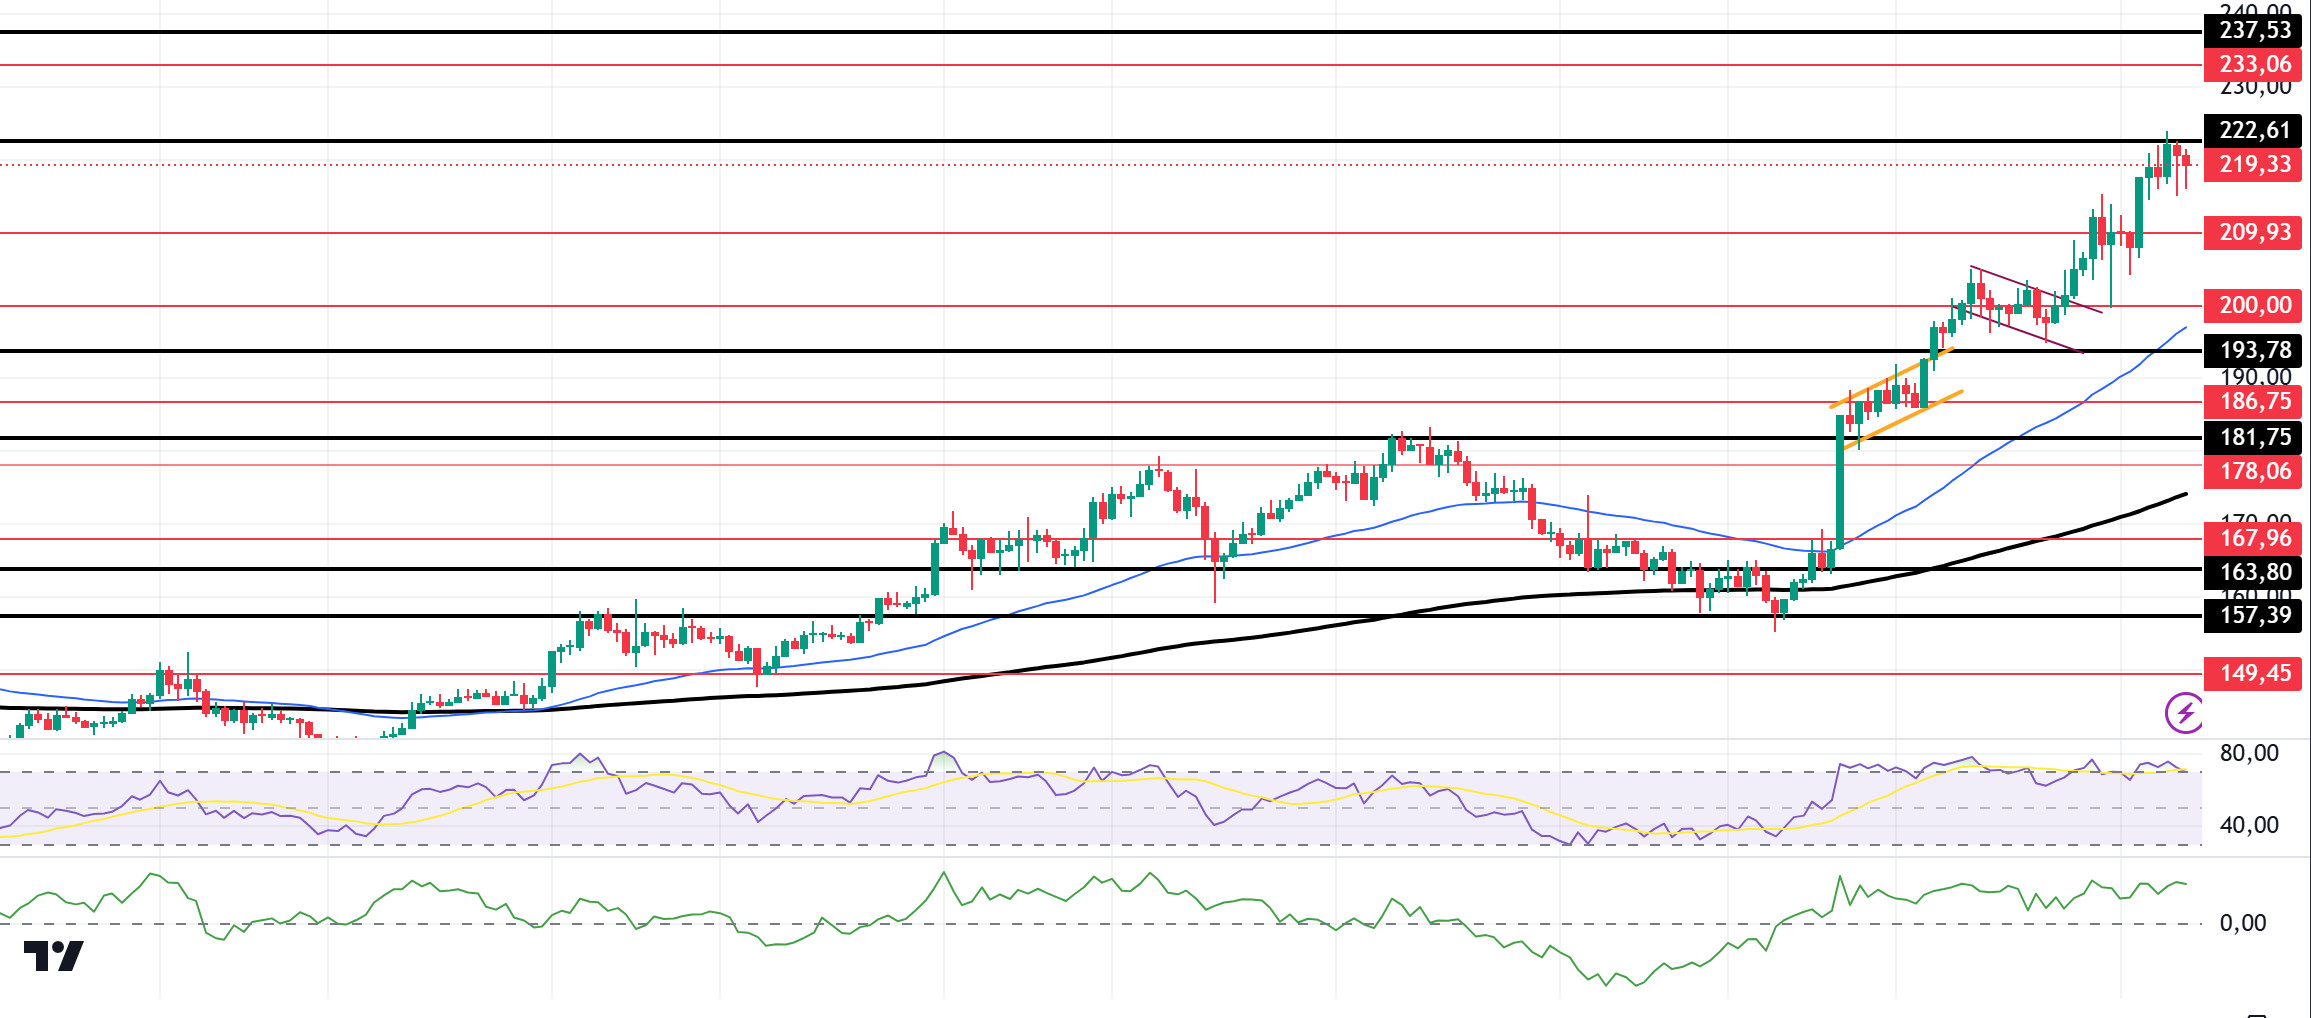
Btc continues to rise by making the ATH of all time. In the Solana ecosystem, at the time of writing, Open Interest data continues to rise, reaching $4.54 billion. The positive funding ratio reinforced the prevailing bullish trend, although the long/short ratio of 0.9029 indicates a slight bearish bias. Meanwhile, the market is set to see an increase in SOL’s supply. According to Tokenomist, 524,030 SOL tokens worth $110.25 million are scheduled to be released in the next seven days. This amount represents approximately 0.11% of Solana’s circulating supply. Technically, SOL has kept pace with the market and kept pace with the rise. It has seen 224.07, the highest level since Marzo. At the same time, it strongly broke the 193.78 level, which we call critical resistance, and ran it as a support level. On the 4-hour timeframe, the 50 EMA (Blue Line) continues to be above the 200 EMA (Black Line). This could mean that the uptrend will continue. However, the gap between the two averages has widened too much to a difference of 13.13%. This could cause pullbacks. At the same time, Relative Strength Index (RSI)14 is in the overbought zone, which may cause profit sales. However, when we examine the Chaikin Money Flow (CMF)20 indicator, although money inflows are positive, inflows have started to decline. The 222.61 level stands out as a very strong resistance point in the uptrend driven by both macroeconomic conditions and innovations in the Solana ecosystem. SOL, which tested here, seems to have lost its momentum. If it rises above this level, the rise may continue strongly. In case of retracements due to possible macroeconomic reasons or profit sales, the support levels of 193.78 and 181.75 can be triggered again. If the price reaches these support levels, a potential bullish opportunity may arise if momentum increases.
Supports 209.93 – 200.00 – 193.78
Resistances 222.61 – 233.06- 237.53
DOGE/USDT
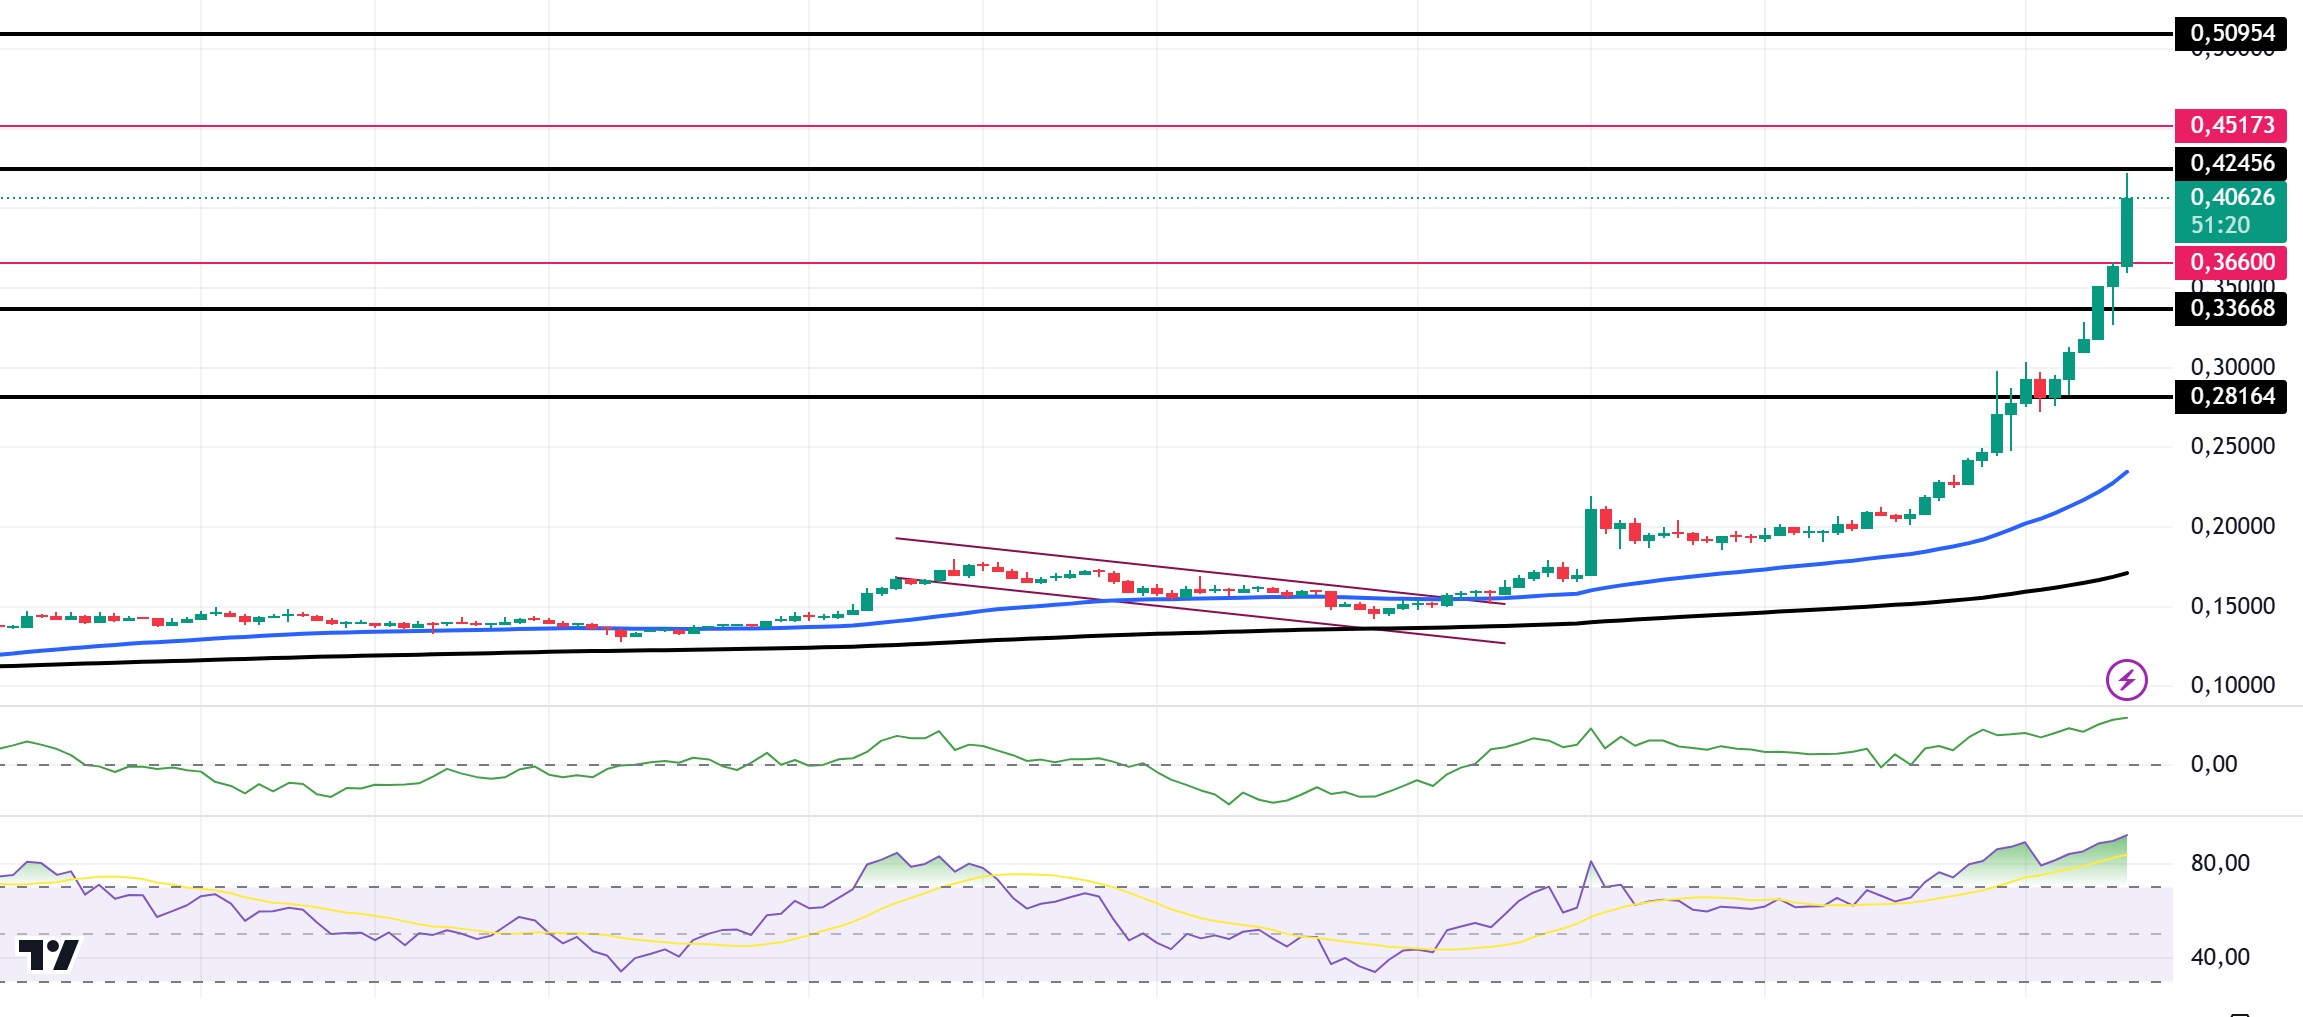
Btc continues to rise making an all-time ATH. Doge’s dramatic rise continues. It has risen 46% in the last 24 hours, reaching its Junio 2021 level again. One of the key reasons for this is that large investors, the so-called “whales”, have been accumulating Dogecoin over the past three months amid increased post-election interest. This has strengthened DOGE’s price against possible pullbacks. As whale holdings approach the one billion threshold, sentiment among this group of investors supports a long-term outlook on Dogecoin’s value. Another data, Open Interest, is at an all-time high. At the time of writing, it was valued at 2.86 billion dollars. Approximately 184 million dollars of short positions have been classified in the last 24 hours. Technically speaking, DOGE has dominated the market. It reached the Junio 2021 level again. At the same time, it strongly broke the 0.33668 level, which we call critical resistance, and deployed it as a support level. In the 4-hour timeframe, the 50 EMA (Blue Line) continues to be above the 200 EMA (Black Line). This could mean that the uptrend will continue. However, the gap between the two averages has widened a lot, creating a difference of 36.54%. This could cause pullbacks. At the same time, the Relative Strength Index (RSI)14 is in the overbought zone, which may cause profit sales. However, when we examine the Chaikin Money Flow (CMF)20 indicator, money inflows are positive, but inflows have started to decline. The 0.42456 level appears to be a very strong resistance point in the rises driven by both macroeconomic conditions and innovations in the Doge coin. If DOGE, which tested here, maintains its momentum and rises above this level, the rise may continue strongly. In case of retracements due to possible macroeconomic reasons or profit sales, the support levels of 0.33668 and 0.28164 can be triggered again. If the price hits these support levels, a potential bullish opportunity may arise if momentum increases.
Supports 0.36600 – 0.33668 – 0.28164
Resistances 0.42456 – 0.45173 – 0.50954
AVISO LEGAL
La información sobre inversiones, los comentarios y las recomendaciones que figuran en este documento no constituyen asesoramiento en materia de inversiones. Los servicios de asesoramiento en materia de inversión son prestados individualmente por instituciones autorizadas teniendo en cuenta las preferencias de riesgo y rentabilidad de los particulares. Los comentarios y recomendaciones aquí contenidos son de carácter general. Estas recomendaciones pueden no ser adecuadas para su situación financiera y sus preferencias de riesgo y rentabilidad. Por lo tanto, tomar una decisión de inversión basándose únicamente en la información aquí contenida puede no producir resultados acordes con sus expectativas.
