
MARKET SUMMARY
Latest Situation in Crypto Assets
| Assets | Last Price | 24h Change | Dominance | Market Cap |
|---|---|---|---|---|
| BTC | 74,561.25 | +8.49% | 59.61% | 1.48 T |
| ETH | 2,594.42 | +6.84% | 12.62% | 312.39 B |
| SOLANA | 186.99 | +15.94% | 3.55% | 87.91 B |
| XRP | 0.5378 | +5.32% | 1.24% | 30.57 B |
| DOGE | 0.2068 | +23.29% | 1.23% | 30.34 B |
| TRX | 0.1628 | +0.29% | 0.57% | 14.07 B |
| CARDANO | 0.3629 | +9.94% | 0.51% | 12.72 B |
| SHIB | 0.00001923 | +9.73% | 0.46% | 11.34 B |
| AVAX | 26.37 | +14.01% | 0.43% | 10.74 B |
| LINK | 11.83 | +13.01% | 0.30% | 7.42 B |
| DOT | 4.101 | +7.79% | 0.25% | 6.22 B |
*Prepared on 11.6.2024 at 06:00 (UTC)
WHAT’S LEFT BEHIND
Bitcoin Breaks Record Amid Expectations of Trump’s Election Victory
As the first results from the US strengthen the odds that Donald Trump will win the presidency, the price of Bitcoin broke a record. The number one cryptocurrency hit 75 thousand dollars. While Donald Trump won the election in two of the critical states, the results are not yet clear in other states. Although the results are not yet finalized, the current data and expectation were enough for Bitcoin to break its all-time record.
HIGHLIGHTS OF THE DAY
Important Economic Calender Data
INFORMATION
*The calendar is based on UTC (Coordinated Universal Time) time zone.
The economic calendar content on the relevant page is obtained from reliable news and data providers. The news in the economic calendar content, the date and time of the announcement of the news, possible changes in the previous, expectations and announced figures are made by the data provider institutions. Darkex cannot be held responsible for possible changes that may arise from similar situations.
MARKET COMPASS
The critical US presidential election, eagerly awaited by global markets and in many ways shaping the coming period, was held yesterday. Millions of Americans went to the polls to decide who will govern the country for the next four years.
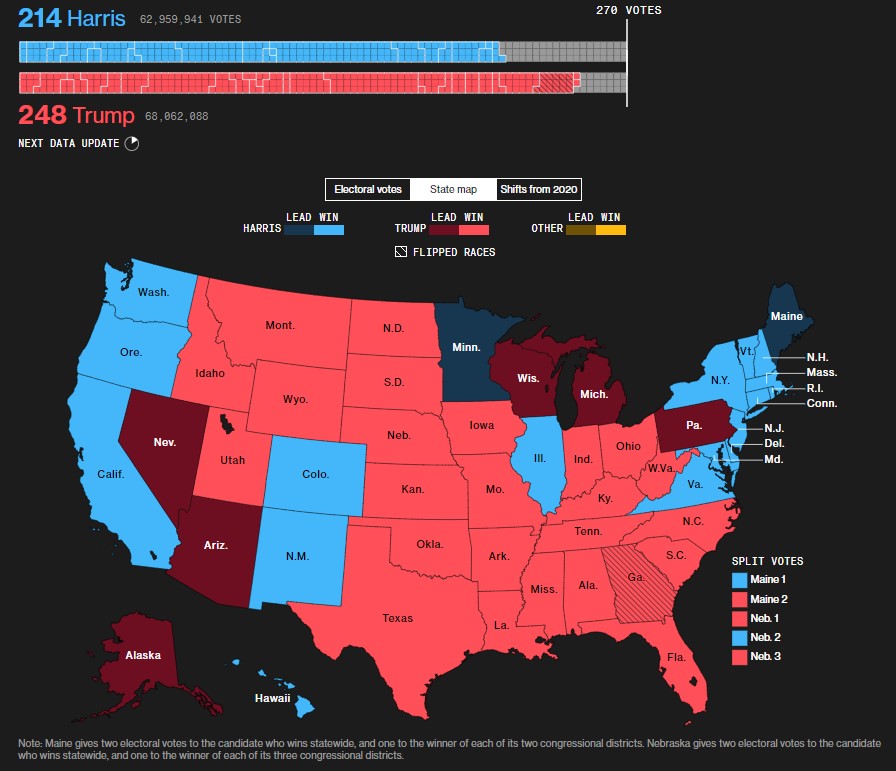
Source: Bloomberg – As of 7:00 A.M. UTC
According to unofficial results, Trump left his rival Harris behind, while Republicans won the majority in the Senate. Digital assets, the dollar and US bond yields rose sharply as former President Trump was seen leading the election. US futures contracts are pointing to the start of the new day with a rise of more than 1% in the indices. Bitcoin has rallied since the first results started to come in (around 69,250) and is up 8.82% at the time of this analysis (75,407).
From the short term to the big picture
The victory of former President Trump (according to unofficial results), which was one of the main pillars of our bullish expectation for the long term perspective in digital assets, produced a result in line with our forecasts. For the short term, given the nature of the market and pricing behavior, we think it would not be surprising to see some respite or retracement in digital assets following this expectation. At this point, it would be useful to underline again that the fundamental dynamics are bullish. While the expansion of the largest digital currency Bitcoin’s record high may encourage buyers to take new, upside positions, we will watch this group struggle with the crowd that may want to take profit realizations. The dose of institutional investor interest in ETFs following the recent rally and post-election statements (Trump is expected to deliver a speech) could be short-term metrics that could continue to drive prices.
TECHNICAL ANALYSIS
BTC/USDT
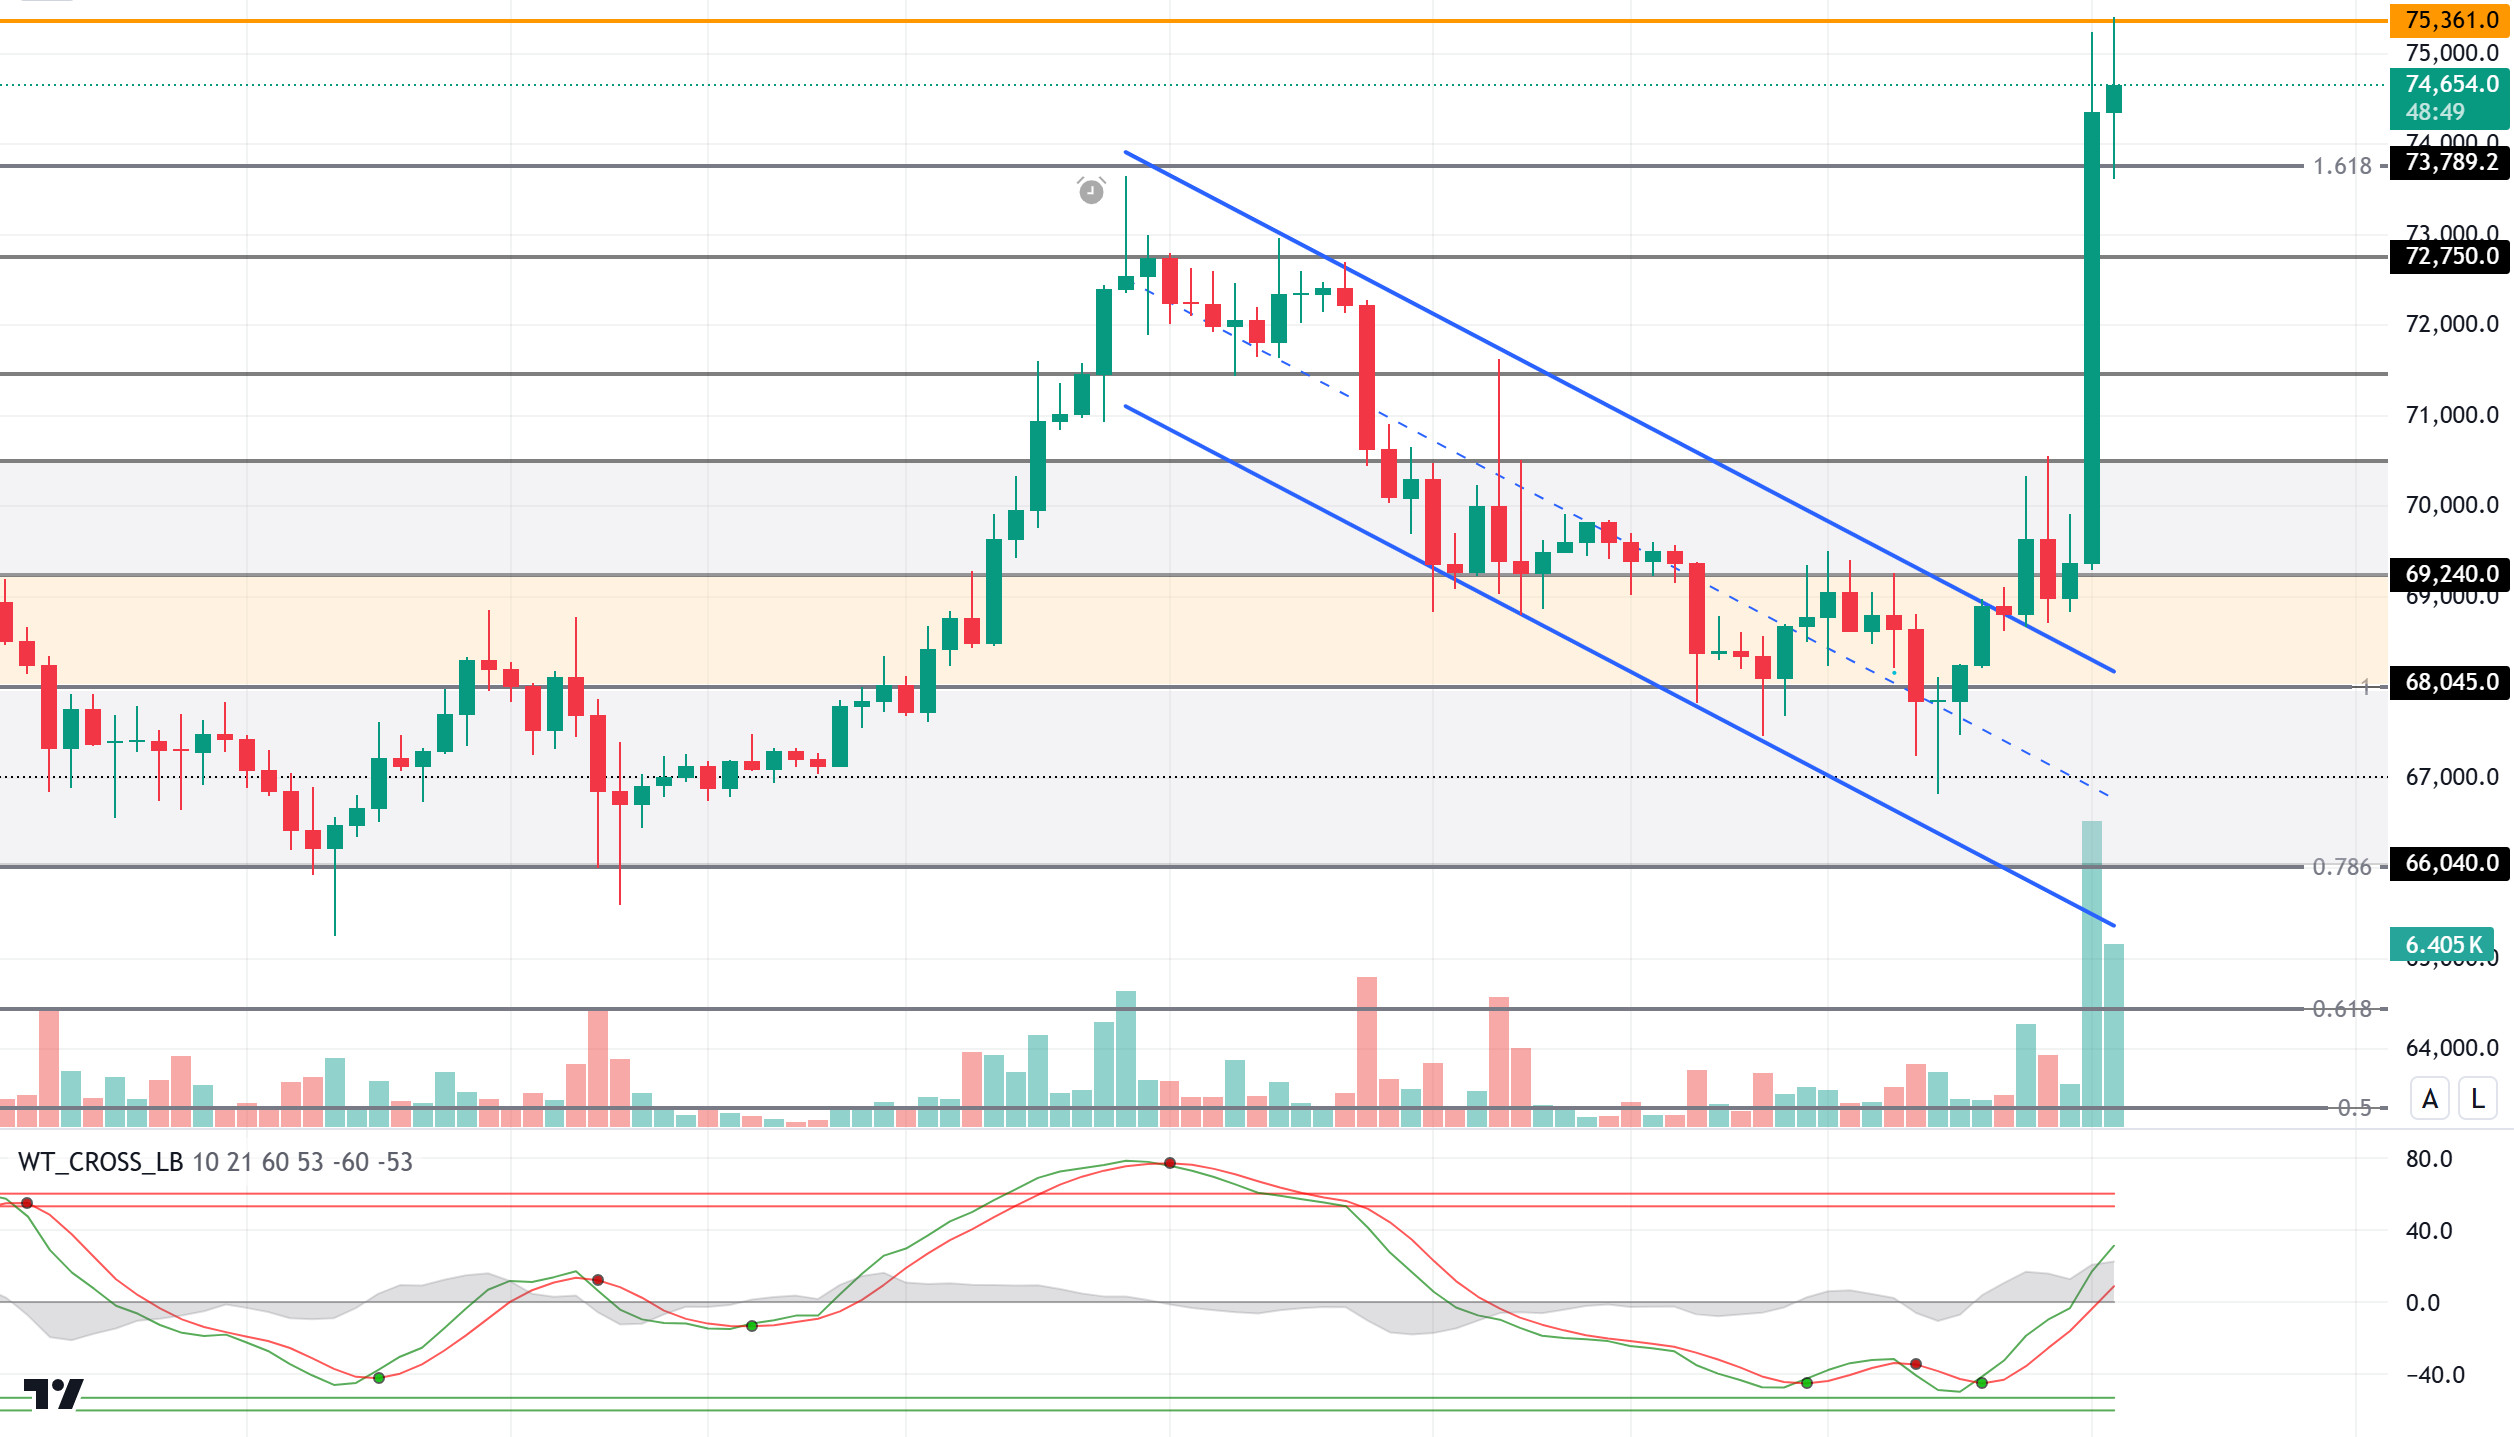
Bitcoin reached an all-time high (ATH) of 75,361. According to the election results, which have not yet been finalized, D. Trump’s victory in critical states was enough to see a new peak in the Bitcoin price. The final election results and the statements to be made by the new US president will play a critical role for new peak attempts during the day.
When we look at the BTC technical outlook, with the break of the falling trend channel, which we mentioned in our previous analyzes, the price first settled above the 69,250 resistance level, which brought the upward hard break with the desired movement of the election situation. In the next process, resistance levels in the technical analysis chart will be determined by psychological factors. BTC, which is currently moving at 75,000, may test the Fibonacci 2.618 (83,060) level in case of a new peak. Since the volatility expectation is still high in the market, we can follow the level of 73,789 and then 72,750 as the first support level in the retreat.
Supports 73,789 – 72,750 – 71,460
Resistances 75,361- 83,060
ETH/USDT
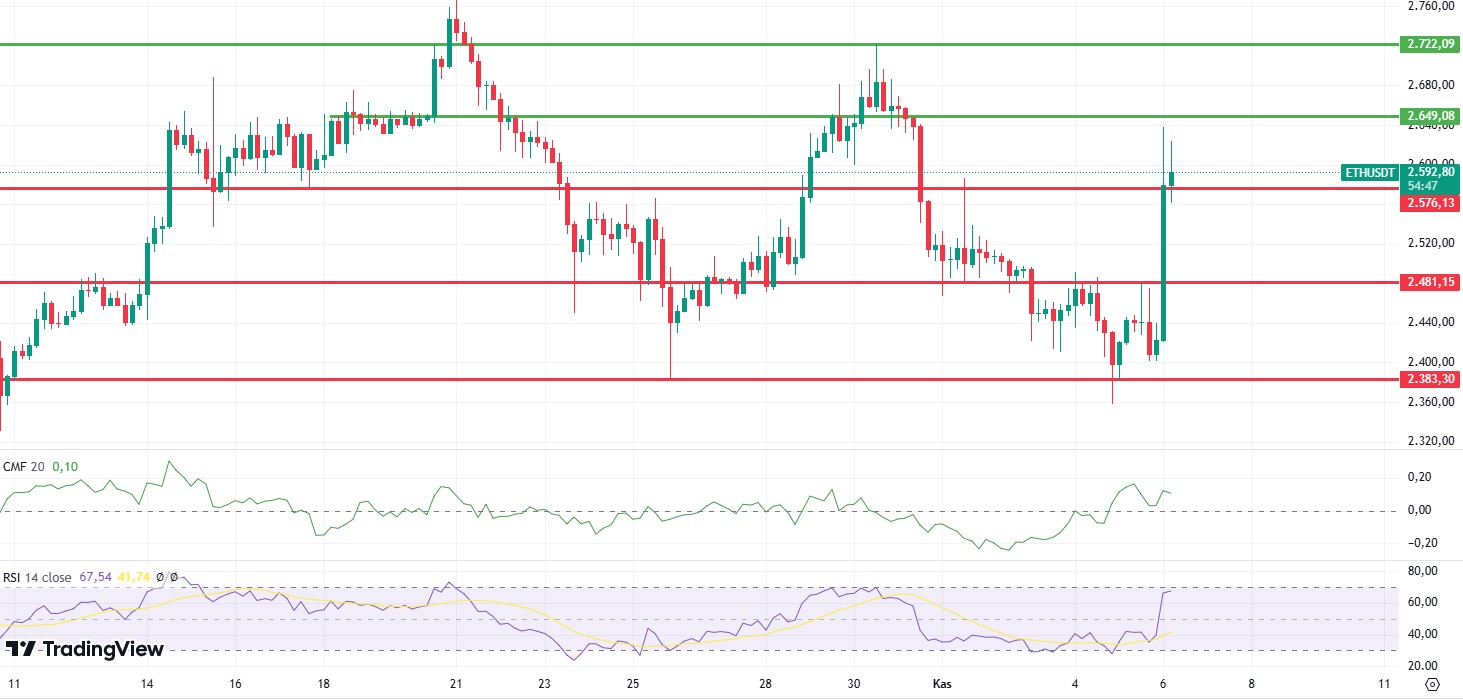
With the US presidential election in favor of Trump, the cryptocurrency market has seen sharp rises. ETH broke the 2,576 main resistance level with this rise. It can be said that volatility may increase as the winner of the election is announced during the day. The Relative Strength Index (RSI) level also rose sharply to the overbought zone. At the same time, the price rising above the kumo cloud can be interpreted as positive. With the negative divergence in Chaikin Money Flow (CMF) disappearing and turning positive again, if ETH can hold above the 2,576 level, further increases can be seen. If a break below this level comes, the correction movement may begin.
Supports 2,576 – 2,481 – 2,383
Resistances 2,649 – 2,722 – 2,822
LINK/USDT
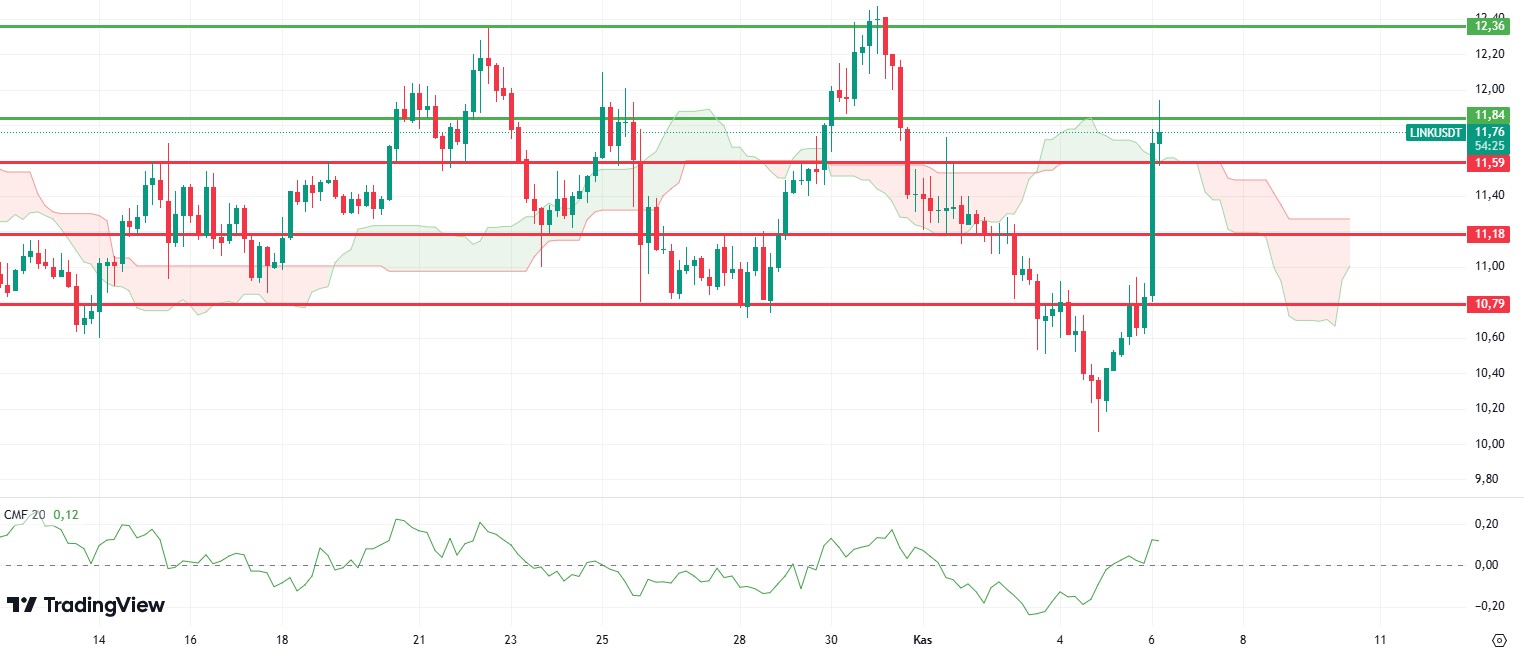
LINK also continued to rise with the market and reached 11.84 resistance. It is seen that the negative structures on Chaikin Money Flow (CMF) and Relative Strength Index (RSI) have broken down and a positive outlook has emerged. Volume and momentum data also support the rise. Exceeding the 11.84 level may quickly lead to rises up to 12.36 resistance. However, the break of the 11.59 level, which is the kumo cloud support, may disrupt the positive outlook and cause correction movements.
Supports 11.59 – 11.18 – 10.79
Resistances 11.84 – 12.36 – 12.98
SOL/USDT
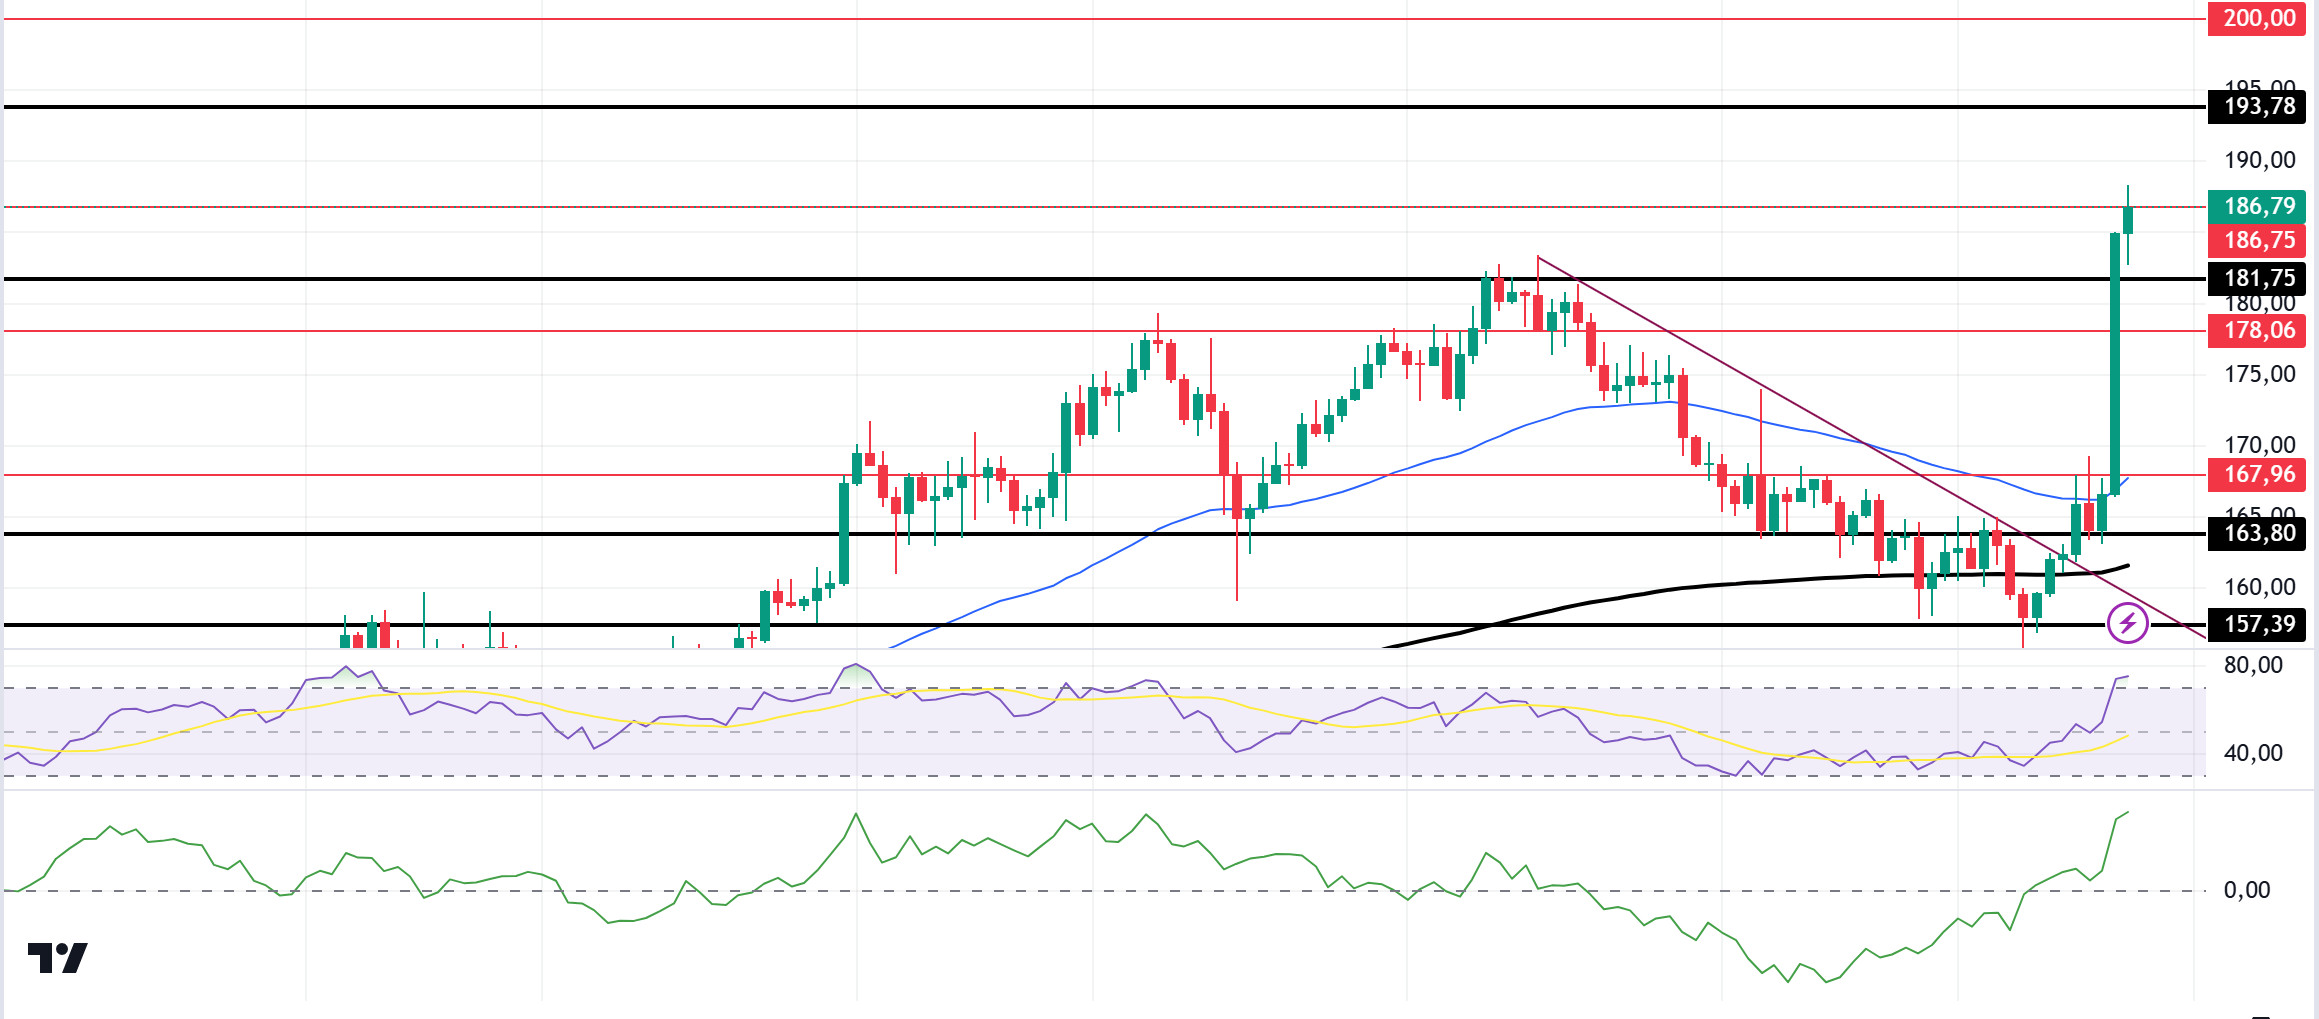
Trump seems to have taken the lead in the US elections. At the time of writing, Trump is leading the race against Kamala with 246 to 189 in the polls opened so far. The cryptocurrency market reacted very positively to these unofficial results, increasing by 8.49% since yesterday, reaching a market capitalization of 2.43 trillion. In the Solana ecosystem, the long-to-short ratio is currently at a two-week high of 1.0881. Indeed, SOL recently experienced a significant increase in on-chain transfer volume, reaching a peak of around $224 billion in just one day. Technically, SOL has moved upwards from the area where it has been consolidating for about 4 months by breaking strongly 181.75, which we call critical resistance. In the 4-hour timeframe, the 50 EMA (Blue Line) continues to be above the 200 EMA (Black Line). This may mean that the uptrend will continue. Relative Strength Index (RSI)14 is in the overbought zone, which may bring profit sales. At the same time, when we analyze the Chaikin Money Flow (CMF)20 indicator, we can say that money inflows are very intense. The 193.78 level stands out as a very strong resistance point in the rises driven by both macroeconomic conditions and innovations in the Solana ecosystem. If it rises above this level, the rise may continue strongly. In case of retracements due to possible political reasons or profit sales, the 181.75 support level may be triggered again. If the price hits this support level, momentum may increase and a potential bullish opportunity may arise.
Supports 181.75 – 178.06 – 167.96
Resistances 186.75 – 193.78 – 200.00
ADA/USDT
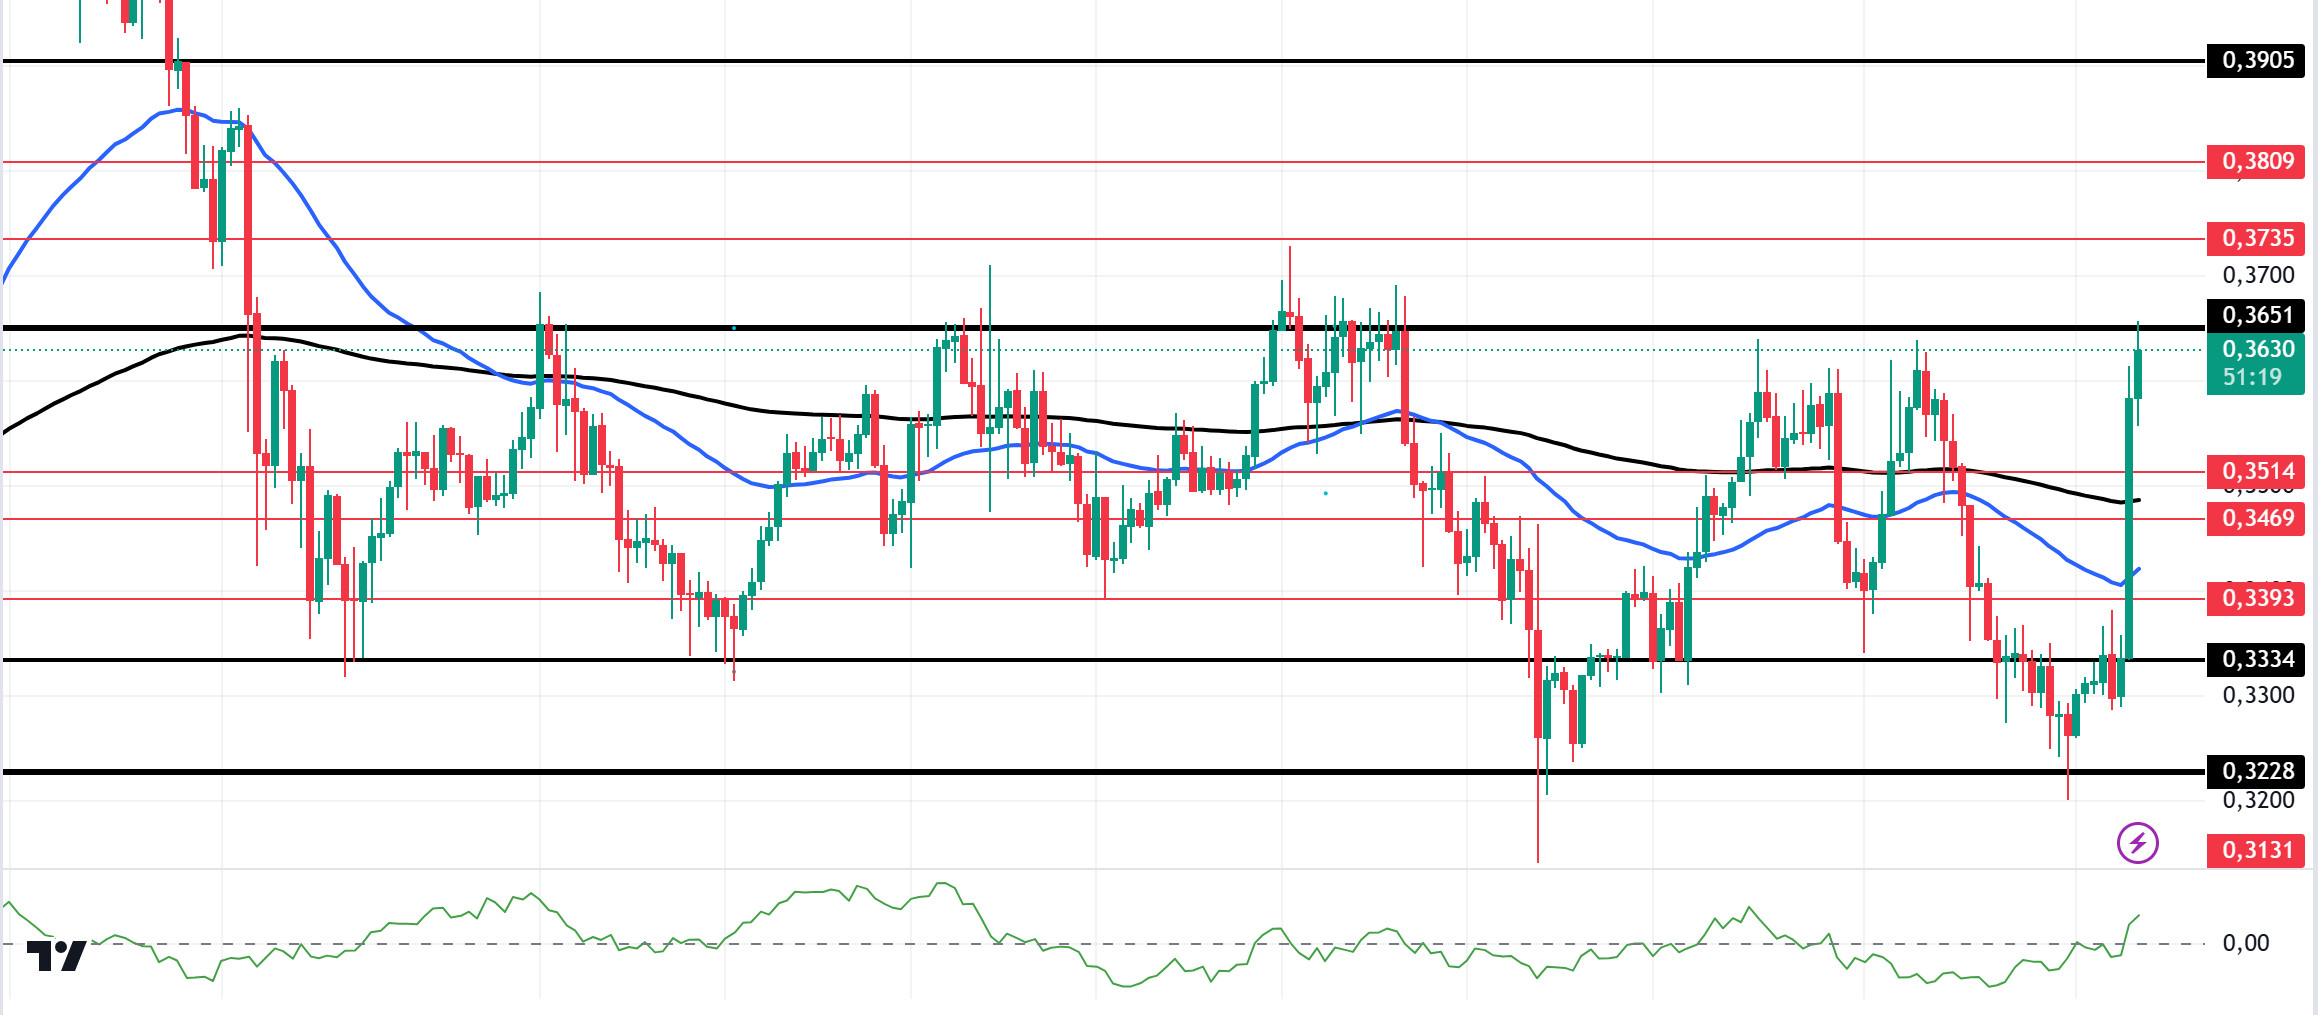
Trump seems to have taken the lead in the US elections. At the time of writing, Trump is leading the race against Kamala with 246 to 189 in the polls opened so far. The cryptocurrency market reacted very positively to these unofficial results, increasing by 8.49% since yesterday, reaching a market capitalization of 2.43 trillion. In the Cardano ecosystem, it continues to prepare for the second phase of Chang, a crucial upgrade designed to implement the latest features of minimum viable on-chain governance. Meanwhile, Plutus scripts increased by 3,358 to a total of 91,698. The total number of transactions increased by 0.98 million compared to last month, reaching a total of 97.92 million. On the other hand, according to IntoTheBlock’s data, the number of major holders controlling at least one percent of the ADA supply saw a significant drop in whale flows. Currently, this metric appears to be negative for the altcoin, which has fallen by 1181.52% in the last week. Technically, ADA, which has continued to accumulate since October 1, is pricing above the 50 EMA (Blue Line) and 200 EMA (Black Line) on the 4-hour chart. However, the 50 EMA continues to hover below the 200 EMA. Although this shows us that the trend is bearish, the convergence of the moving averages shows us that the bearish trend is decreasing. At the same time, when we examine the Chaikin Money Flow (CMF)20 indicator, we can say that money flows are increasing by moving into the positive zone. Considering all this, ADA tested the 0.3651 level once again. The support level of 0.3334 should be followed in the decline that will be experienced due to the macroeconomic data and negativities in the ecosystem or in the retracements brought by profit sales. It may be appropriate to buy when it comes to this price level. In the rises caused by macroeconomic data or developments in the ecosystem, the 0.3651 level should be followed. If it breaks this level, the rise may strengthen.
Supports 0.3228 – 0.3131 – 0.3064
Resistances 0.3334 – 0.3393 – 0.3469
AVAX/USDT
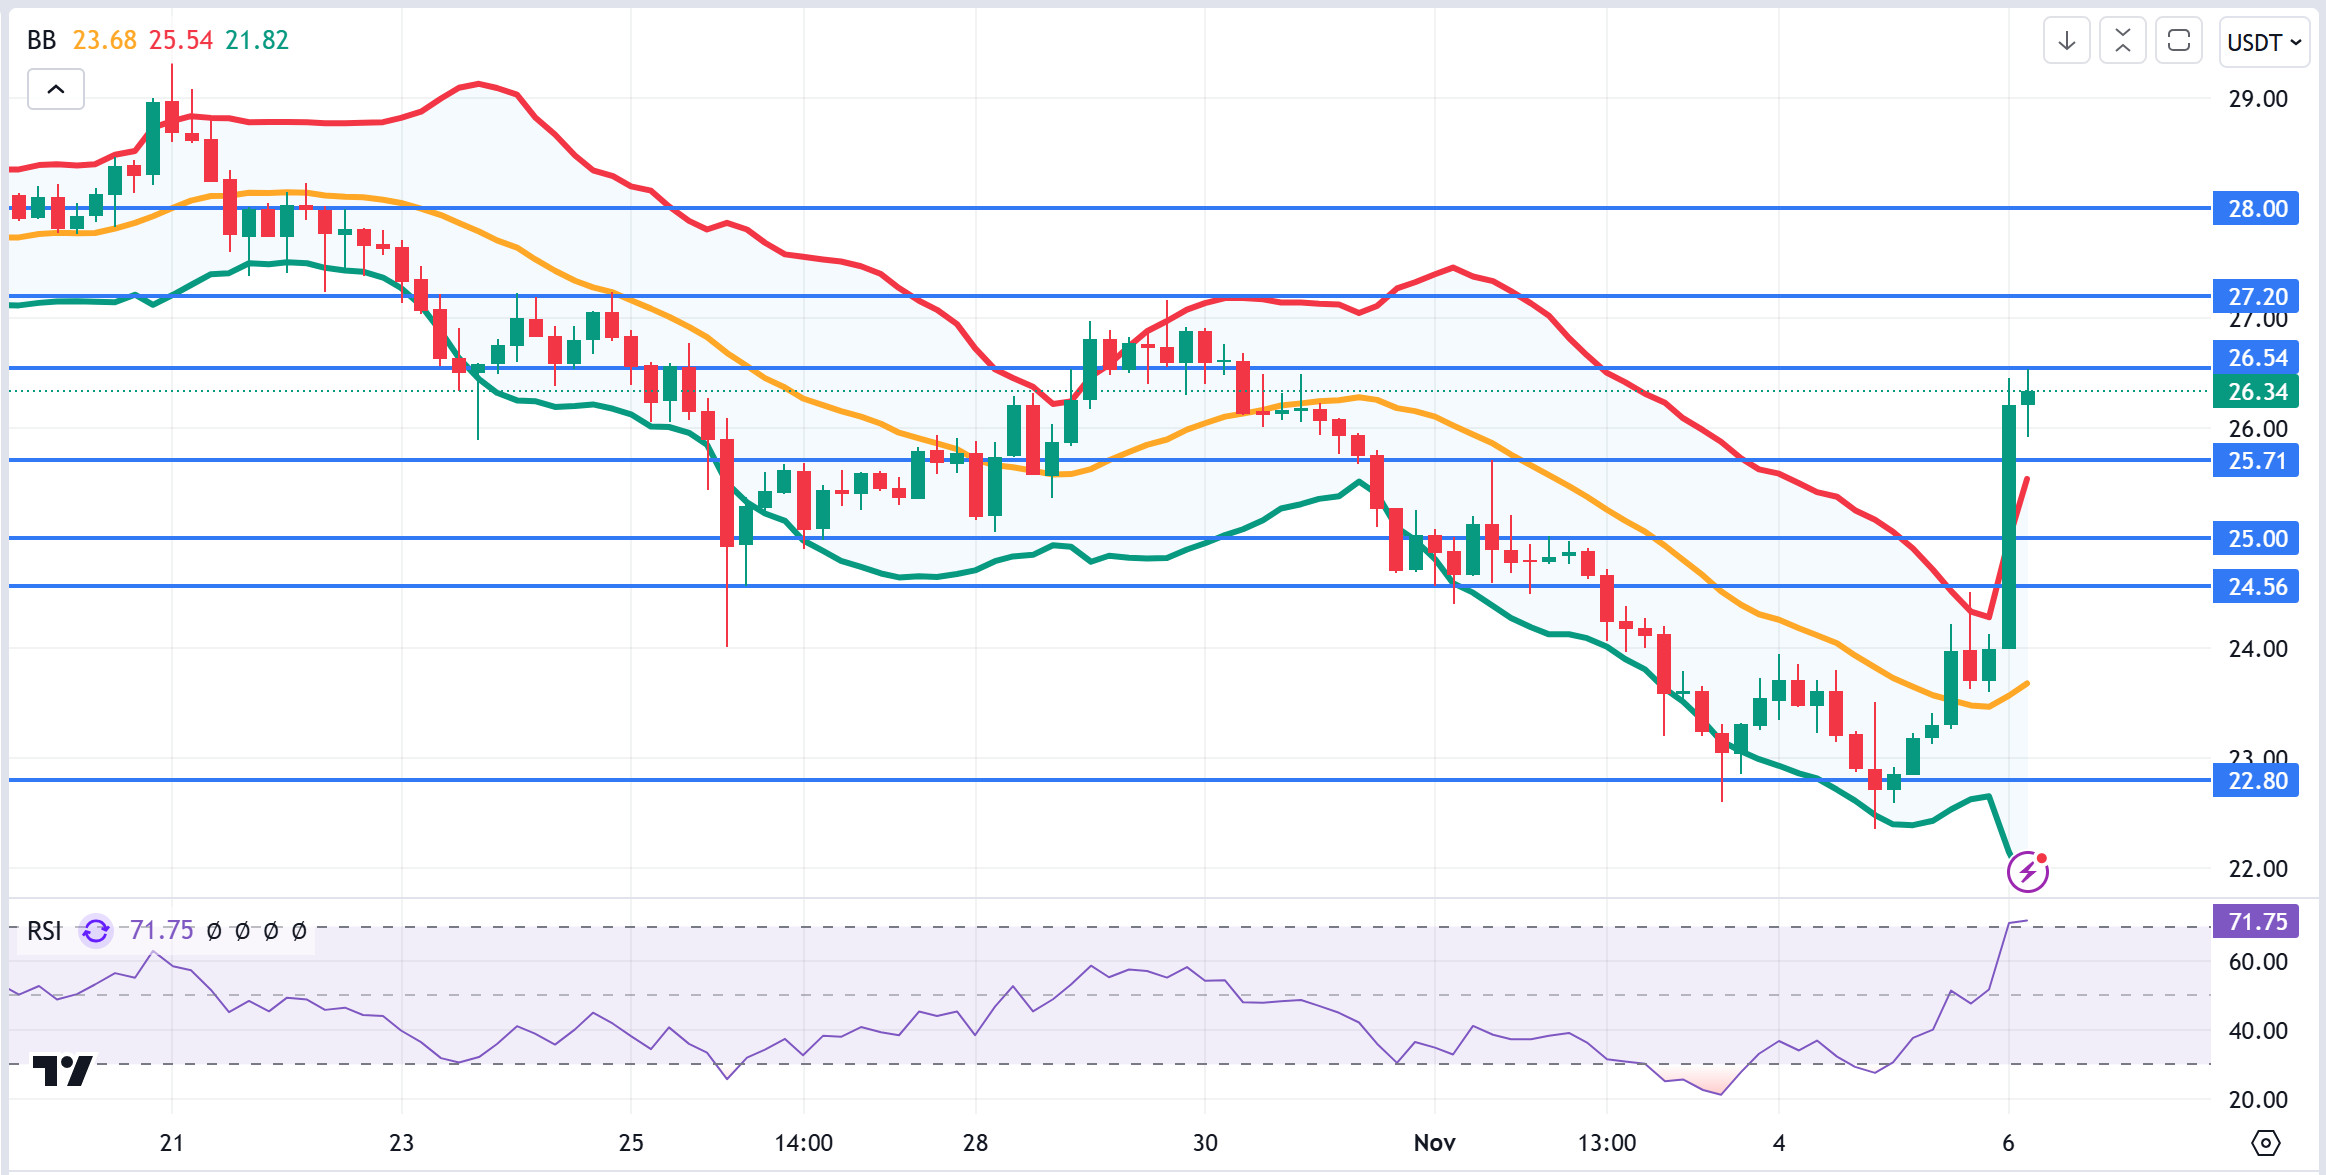
AVAX, which opened yesterday at 22.72, rose about 5% during the day and closed the day at 23.99. Today we will start to see the results of the US presidential elections and volatility can be expected to be high. News flows from the Middle East will be important for the market.
AVAX, which continues to rise with Trump leading the election race, is currently trading at 26.34. On the 4-hour chart, Bollinger is in the upper band and the Relative Strength Index value has reached the overbought level with 71. Some decline can be expected from these levels. In such a case, it may test the supports of 25.71 and 25.00. On the other hand, as Trump’s win becomes certain, the buying reaction by the market may increase. In such a case, it may test the 27.20 and 28.00 resistances. As long as it stays above 22.80 support during the day, the desire to rise may continue. With the break of 22.80 support, sales may increase.
Supports 25.71 – 25.00 – 24.56
Resistances 26.54 – 27.20 – 28.00
TRX/USDT
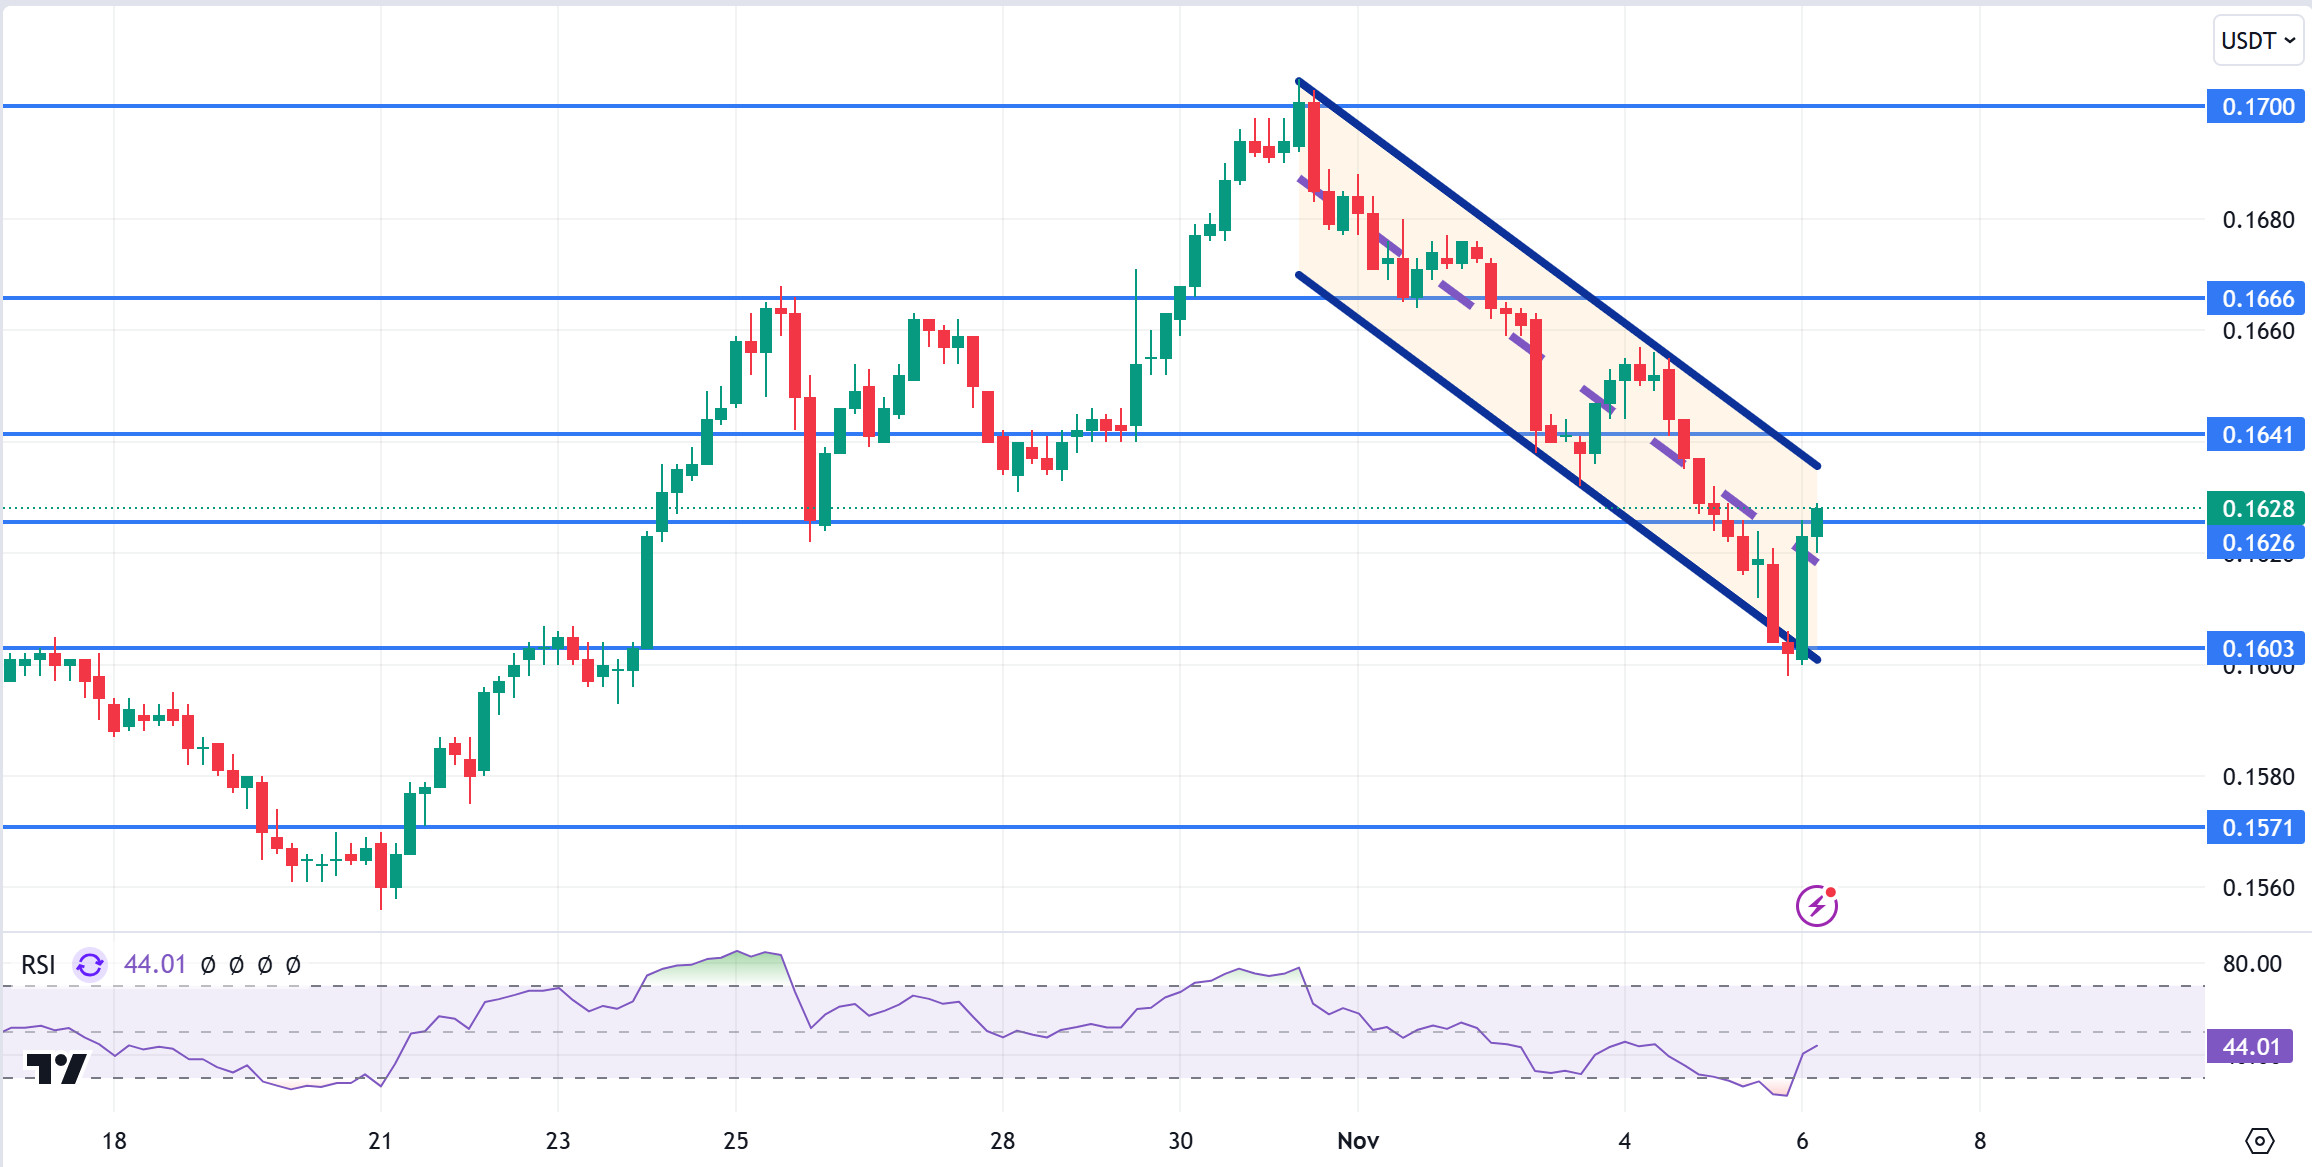
TRX, which started yesterday at 0.1629, fell about 1.5% during the day and closed the day at 0.1602. Today, the market will be closely following the results of the presidential elections in the US and the news flows regarding the tension in the Middle East.
TRX, currently trading at 0.1628, is in the middle band of the bearish channel on the 4-hour chart. Relative Strength Index value is 44 and it can be expected to rise slightly from its current level. In such a case, it may move to the upper band of the channel and test the 0.1641 resistance. However, if it cannot close the candle above 0.1641 resistance, it may test 0.1603 support with the sales reaction that may occur. As long as TRX stays above 0.1482 support, the desire to rise may continue. If this support is broken downwards, sales can be expected to increase.
Supports 0.1626 – 0.1603 – 0.1571
Resistances 0.1641 – 0.1666 – 0.1700
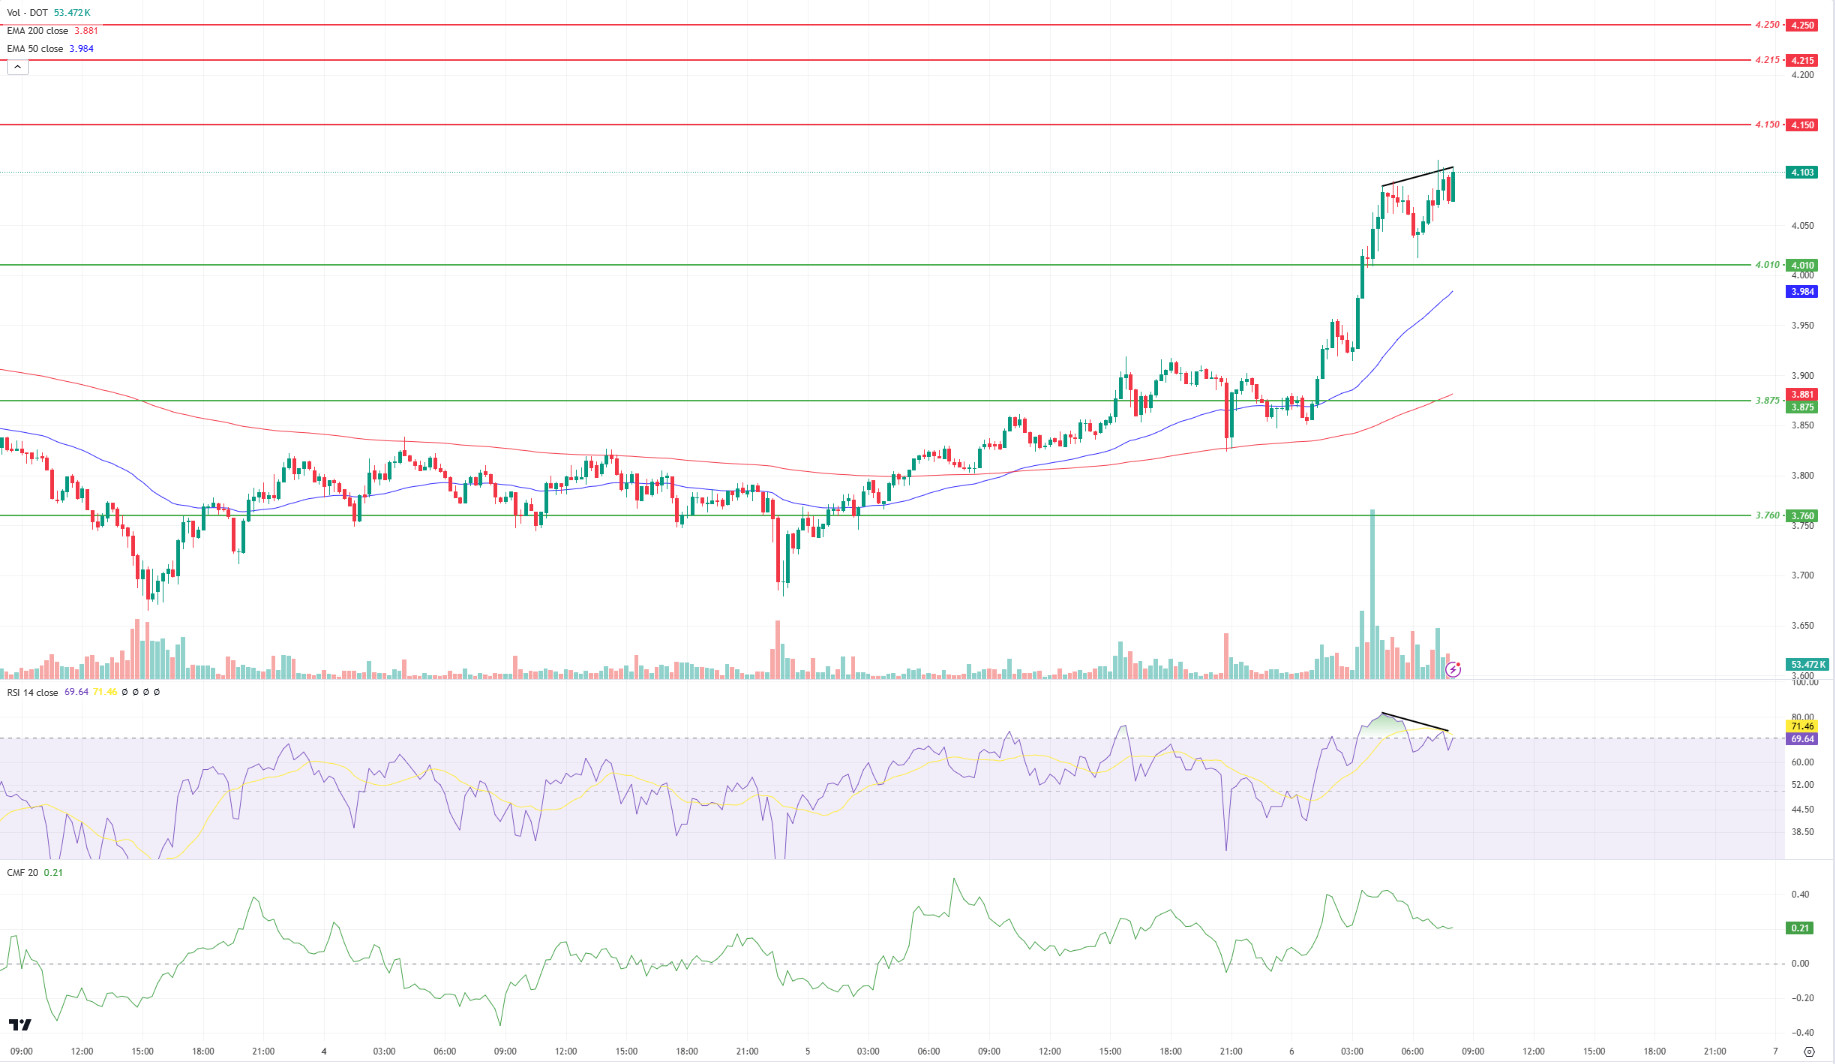
DOT/USDT
According to the latest analysis by the New York Times, Donald Trump is expected to be re-elected President of the United States. At the same time, Polkadot is partnering with SP Negócios to launch blockchain education in São Paulo. While Trump’s possible presidency reflects the upward movement in crypto markets, Polkadot’s collaboration could increase interest in blockchain technology in Brazil and expand its ecosystem.
Technically, Polkadot broke the 4.010 resistance level upwards as the EMA50 (Blue Line) broke the EMA200 (Red Line) upwards. The Chaikin Money Flow (CMF) oscillator is in positive territory. In this context, we can expect the price to move towards the 4.150 resistance level. In the negative scenario, when we examine the Relative Strengnth Index (RSI) oscillator, we see that there is a negative divergence between the price and the price in this context, the price may retreat towards 4.010 levels.
Supports 4.010 – 3.875 – 3.760
Resistances 4.150 – 4.215 – 4.250
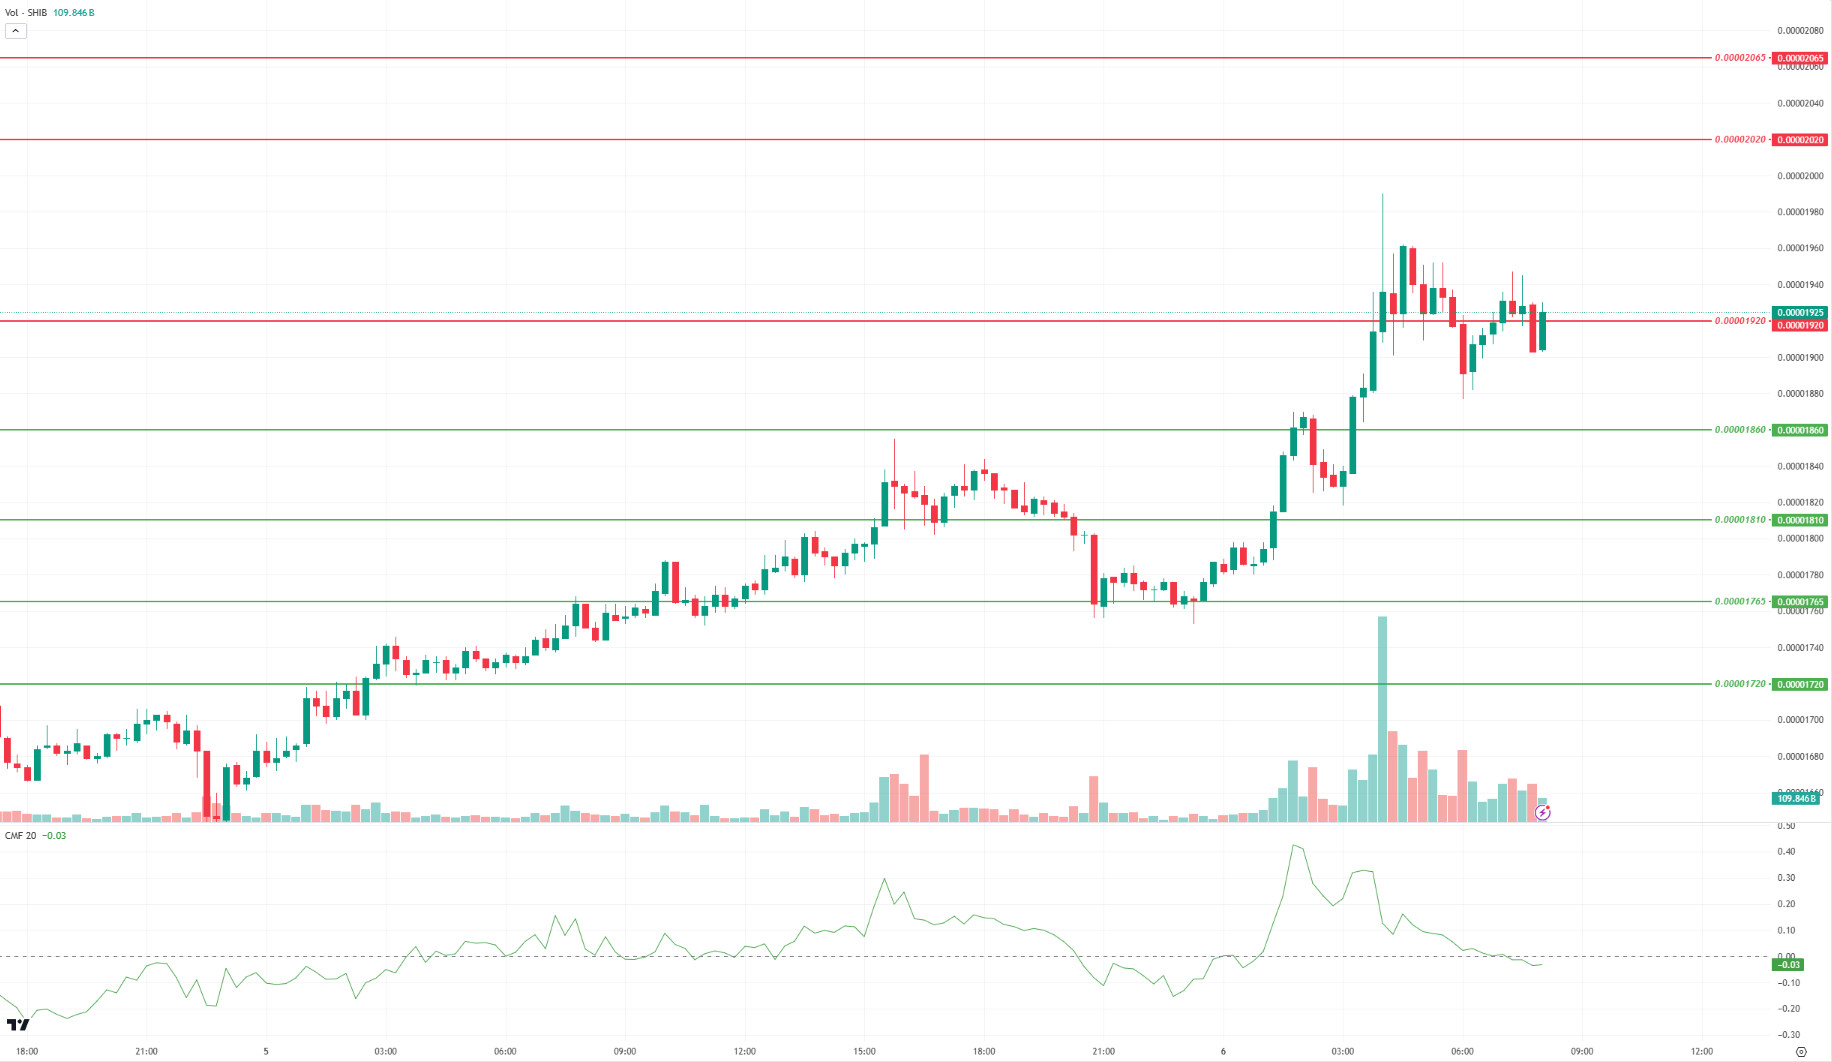
SHIB/USDT
The price of Shiba Inu (SHIB) surged by 11.31% as the probability of Donald Trump winning the 2024 elections strengthened. SHIB could potentially appreciate further if Trump is elected president. SHIB’s burn rate also increased by 1046.39% with 14 million tokens removed from circulation. Shiba Inu’s lead developer Shytoshi Kusama’s announcement of the new “S.H.I.B.” platform, which includes an open invitation to collaborate with Elon Musk and Trump, could increase interest in the SHIB ecosystem and support its value.
Technically, SHIB is hovering at the resistance level of 0.00001920. When we examine the Chaikin Money Flow (CMF) oscillator, we can say that the selling pressure is stronger. In this context, if the price cannot maintain above the 0.00001920 resistance level, the first reaction may be the 0.00001860 level. On the other hand, if the buyer pressure continues, the price may move towards the 0.00002020 resistance level.
Supports 0.00001860 – 0.00001810 – 0.00001765
Resistances 0.00001920 – 0.00002020 – 0.00002065
LEGAL NOTICE
The investment information, comments and recommendations contained herein do not constitute investment advice. Investment advisory services are provided individually by authorized institutions taking into account the risk and return preferences of individuals. The comments and recommendations contained herein are of a general nature. These recommendations may not be suitable for your financial situation and risk and return preferences. Therefore, making an investment decision based solely on the information contained herein may not produce results in line with your expectations.
