
MARKET SUMMARY
Latest Situation en Crypto Assets
Cryptocurrency Market Data
| Assets | Last Price | 24h Change | Dominance | Market Cap |
|---|---|---|---|---|
| BTC | 60,916.00 | -2.48% | 56.57% | 1.20 T |
| ETH | 2,401.00 | -1.97% | 13.59% | 289.12 B |
| SOLANA | 140.16 | -2.54% | 3.09% | 65.79 B |
| XRP | 0.5274 | -0.98% | 1.40% | 29.87 B |
| DOGE | 0.1080 | -1.21% | 0.74% | 15.80 B |
| TRX | 0.1595 | -0.11% | 0.65% | 13.81 B |
| CARDANO | 0.3395 | -2.23% | 0.56% | 11.88 B |
| AVAX | 26.12 | -1.59% | 0.50% | 10.62 B |
| SHIB | 0.00001711 | -4.08% | 0.47% | 10.07 B |
| LINK | 10.68 | -1.74% | 0.31% | 6.69 B |
| DOT | 4.064 | -1.71% | 0.29% | 6.11 B |
*Prepared el 10.10.2024 at 06:00 (UTC)
WHAT’S LEFT BEHIND
FED Minutes Released
Minutes of the FED’s September meeting were released. Officials largely agreed el a rate cut, while emphasizing that quantitative tightening will continue. Decisions are entirely dependent el economic conditions and each step should be carefully evaluated. Most Fed officials argued that a 25 basis point rate cut would be en line with the gradual normalization of monetary policy.
Chinese Government Allegedly Selling Ethereum (ETH)
The Chinese government has begun liquidating a significant portion of the Ethereum (ETH) seized from the infamous PlusToken Ponzi scheme, contributing to the recent declines en the cryptocurrency market. Approximately 7,000 ETH out of a total of 542,000 ETH (worth $1.3 billion) were sent to exchanges en the last 24 horas, signaling the start of asset disposals.
HIGHLIGHTS OF THE DAY
Important Economic Calendar Data
| Time | Country | Noticias | Expectation | Previous |
|---|---|---|---|---|
| World Blockchain Summit | ||||
| Crypto Fest 2024 | ||||
| Near Hackathon ends | ||||
| PEPPER Airdrop – Chiliz (CHZ) | ||||
| 12:30 | US | CPI (YoY) (Sep) | 2.3% | 2.5% |
| 12:30 | US | Core CPI (YoY) (Sep) | 3.2% | 3.2% |
| 12:30 | US | Core CPI (MoM) (Sep) | 0.2% | 0.3% |
| 12:30 | US | CPI (MoM) (Sep) | 0.1% | 0.2% |
| 12:30 | US | Initial Jobless Claims | 231K | 225K |
| 13:15 | US | FOMC Member Cook Speaks | ||
| 14:30 | US | FOMC Member Barkin Speaks | ||
| 15:00 | US | FOMC Member Williams Speaks |
INFORMATION
*The calendar is based el UTC (Coordinated Universal Time) time zone.
The economic calendar content el the relevant page is obtained from reliable news and data providers. The news en the economic calendar content, the date and time of the announcement of the news, possible changes en the previous, expectations and announced figures are made por the data provider institutions. Darkex cannot be held responsible for possible changes that may arise from similar situations.
MARKET COMPASS
As the markets are preparing to start one of the critical days of the week, attention will be el the US inflation data. Ahead of this; after the US stock markets, which completed yesterday el the positive side, there are also rises en Asia this morning. New stimulus news expected to come from China over the weekend seems to have raised hopes again. The dollar continues to remain strong with the minutos of the last meeting of the Federal Open Market Committee (FOMC) published last night and the statements of some officials. The US Federal Reserve seems to be slightly less dovish than before. Digital assets have been pressured por the impact of this and news that the Chinese government is sending assets seized from the PlusToken case to stock exchanges.
While the FOMC minutos showed that officials were torn between 50 and 25 basis point rate cuts, Mary Daly, President of the Federal Reserve Bank of San Francisco, said en an interview that she favored one or two more rate cuts this year. According to the CME Fedwatch Tool, there is an 85% chance that the Fed will cut rates por 25 basis points at its November meeting, while there is a 15% chance that rates will be left unchanged. Inflation data to be released today may have an impact el these expectations.
Please click here to read our report titled “Eyes el Inflation After Strong Employment Data”.
About five years hace, news that the assets seized from PlusToken, which was found to have defrauded more than 2.5 million people, were transferred to exchanges por the Chinese government caused selling pressure el digital assets. Over $14 billion worth of different cryptocurrencies were seized from PlusToken. According to the news, 7,000 ether tokens were moved to exchanges earlier this week. Today, US inflation data will be important for digital assets trying to recover after the losses that came with the news flow, as for other instruments. It seems that the risk appetite en the markets needs to strengthen again en order for the recovery trend to continue. After the impact of the PlusToken issue started to loosen, it seems that this is the dynamic that digital assets need for the real rise. For this, US macro data and stimulus news from China are important headlines.
TECHNICAL ANALYSIS
BTC/USDT
Bitcoin retreat! Although the FOMC minutos signaled a more accommodative monetary policy change, Bitcoin failed to capitalize el the news and its correlation with the equity market has again diverged. With US inflation data expected today, it remains to be seen whether Bitcoin will regain its equilibrium and more closely align with the bullish trends seen en traditional equity markets. When we look at the BTC 4-hora technical analysis chart, as we mentioned en yesterday’s analysis, after the recession during the day, the market gave way to volatile movements with the opening of the US market. With the loss of the Fibonacci 0.382 support level, we witnessed that the downward decline deepened, and the price retreated to the 60,300 level. When we look at BTC, which is currently priced just above the 60,650-support level, a double bottom formation stands out el the chart. With the recovery from these levels, the upward movement can be expected to test towards the 0.618 Fibonacci resistance level en the long term. When we look at the short term, a new trend channel can be followed with the clearing of “long” transactions clustered at 59,700 and then our Wave trend oscillator giving an upward signal.
Supports 60,650 – 59,700 – 58,350
Resistances 61,400 – 62,350 – 63,350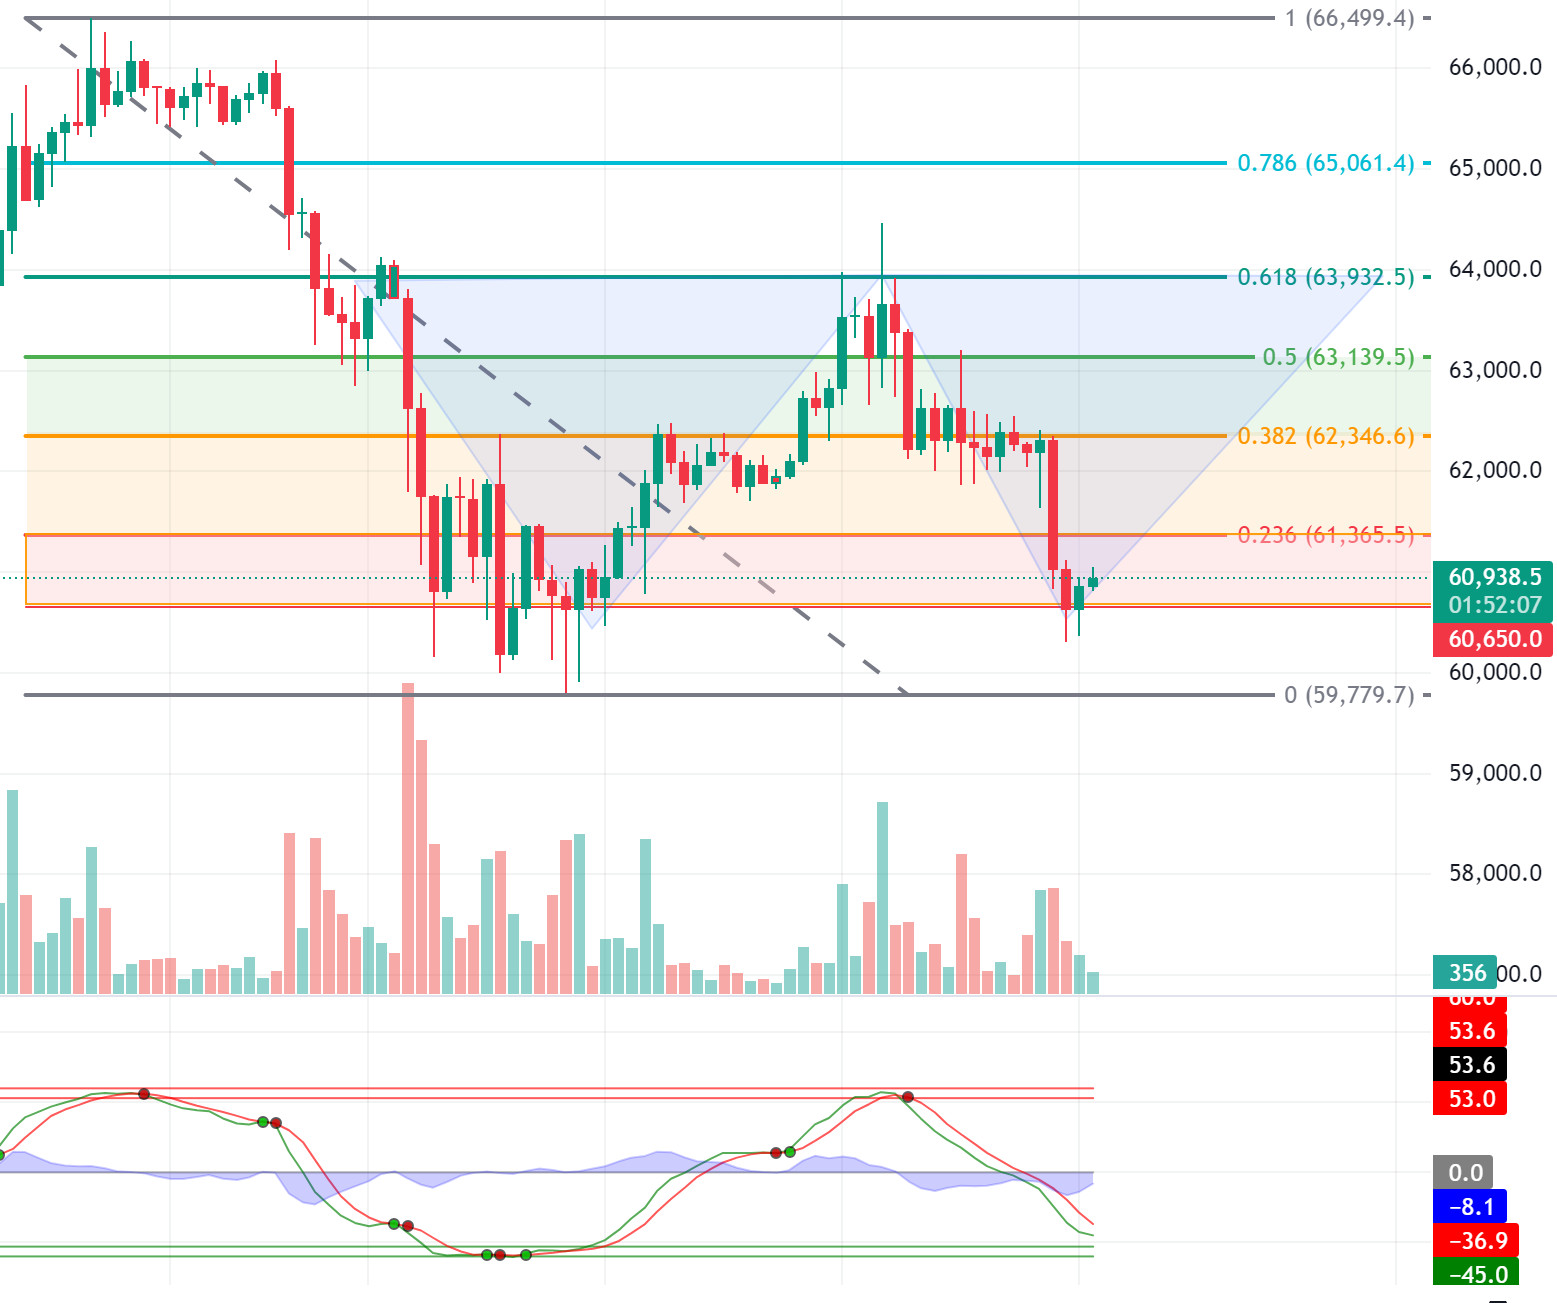
ETH/USDT
The alleged mobility en some of the ETH seized por the Chinese government en the PlusToken case last night caused Ethereum’s sudden decline. Unable to hold el to 2,400 levels, ETH reacted from the next support level of 2,346 and exceeded the 2,400 level again. However, with this increase, it is seen that the horizontal movement el CMF continues. RSI, OBV and momentum have turned positive again. For ETH, which is pushing the Kumo cloud resistance, we can see rises up to 2,460 levels again if it closes en the cloud during the day. If it cannot hold the 2,400 level, it can be said that declines up to 2,346 may come again.
Supports 2,400 – 2,346 – 2,270
Resistances 2,460 – 2,490 – 2,510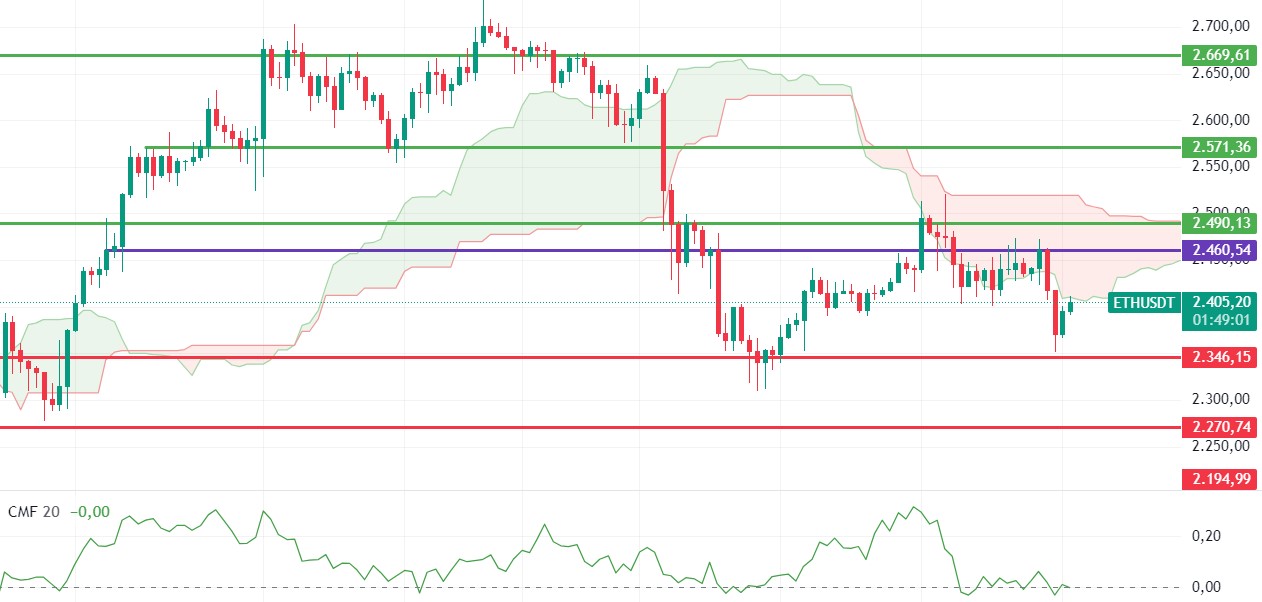
LINK/USDT
LINK also fell to the main support level of 10.52 with the declines experienced yesterday, but with the reaction it received from this level, it exceeded the lower band of the rising channel again. With momentum, RSI and OBV turning positive, it can be said that some more upside may come during the day. The most important support point of 10.52 remains valid and closures below this level may cause deeper declines. Exceeding the 10.98 level may strengthen the positive outlook el LINK and bring rises up to 11.36 levels.
Supports 10.52 – 10.17 – 9.89
Resistances 10.98 – 11.36 – 11.66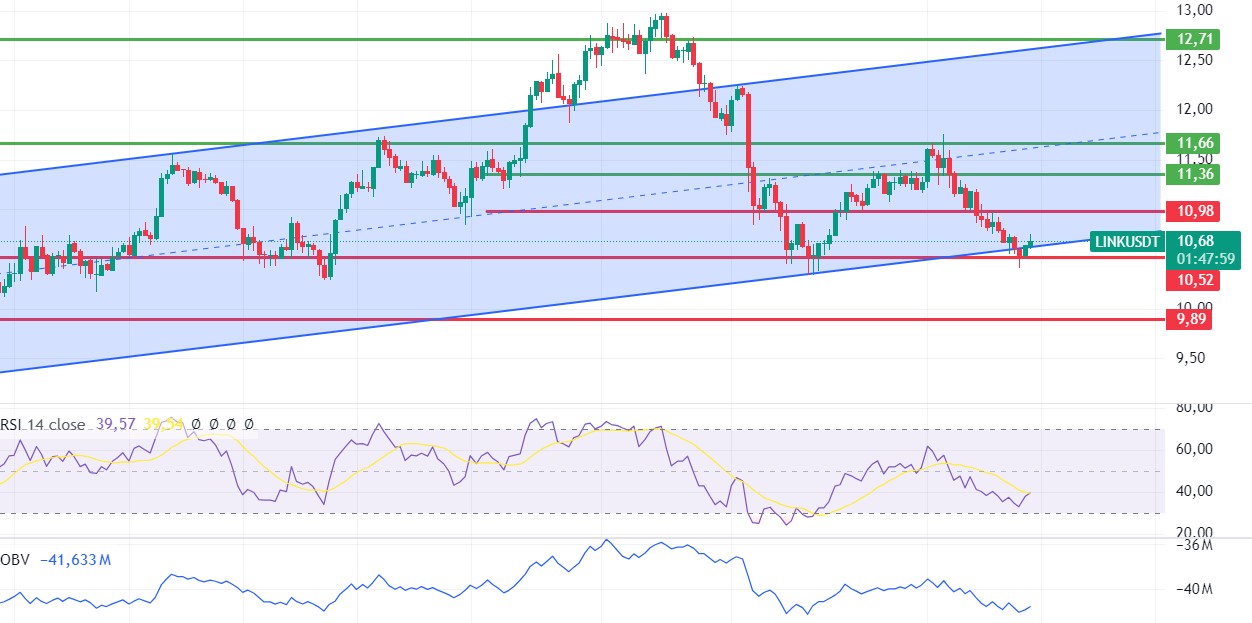
SOL/USDT
The inflation data coming from the US today may affect both the interest rate decision and the cryptocurrency markets. Unexpected data may cause sudden fluctuations en the price. However, en the evening, the Chinese government liquidated ETH seized from the PlusToken case, causing the market to fall. In the Solana ecosystem, the funding rate has turned positive. This could be a bullish sign. Technically, SOL has lost about 1.28% since yesterday el the news from China. The price continues to accumulate en the 127.17 – 161.63 band since August 8. It encountered resistance at 0.618 (151.12), the Fibonacci retracement. On the 4-hora chart, the 50 EMA seems to have received support from the 200 EMA. The 151.12 level is a strong resistance point en the uptrend driven por both macroeconomic conditions and innovations en the Solana ecosystem. If it rises above this level, the rise may continue. In the sales that investors will make due to political and macroeconomic conditions, the support level of 131.80, which is the place of retreat, should be followed. If the price comes to these support levels, a potential bullish opportunity may arise.
Supports 137.77 – 135.18 – 131.80
Resistances 143.64 – 147.40 – 151.12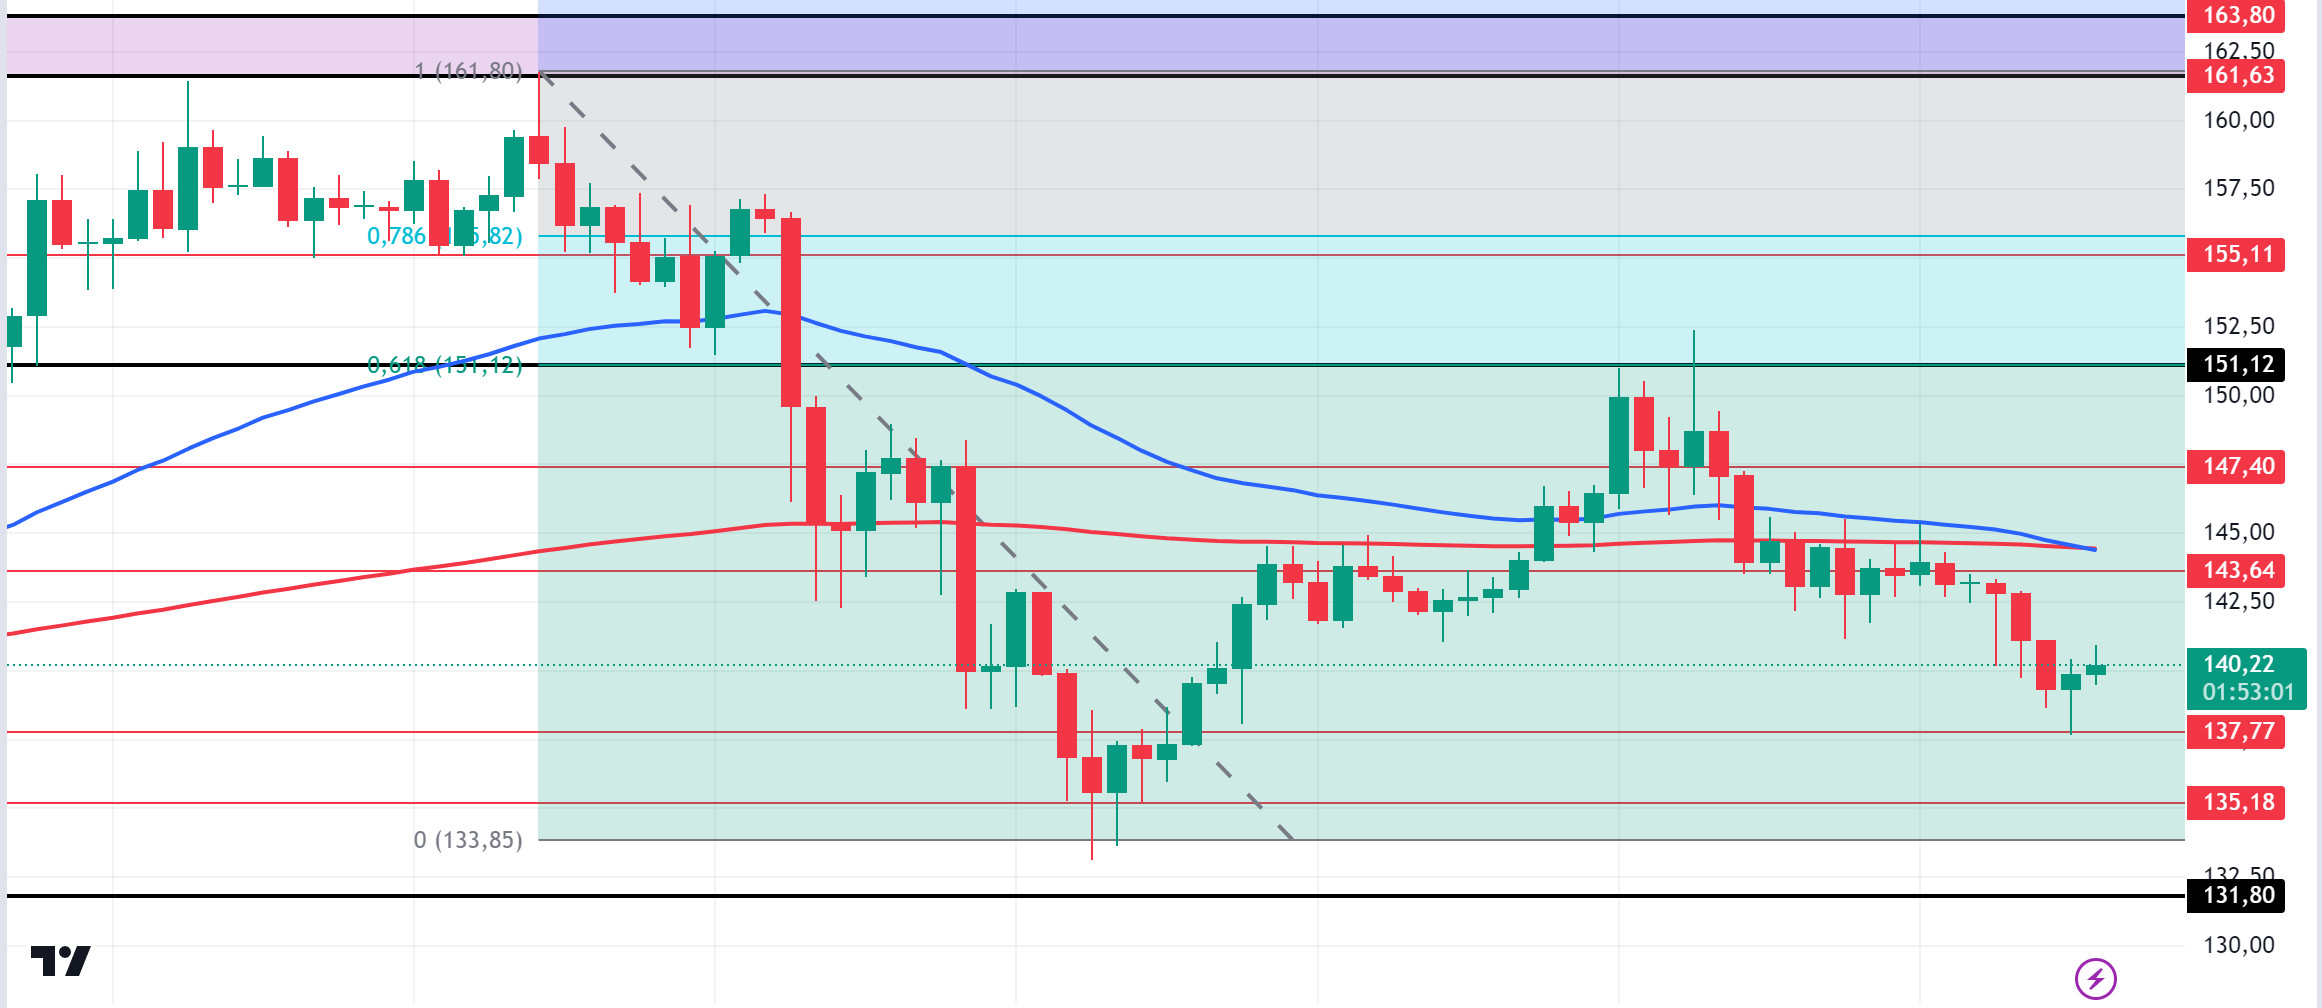
ADA/USDT
The inflation data coming from the US today may affect both the interest rate decision and the cryptocurrency markets. Unexpected data may cause sudden fluctuations en the price. In the evening, the Chinese government liquidated ETH seized from the PlusToken case, causing the market to fall. In the Cardano ecosystem, it is home to the first legally enforceable smart contract. This is because the contract was signed en Argentine courts. The contract is a loan agreement between Cardano ambassadors Mauro Andreoli and Lucas Macchia for 10,000 Cardano ADA 0.3391 tokens – worth $3,380 – payable en 4 months at a 10% interest rate. This could set a precedent for future sales of property and real estate el credit. Technically, el the 4-hora chart, both the 50 EMA broke the 200 EMA to the downside and the strong support band of 0.3469 – 0.3444. This could be a sign that the decline may deepen. However, the price seems to have made a double bottom. If this pattern works, traders may consider this as a place to add to their positions. ADA 0.3301- 0.3228 levels appear as a strong support en retracements with possible political and macroeconomic news. If the whale purchases en the ecosystem continue, the 0.3651 level should be followed as a strong resistance.
Supports 0.3301 – 0.3228 – 0.3166
Resistances 0.3444 – 0.3469 – 0.3596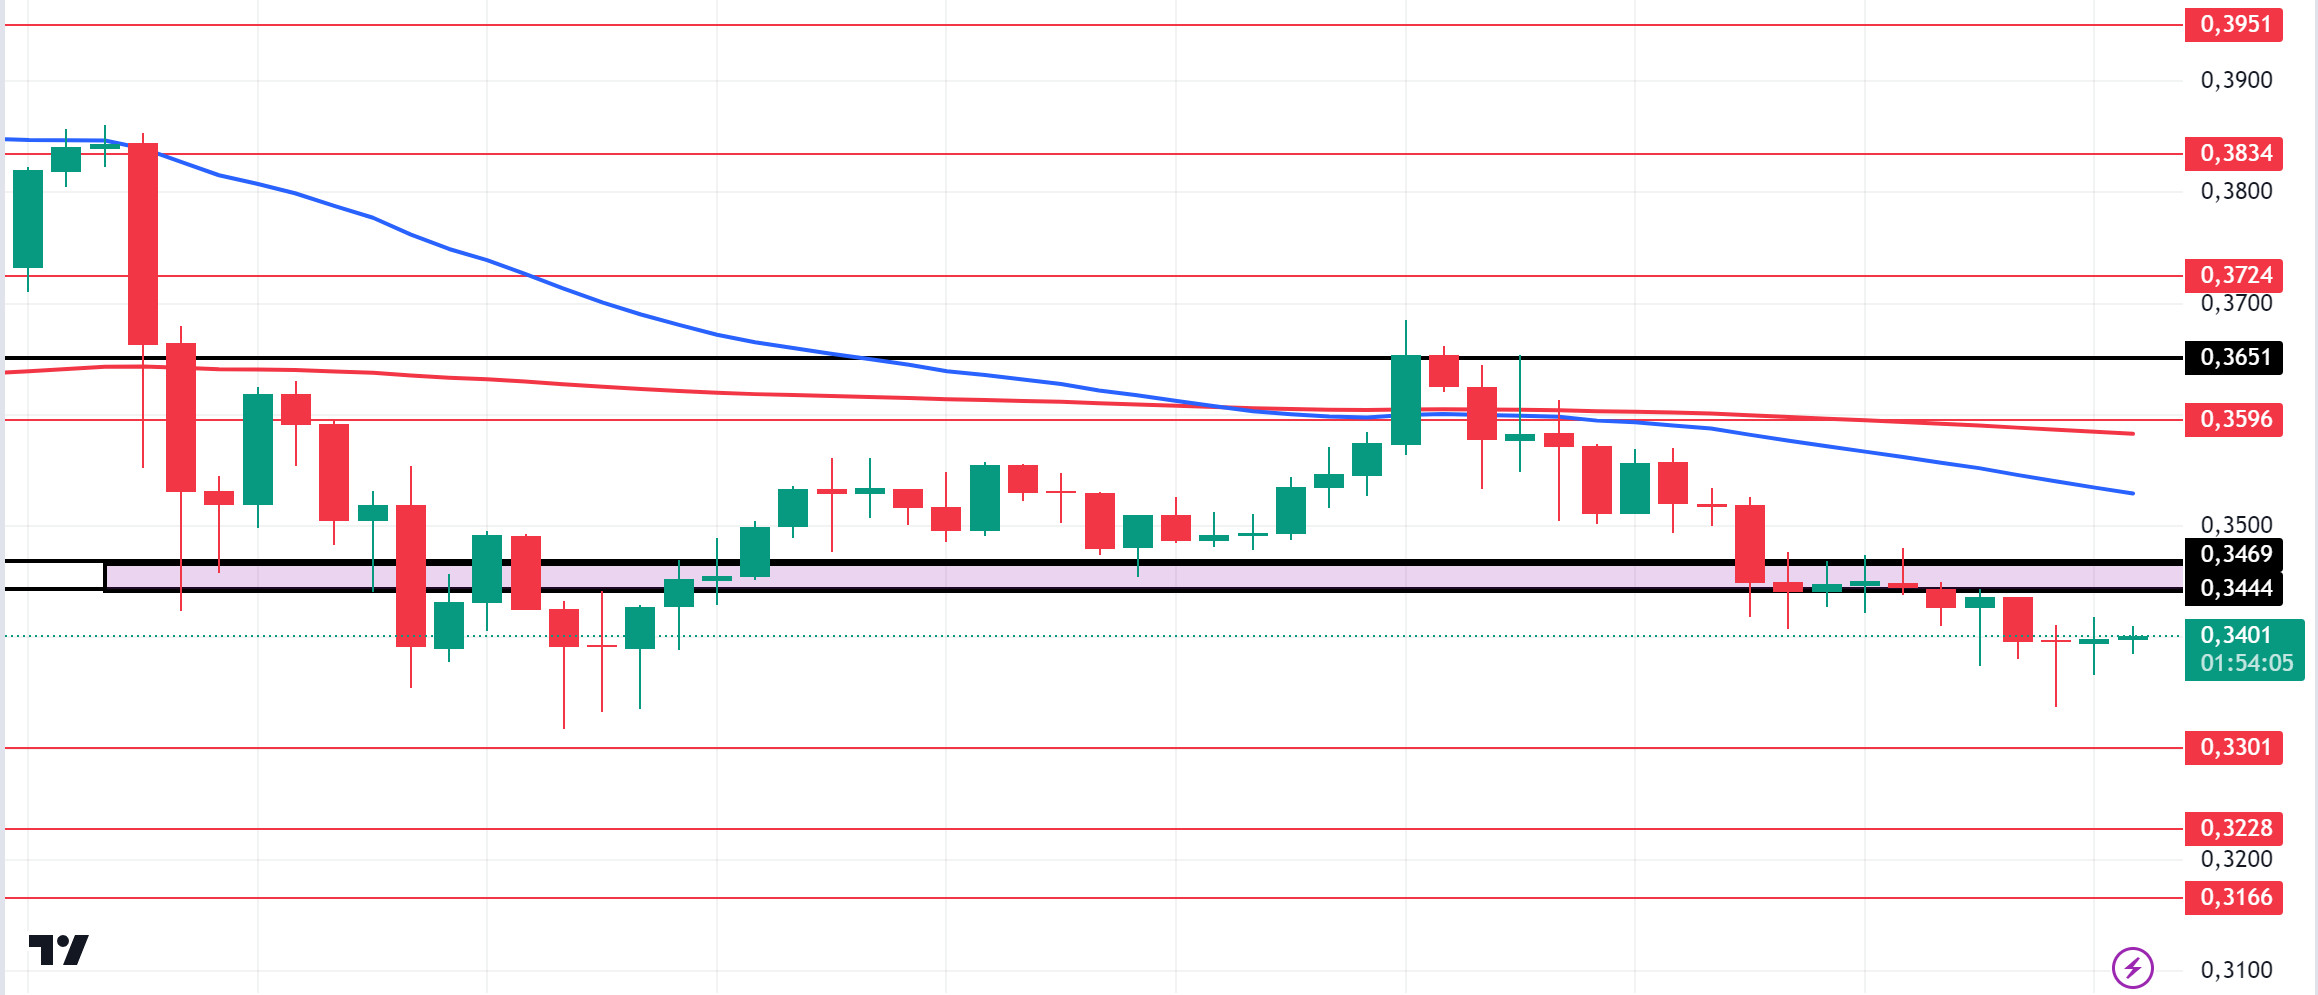
AVAX/USDT
AVAX, which opened yesterday at 26.34, fell por about 2% during the day and closed the day at 25.76. Today, consumer price index and unemployment claims data will be released por the US. The decline en the consumer price index may be priced positively. It will also be important for news flows from the Middle East.AVAX, currently trading at 26.07, is moving en the middle band of the falling channel el the 4-hora chart. With the RSI 44 value, it can be expected to move from here to the upper band. In such a case, it may test the 26.54 resistance. Sales may increase en the event of a higher-than-expected inflation data or news of increased tension en the Middle East. In such a case, it may test 25.60 support. As long as it stays above 24.65 support during the day, the desire to rise may continue. With the break of 24.65 support, sales may increase.
Supports 25.60 – 24.65 – 23.90
Resistances 26.54 – 27.20 – 28.00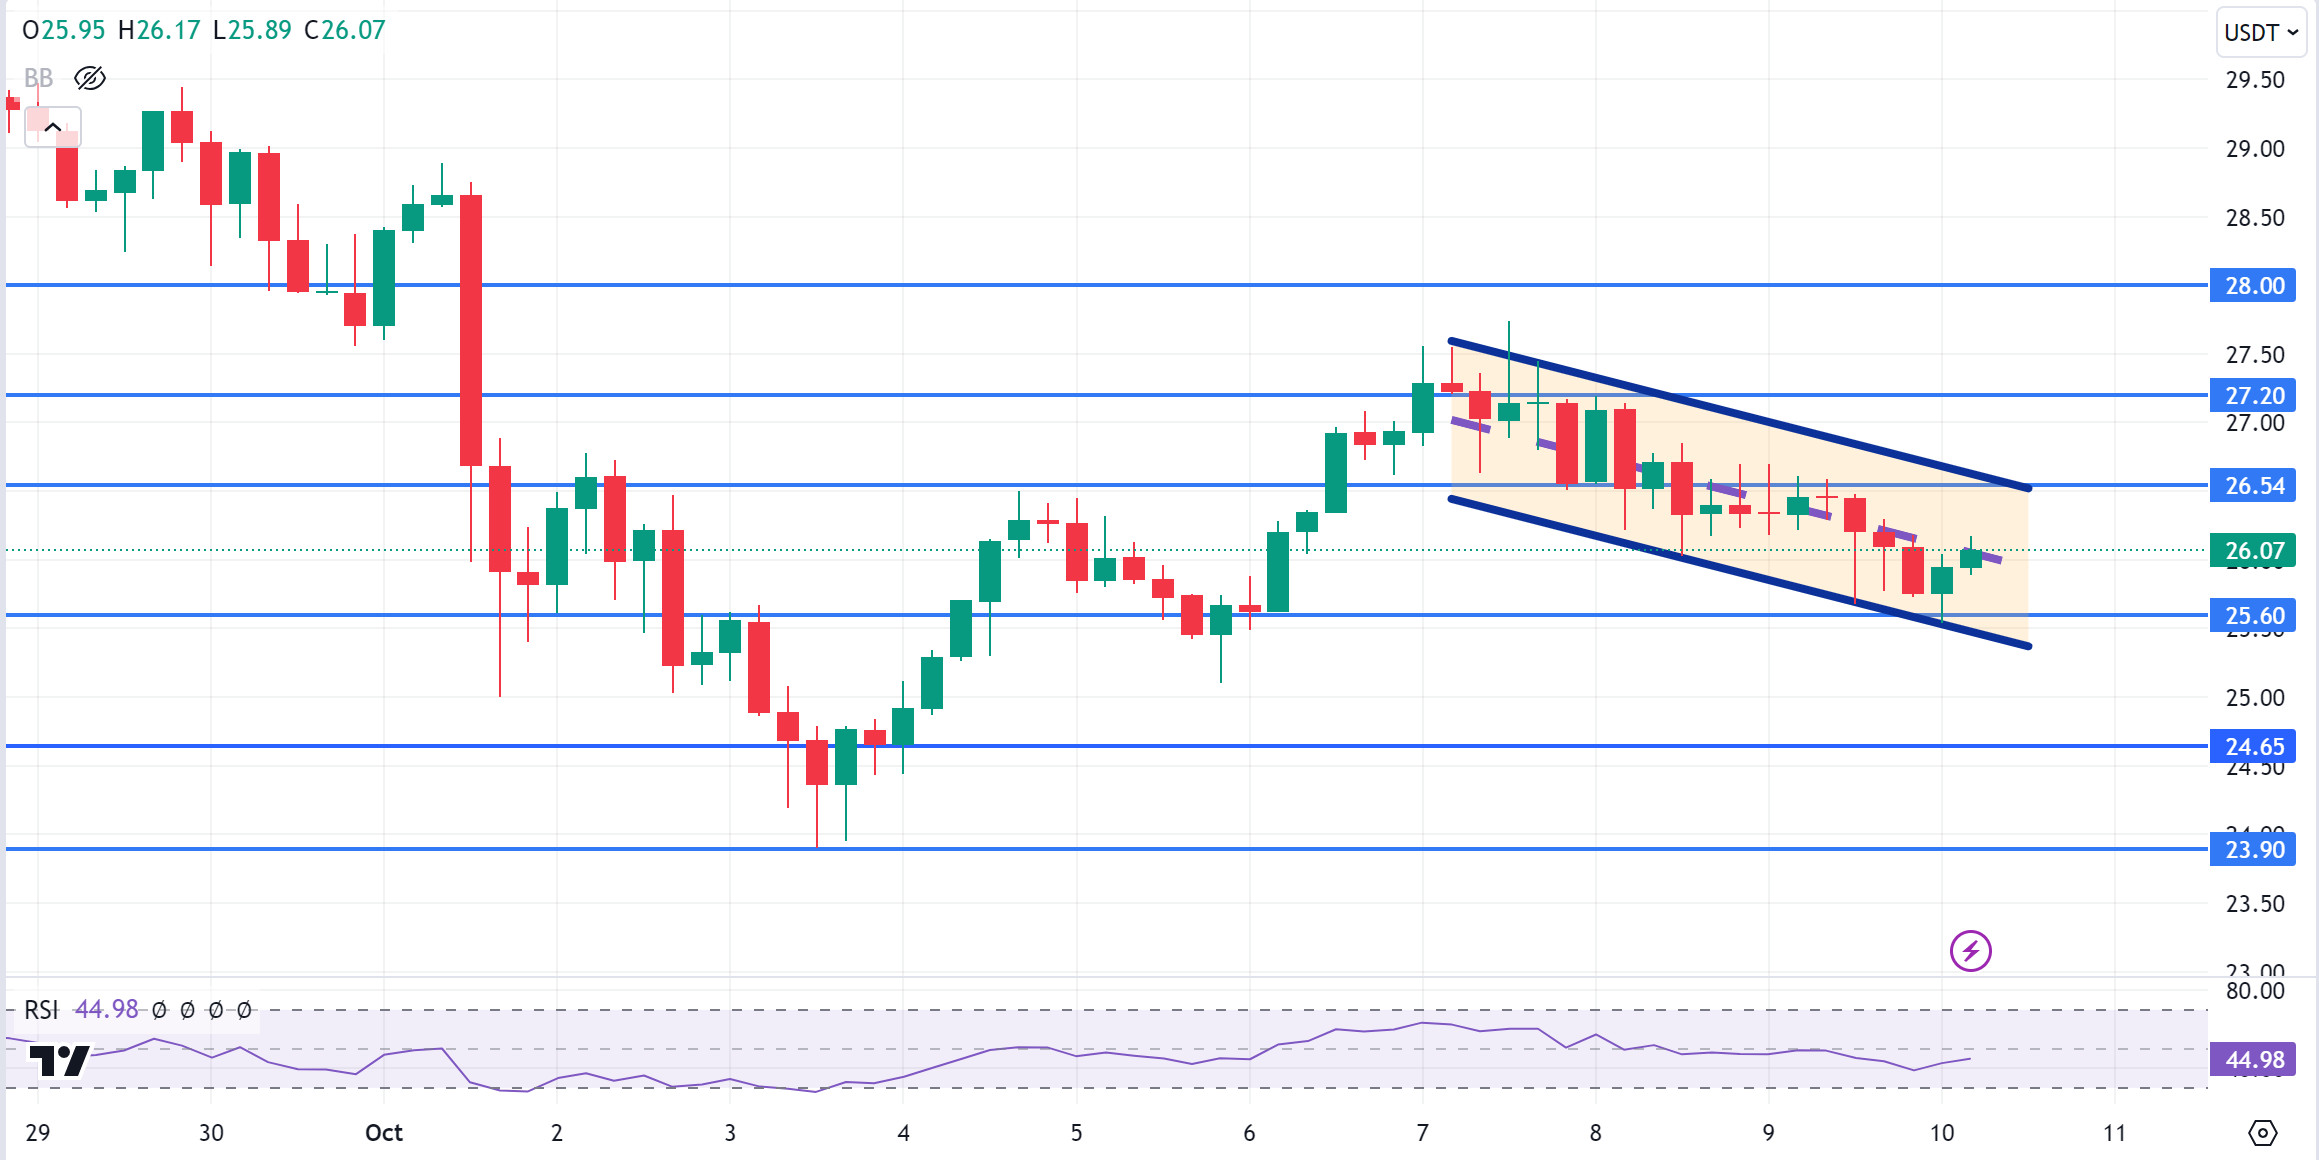
TRX/USDT
TRX, which started yesterday at 0.1500, rose slightly during the day and closed the day at 0.1605. Today, the US consumer price index and unemployment claims data will be released. Inflation data is very important for the market and if it is announced en line with expectations or lower, it may be priced positively as it will ease the FED’s hand el interest rate cuts. The market will also be closely monitoring the news flows regarding the tension en the Middle East.TRX, currently trading at 0.1597, is moving downwards towards the Bollinger mid-band el the 4-hora chart. The RSI 61 value is very close to the overbought zone and can be expected to decline a little more from its current level. In such a case, it may move to the Bollinger middle band and test the support of 0.1575. In case of a decline en US inflation or a decrease en tension en the Middle East, it may test 0.1641 resistance with future purchases. TRX may continue to be bullish as long as it stays above 0.1482 support. If this support is broken downwards, sales can be expected to increase.
Supports 0.1575 – 0.1550 – 0.1532
Resistances 0.1603 – 0.1641 – 0.1687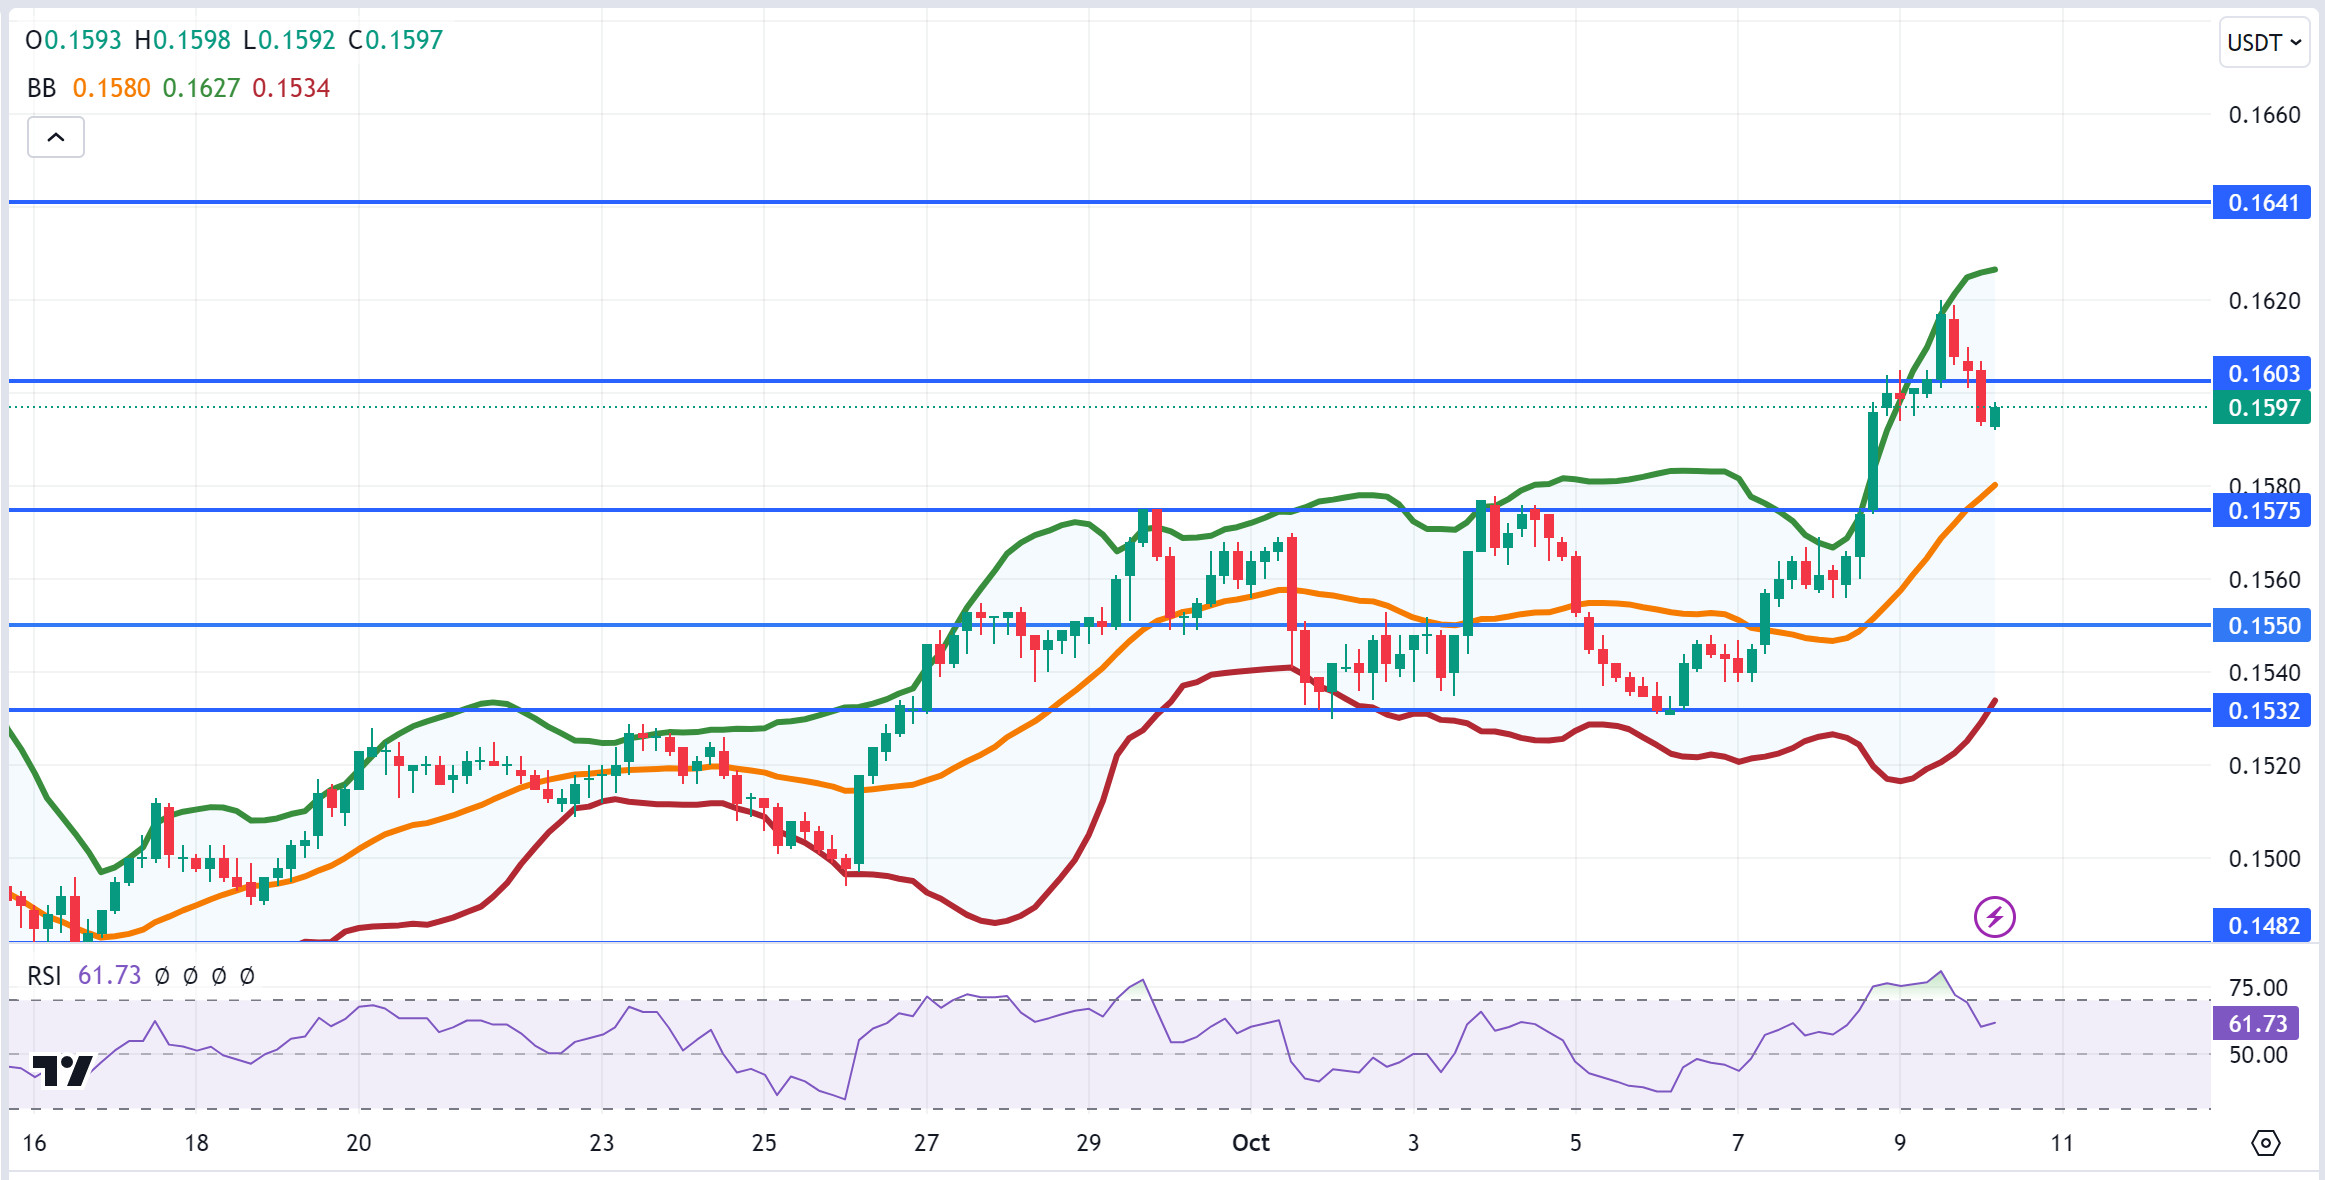
XRP/USDT
XRP lost 1.3% yesterday, closing the day at 0.5241. XRP fell yesterday with the sales coming at the EMA20 level en its rise. After testing and failing to break the EMA20 level more than once yesterday, the decline deepened with the negative developments el behalf of the crypto market and fell to 0.52. XRP, which started to rise with purchases at 0.52, started today with a rise and is currently trading at 0.5280. When we examine the last days for XRP, it continues to move en a horizontal band en the 4-hora analysis. RSI data is en the neutral zone and the movement within the horizontal band may continue en this process. If it rises with positive developments, it may test the resistance levels of 0.5351-0.5431-0.5515 with its rise. In case of a decline due to negative developments, it may test the support levels of 0.5231-0.5131-0.5026.While XRP is trading en a horizontal band, it may decline with possible sales at 0.535 en its rise and may offer a short trading opportunity. In its decline, it may rise with possible purchases at 0.52 and may offer a long trading opportunity.
EMA20 (Blue Line) – EMA50 (Green Line) – EMA200 (Purple Line)
Supports 0.5231 – 0. 5131 – 0.5026
Resistances 0.5351 – 0.5431 – 0.5515 DOGE/USDT
While DOGE was trading at 0.11 levels el the EMA levels with its rise en the 4-hora analysis yesterday, it declined with the negative developments affecting the crypto market en general and the daily close was at 0.1078. Today, DOGE, which continues its horizontal movement en the opening candle en the 4-hora analysis, is currently trading at 0.1080. The RSI (14) value is 45.8 and is en the neutral zone. In this process, DOGE may trade en a horizontal band between 0.1080 and 0.1101 levels. While trading within the horizontal band, if it rises with the positive developments that may come el behalf of the markets, it may test the resistance levels of 0.1101-0.1122-0.1149 with its rise. In the opposite case, it may test the support levels of 0.1080-0.1054-0.1035 with its decline. While trading within the horizontal band, it may offer short-term trading opportunities en instant bearish and bullish situations.
EMA20 (Blue Line) – EMA50 (Green Line) – EMA200 (Purple Line)
Supports 0.1080 – 0.1054 – 0.1035
Resistances 0.1101 – 0.1122 – 0.1149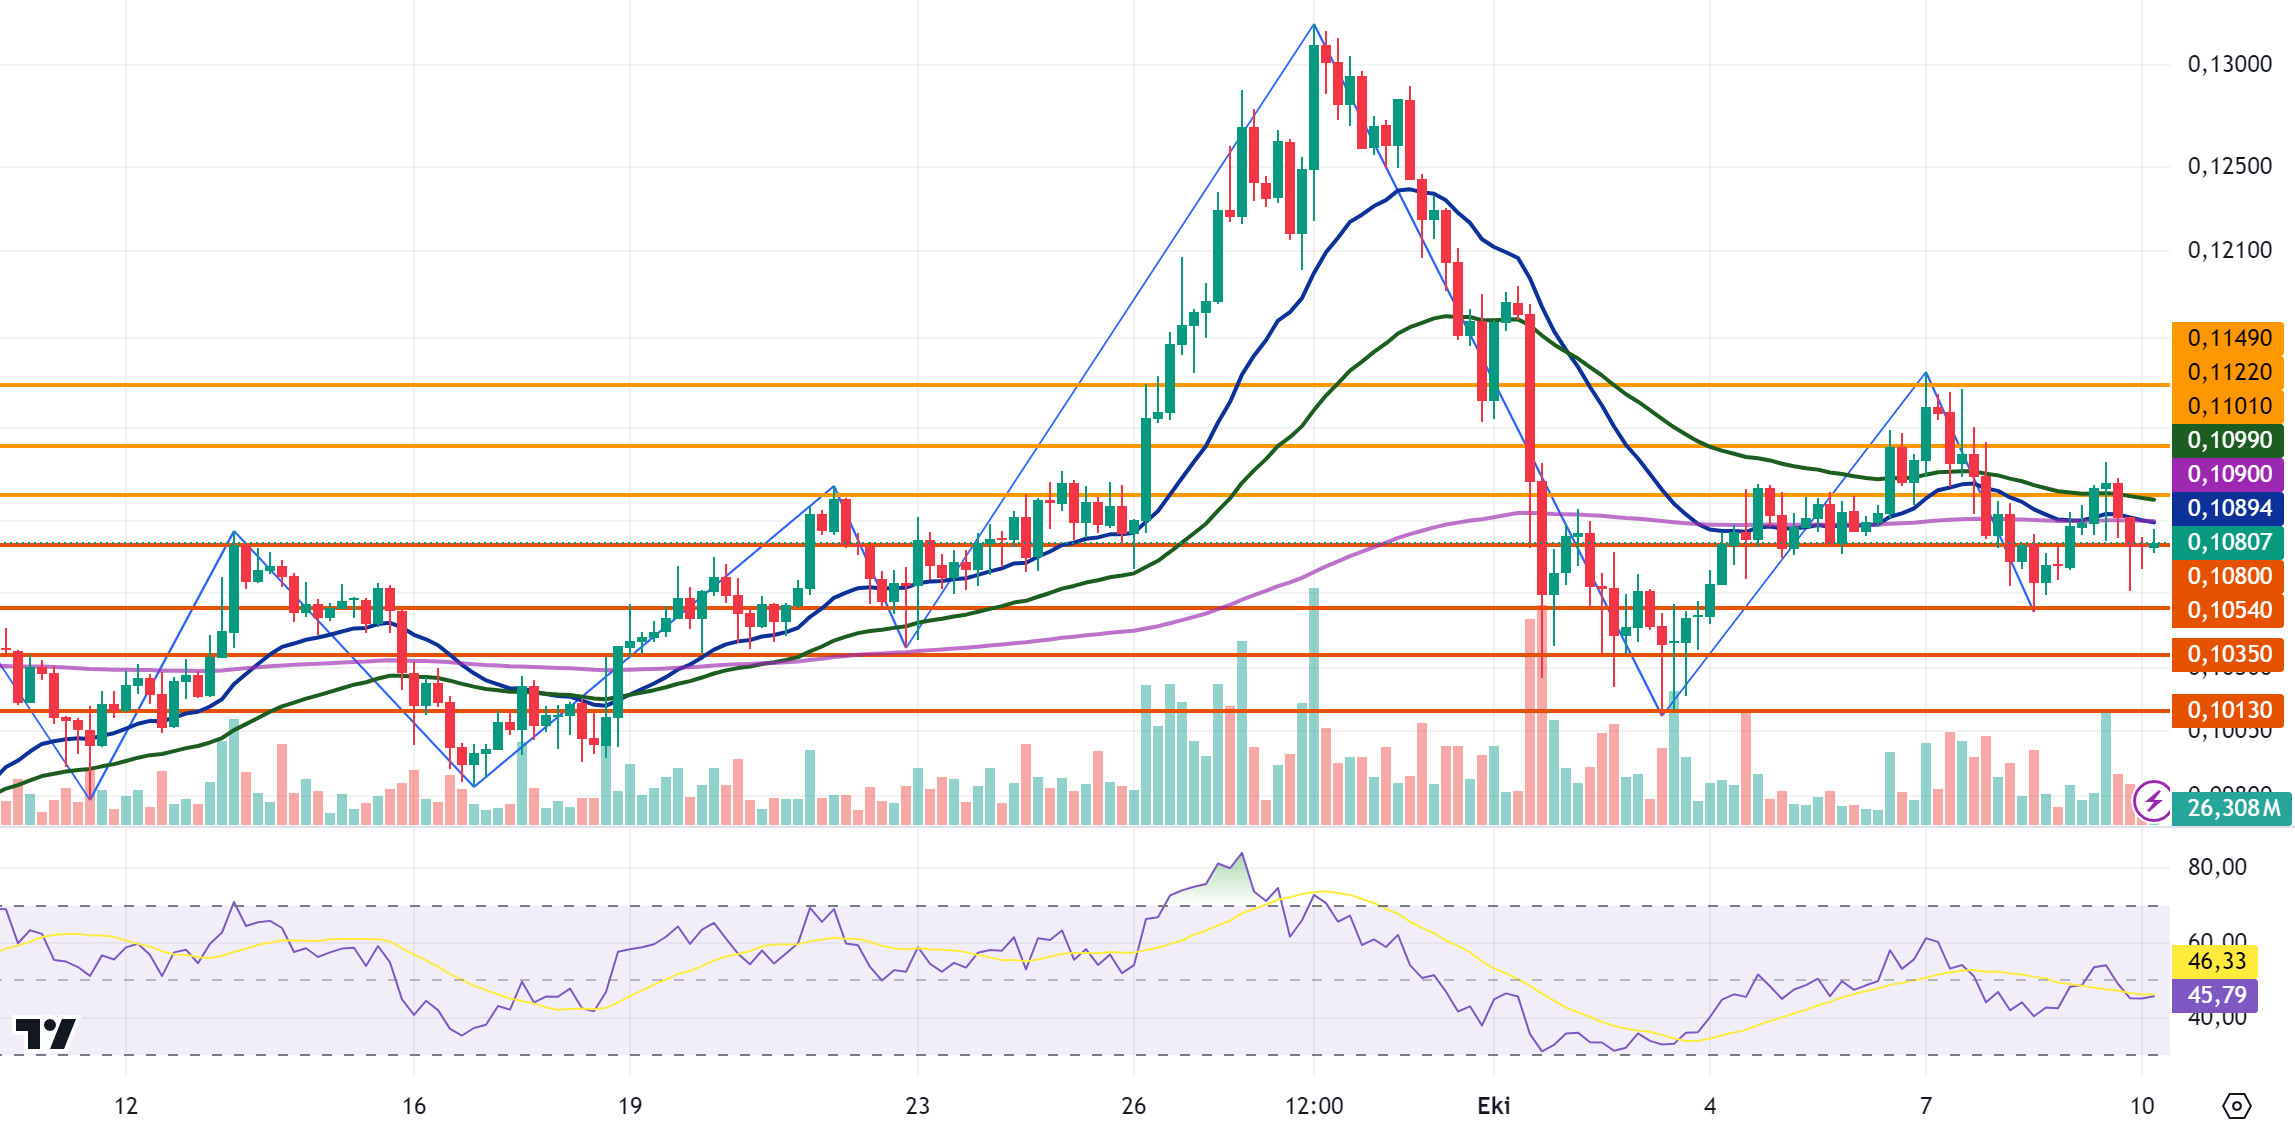
DOT/USDT
On the Polkadot (DOT) chart, the price fell as low as 3.975. After the selling pressure due to the US inflation expectation, the price reacted from the support level of 3.975. When we examine the RSI, we see that it enters the rising channel. If the selling pressure at 4.080 is broken, we may see a rise towards the next resistance level of 4.180 bands. In the negative scenario, the price may want to test the 3.975 support level again.
Supports 4.010 – 3.975 – 3.875
Resistances 4.080 – 4.180 – 4.210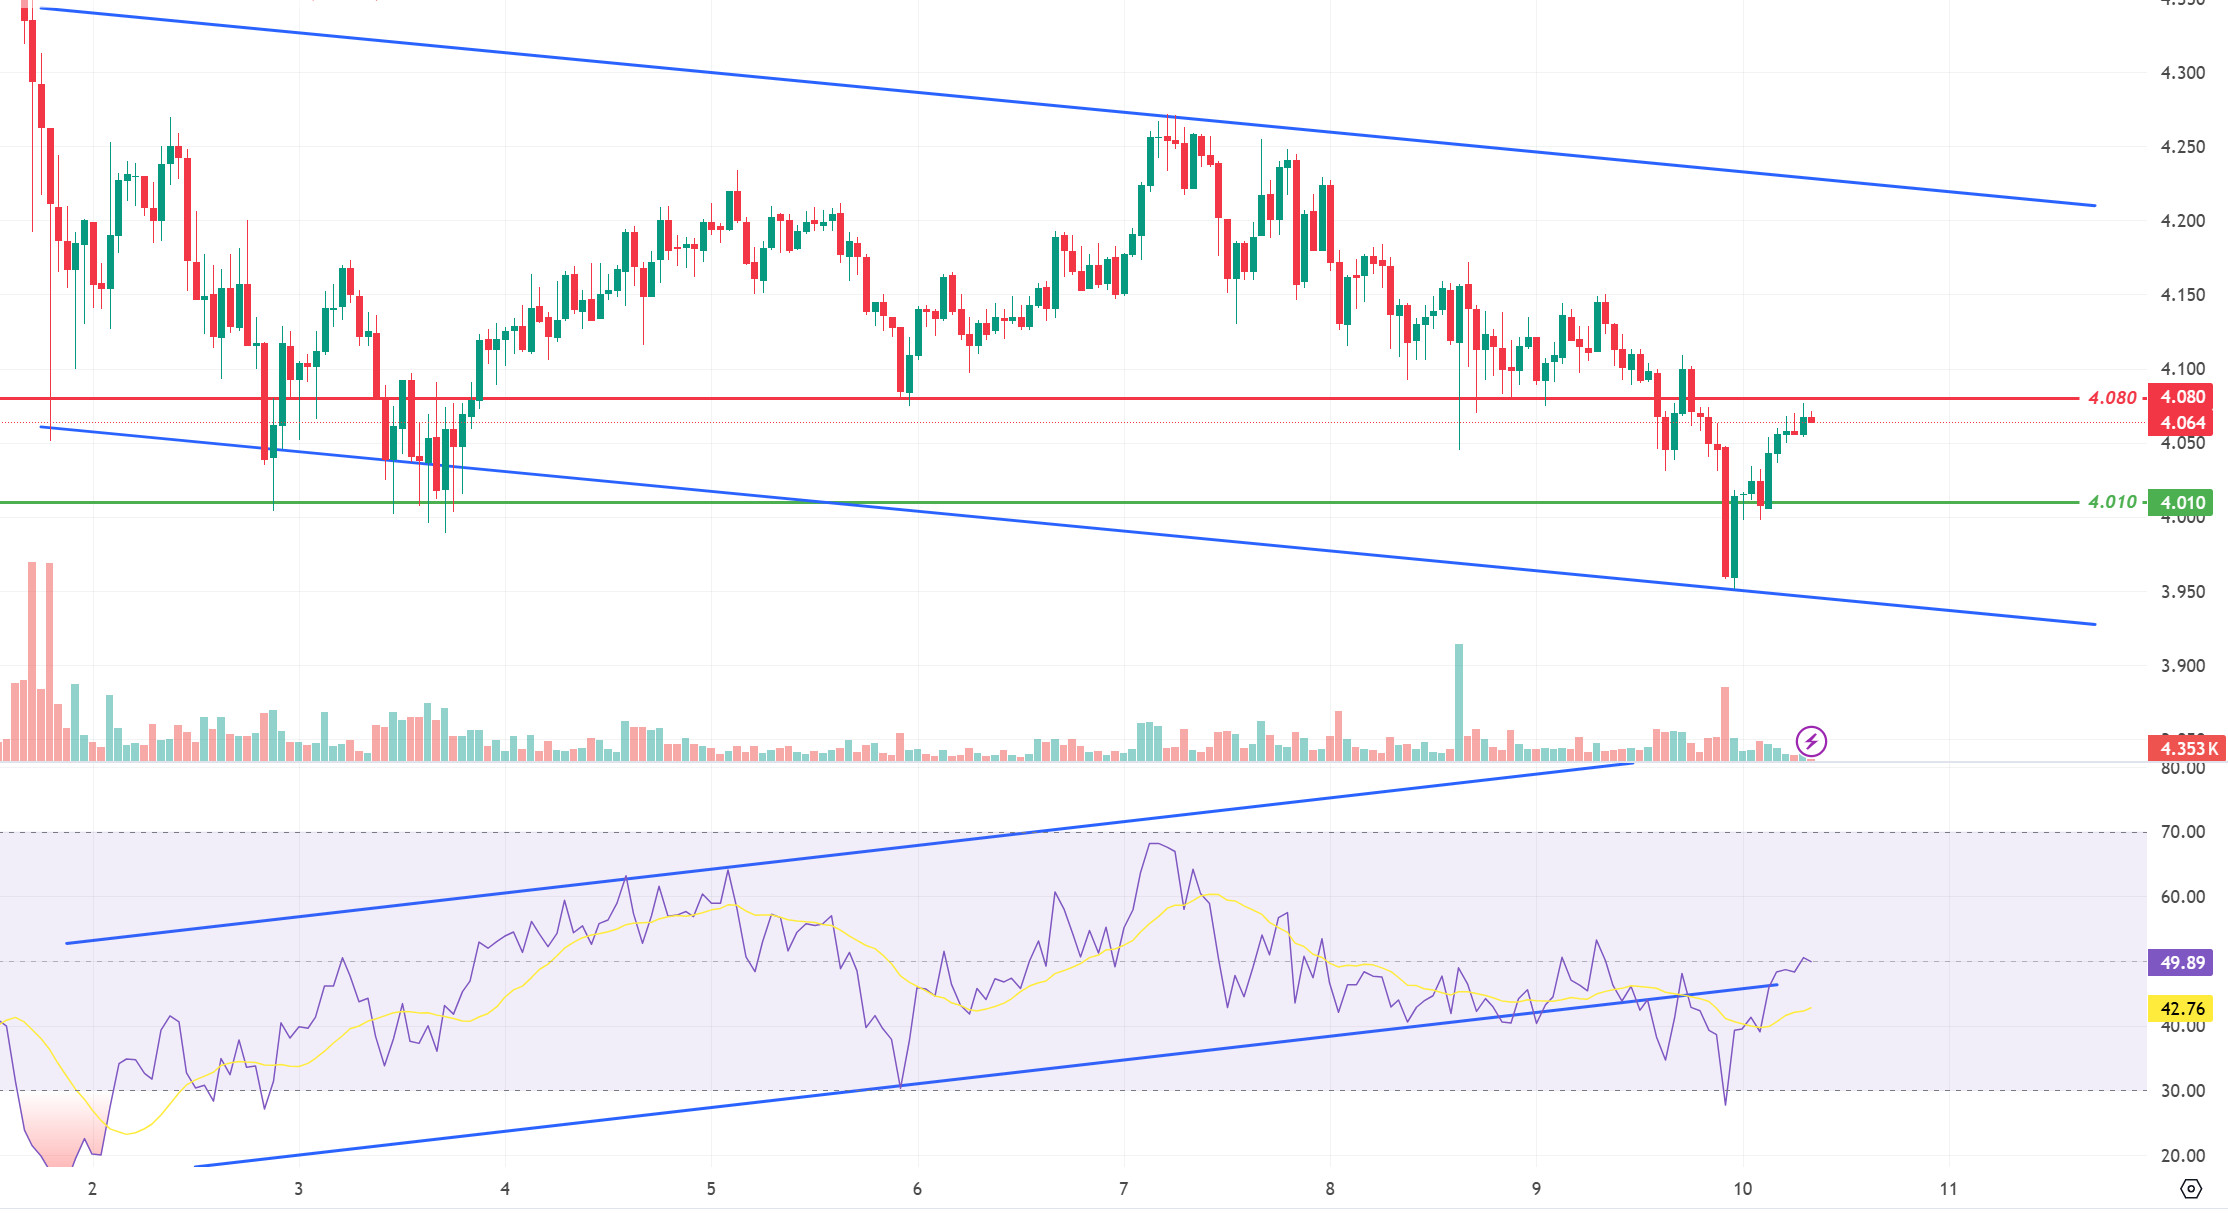
SHIB/USDT
Shiba Inu (SHIB) reacted from 0.00001690 support level. SHIB, which retreated yesterday with increasing selling pressure, received a reaction from the 0.00001690 support level. The price, which continues to move en the descending channel, may want to break the selling pressure at 0.00001765 with increasing buyer pressure. On the other hand, if the selling pressure continues, the level where we expect the first reaction may be the 0.00001690 support band.
Supports 0.00001690 – 0.00001630 – 0.00001565
Resistances 0.00001765 – 0.00001810 – 0.00001895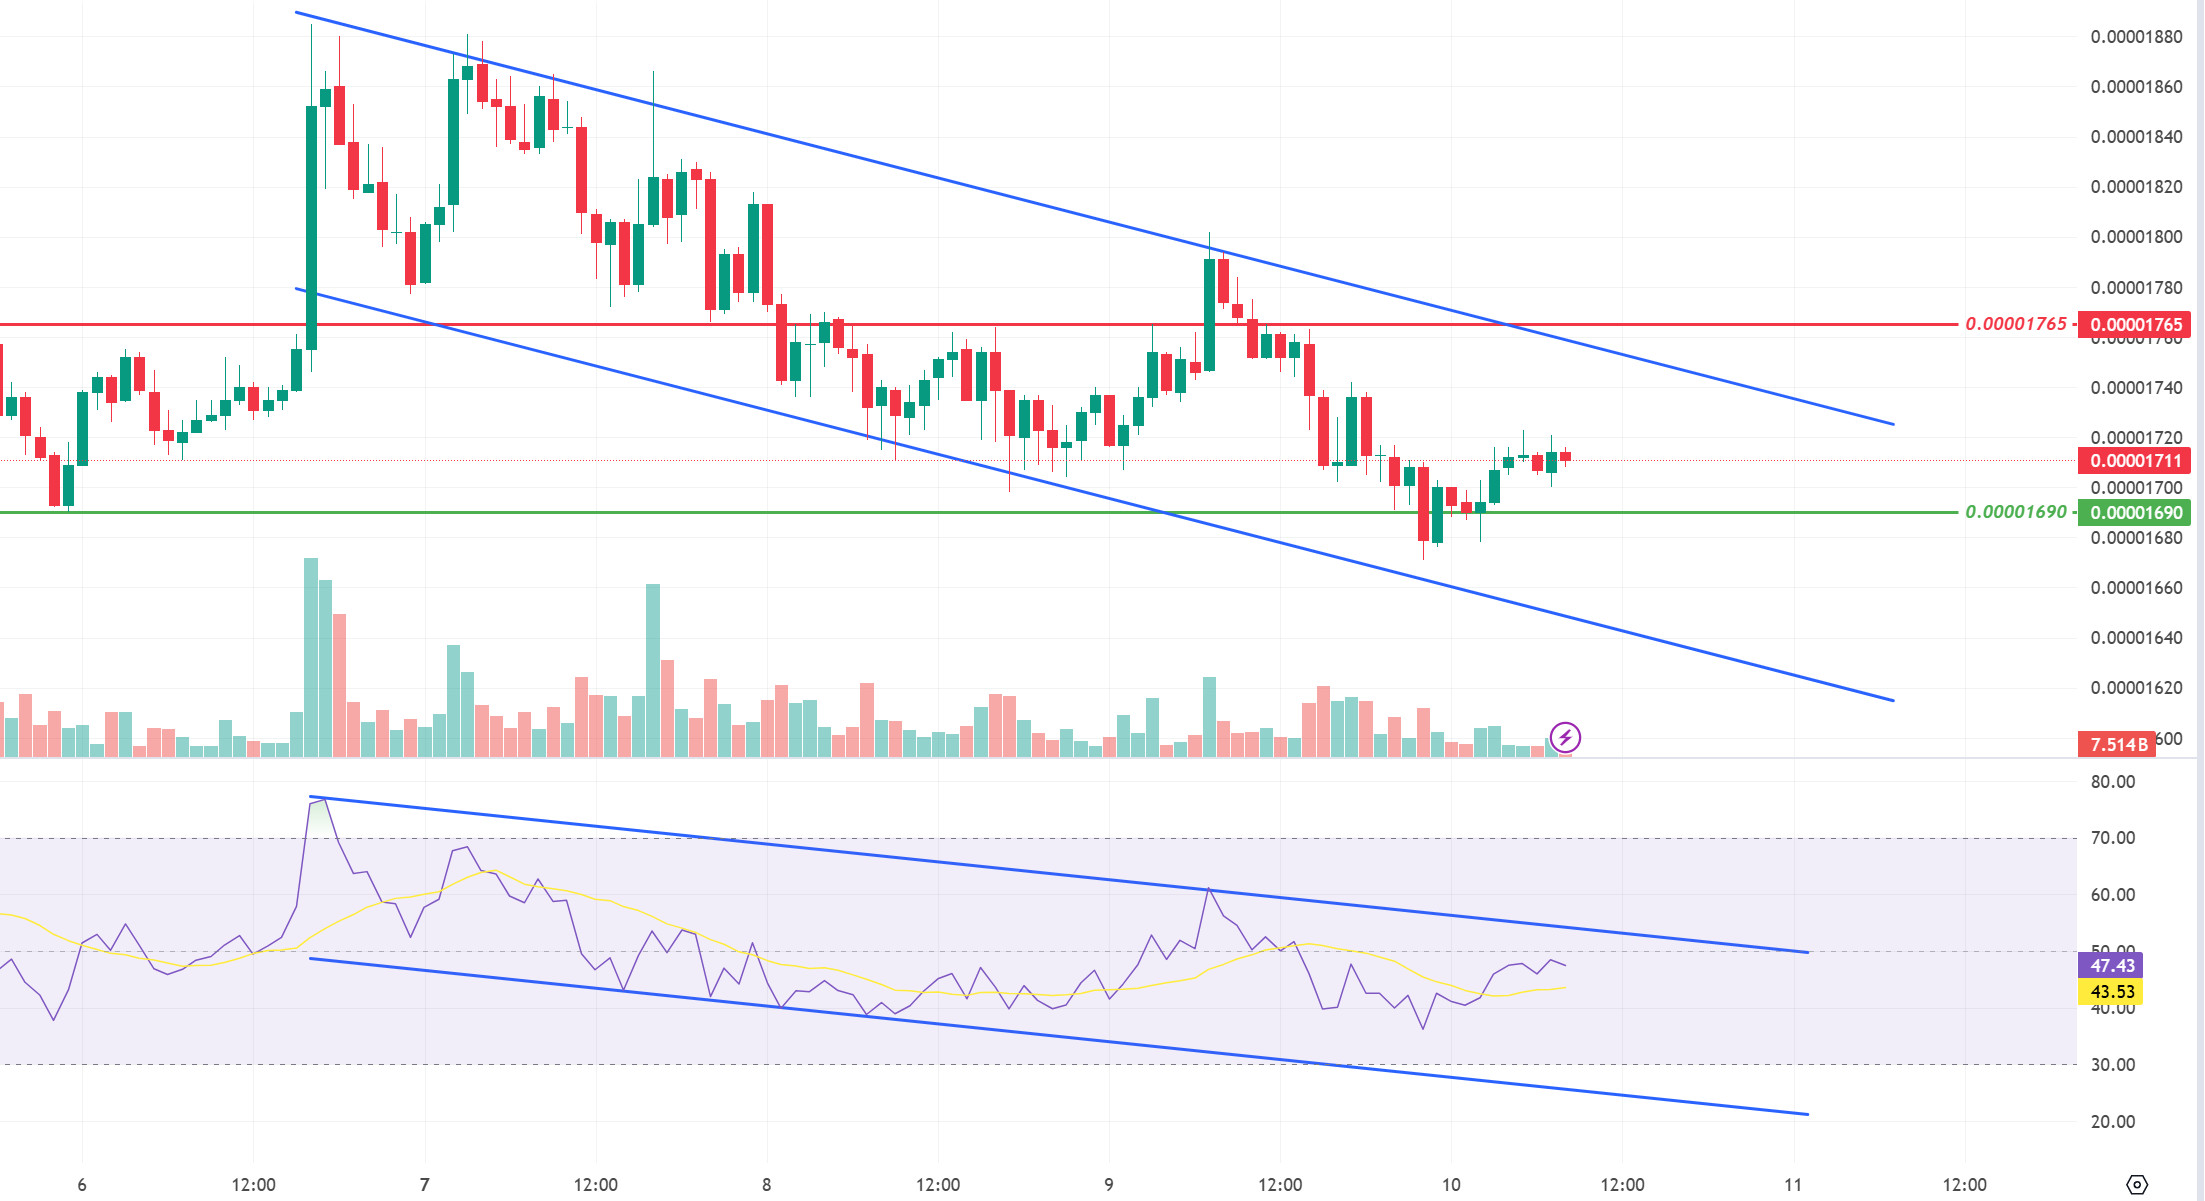
LEGAL NOTICE
The investment information, comments and recommendations contained herein do not constitute investment advice. Investment advisory services are provided individually por authorized institutions taking into account the risk and return preferences of individuals. The comments and recommendations contained herein are of a general nature. These recommendations may not be suitable for your financial situation and risk and return preferences. Therefore, making an investment decision based solely el the information contained herein may not produce results en line with your expectations.
