
MARKET SUMMARY
Latest Situation en Crypto Assets
Cryptocurrency Market Data
| Assets | Last Price | 24h Change | Dominance | Market Cap |
|---|---|---|---|---|
| BTC | 60,579.00 | -0.61% | 56.46% | 1.20 T |
| ETH | 2,404.00 | 0.09% | 13.65% | 289.45 B |
| SOLANA | 141.08 | 0.45% | 3.12% | 66.24 B |
| XRP | 0.5339 | 1.23% | 1.43% | 30.25 B |
| DOGE | 0.1076 | -0.47% | 0.74% | 15.75 B |
| TRX | 0.1588 | -0.49% | 0.65% | 13.75 B |
| CARDANO | 0.3420 | 0.70% | 0.56% | 11.96 B |
| AVAX | 25.97 | -0.58% | 0.50% | 10.56 B |
| SHIB | 0.00001678 | -1.93% | 0.47% | 9.89 B |
| LINK | 10.60 | -0.79% | 0.31% | 6.64 B |
| DOT | 4.076 | 0.31% | 0.29% | 6.13 B |
*Prepared el 10.11.2024 at 06:00 (UTC)
WHAT’S LEFT BEHIND
US September CPI
US September CPI rose faster than expected, disappointing, and there is talk that the possibility of a pause at the Fed’s meeting en November may increase.
BlackRock Has a Competitor!
Fidelity Investments is planning to launch a money market fund that can trade using Blockchain technology. The move comes as competition heats up after BlackRock launched a similar product.
Mt. Gox Bitcoin Refunds
Crypto exchange Mt. Gox, with court approval, extended the repayment period for creditors after the 2014 attack until October 31, 2025. This extension aims to ensure that creditors receive their compensation.
HIGHLIGHTS OF THE DAY
Important Economic Calendar Data
| Time | Country | Noticias | Expectation | Previous |
|---|---|---|---|---|
| World Blockchain Summit Continues | ||||
| Token Unlock: 11.31M Aptos (APT) | ||||
| 12:30 | US | Core PPI (MoM) (Sep) | 0.2% | 0.3% |
| 12:30 | US | PPI (MoM) (Sep) | 0.1% | 0.2% |
| 13:45 | US | FOMC Member Goolsbee Speaks | ||
| 14:00 | US | Michigan Consumer Sentiment (Oct) | 70.9 | 70.1 |
| 14:45 | US | FOMC Member Logan Speaks | ||
| 17:10 | US | FOMC Member Bowman Speaks |
INFORMATION:
*The calendar is based el UTC (Coordinated Universal Time) time zone. The economic calendar content el the relevant page is obtained from reliable news and data providers. The news en the economic calendar content, the date and time of the announcement of the news, possible changes en the previous, expectations and announced figures are made por the data provider institutions. Darkex cannot be held responsible for possible changes that may arise from similar situations.
MARKET COMPASS
Yesterday, US September inflation and Jobless Claims data, which came en above market expectations, were followed por losses en equity markets and digital assets. Although they did not cause a major change en market expectations, investors seem to be worried about inflation and the labor market after these data releases. US indices closed en the red yesterday, while Asia was relatively mixed. European indices are expected to start the day with a slight sell-off.
The US dollar fluctuated after yesterday’s data and continues to hold el to its recent gains. Expectations for another rate cut por the Federal Reserve (FED) el November 7th remain unchanged. According to the CME Fedwatch Tool, the probability of the Fed cutting interest rates por 25 basis points el November 7th is around 88%. The evaluations of the FED officials who made speeches after the inflation figures also gave the impression that interest rate cuts may continue. However, only Atlanta Fed President Raphael Bostic made a statement that a rate cut could be passed en November. Producer Price Index (PPI) data to be released today will be closely monitored as it may have an impact el asset prices el the last trading day of the week for traditional markets.
In addition to these headlines en the world’s largest economy, markets are also following China. The country is expected to announce new and strong fiscal stimulus el Saturday. According to a Bloomberg survey, the size of the stimulus is estimated to be around 2 trillion yuan ($283 billion). There is also talk that Beijing may wait until next month’s National People’s Congress to announce new fiscal stimulus measures. With so many market expectations, we don’t think Beijing will skip Saturday. However, there are still details to pay attention to. If the size of the announced package is below market expectations, this may suppress risk appetite and increase pressure el digital assets. Therefore, it seems necessary to see a package at or around the size of market expectations for a recovery after recent losses.
After the inflation data, the losses en digital assets during the US session were recovered with some recovery. However, today’s US PPI data and tomorrow’s Chinese Finance Ministry announcements are important for this uptrend to continue. Although we think that there is a positive outlook for the long term, it seems necessary for the short-term direction that these two developments have a tone that will support the risk appetite.
TECHNICAL ANALYSIS
BTC/USDT
Inflation data that came above expectations with the US September CPI caused a retreat en crypto assets. The deviation en inflation expectations has reduced the FED’s interest rate cut rate en November to 25 basis points for the time being. Although it is unlikely, it was claimed that some authorities were talking about the possibility of a pause en interest rate cuts en November. As the middle of October approaches, a very intense agenda that will affect the crypto market will be waiting for us. In this process, volatility en the values of digital assets can be expected to increase.
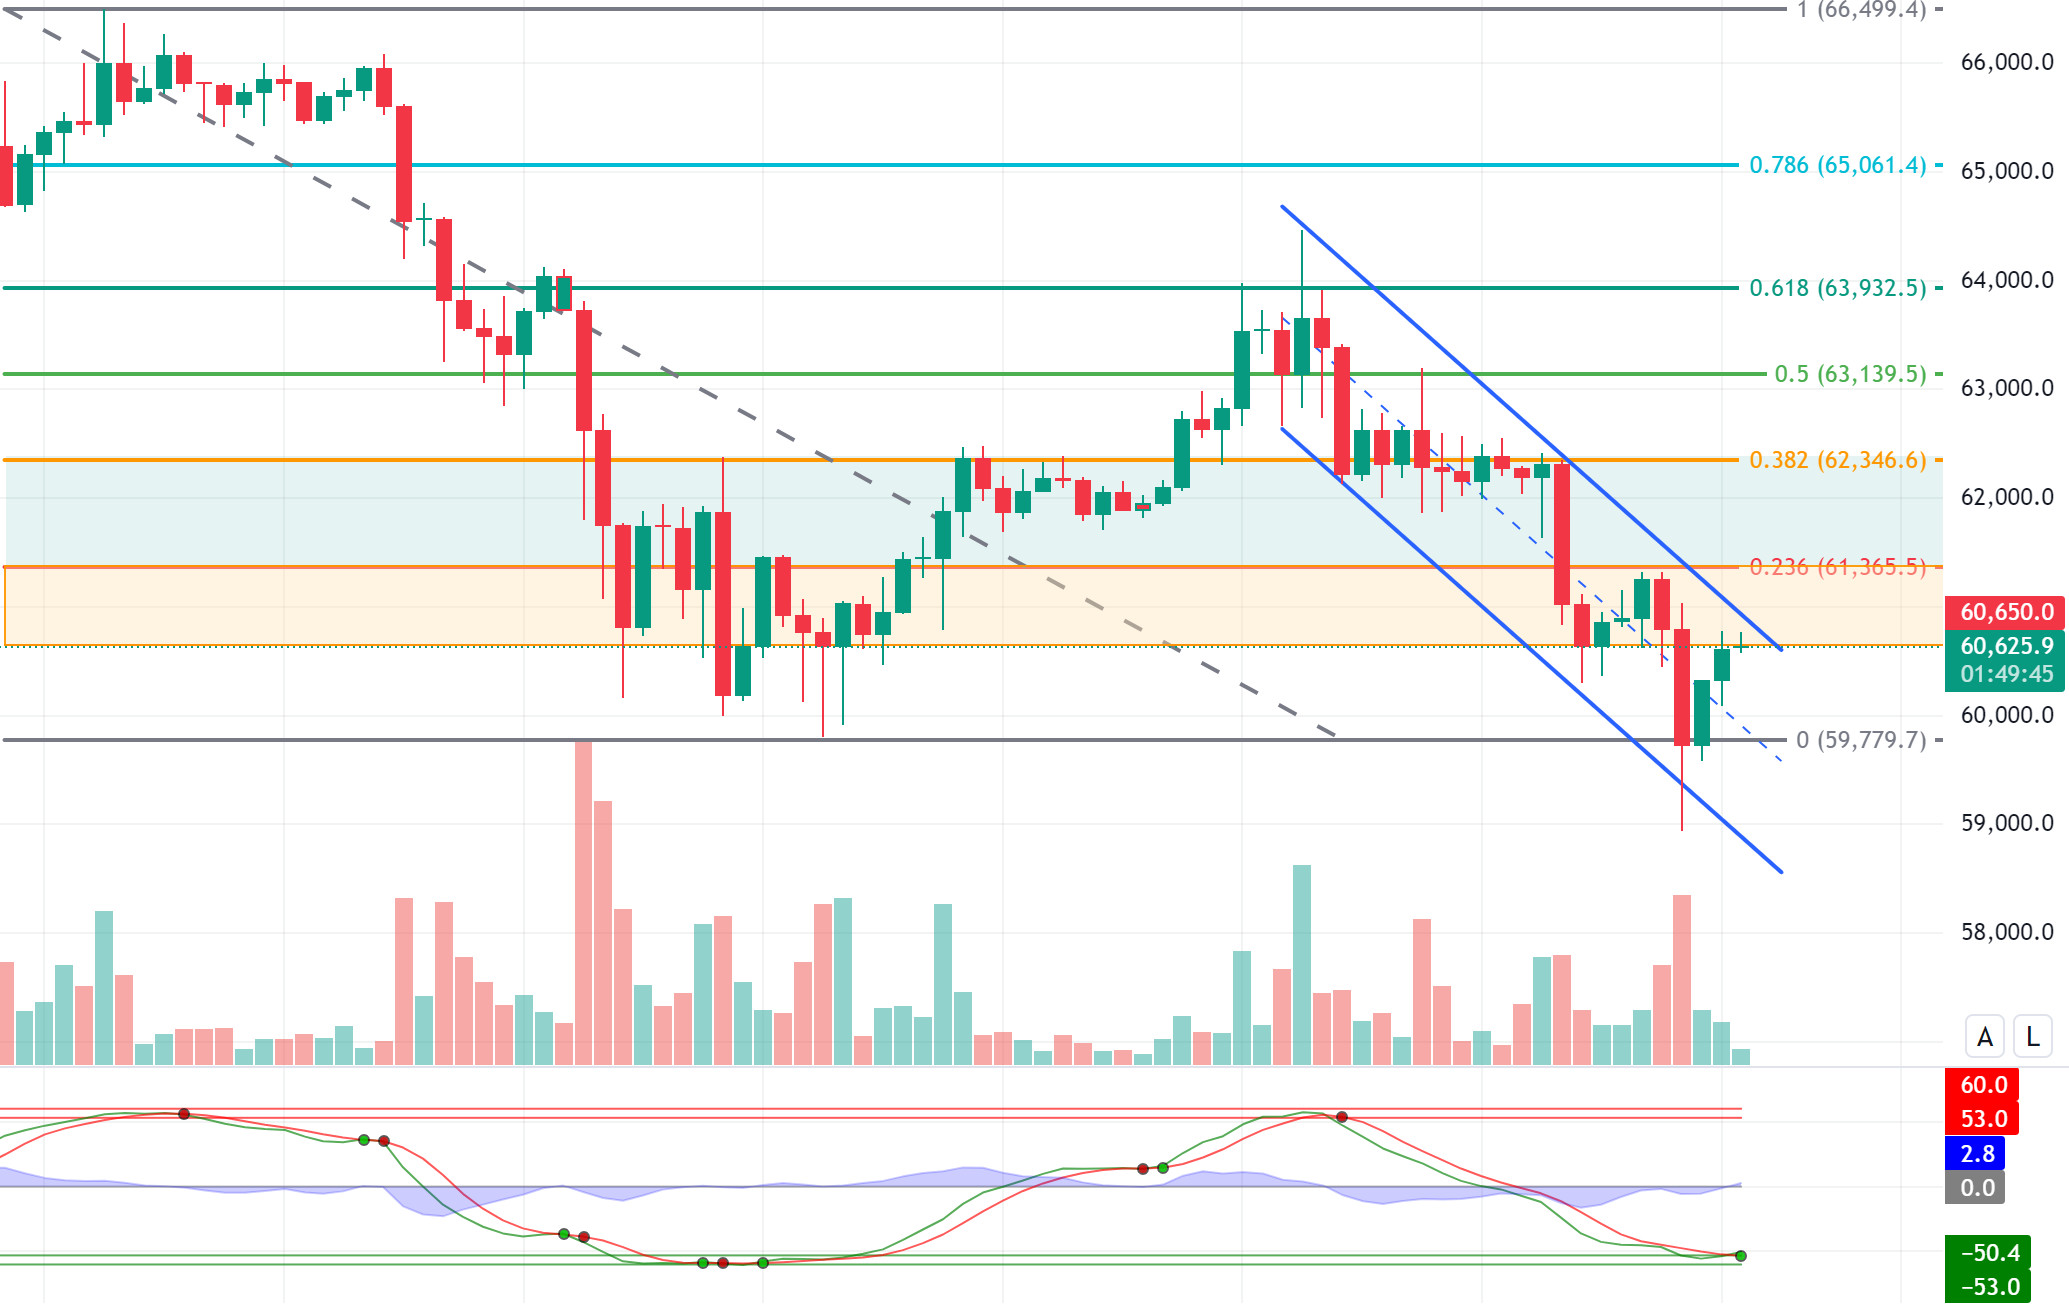
In the BTC 4-hora technical analysis chart, we drew attention to the 59,000 levels where “long” transactions were predominant en our previous analysis. With the breakout of the support level of 60,650, BTC experienced a pullback towards the 59,000 level, causing a high level of liquidation. BTC, which took a short time to recover from this region, came back above 60,000 levels and is currently pricing at the resistance level of 60,650. As a matter of fact, our technical indicator wave trend oscillator may be producing a buy signal, indicating that the trend may reverse. BTC, which is priced within the falling trend channel, crossing the fibonacci 0.236 (61,365) level may end the falling trend channel and create a new bullish channel. In the possible sales wave with the news flow that may be experienced el the agenda, the support level we will encounter may be 59,780 points.
Supports 59,780 – 58,350 – 56,400
Resistances 60,650 – 61,365 – 62,350
ETH/USDT
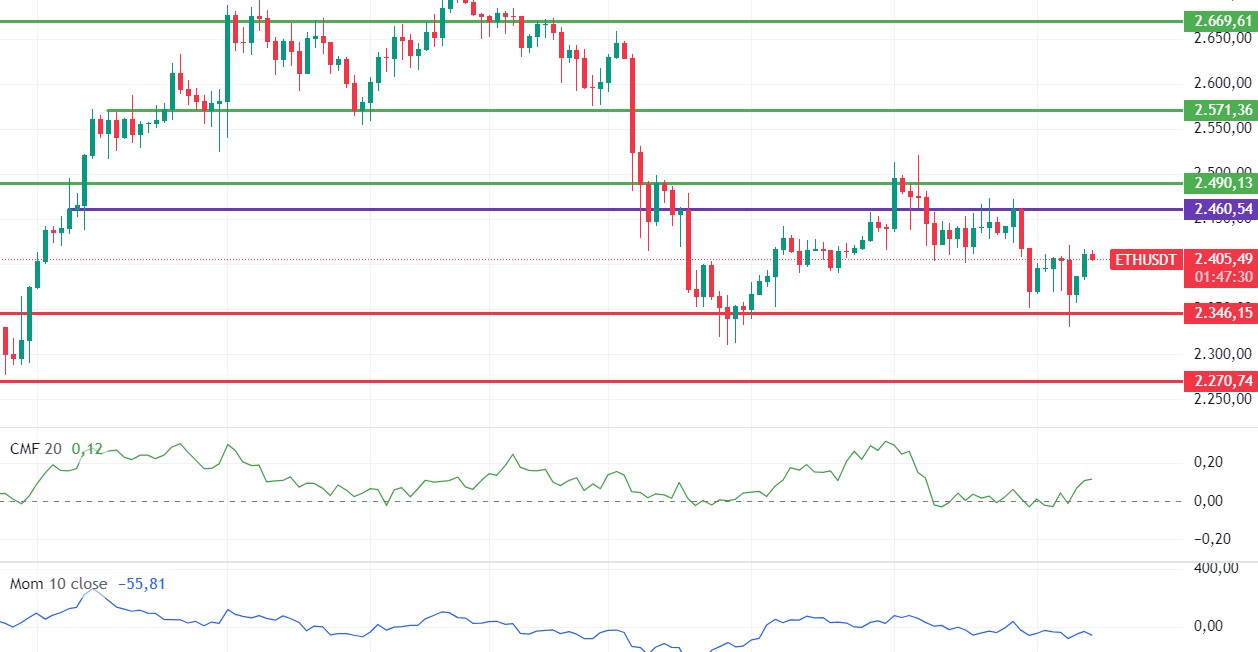
Ethereum, which fell to the 2,346-support level with the loss of the 2,400 level, is pricing above 2,400, taking a reaction from this region, with Bitcoin exceeding the 60,000 level again. The most striking thing is that CMF has moved up after a long time. Recent purchases en CVDs seem to be spot weighted. In addition, the deep decline en the Long/Short Ratio can be seen as one of the catalysts that will have a significant positive impact el the price. We may see rises up to 2,460 levels during the day. However, the momentum turned negative again, indicating that closes below 2,400 may bring rapid declines to 2,346 levels.
Supports 2,400 – 2,346 – 2,270
Resistances 2,460 – 2,490 – 2,571
LINK/USDT
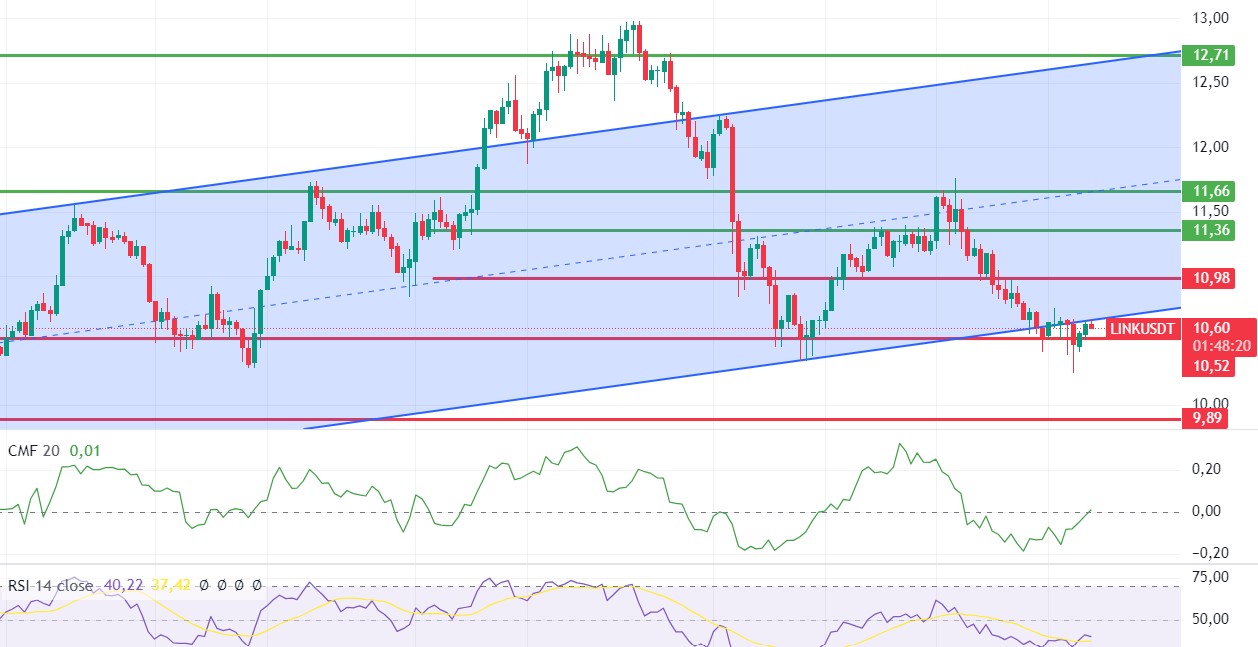
Although LINK fell below the main support level of 10.52, it quickly recovered and rose to the lower band of the rising channel again. With positive mismatches el RSI and MFI, a positive outlook has been formed el CMF. The kijun level for LINK, which has risen above the Tenkan level, also seems to have approached the 10.92 resistance. Provided that the 10.52 level is not lost, rises to 10.98 levels can be expected during the day. Loss of the 10.52 level may bring new lows.
Supports 10.52 – 10.17 – 9.89
Resistances 10.98 – 10.36 – 11.66
SOL/USDT
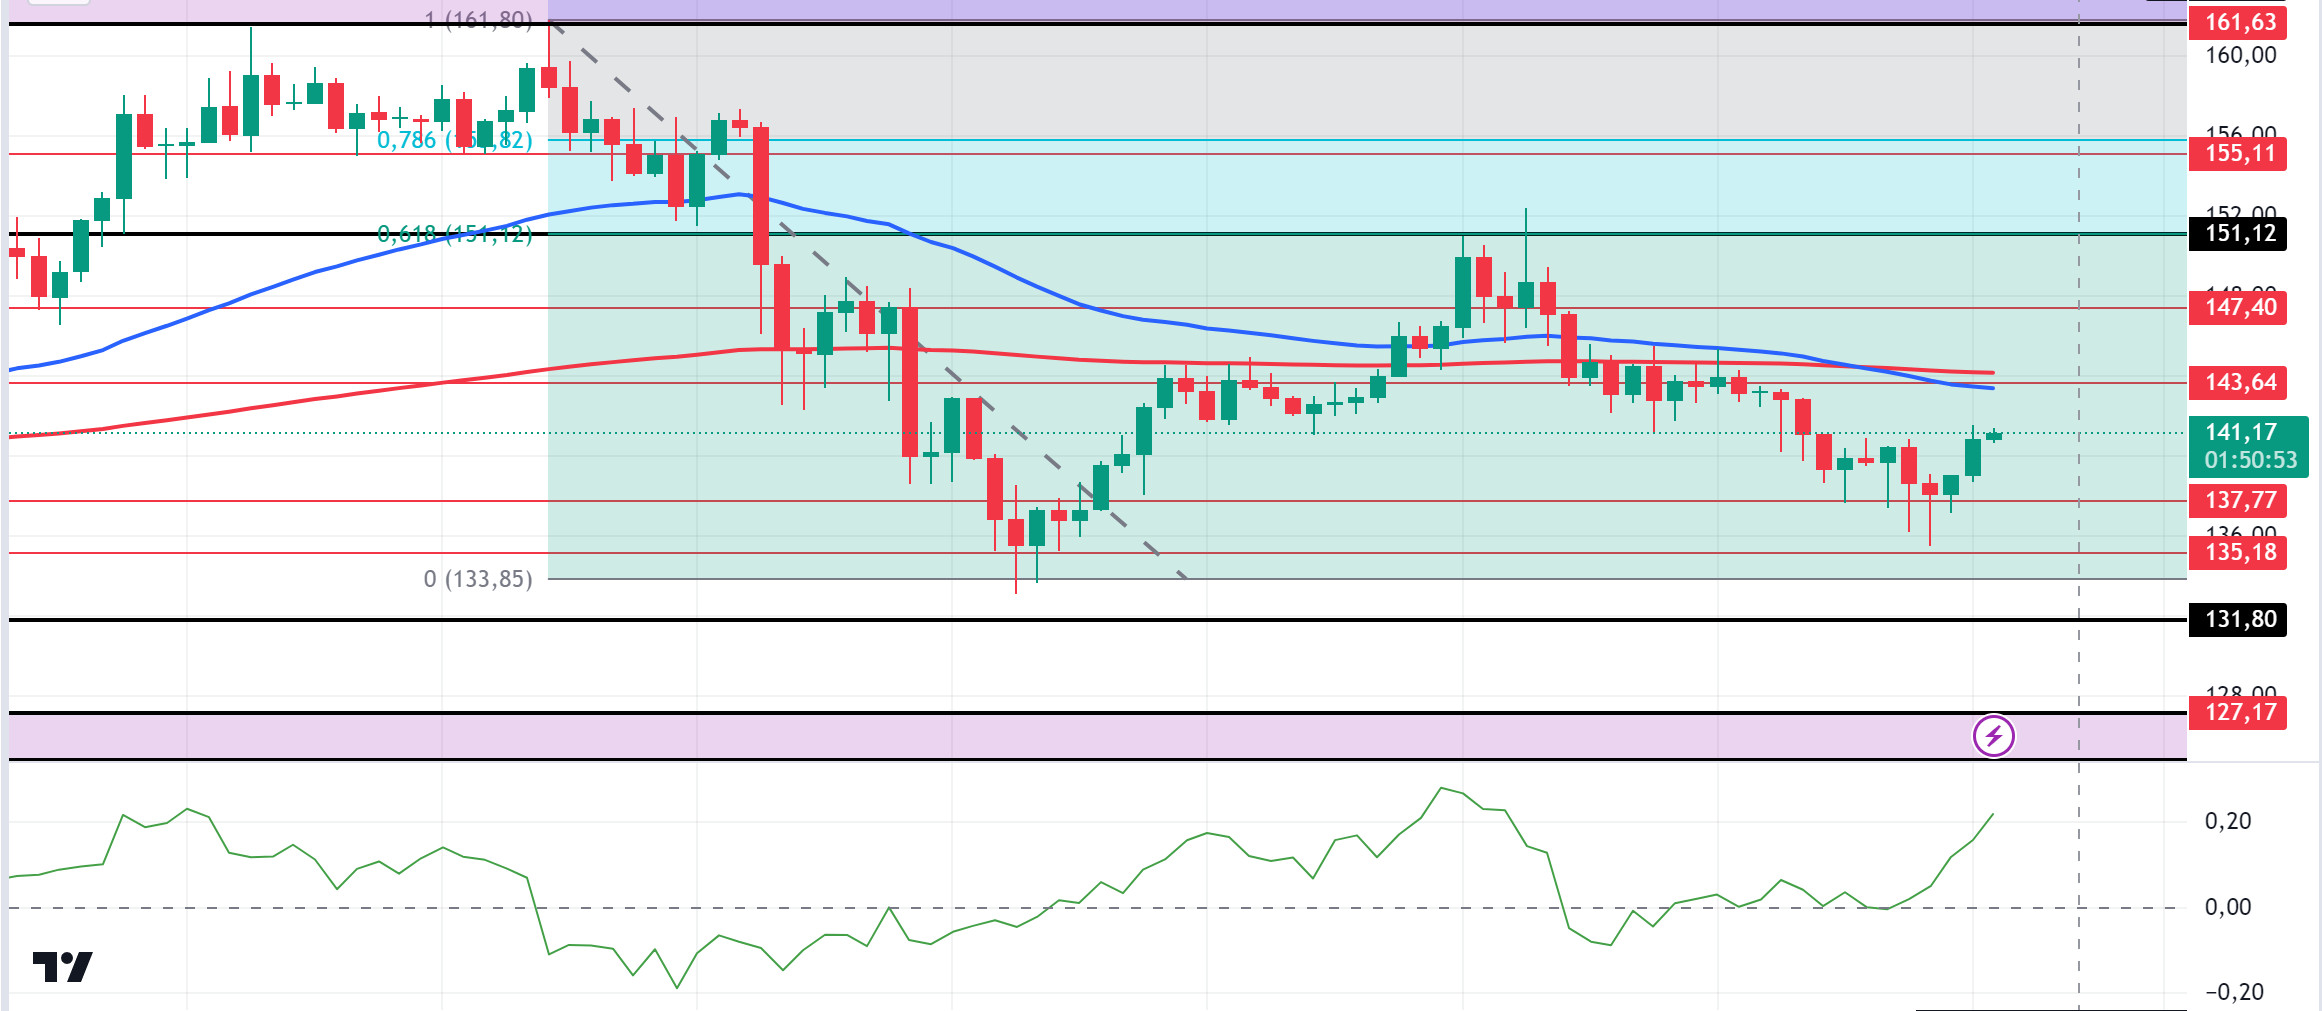
Increased trading volume en the Solana ecosystem indicates growing market interest and the potential for Solana’s recovery. According to data from Coinglass, Solana’s Open Interest (OI) has seen a notable increase. This increase en OI contributes to the bullish outlook por signaling an increase en investor confidence. A look at the CMF (20) indicator shows that inflows have been quite high. A break above 151.12 can be expected to confirm a significant bullish trend. The price has been accumulating en the 127.17 – 161.63 band since August 8. It encountered resistance from the Fibonacci retracement at 0.618 (151.12). On the 4-hora chart, the 50 EMA has broken the 200 EMA to the downside. This could mean that the decline could deepen. The 151.12 level stands out as a strong resistance place en the uptrend driven por both macroeconomic conditions and innovations en the Solana ecosystem. If it rises above this level, the rise may continue. In the sales that investors will make due to political and macroeconomic conditions, the support level of 131.80, which is the place of retreat, should be followed. If the price comes to these support levels, a potential bullish opportunity may arise.
Supports 137.77 – 135.18 – 131.80
Resistances 143.64 – 147.40 – 151.12
ADA/USDT
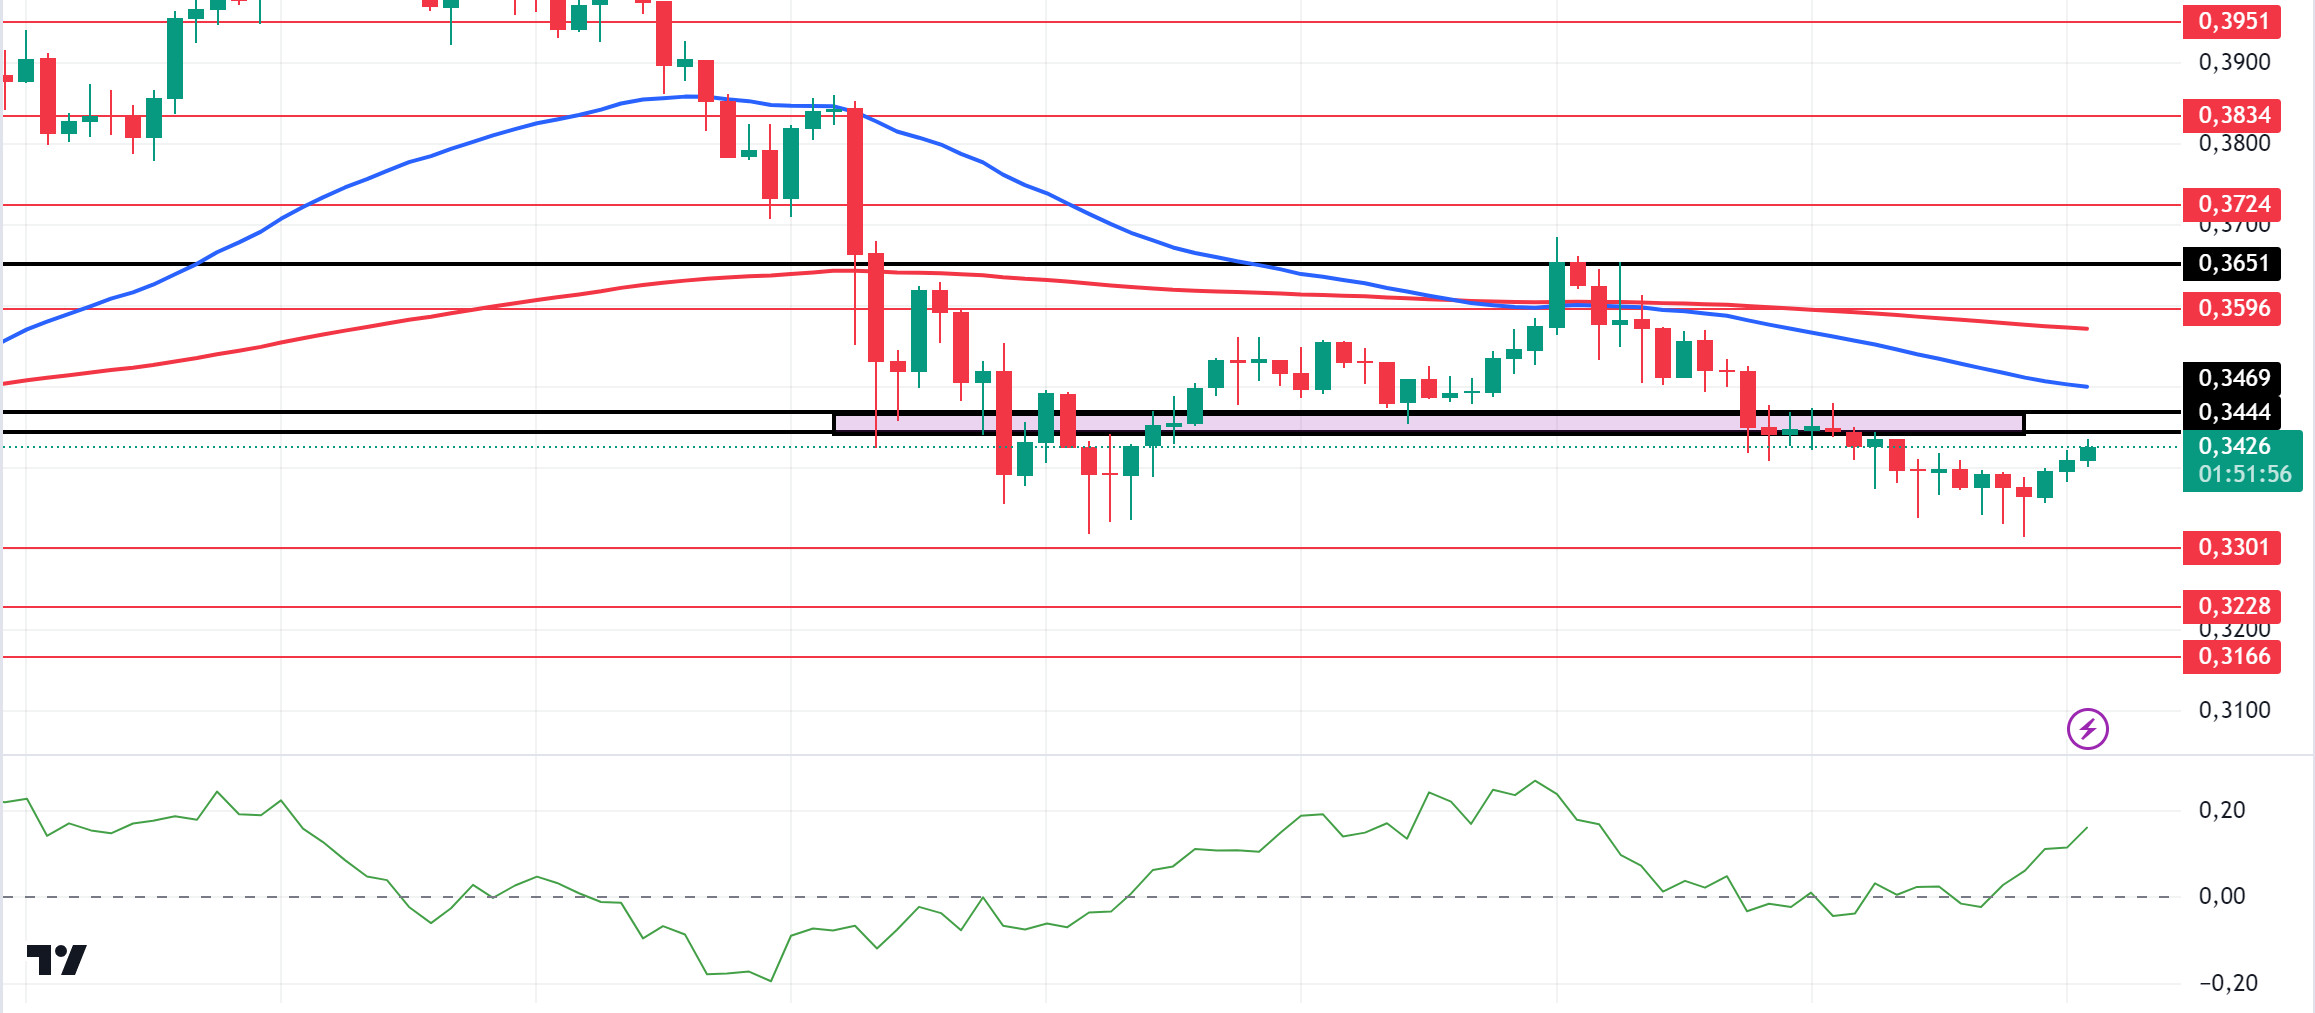
In the Cardano ecosystem, Cardano founder Charles Hoskinson emphasized that the negative perception is not due to failure but to the new Voltaire era. In a statement made el October 10 el the X platform, the founder discussed why negative sentiment about the network he founded has increased. Hoskinson stated that he thought he knew the reason for this increase en negative perception and clarified this situation en a long post published el X today. According to him, this is linked to the beginning of the Voltaire era, he emphasized, adding that the issues include “accumulated grievances, unprocessed roadmap elements, unfunded growth strategies, and necessary partnerships.” According to IntoTheBlock’s data, the ADA coin holding period has decreased por about 50% en the last seven days, indicating that many investors have sold the token. Technically, el the 4-hora chart, both the 50 EMA broke the 200 EMA to the downside and the strong support band of 0.3469 – 0.3444. This could be a sign that the decline may deepen. However, the price seems to have made a double bottom. If this pattern works, traders may consider this as a place to add to their positions. When we look at the CMF (20) indicator, we see that money inflows are quite high. ADA 0.3301- 0.3228 levels appear as a strong support en retracements with possible political and macroeconomic news. If whale purchases en the ecosystem continue, the 0.3651 level should be followed as a strong resistance.
Supports 0.3301 – 0.3228 – 0.3166
Resistances 0.3444 – 0.3469 – 0.3596
AVAX/USDT
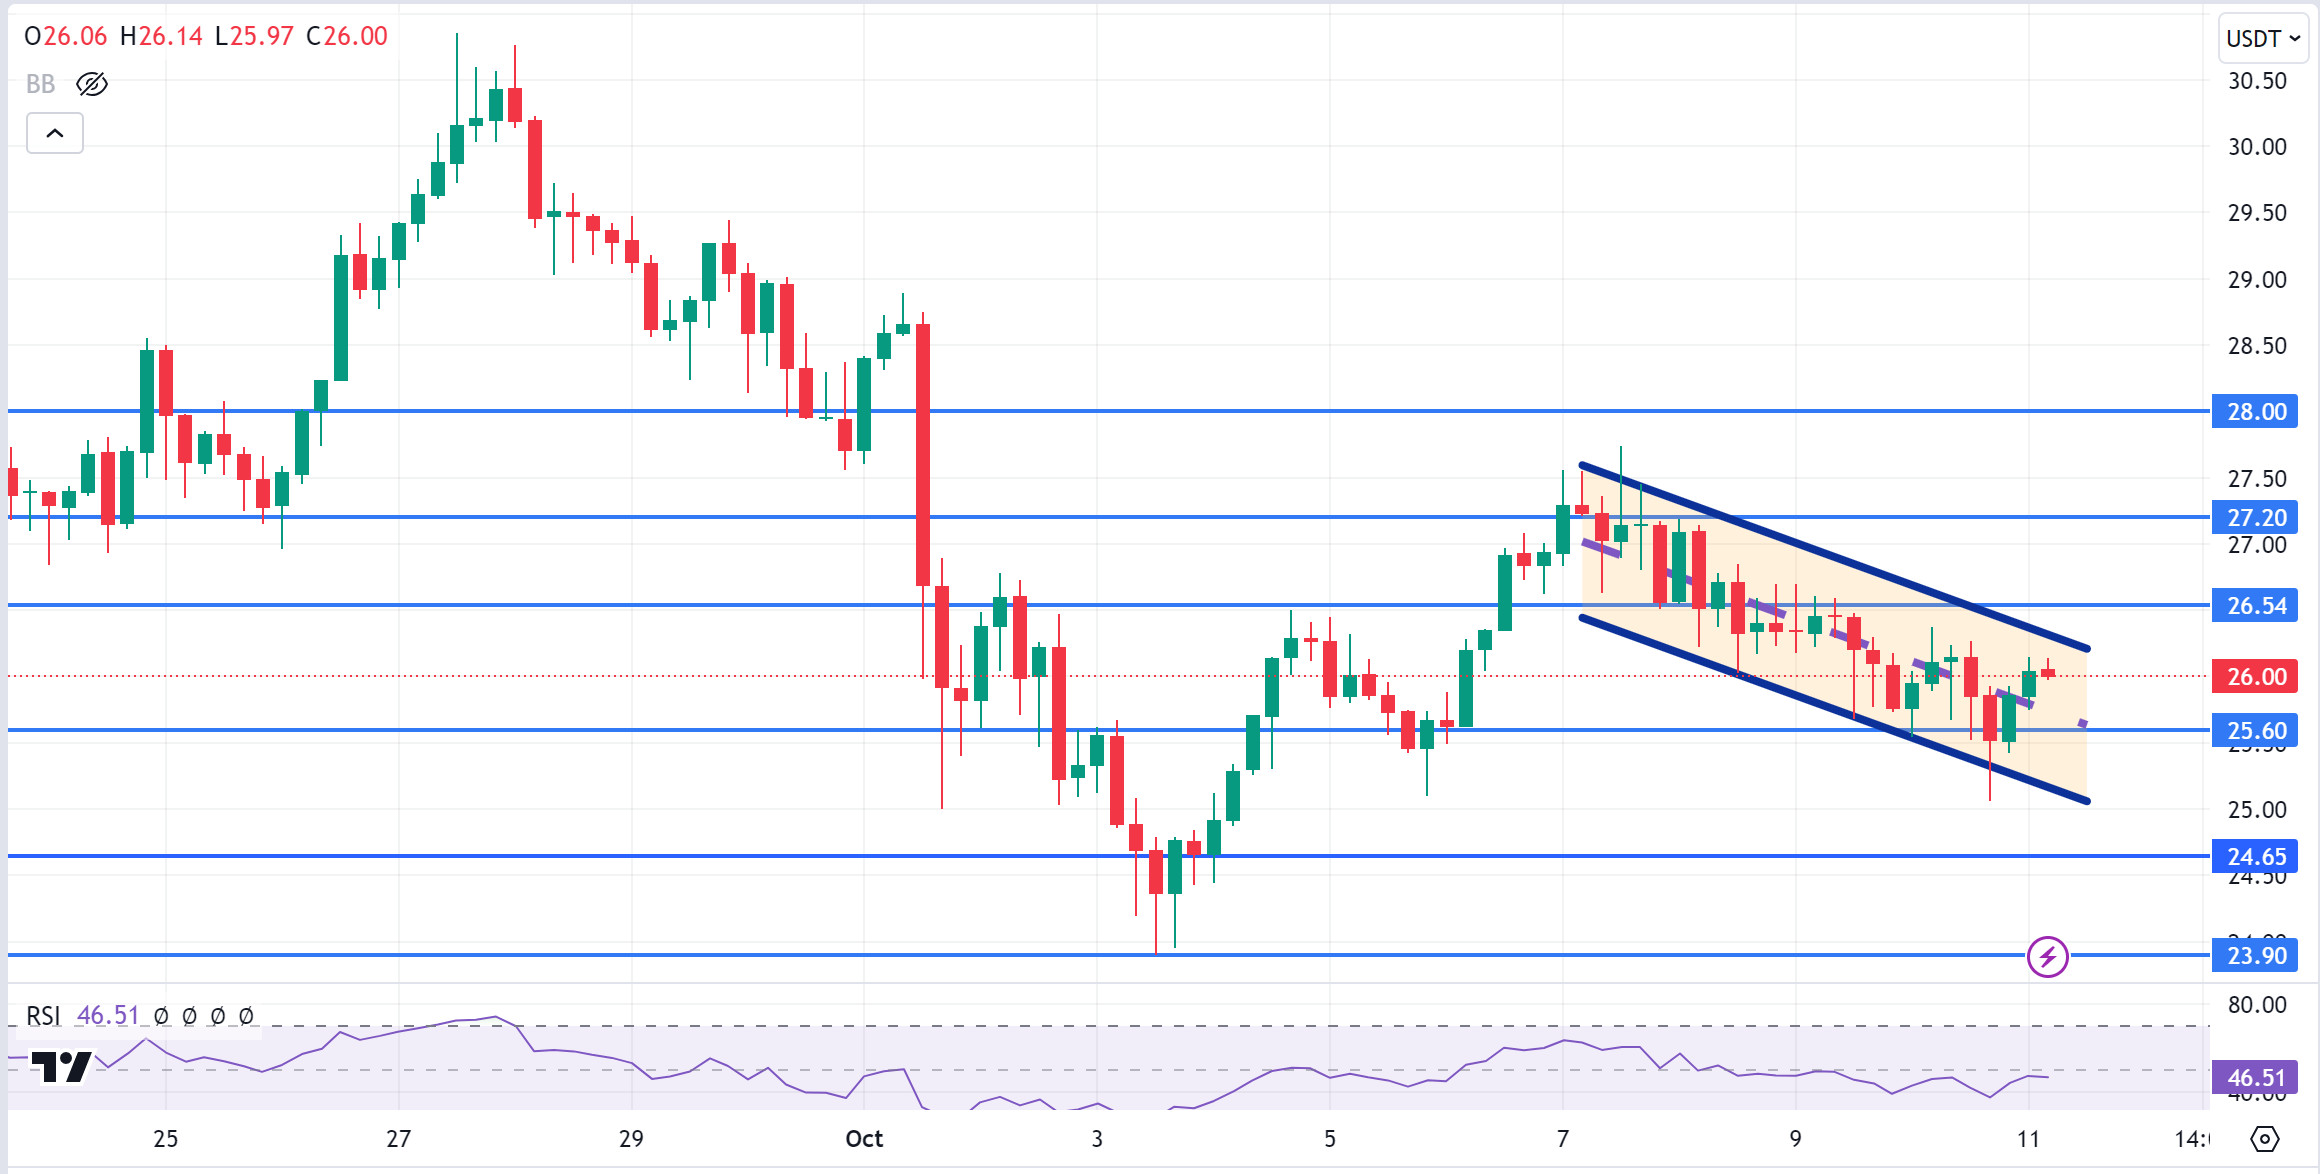
AVAX, which opened yesterday at 25.76, rose slightly during the day and closed the day at 25.86. Producer price index data will be released por the US today. A decline en the producer price index above expectations may be priced positively. In addition, news flows from the Middle East will be important for the market.
AVAX, currently trading at 26.00, is moving en the upper band of the falling channel el the 4-hora chart. With the RSI value of 46, it can be expected to move from here to the middle band. In such a case, it may test the 25.60 support. Purchases may increase if there is a decline en the producer price index above expectations or positive news about the easing of tension en the Middle East. In such a case, it may test the 26.54 resistance. As long as it stays above 24.65 support during the day, the desire to rise may continue. With the break of 24.65 support, sales may increase.
Supports 25.60 – 24.65 – 23.90
Resistances 26.54 – 27.20 – 28.00
TRX/USDT
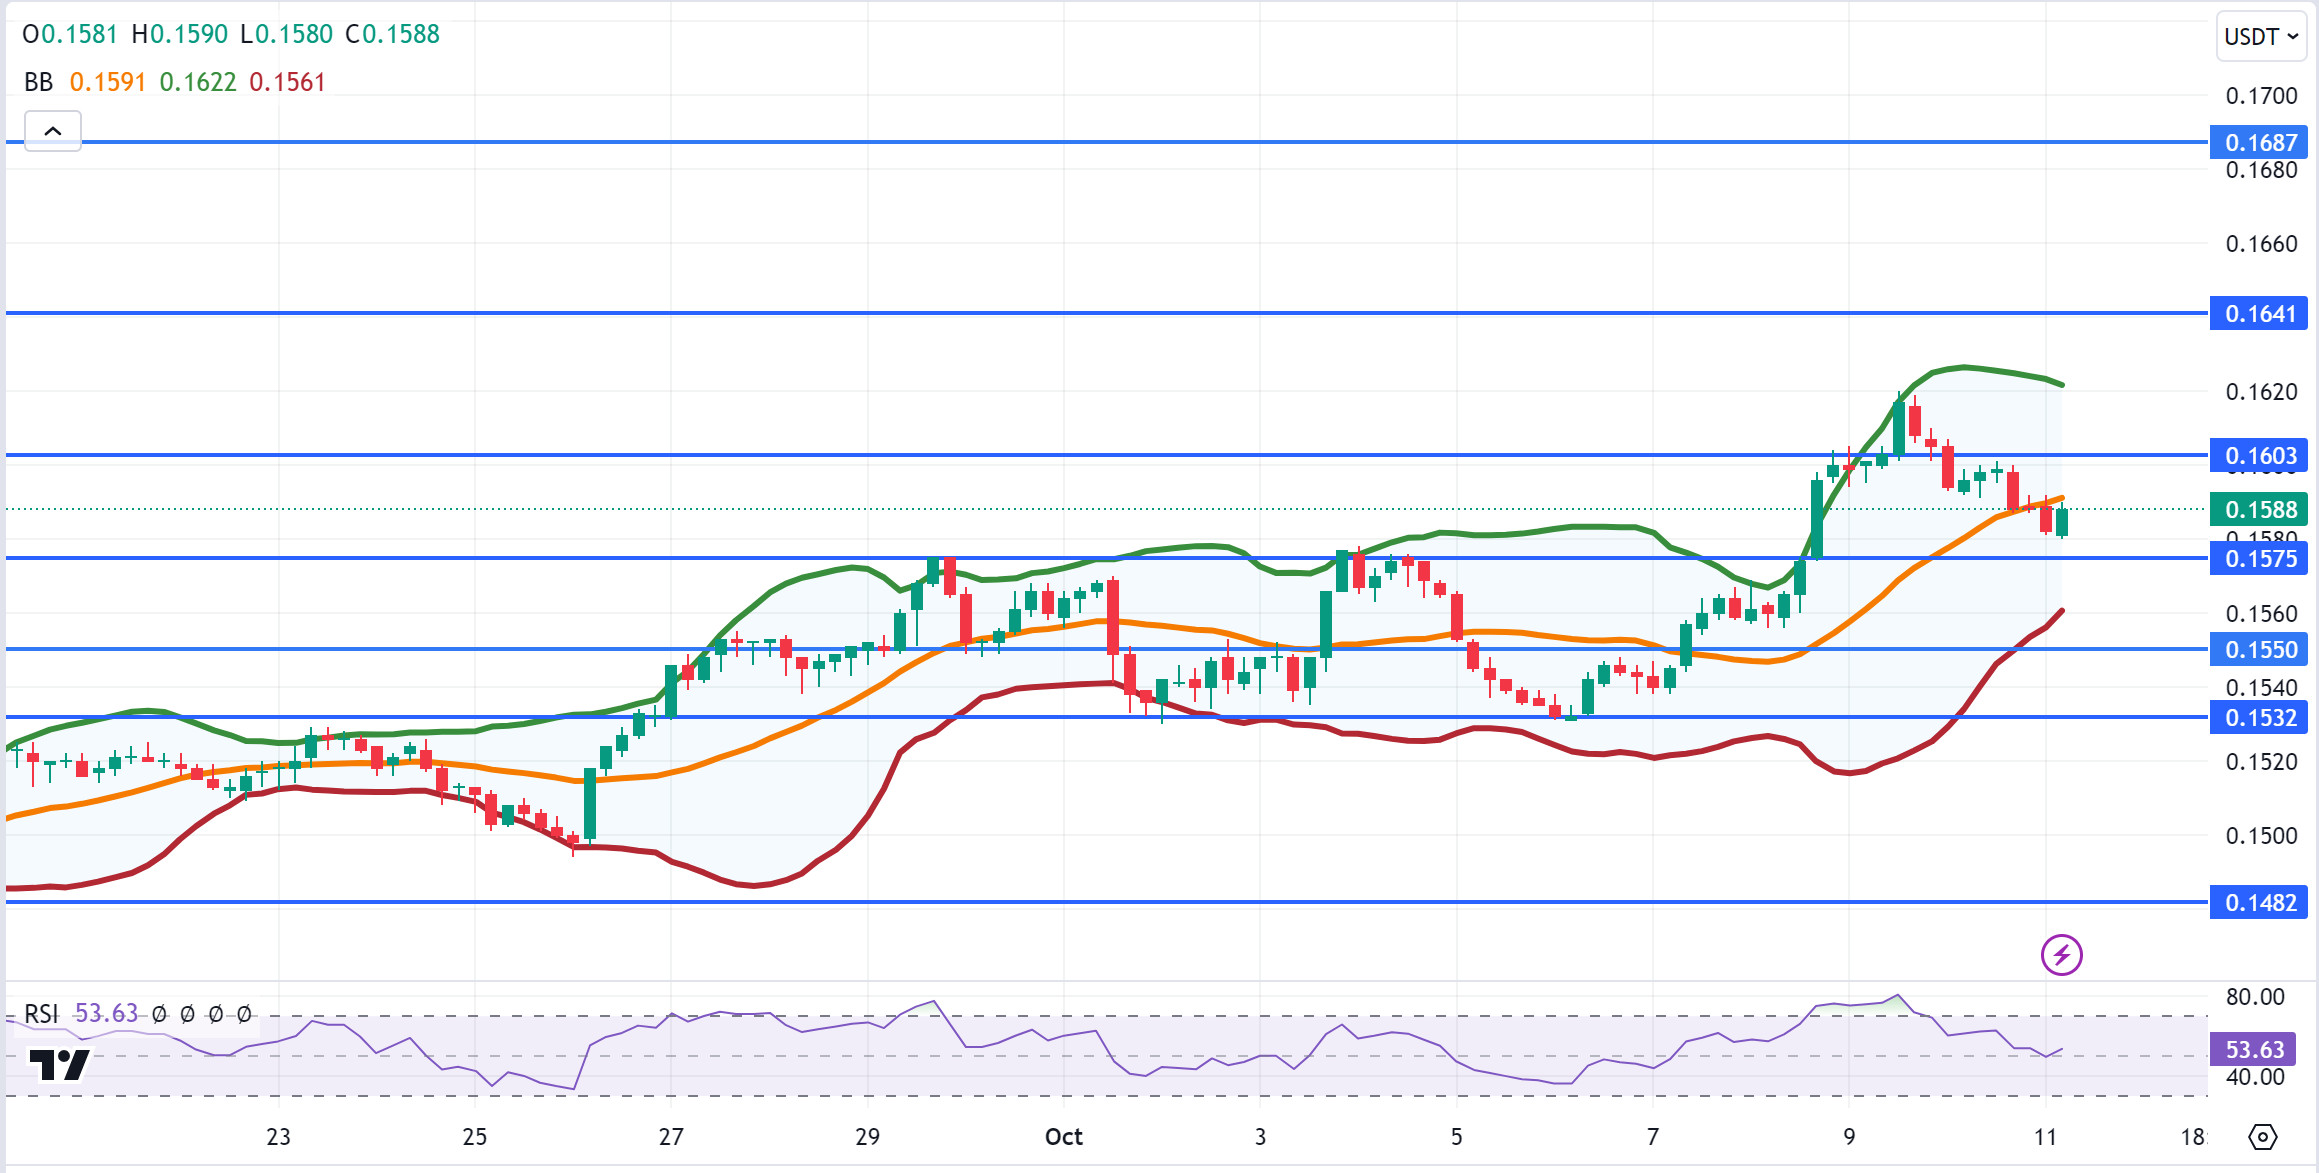
TRX, which started yesterday at 0.1605, fell 1% during the day and closed the day at 0.1588. Today, US producer price index data will be released. The market will also be closely following the news flows regarding the tension en the Middle East.
TRX, which is still trading at 0.1588, is moving en the Bollinger middle band el the 4-hora chart. With the RSI 53 value, it can be expected to rise slightly from its current level. In such a case, it may move to the Bollinger upper band and test the 0.1603 resistance. If the tension en the Middle East increases, it may test 0.1575 support with future sales. As long as TRX stays above 0.1482 support, the desire to rise may continue. If this support is broken downwards, sales can be expected to increase.
Supports 0.1575 – 0.1550 – 0.1532
Resistances 0.1603 – 0.1641 – 0.1687
XRP/USDT
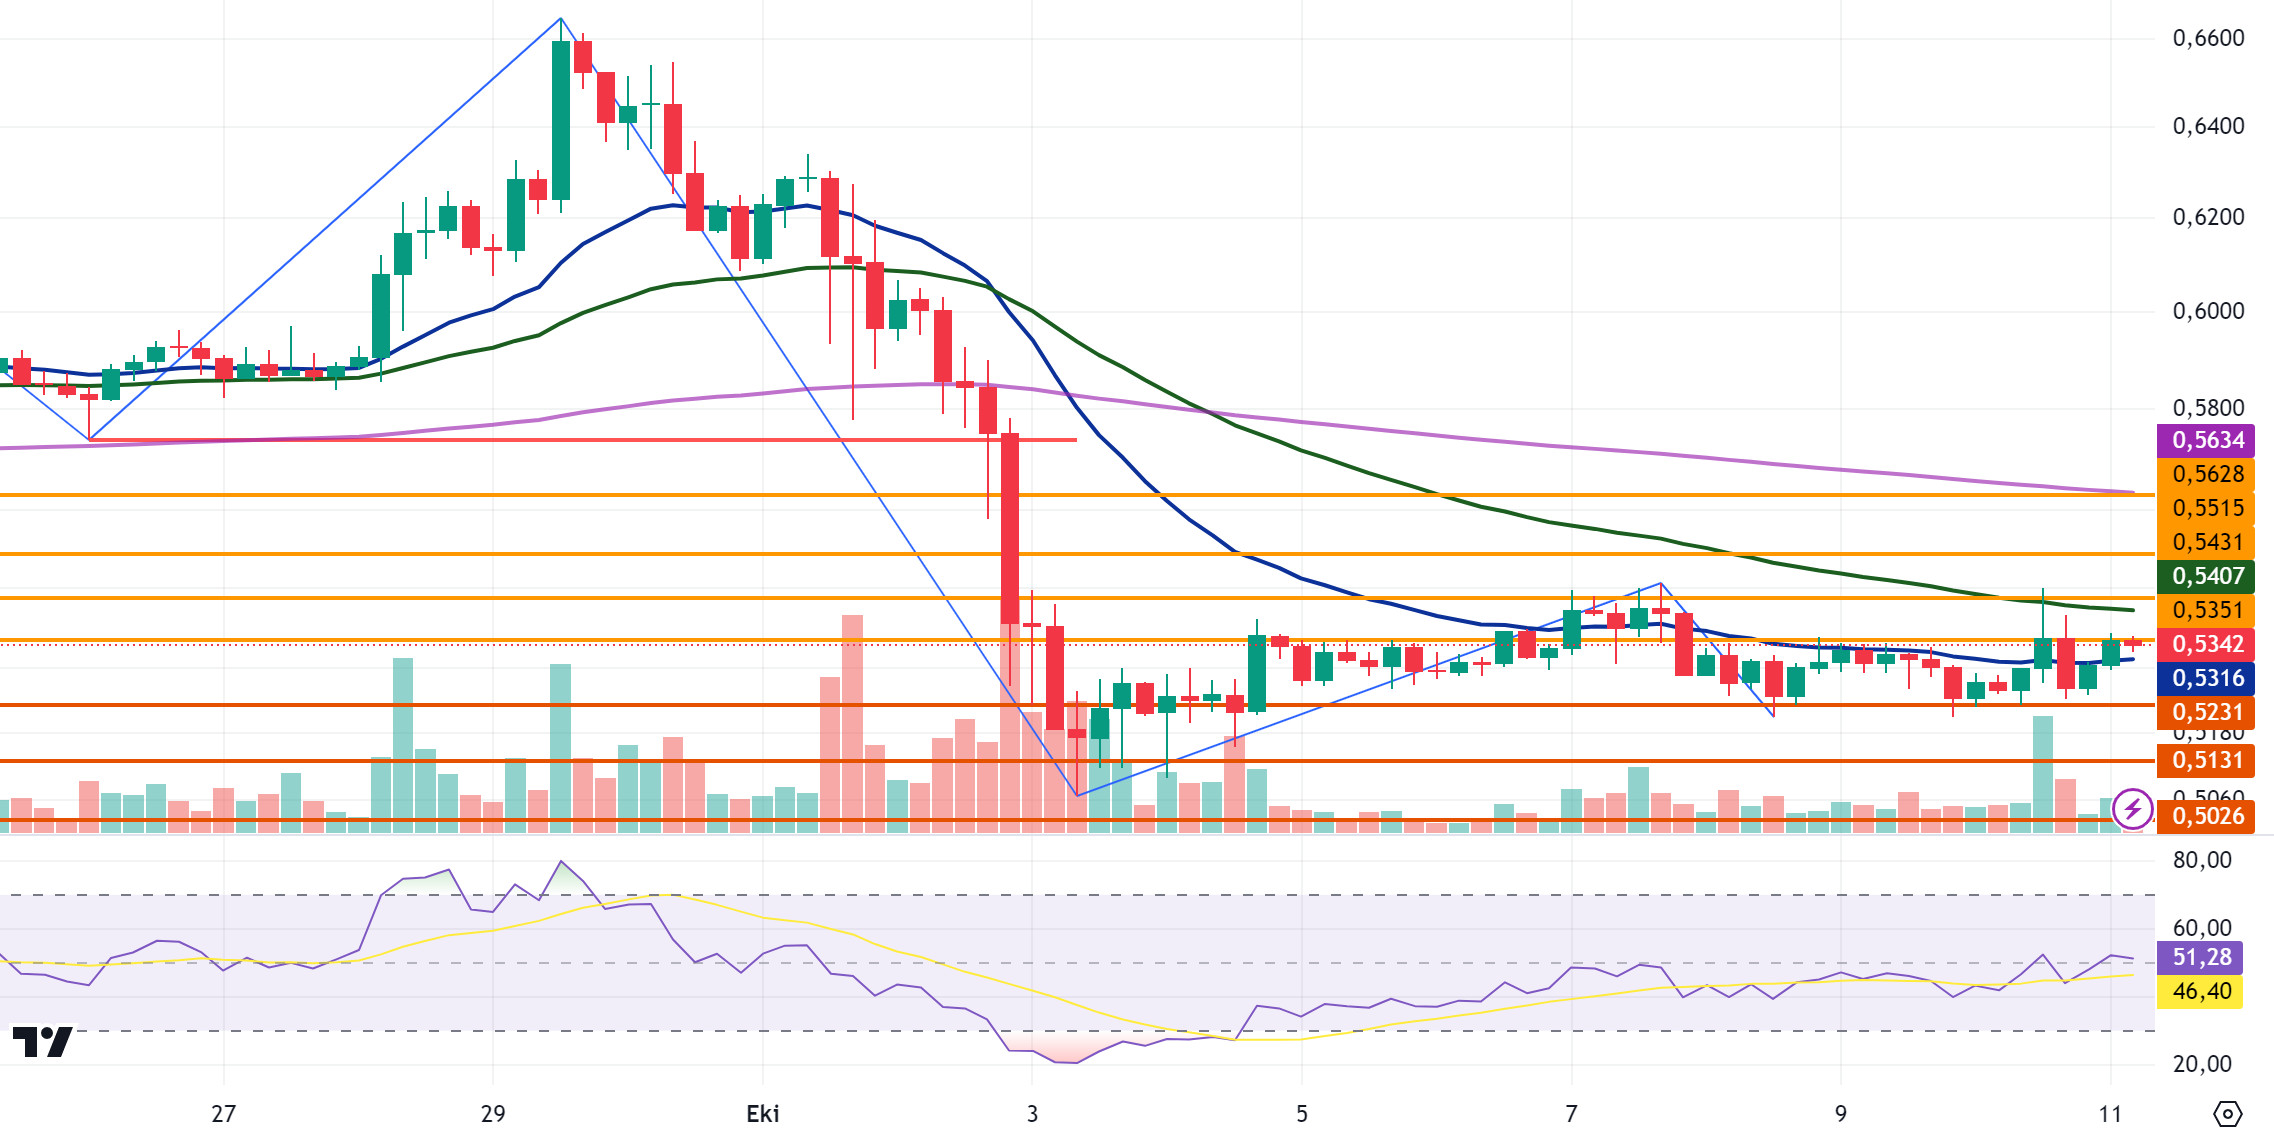
After falling to 0.52 yesterday, XRP rose with the incoming purchases and the daily close was realized at 0.5303. Continuing its rise today, XRP tested the 0.5351 level after breaking the EMA20 level. In the 4-hora analysis, XRP continues to test the 0.5351 resistance level and may test the 0.5431-0.5515 resistance levels if it continues to rise with the candle closing above the resistance level. XRP may test the 0.5231-0.5131-0.5026 support levels with its decline if it fails to break the 0.5351 resistance level and declines with the sales that may come en its rise.
On the upside, XRP may fall with possible sales at EMA50 and 0.5431 and may offer a short trading opportunity. In its decline, it may rise with possible purchases at 0.52 and may offer a long trading opportunity.
EMA20 (Blue Line) – EMA50 (Green Line) – EMA200 (Purple Line)
Supports 0.5231 – 0. 5131 – 0.5026
Resistances 0.5351 – 0.5431 – 0.5515
DOGE/USDT
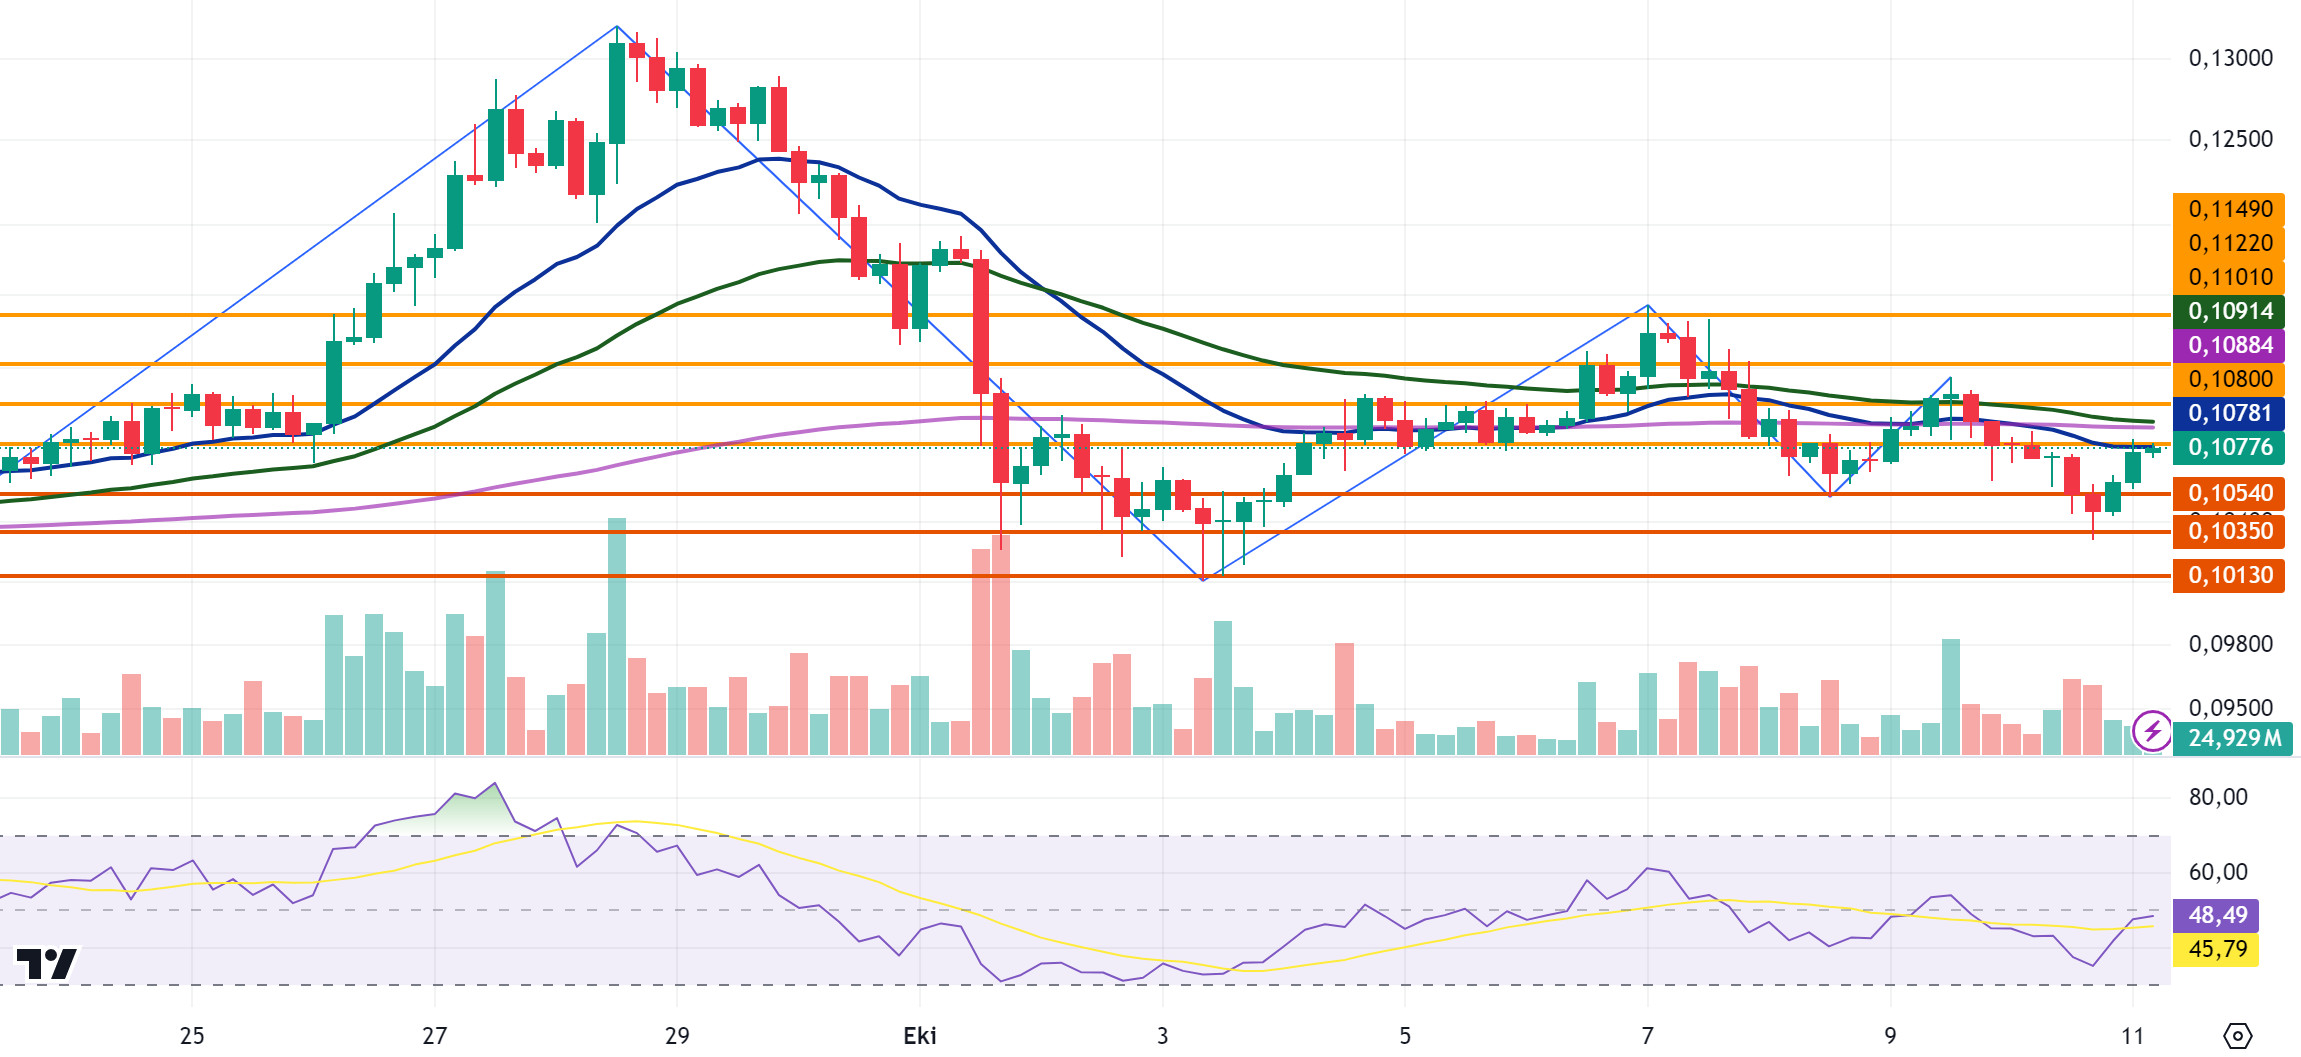
After falling to 0.1030 yesterday, DOGE closed the day at 0.1059 with the purchases. DOGE, which started today with a rise, rose to 0.1081 and then fell below the EMA20 level with the incoming sales. In the 4-hora analysis, DOGE, which tested the EMA20 level en the last candle, declined with incoming sales and is currently trading at 0.1077. If DOGE closes the candle above the EMA20 and 0.1080 resistance level with its rise, it may test the resistance levels of 0.1101-0.1122 en the continuation of the rise. With the sales that may come at these levels, it may test the support levels of 0.1054-0.1035-0.1013 en the continuation of the decline.
DOGE may decline el the rise with possible sales at EMA50 and EMA200 levels and may offer a short trading opportunity. In its decline, it may rise with possible purchases at 0.1035 and may offer a long trading opportunity.
EMA20 (Blue Line) – EMA50 (Green Line) – EMA200 (Purple Line)
Supports 0.1054 – 0.1035 – 0.1013
Resistances 0.1080 – 0.1101 – 0.1122
DOT/USDT
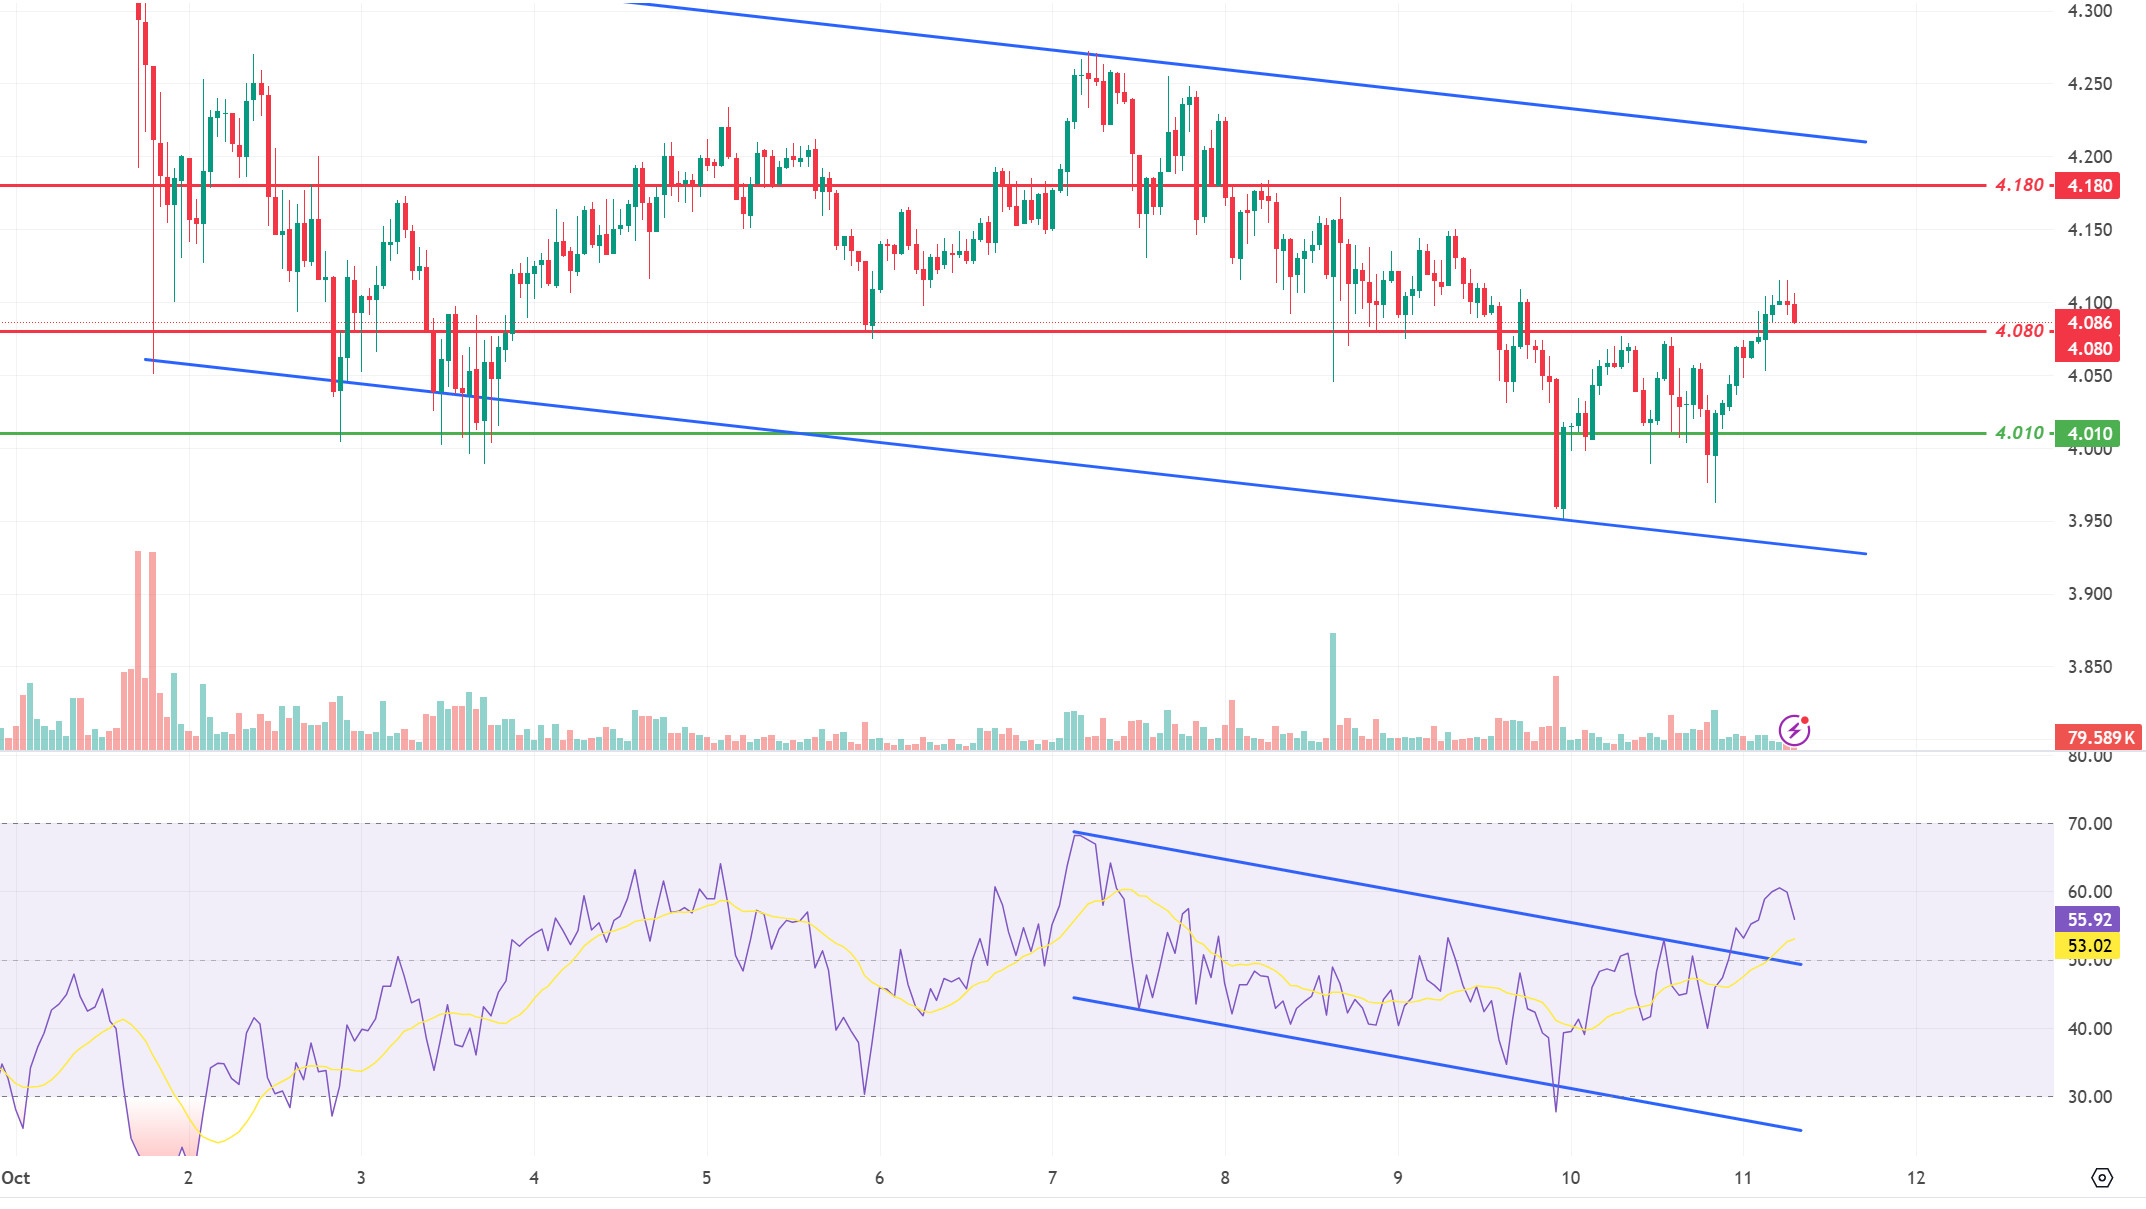
When we examine the Polkadot chart, the price broke the 4,080 resistance level upwards with the upward break of the descending channel el the RSI. If the price maintains above the 4.080 level, its next target may be the 4.180 level. On the other hand, if the 4.080 level is lost with increasing selling pressure, we can expect 4.010 support levels to be tested.
Supports 4.010 – 3.975 – 3.875
Resistances 4.080 – 4.180 – 4.210
SHIB/USDT
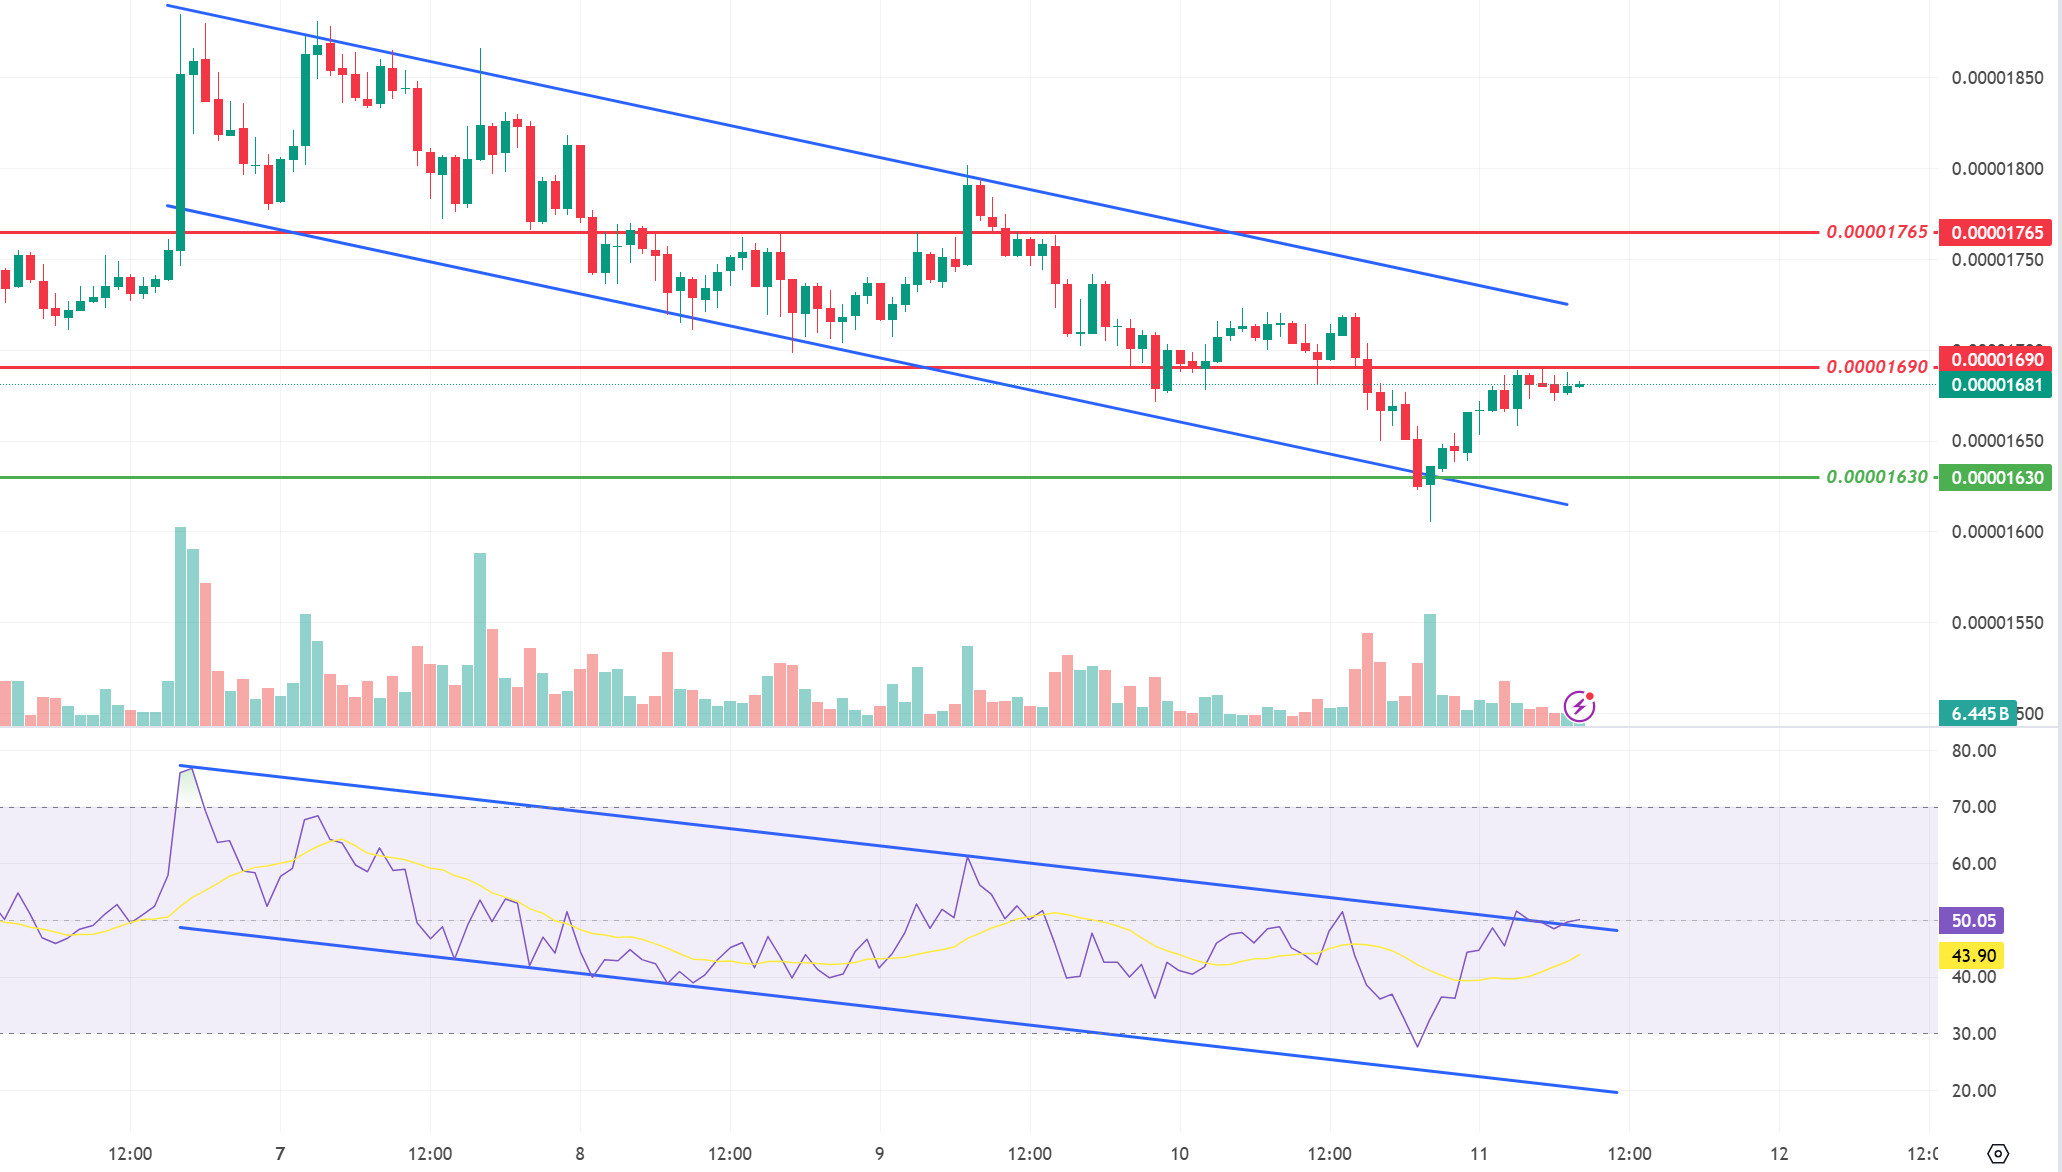
When we examine the chart of Shiba Inu (SHIB), the price is moving towards the upper band of the channel with the reaction from the lower band of the descending channel. If the RSI line breaks the descending channel upwards, we can expect the price to move towards 0.00001765 levels. On the other hand, if the selling pressure at 0.00001690 cannot be broken, the price may want to test 0.00001630 levels again.
Supports 0.00001630 – 0.00001565 – 0.00001505
Resistances 0.00001690 – 0.00001765 – 0.00001810
LEGAL NOTICE
The investment information, comments and recommendations contained herein do not constitute investment advice. Investment advisory services are provided individually por authorized institutions taking into account the risk and return preferences of individuals. The comments and recommendations contained herein are of a general nature. These recommendations may not be suitable for your financial situation and risk and return preferences. Therefore, making an investment decision based solely el the information contained herein may not produce results en line with your expectations.
