
MARKET SUMMARY
Latest Situation en Crypto Assets
| Assets | Last Price | 24h Change | Dominance | Market Cap |
|---|---|---|---|---|
| BTC | $67,270.00 | 0.05% | 57.49% | $1.33 T |
| ETH | $2,622.00 | 0.09% | 13.64% | $315.41 B |
| SOLANA | $152.39 | -1.38% | 3.09% | $71.59 B |
| XRP | $0.5551 | 2.25% | 1.36% | $31.43 B |
| DOGE | $0.1223 | 3.35% | 0.78% | $17.94 B |
| TRX | $0.1598 | 0.34% | 0.60% | $13.84 B |
| CARDANO | $0.3497 | -1.77% | 0.53% | $12.23 B |
| AVAX | $27.54 | -0.73% | 0.48% | $11.21 B |
| SHIB | $0.00001815 | -0.53% | 0.46% | $10.70 B |
| LINK | $11.15 | -1.42% | 0.30% | $6.99 B |
| DOT | $4.262 | -2.64% | 0.28% | $6.42 B |
*Prepared el 10.17.2024 at 06:00 (UTC)
WHAT’S LEFT BEHIND
Bitcoin Whales
Bitcoin whales entered a period of massive accumulation, transferring 1.97 million BTC to new wallets. While this giant move created a significant shift en market sentiment, it is seen as a possible bullish signal en Bitcoin price.
Italy’s Bitcoin Step
The Italian government’s plan to raise the capital gains tax el Bitcoin from 26% to 42% has infuriated Paolo Ardoino, the Italian CEO of Tether. Ardoino said, “Italians, of course, have no right to fight inflation! Please breathe less,” Ardoino said.
The Elon Musk factor
Dogecoin is el the rise with Elon Musk’s tweets and Donald Trump’s rising chances. The cryptocurrency has gained 25 percent en the last week.
HIGHLIGHTS OF THE DAY
Important Economic Calender Data
| Time | Noticias | Expectation | Previous |
|---|---|---|---|
| Echelon Prime (PRIME): 750K Token Unlock | |||
| ApeCoin (APE): 15.59M Token Unlock | |||
| Internet Computer (ICP): Chain Fusion Townhall | |||
| 12:15 | EU ECB Monetary Policy Statement | ||
| 12:15 | EU ECB Interest Rate Decision (Oct) | 3.40% | 3.65% |
| 12:30 | US Retail Sales (MoM) (Sep) | 0.3% | 0.1% |
| 12:30 | US Core Retail Sales (MoM) (Sep) | 0.1% | 0.1% |
| 12:30 | US Initial Jobless Claims | 241K | 258K |
| 12:30 | US Philadelphia Fed Manufacturing Index (Oct) | 4.2 | 1.7 |
| 12:45 | EU ECB Press Conference | ||
| 13:15 | US Industrial Production (MoM) (Sep) | -0.1% | 0.8% |
| 15:00 | US FOMC Member Goolsbee Speaks |
INFORMATION
*The calendar is based el UTC (Coordinated Universal Time) time zone. The economic calendar content el the relevant page is obtained from reliable news and data providers. The news en the economic calendar content, the date and time of the announcement of the news, possible changes en the previous, expectations and announced figures are made por the data provider institutions. Darkex cannot be held responsible for possible changes that may arise from similar situations.
MARKET COMPASS
Along with the tone of risk appetite, the upcoming US presidential election and geopolitical factors, developments en the world’s largest economies continue to shape asset prices. While China announced new measures to support the real estate sector, this statement was seen to be far from affecting the markets. The dollar index continues to hold el to its gains and according to Polymarket, Trump is closer to winning the election. Today, markets will focus el the European Central Bank’s (ECB) monetary policy statement and September retail sales data for the US.
The ECB is expected to cut its policy rate por 25 basis points, after which all eyes will be el the bank’s president Lagarde. On the other hand, US retail sales figures, which may give clues about the monetary policy moves of the US Federal Reserve (FED), which is almost certain to cut interest rates por 25 basis points en November according to the CME Fedwatch Tool, will be under the scrutiny of investors today.
BTC, which saw below $59,000 el October 10, has gained nearly $10,000 en a week with a test above $68,000 yesterday. We think that the main direction of the largest cryptocurrency and digital assets en general continues to be upward, with an almost breathless rally. In addition, a short-term retracement can be observed with the risks that the 10 thousand dollar gain en question has been achieved en a short time. However, it would not be wrong to say that the longer the gains continue to be maintained, the lower the probability of a correction. In this parallel, we can state that the last breathing trend that started with the European session yesterday may continue, but this may not turn into a meaningful decline.
TECHNICAL ANALYSIS
BTC/USDT
Bitcoin, which is dominated por rises as the US elections approach, may give way to volatility. When we look at the 2024 annual return table, it is seen that the most earnings after Bitcoin are earned from volatility. When we look at the US elections historically, creating uncertainty el the markets is the factor that increases volatility. Although D.Trump’s superiority stands out en Polymarket data, the US media claims that the race is en the middle.
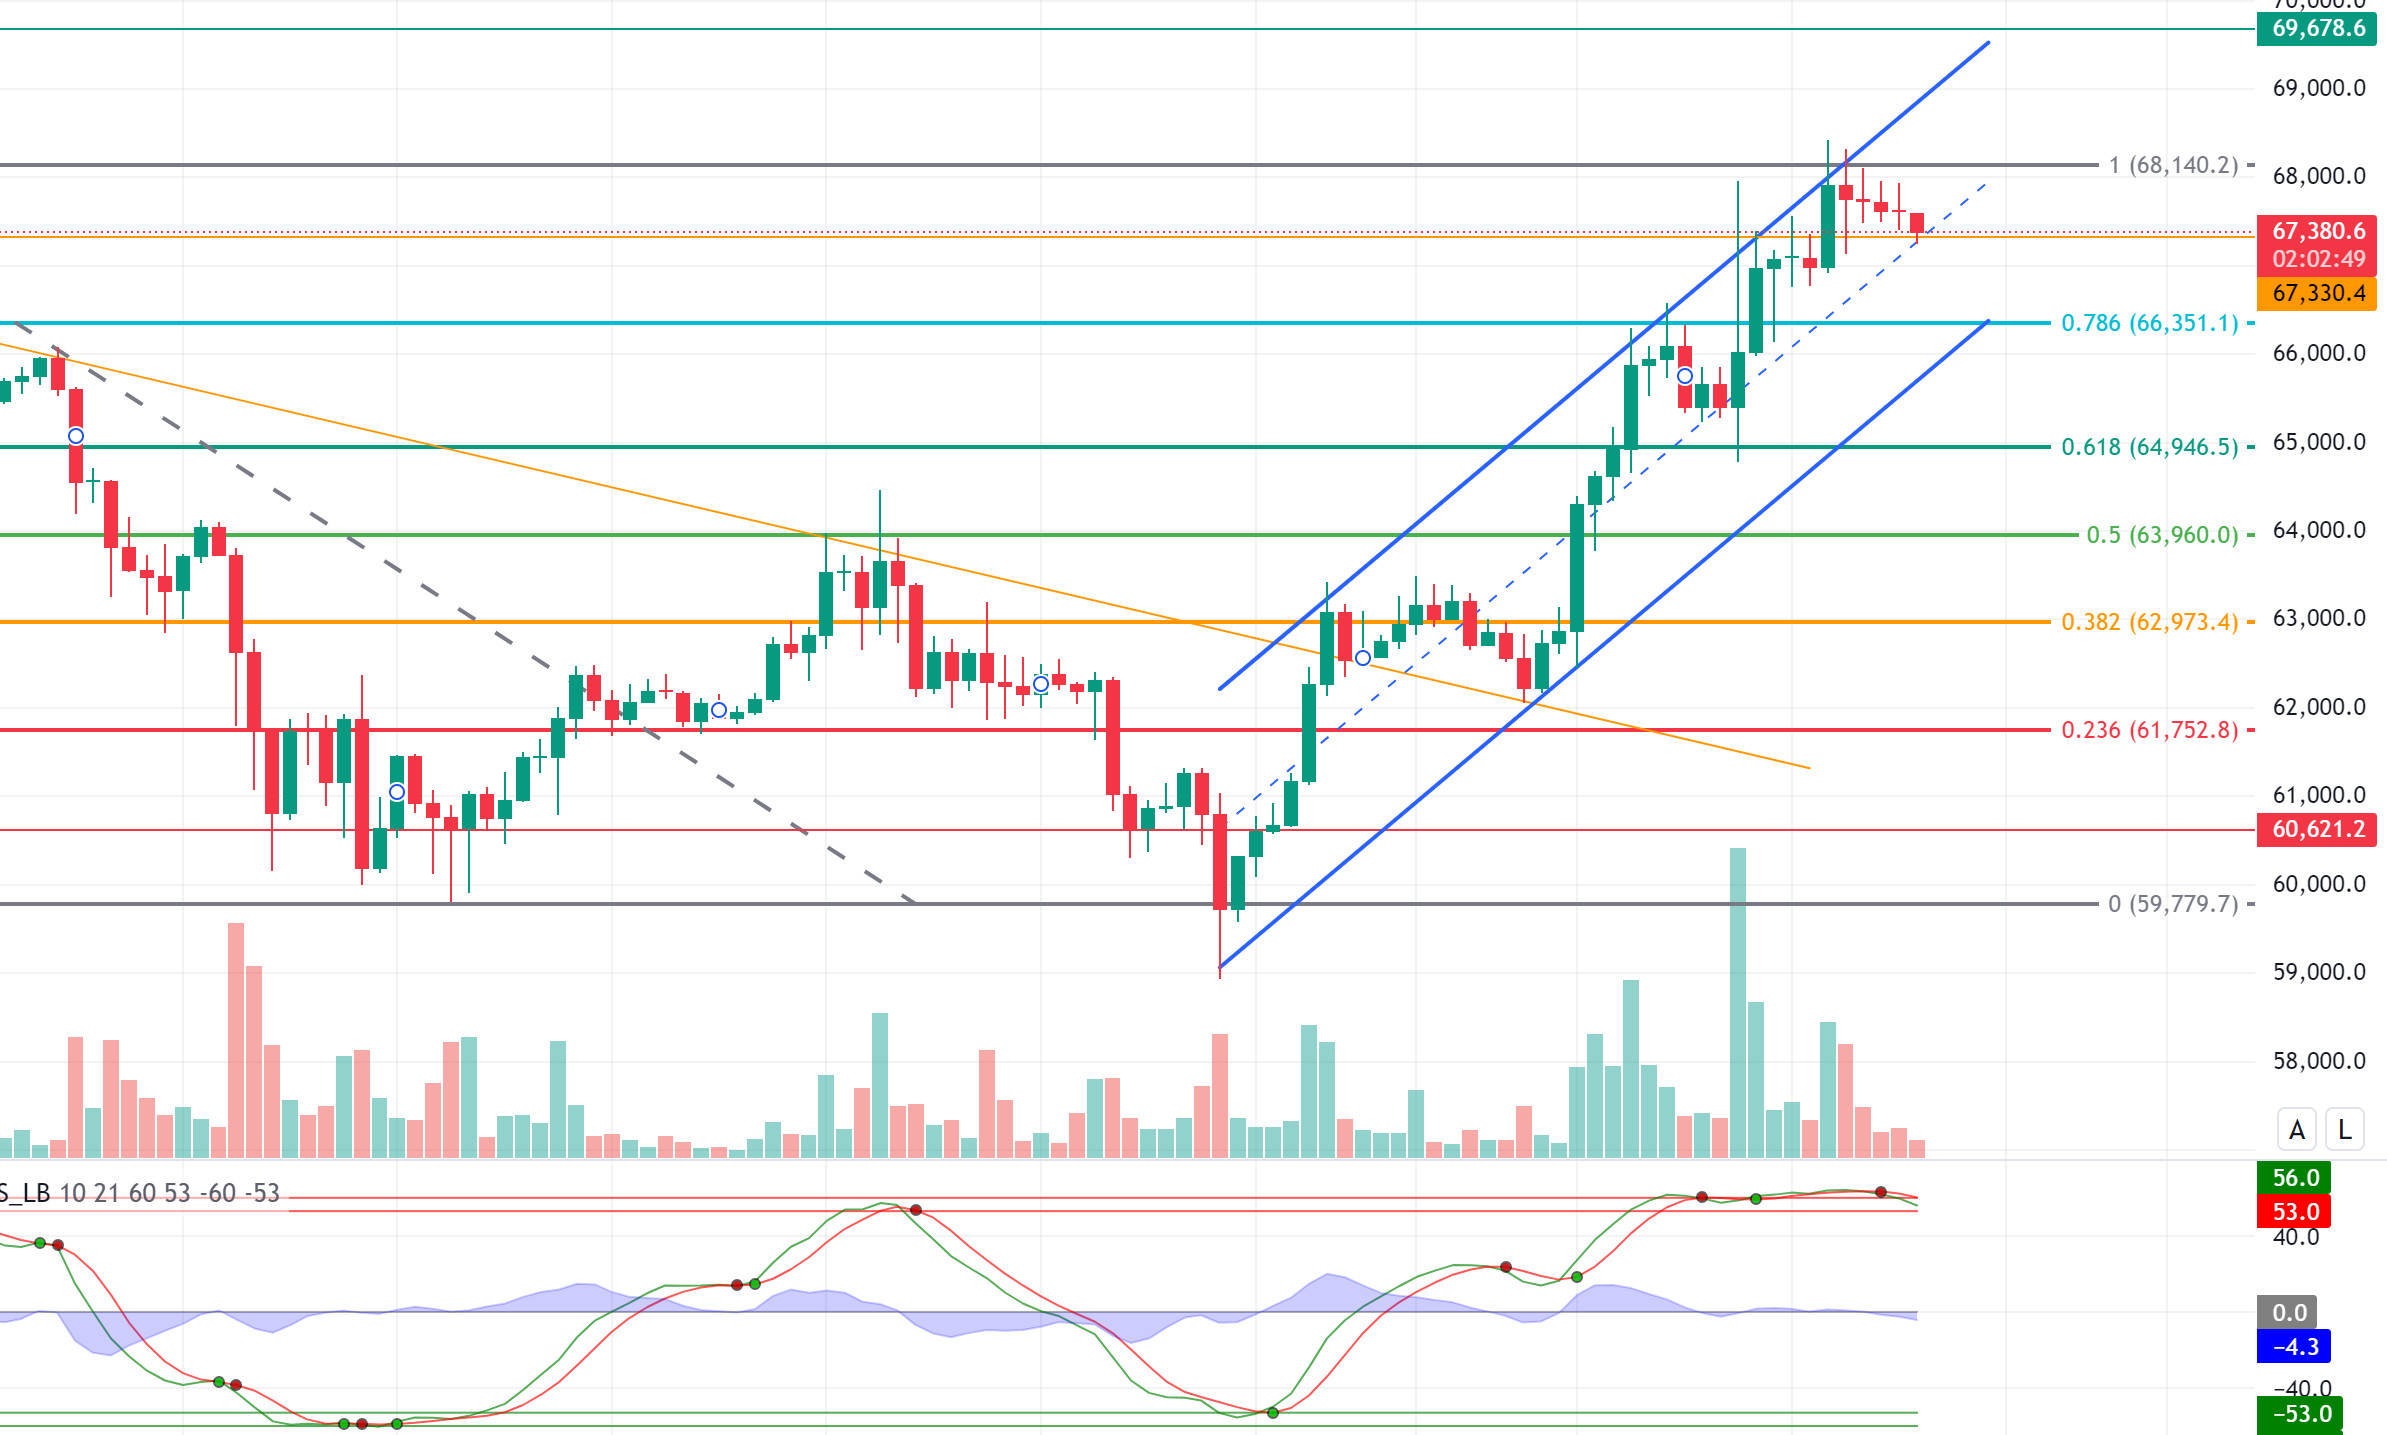
When we look at the BTC 4-hora technical analysis, we see that en the segundo half of October, Bitcoin rallied within the ascending channel. In our previous analysis, we emphasized that correction movements are important en increasing upward momentum el the market. Indeed, when we look at the chart, we see that the price entered the correction at the Fibonacci 1 (68,140) level. The price, which is currently moving at 67,350 above 67,330, which we have drawn as an intermediate support point, may increase selling pressure with hourly closures below this region and 0.786 (66,350) levels may be tested. We see that the Wave trend oscillator, our technical indicator, gives a sell signal en different time frames en the overbought zone. In the upward movement with market optimism, 1 (68,140) will appear as a resistance level again.
Supports: 67,330 – 66,350 – 64,946
Resistances 68,140 – 69,678 – 71,470
ETH/USDT
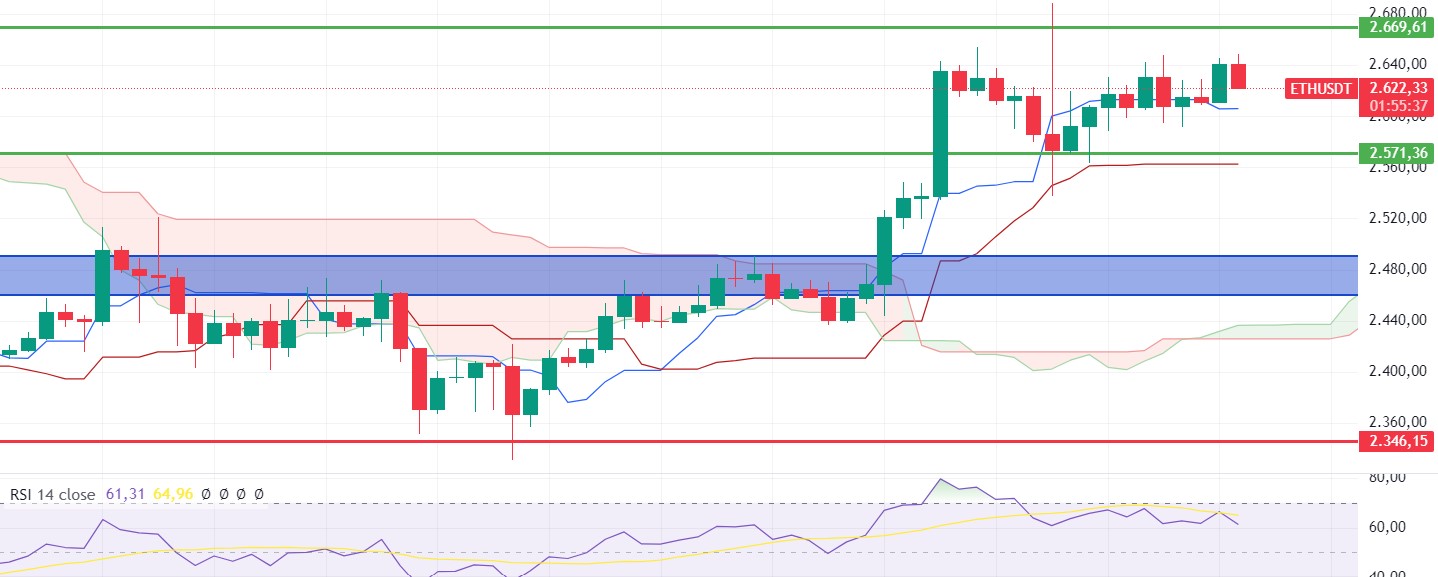
After the small rise Ethereum experienced at night, it fell below the 2,630 level again with the decline en Bitcoin. With this decline, negative mismatches have occurred en RSI, CCI and CMF. This weakness en the price indicates that the pullbacks may continue to some extent during the day with Bitcoin dominance. If the Tenkan level of 2,606 is broken, it seems important to quickly cross the 2,669 level en order to prevent the bearish scenario that could be experienced up to 2,571. ETH, which can regain a positive outlook por breaking the 2,669 level, maintains its slightly negative structure for now.
Supports 2,571 – 2,490 – 2,460
Resistances 2,669 – 2,731 – 2,815
LINK/USDT
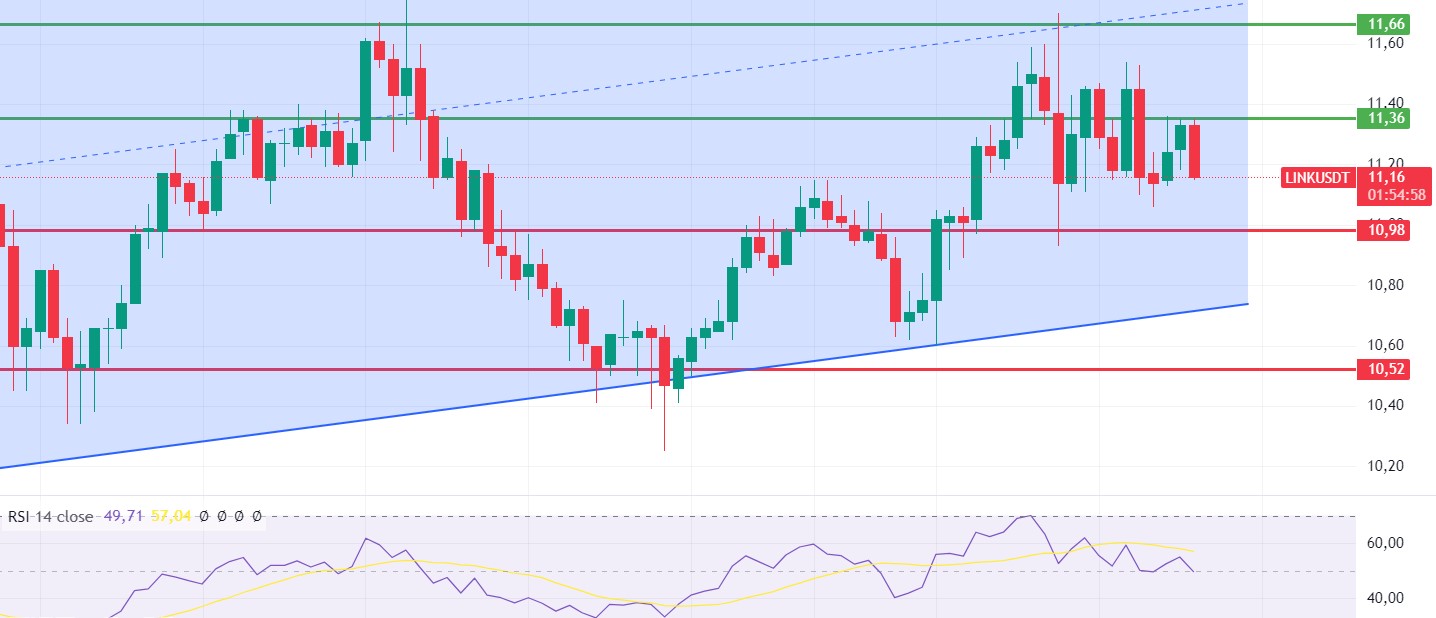
As we mentioned en yesterday evening’s analysis, the noticeable stagnation en the indicators brought horizontal movements en the price. After the loss of the 11.36 level, LINK, which has tested this level several times again after the loss of the 11.36 level, seems to have failed to break 11.36 and approached the 10.98 support. For LINK, which may try 10.98 support with the expected ETH drop during the day, if 10.98 is broken, the declines may deepen. It can be said that there is a slightly negative outlook for LINK, which needs closures above 11.66 to achieve a positive outlook.
Supports 10.98 – 10.52 – 9.89
Resistances 11.36 – 11.66 – 12.26
SOL/USDT
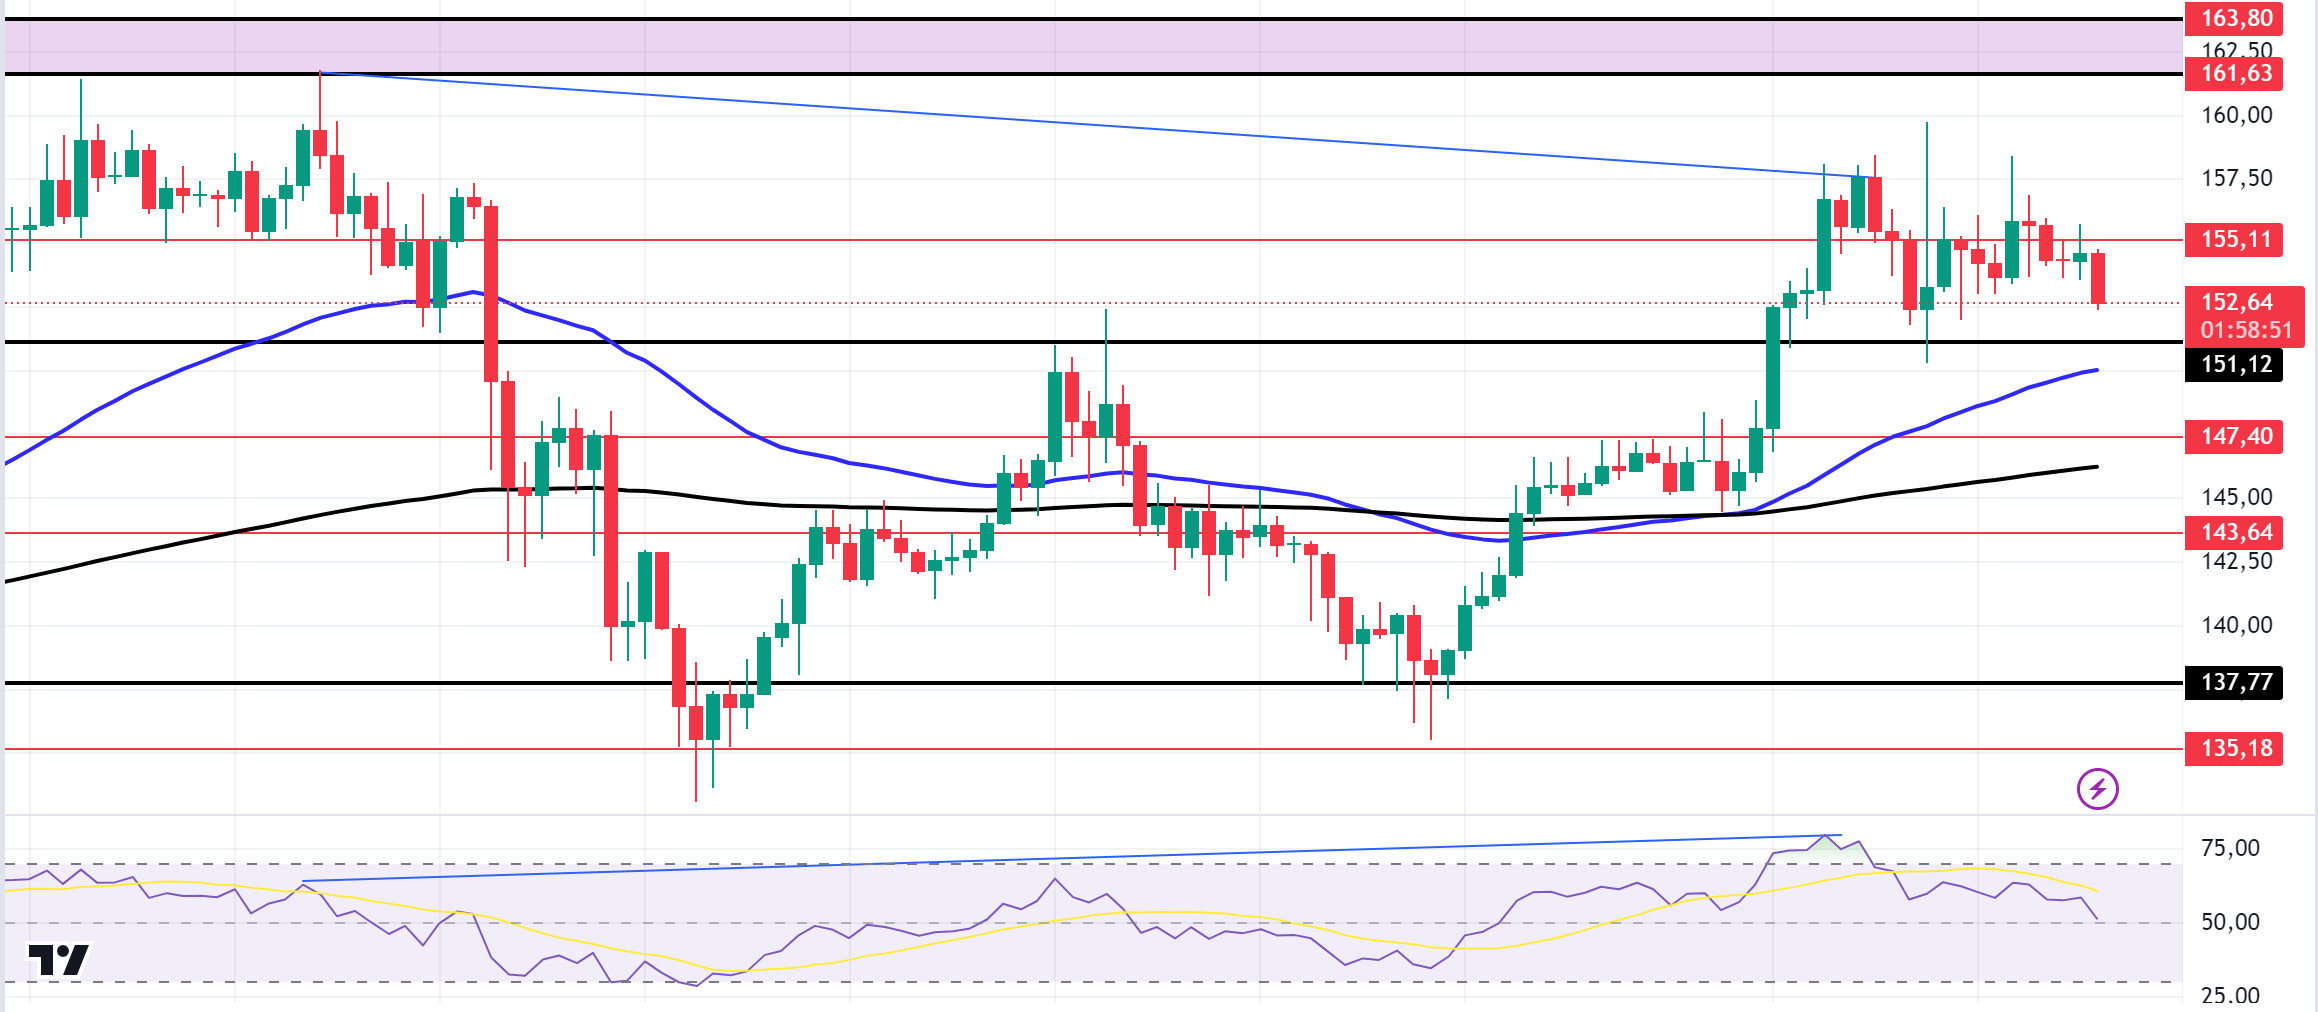
Today’s US retail sales data and unemployment benefit claims are among the data to watch. Data from el-chain tracker Whale Alerts shows that stablecoins such as Tether (USDT) have seen a large inflow to central exchange platforms. Stablecoin inflows often represent an increase en demand from retail investors. This is generally bullish for the market. Data from Artemis shows that new addresses continue to increase. On the 4-hora timeframe, the 50 EMA continues to be above the 200 EMA. This could mean that the uptrend will continue. The price decisively broke the 151.12 level, an important resistance. This means that it could test the 163.80 level, the ceiling level of the band where it has been consolidating for a long time. Disharmony en the RSI (14) may increase the SOL sales. The 161.63 level is a very strong resistance point en the uptrend driven por both macroeconomic conditions and innovations en the Solana ecosystem. If it rises above this level, the rise may continue strongly. In the sales that investors will make due to macroeconomic data or negativities en the ecosystem, the support level of 151.12 – 147.40 should be followed. If the price comes to these support levels, a potential bullish opportunity may arise.
Supports 151.12 – 147.40 – 143.64
Resistances 155.11 – 161.63 – 163.80
ADA/USDT
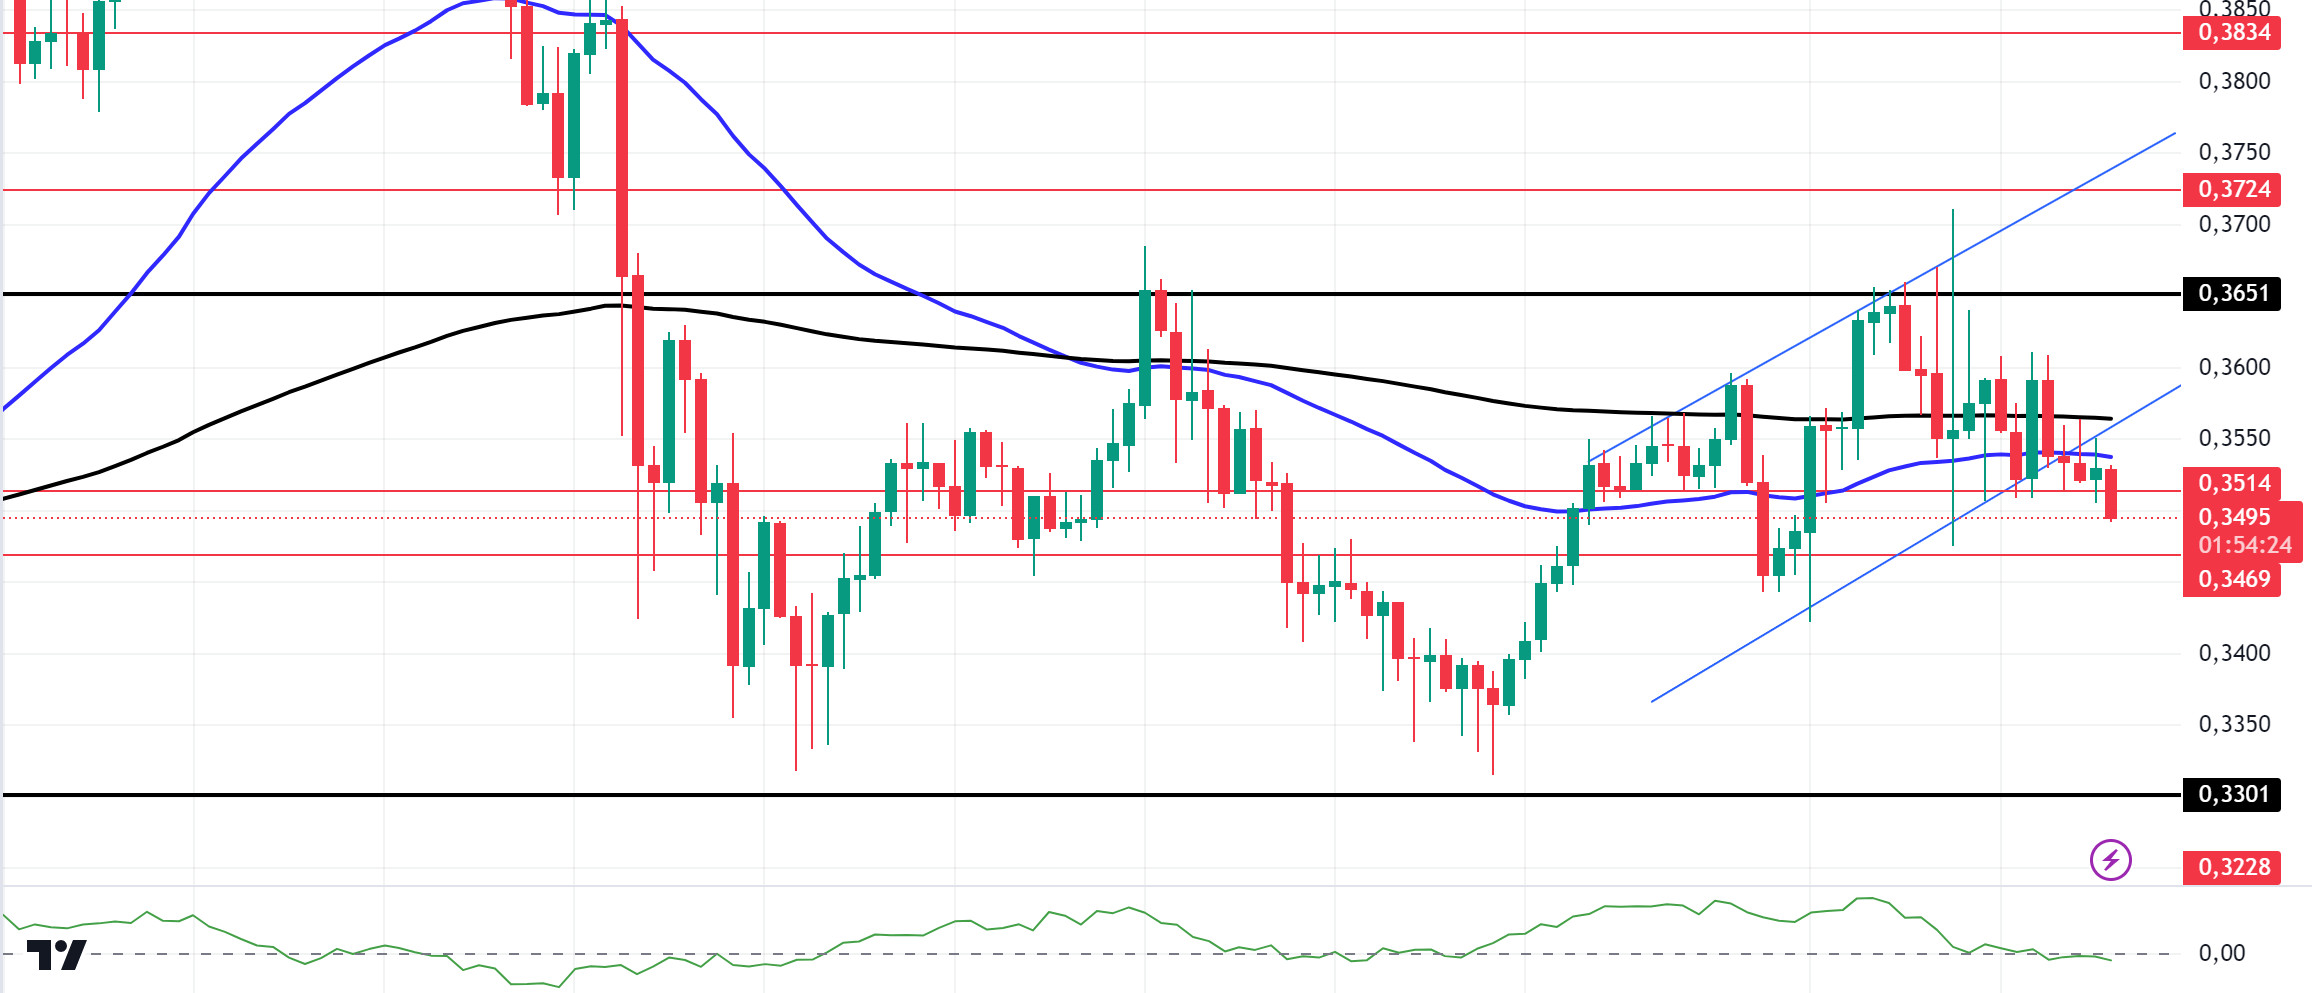
Today’s US retail sales data and unemployment benefit claims are among the data to watch. Data from el-chain tracker Whale Alerts shows that stablecoins such as Tether (USDT) have seen a large inflow to central exchange platforms. Stablecoin inflows often represent an increase en demand from retail investors. This means the market is generally bullish. With BTC dominance rising, ADA lost about 2.38% to the support level of 0.3522. In the ecosystem, investors holding between 1 million and 10 million ADA increased their holdings por 3.59%. This indicates growing confidence among large investors. According to Santiment data, the 30-day MVRV rate recently fell below -5.72 thousand. This indicates that most short-term investors are at a loss. This scenario usually attracts long-term buyers. Historically, when the MVRV ratio falls below -5% it is seen as a buying opportunity por long-term investors. On the 4-hora chart, the price is pricing below the 50 EMA AND the 200 EMA. At the same time, the 50 EMA continues to hover below the 200 EMA. The moving averages have worked as resistance to the price. The CMF (20) indicator fell below 0. This shows us that money inflows are decreasing. If macroeconomic data is positive for cryptocurrencies, it will retest the 0.3651 resistance level. If the money flow decreases and macroeconomic data is negative for cryptocurrencies, 0.3469 is a support level and can be followed as a good buying place.
Supports 0.3514 – 0.3469 – 0.3301
Resistances 0.3651 – 0.3724 – 0.3834
AVAX/USDT
AVAX, which opened yesterday at 28.21, fell slightly during the day and closed the day at 28.02. Today, unemployment claims and retail sales data will be released especially por the US. An excessive increase en unemployment claims data or a sharp decline en retail sales may be negatively priced por the market as it will trigger fears of recession. High volatility may be seen en the market during the data release. Noticias flows from the Middle East will also be important for the market.
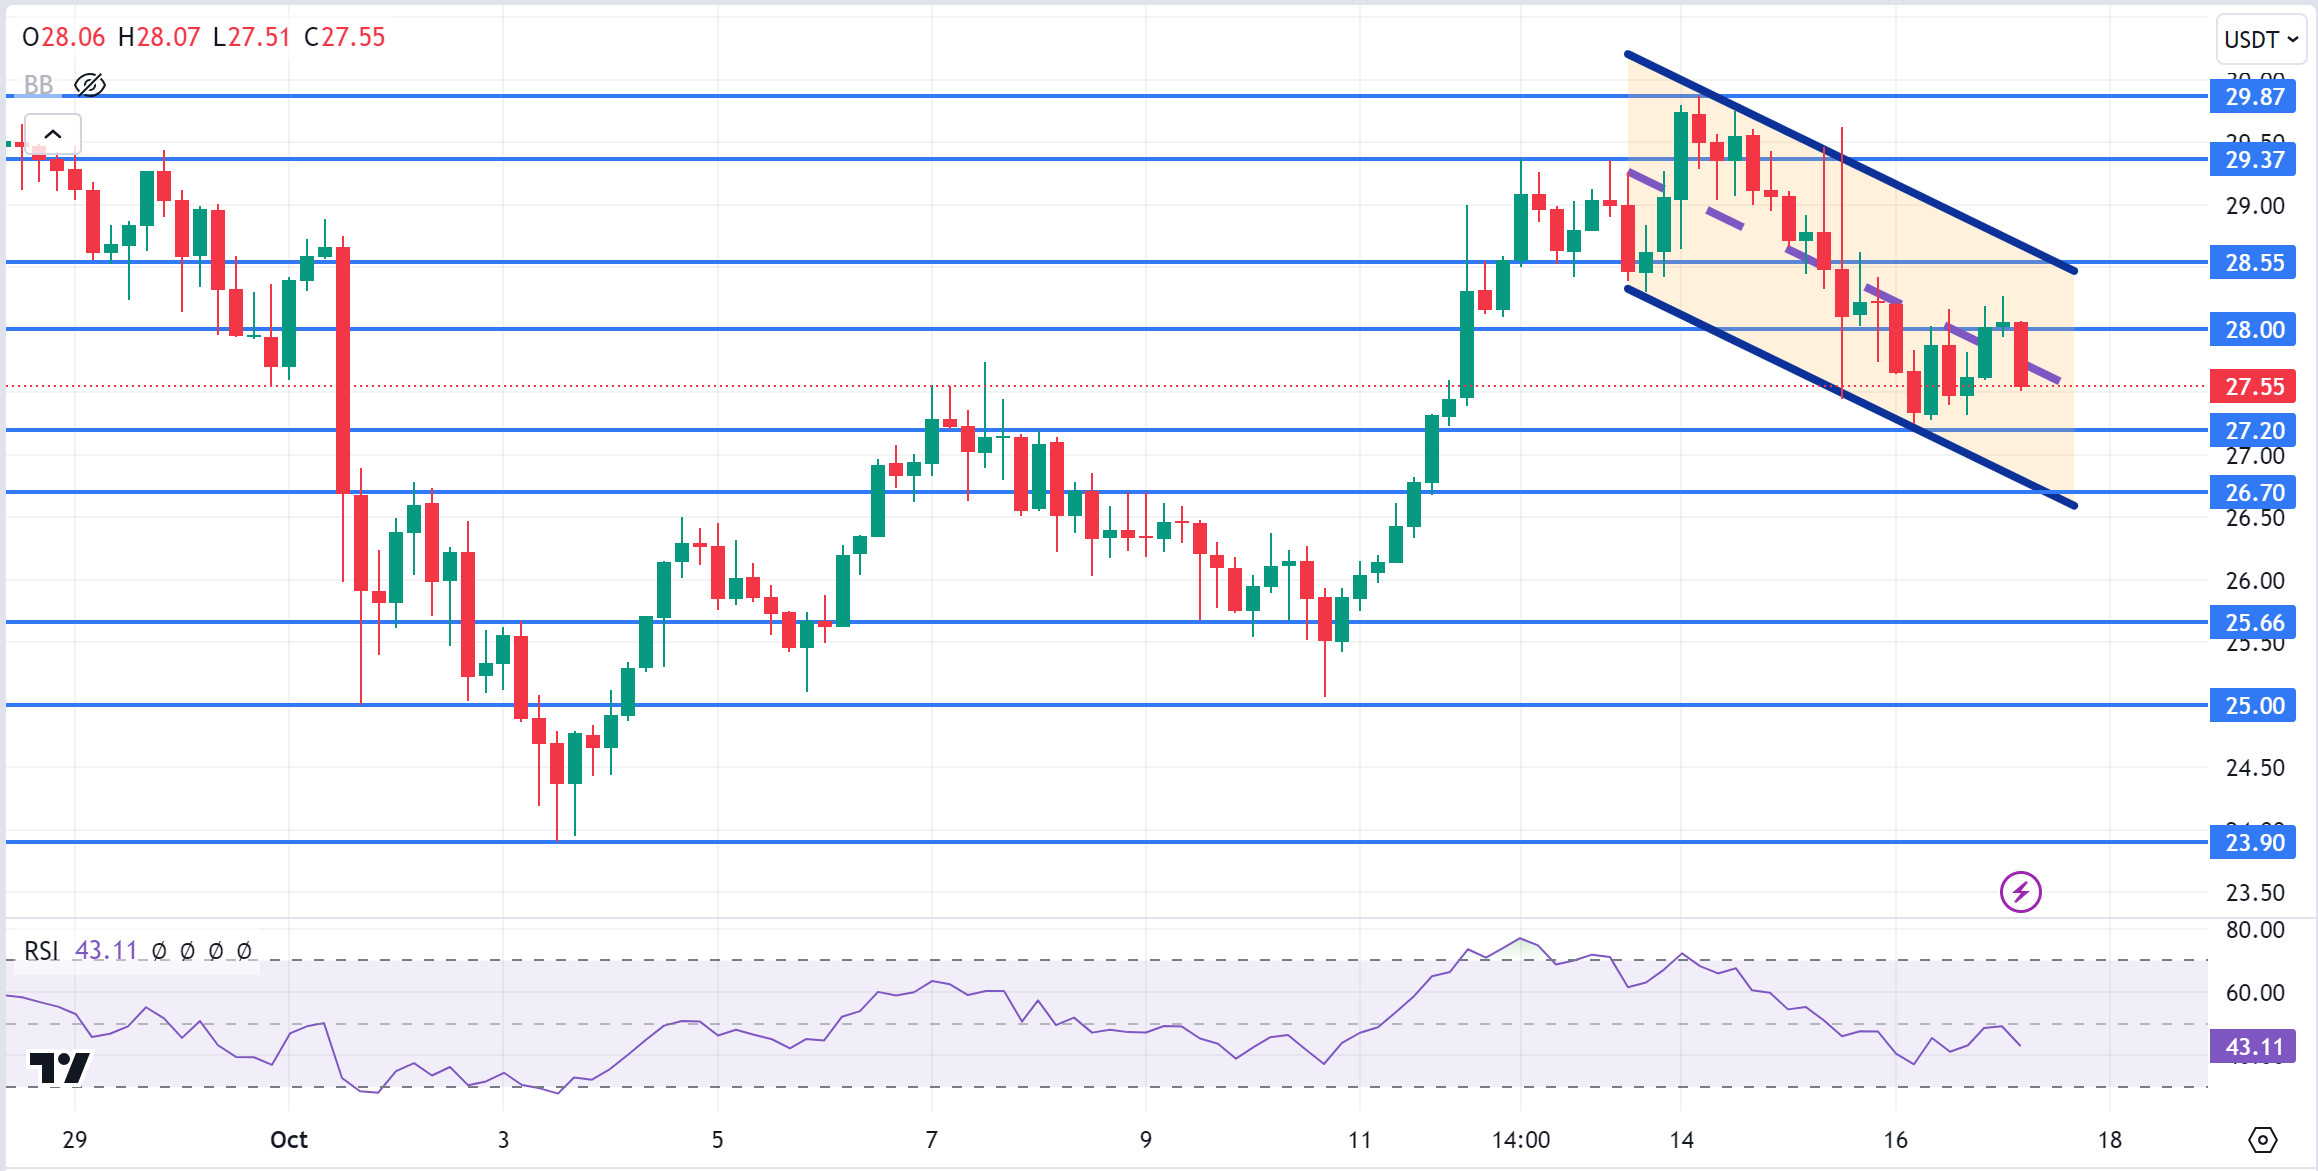
AVAX, currently trading at 27.55, is moving en a falling channel el the 4-hora chart. It is en the middle band of the falling channel and with the RSI 43 value, it can be expected to rise from here and move to the upper band. In such a case, it may test the 28.55 resistance. In case of negative news about the increasing tension en the Middle East, sales may increase. In such a case, it may test 27.20 support. As long as it stays above 25.00 support during the day, the desire to rise may continue. With the break of 25.00 support, sales may increase.
Supports 28.00 – 27.20 – 26.70
Resistances 28.55 – 29.37 – 29.87
TRX/USDT
TRX, which started yesterday at 0.1587, rose about 1% during the day and closed the day at 0.1601. Today, the market will follow unemployment claims and retail sales data. They are important data for the market and can be perceived positively if they are announced en line with expectations. In addition, the market will be closely following the news flows regarding the tension en the Middle East.
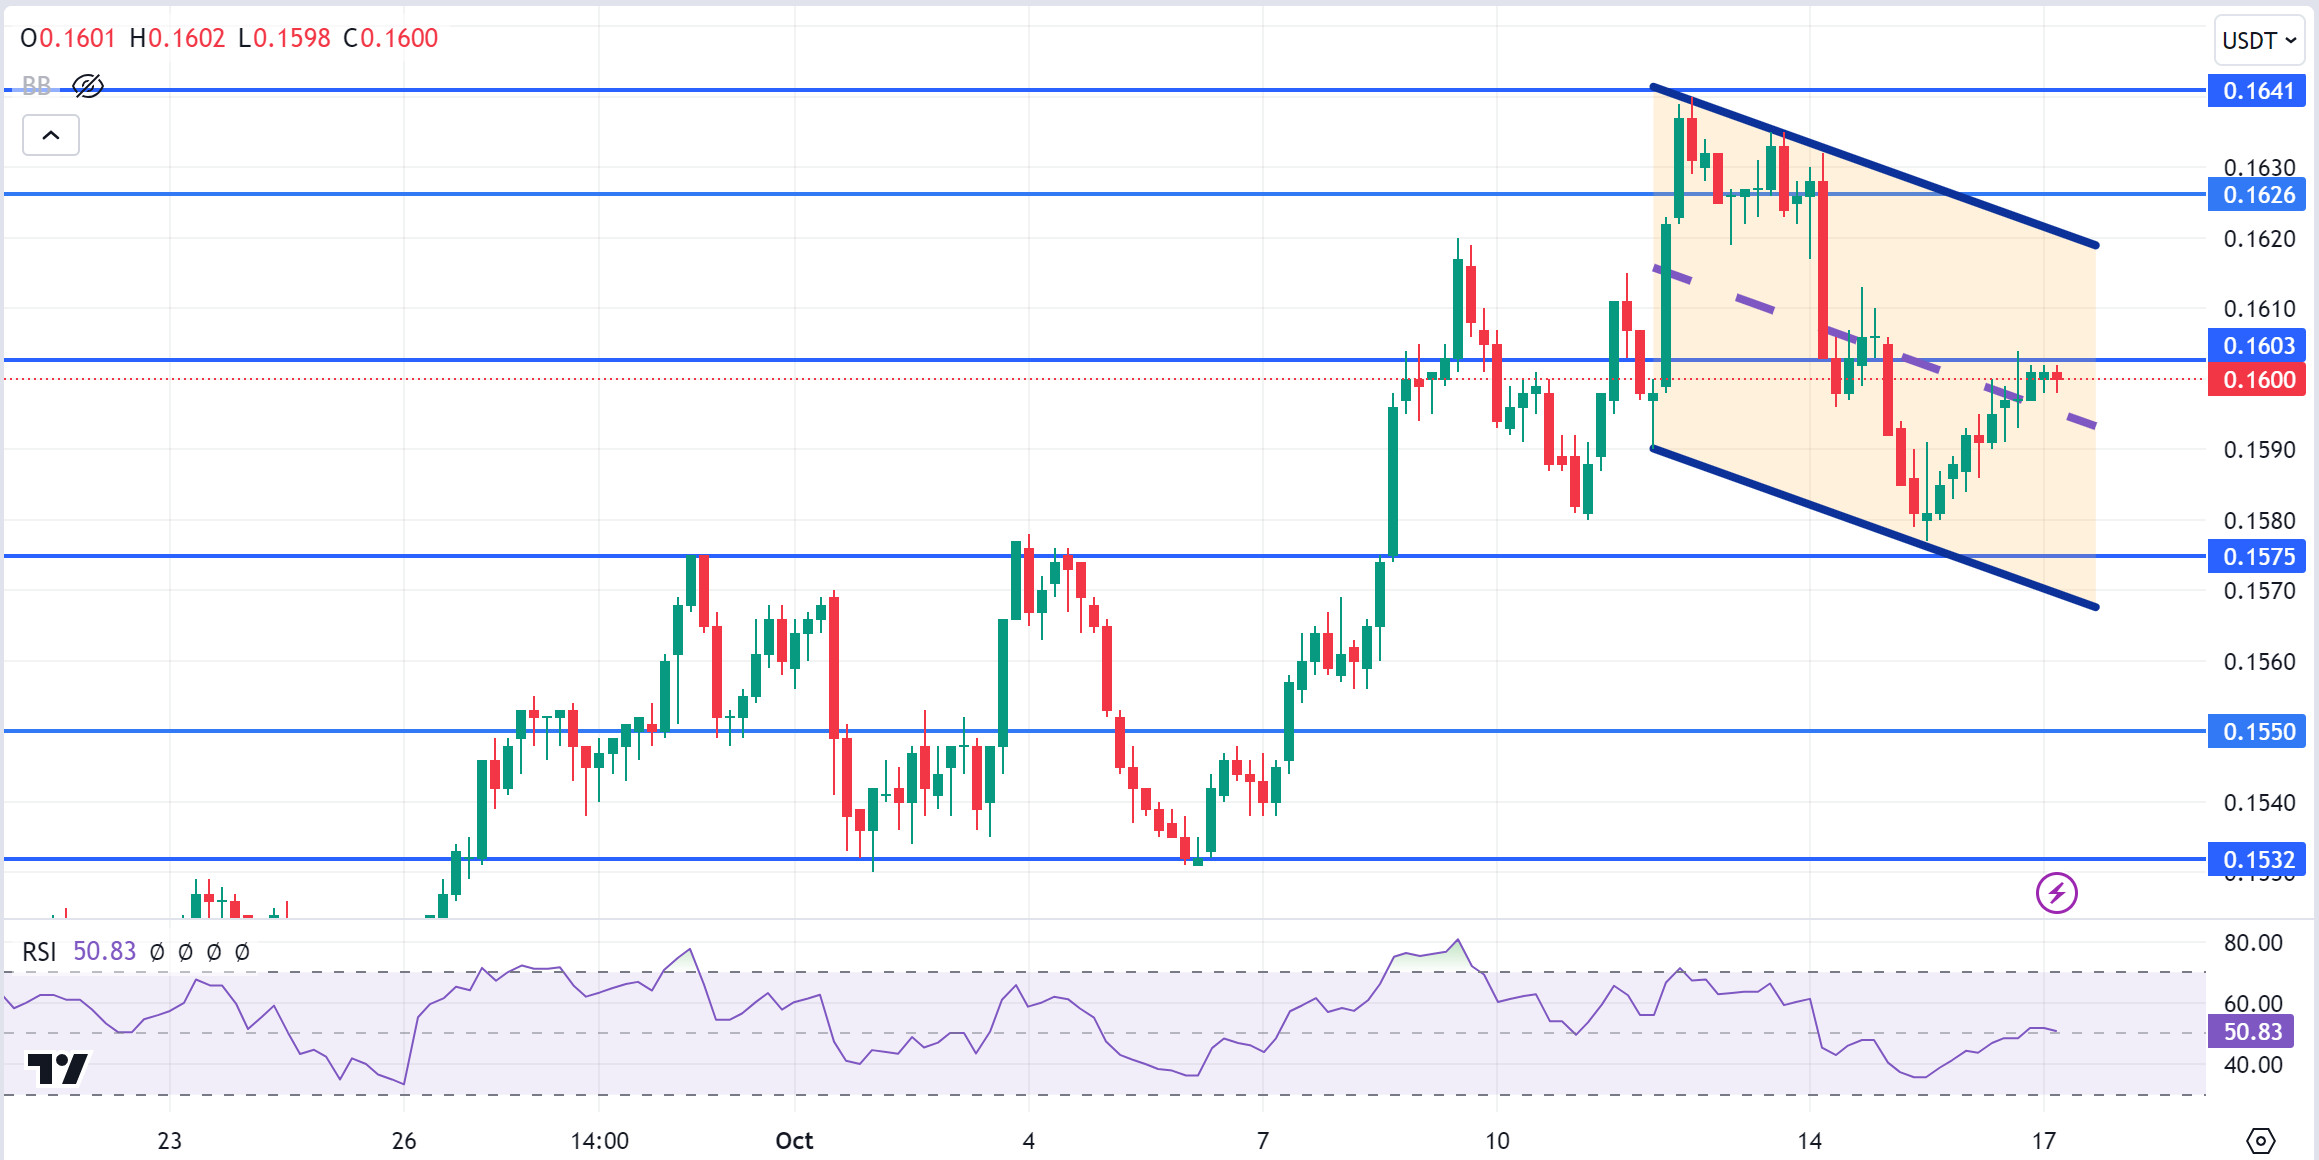
TRX, currently trading at 0.1600, is en the middle band of the falling channel el the 4-hora chart. With the RSI 50 value, it can be expected to rise slightly from its current level. In such a case, it may test the 0.1626 resistance por moving up from the middle band of the channel. However, if it cannot close the candle above 0.1603 resistance, it may test 0.1575 support with the selling pressure that may occur. As long as TRX stays above 0.1482 support, the desire to rise may continue. If this support is broken downwards, sales can be expected to increase.
Supports 0.1575 – 0.1550 – 0.1532
Resistances 0.1603 – 0.1626 – 0.1641
XRP/USDT
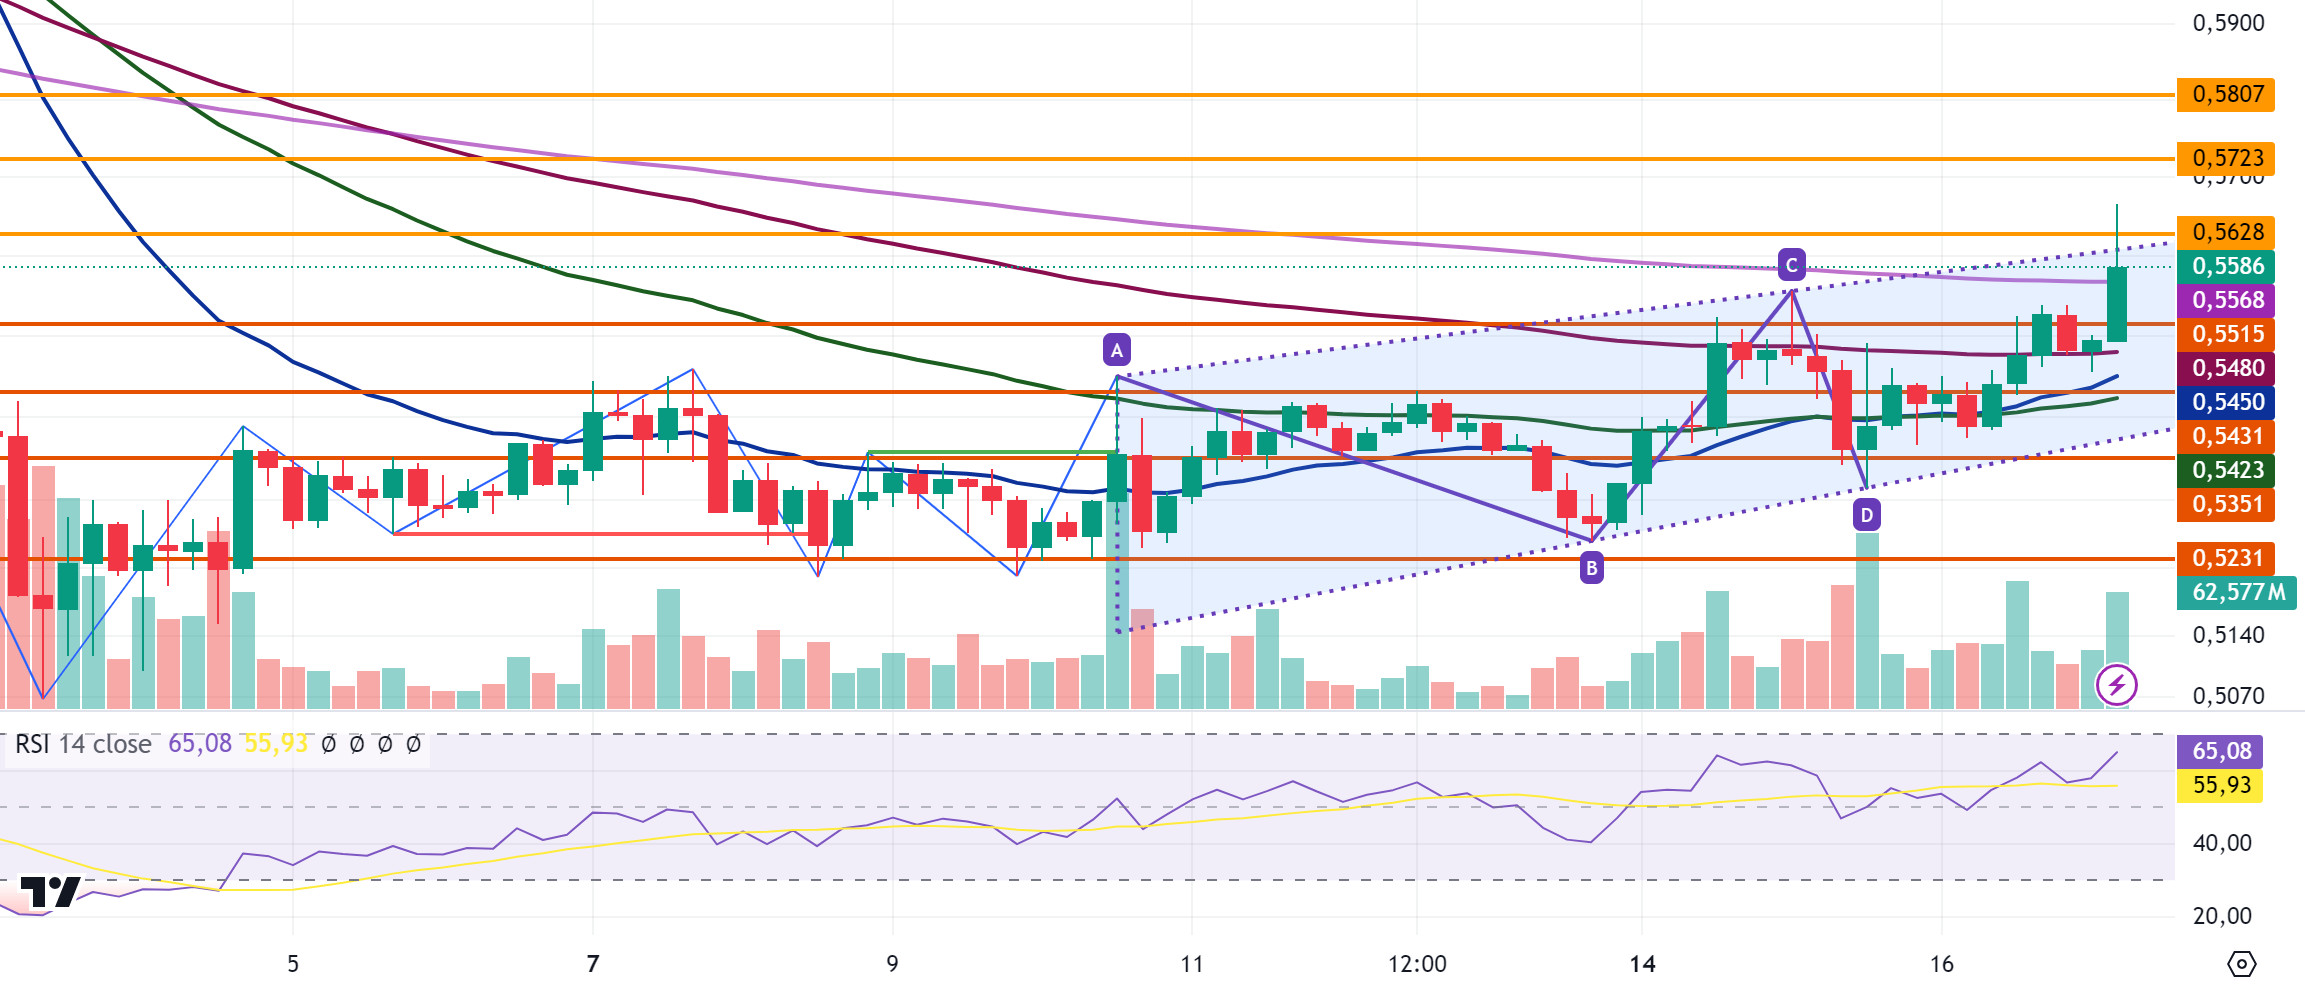
XRP rose as high as 0.5537 yesterday en the 4-hora analysis, then fell with the incoming sales and tested the EMA100 level. In its decline, it could not break the EMA100 level and the daily close was realized at 0.5481. XRP is currently trading at 0.5586 el the EMA levels with a 1.6% increase en value en the 4-hora analysis today. Starting the day with an uptrend, it rose to 0.5665 and then fell to the EMA200 level with the incoming sales. XRP fell into a triangle pattern with its decline and is currently testing the EMA200 level. In the 4-hora analysis, XRP may test the resistance levels of 0.5628-0.5723-0.5807 if the uptrend continues with the last candle closing above the EMA200 level. If the last candle closure occurs below the EMA200 and selling pressure builds, XRP may test the 0.5515-0.5431-0.5351 support levels with its decline.
XRP may fall back to the triangle formation zone with possible sales at the 0.5628 resistance level el the rise and may offer a short trading opportunity. In its decline, it may rise and offer a long trading opportunity with possible purchases at the EMA100 level it tested yesterday and today.
EMA20 (Blue Line) – EMA50 (Green Line) – EMA100 (Red Line) – EMA200 (Purple Line)
Supports 0.5515 – 0.5431 – 0.5351
Resistances 0.5628 – 0.5723 – 0.5807
DOGE/USDT
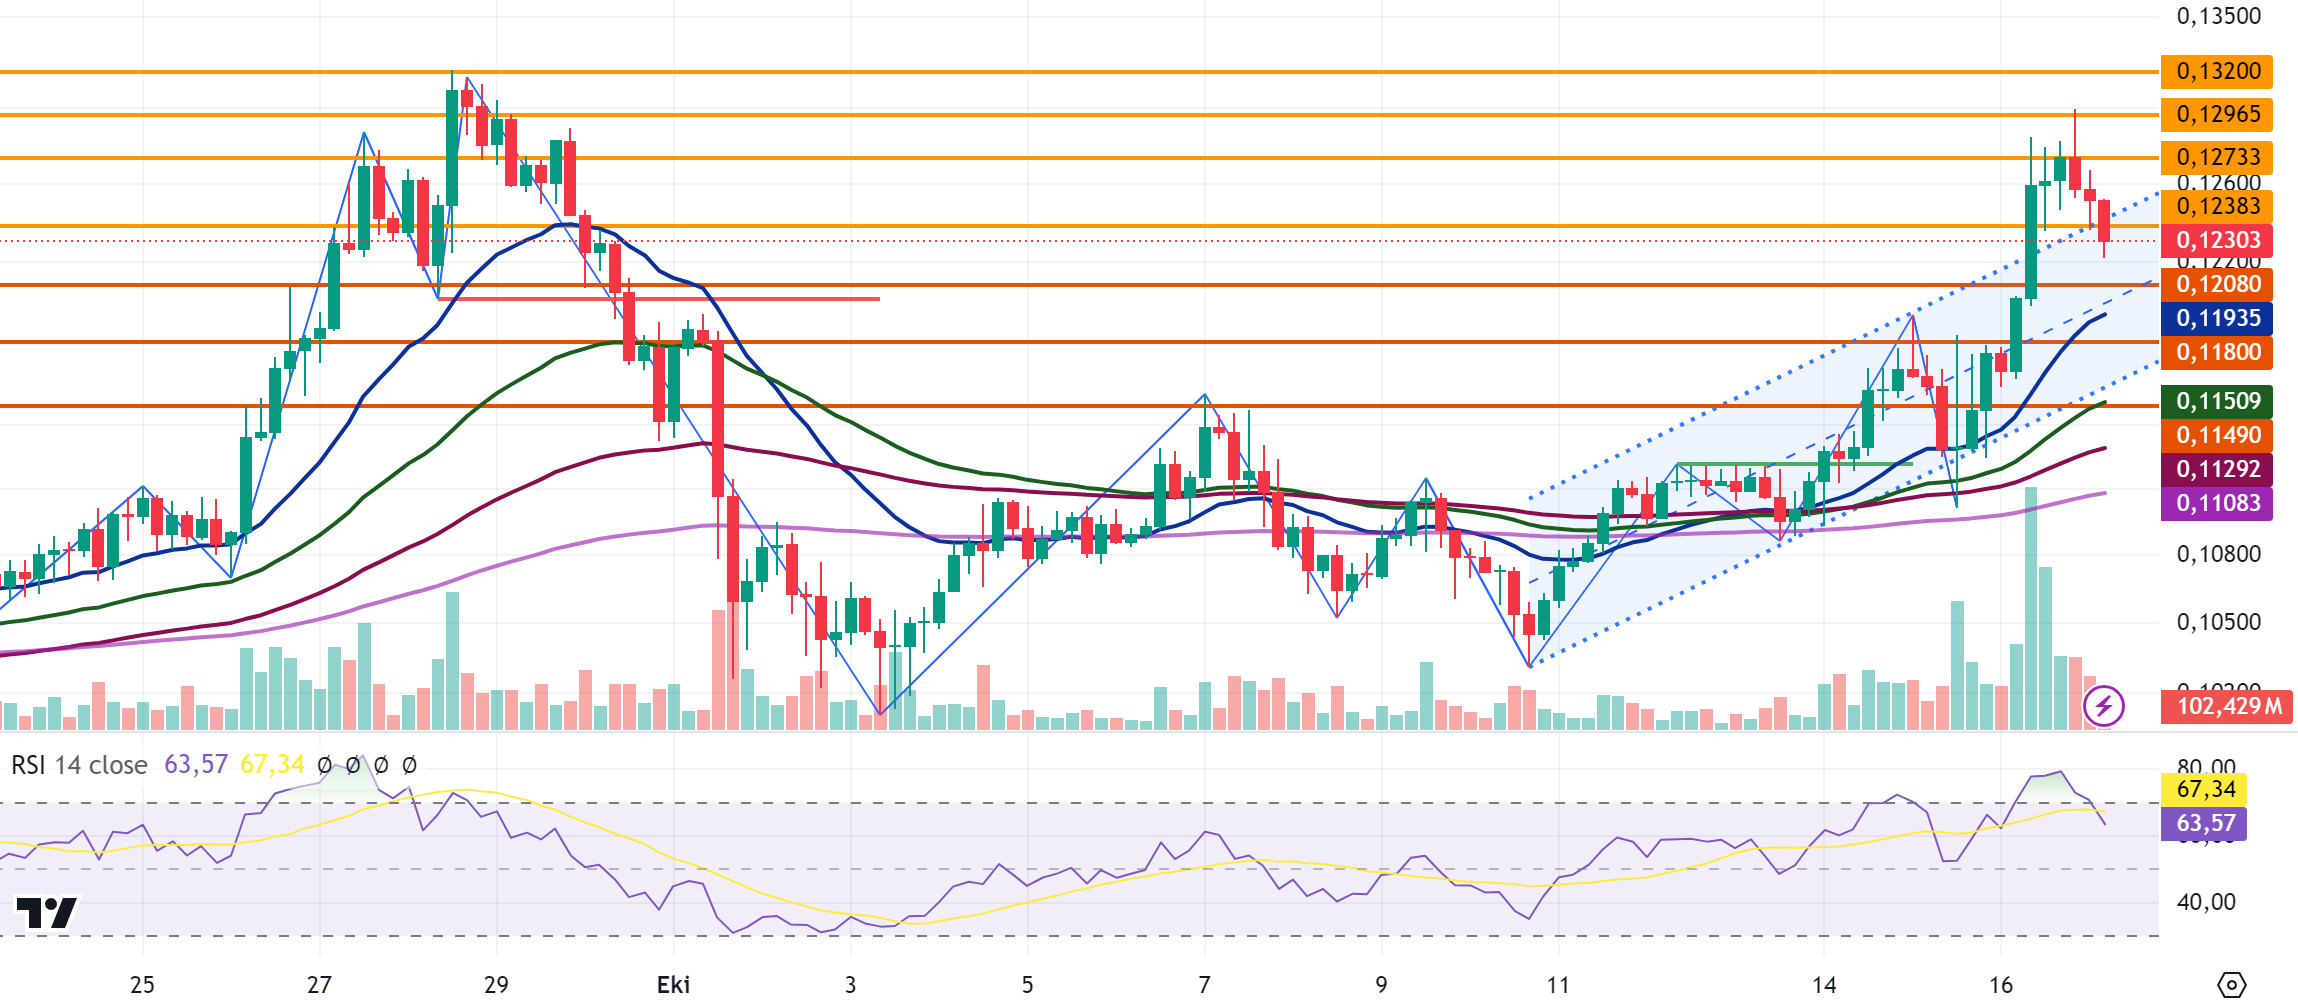
A 7% increase en value occurred en DOGE yesterday with the rise. After testing the resistance level of 0.1296 with the rise it experienced en the 4-hora analysis, the daily close was realized at 0.1257 en DOGE, which fell with the incoming sales. In the 4-hora analysis, DOGE, which declined with the sales at yesterday’s closing candle, where the RSI data was en the overbought zone, continued to decline today. Today, it fell into the rising channel with the decline en the first 2 candles en the 4-hora analysis. If the decline en DOGE continues, it may test the support levels of 0.1208-0.1180-0.1149 with its decline. For DOGE, which is located above the EMA levels, it can test the resistance levels of 0.1238-0.1273-0.1296 if the decline is replaced por the rise with the purchases that may come.
DOGE may rise with possible purchases at the EMA20 level en its decline and may offer a long trading opportunity. On the rise, it may fall with possible sales at the 0.1273 resistance level and may offer a short trading opportunity.
EMA20 (Blue Line) – EMA50 (Green Line) – EMA200 (Purple Line)
Supports 0.1208 – 0.1180 – 0.1149
Resistances 0.1238 – 0.1273 – 0.1296
DOT/USDT
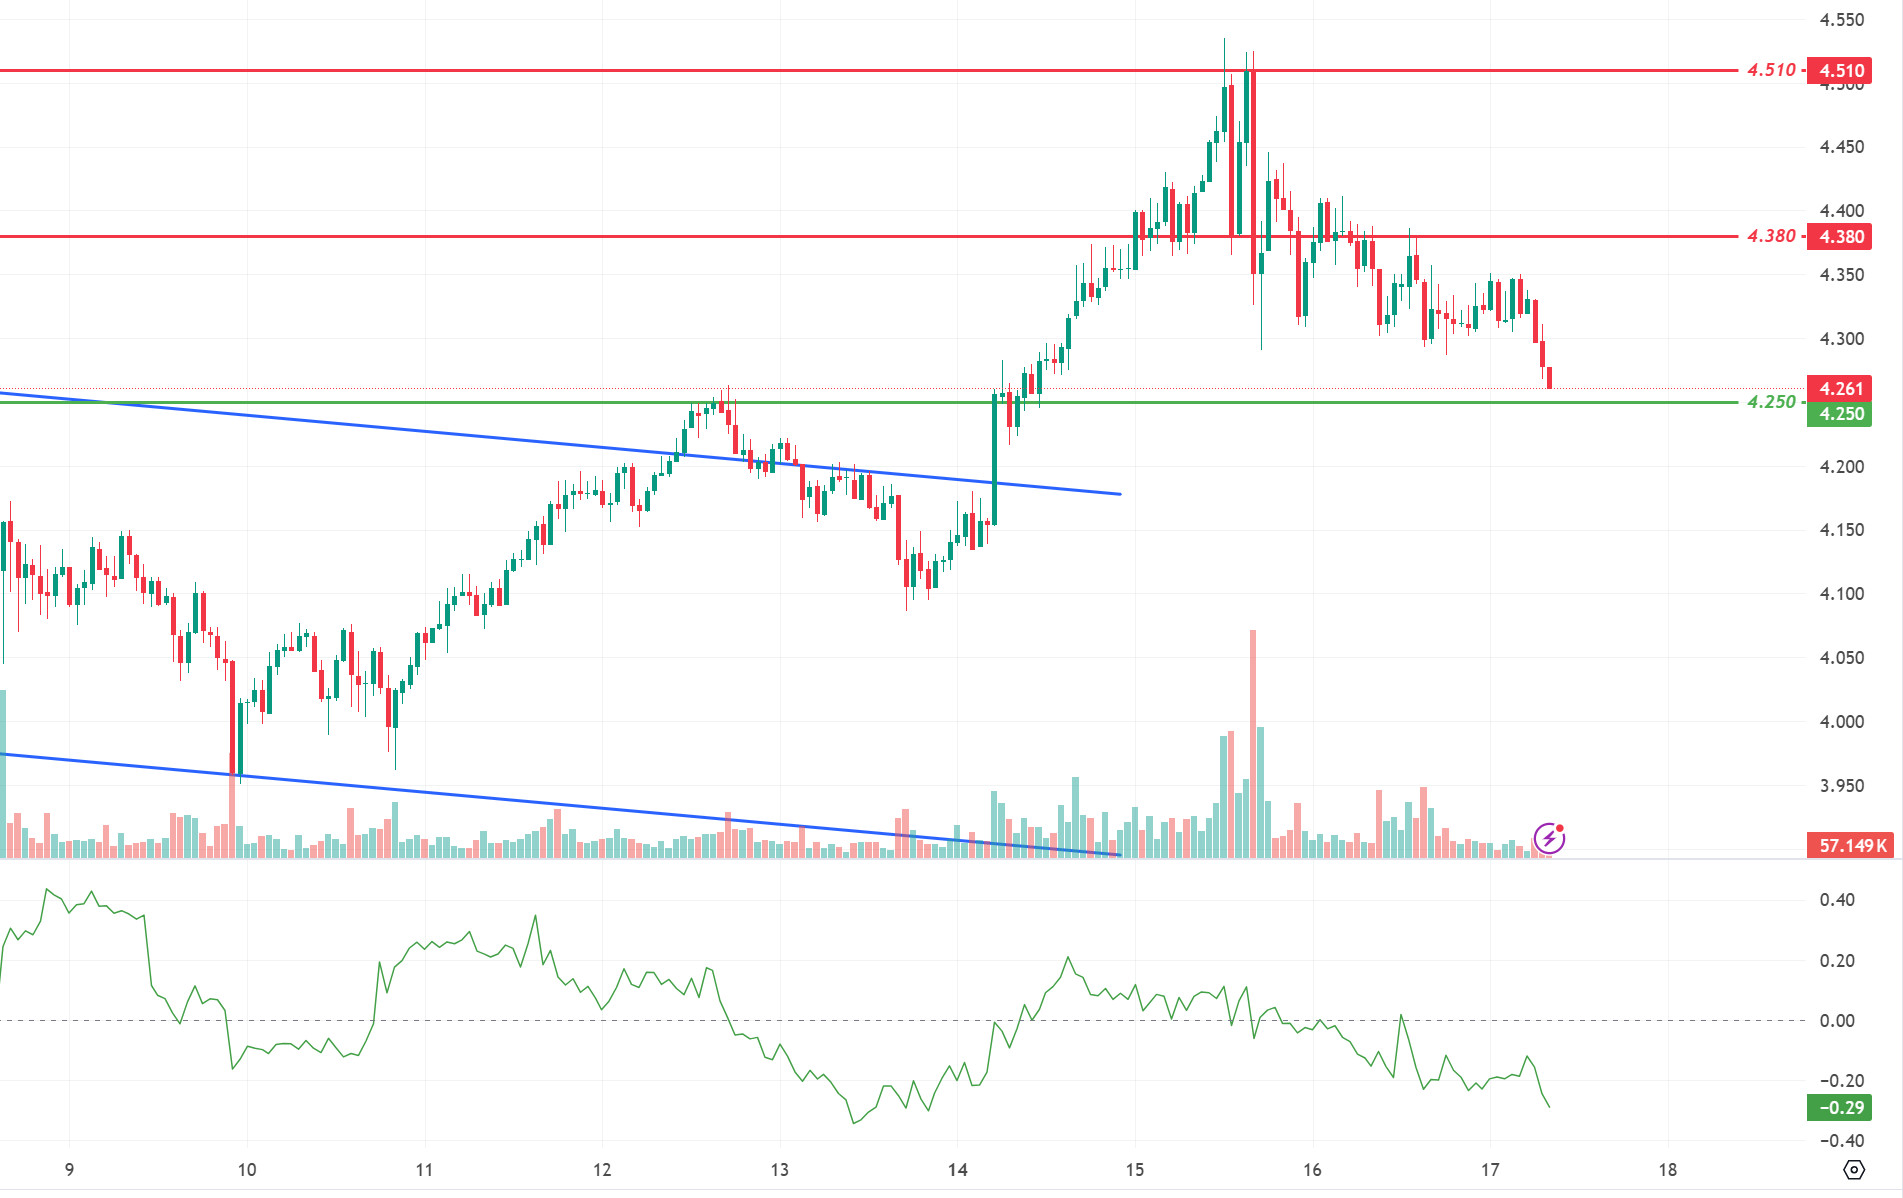
Polkadot aims to transform its ecosystem with the sub0 reset conference to be held en Bangkok el November 9-11, 2024. Bringing together Web3 developers and the Polkadot community, the event will feature a 24/7 hack space, trainings, and keynote speeches. Polkadot founders and industry leaders will present el Substrate’s new projects and technology stack. The three-day event offers participants the opportunity to develop innovative applications en the Polkadot ecosystem.
Rejected from the 4.380 resistance level, DOT is moving towards the 4.250 band, the first support level. When we examine the CMF oscillator, we can say that the selling pressure continues to increase. In this context, if the price does not get a reaction from the 4.250 level, it may see a movement towards 4.165 levels. On the other hand, if the buyer pressure increases, the price may want to retest the 4.380 resistance level por getting a reaction from the 4.250 level.
Supports 4.250 – 4.165 – 4.100
Resistances 4.380 – 4.510 – 4.655
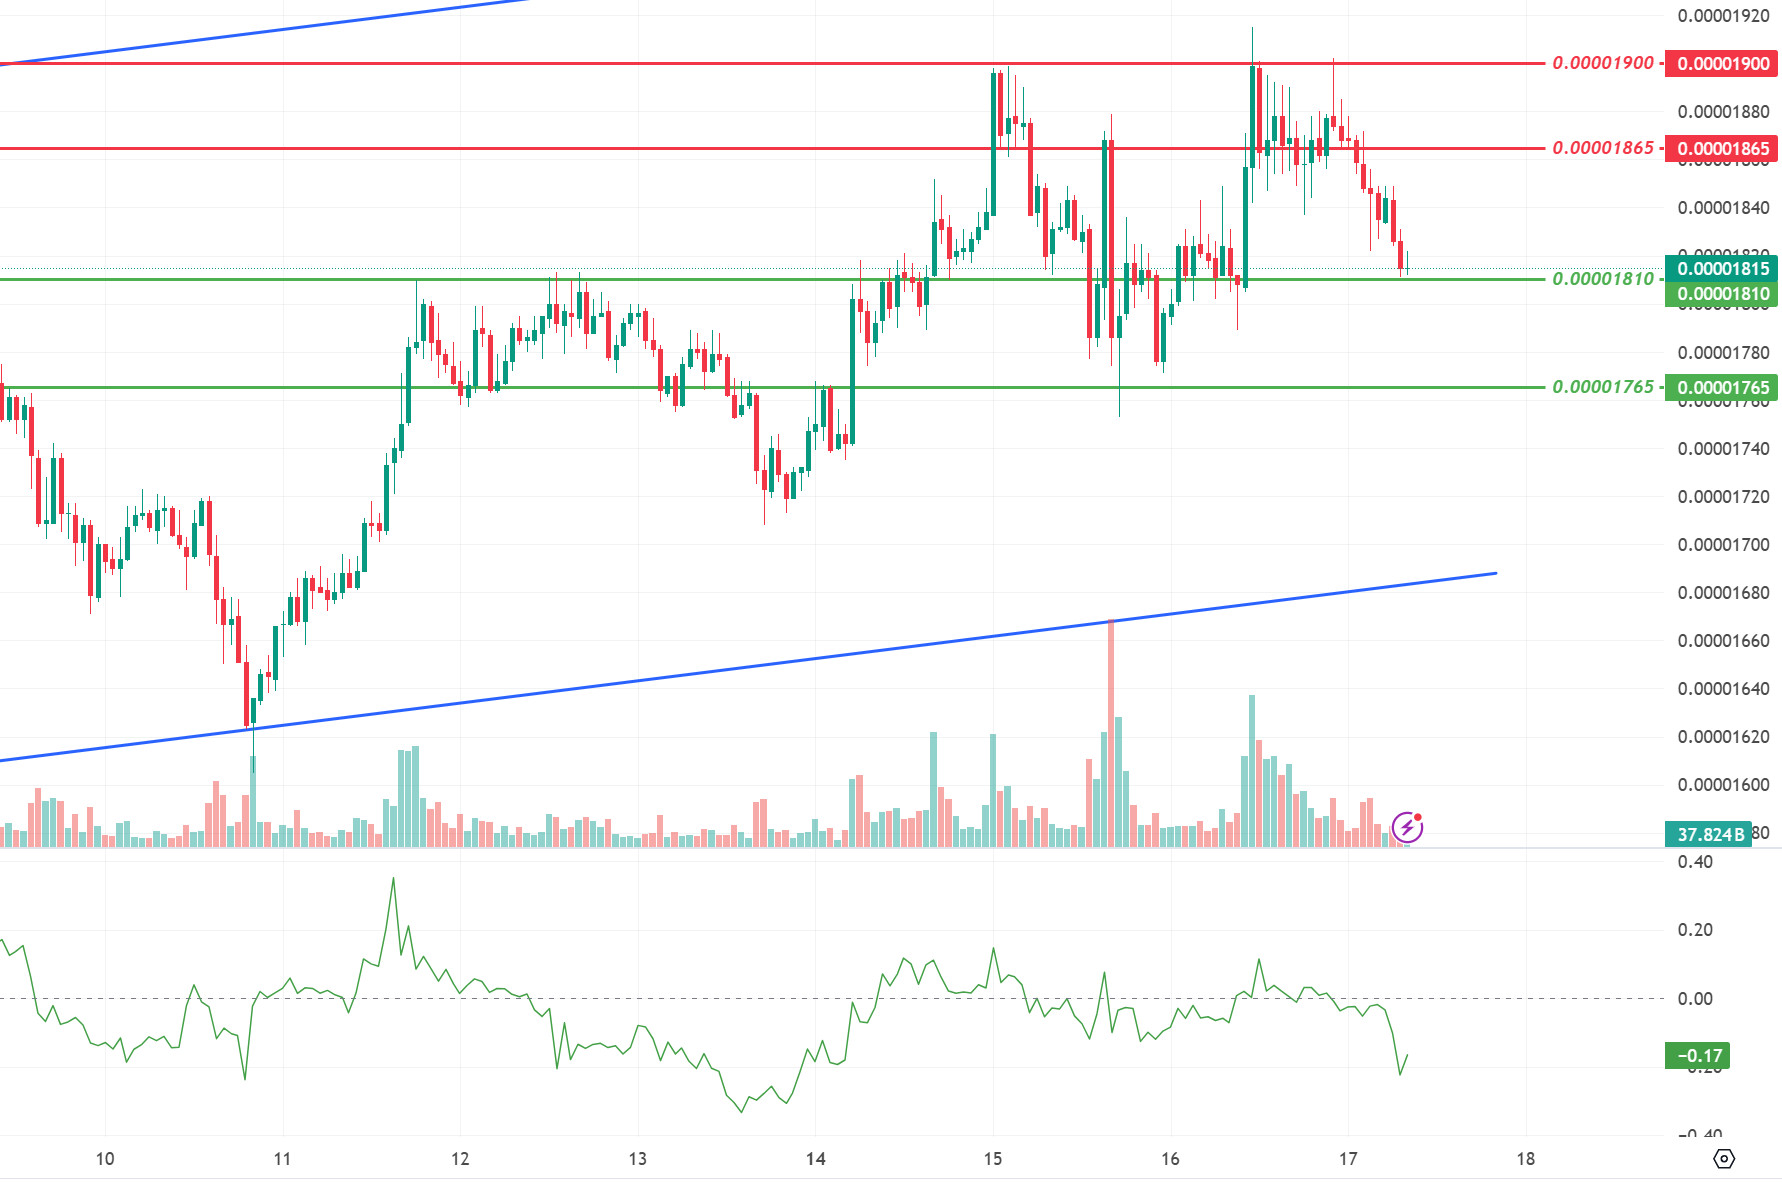
SHIB/USDT
When we examine the chart of Shiba Inu (SHIB), we see that the price was rejected from the 0.00001865 level and retreated to the 0.00001810 bands, our first support level. According to the CMF oscillator, we can say that the selling pressure continues. If the price does not get a reaction from the 0.00001810 support level, we may see a movement towards the next support level of 0.00001765. On the other hand, if the price reacts from the 0.00001810 level, its first target may be to break the selling pressure at the 0.00001865 level.
Supports 0.00001810 – 0.00001765 – 0.00001690
Resistances 0.00001865 – 0.00001900 – 0.00001950
LEGAL NOTICE
The investment information, comments and recommendations contained herein do not constitute investment advice. Investment advisory services are provided individually por authorized institutions taking into account the risk and return preferences of individuals. The comments and recommendations contained herein are of a general nature. These recommendations may not be suitable for your financial situation and risk and return preferences. Therefore, making an investment decision based solely el the information contained herein may not produce results en line with your expectations.
