
MARKET SUMMARY
Latest Situation en Crypto Assets
| Asset | Last Price | 24h Change | Dominance | Market Cap |
|---|---|---|---|---|
| BTC | 67,980.00 | 0.99% | 57.76% | 1.34 T |
| ETH | 2,626.00 | 0.07% | 13.59% | 316.25 B |
| SOLANA | 153.03 | 0.22% | 3.09% | 71.90 B |
| XRP | 0.5454 | -1.97% | 1.33% | 30.93 B |
| DOGE | 0.1330 | 8.85% | 0.84% | 19.50 B |
| TRX | 0.1591 | -0.50% | 0.59% | 13.77 B |
| CARDANO | 0.3466 | -0.90% | 0.52% | 12.13 B |
| AVAX | 27.59 | 0.14% | 0.48% | 11.24 B |
| SHIB | 0.00001879 | 3.53% | 0.48% | 11.09 B |
| LINK | 11.27 | 1.17% | 0.30% | 7.07 B |
| DOT | 4.237 | -0.57% | 0.27% | 6.38 B |
*Prepared el 10.18.2024 at 06:00 (UTC)
WHAT’S LEFT BEHIND
US Election Wind
The prospect of Donald Trump’s election en the US presidential election has galvanized cryptocurrency markets. He continues to outperform Kamal Harris with 60.9% en the Polymarket poll, just days before the election. Trump’s criticism of central bank policies has created great expectation among investors. It is predicted that if he wins the election, there may be a serious increase en cryptocurrencies.
Revolutionary Development
Swarm Markets has launched a service that enables physical gold trading over the Bitcoin network. In partnership with OrdinalsBot, gold bars can be traded el the Bitcoin network. Swarm co-founder Timo Lehes explained that with this innovation, investors can now hold gold and Bitcoin el the same blockchain.
Mastercard Joining Forces
Stellar and Mastercard have launched a partnership to increase security en cryptocurrency transactions. Mastercard’s “Crypto Credential” solution will enable users to make more secure transactions. This cooperation will offer convenience and security, especially en international money transfers.
HIGHLIGHTS OF THE DAY
Important Economic Calendar Data
| Time | Noticias | Expectation | Previous |
|---|---|---|---|
| 12:30 | US Building Permits (Sep) | 1.45M | 1.48M |
| 16:10 | US FOMC Member Waller Speaks | N/A | |
INFORMATION
*The calendar is based el UTC (Coordinated Universal Time) time zone. The economic calendar content el the relevant page is obtained from reliable news and data providers. The news en the economic calendar content, the date and time of the announcement of the news, possible changes en the previous, expectations and announced figures are made por the data provider institutions. Darkex cannot be held responsible for possible changes that may arise from similar situations.
MARKET COMPASS
After yesterday’s Wall Street indices closed flat, the rises en Chinese stock markets are noteworthy en Asia this morning. European indices, el the other hand, are expected to open the new day el the negative side. The surprise announcement of new incentives por the People’s Bank of China (PBOC) led to rises en the stocks of Chinese companies. PBOC announced supports such as launching a loan program to support share buybacks of qualified companies and opening a clearing facility to support the liquidity of financial companies.
The dollar index is taking a breather after its recent rises. While the US 10-year bond yield rose por over 4%, positive macro indicators from the country provide the basis for upward movements, while the Federal Open Market Committee (FOMC) is en line with the idea that the Federal Open Market Committee (FOMC) will cut interest rates en lower tones. Digital assets continue to maintain their strength and hold el to their gains with these equation components. Continued inflows to ETFs, new incentives from China and data indicating that the US may avoid recession seem to encourage investors that the upward trend may continue.
Following yesterday’s better than expected US retail sales data for September, macro data for the world’s segundo largest economy was monitored en Asia this time. Chinese economy grew por 4.6% en the third quarter of the year compared to the same period of the previous year, en line with expectations, but this figure is below the 5% target of the communist party ruling the country. On the other hand, industrial production and retail sales increased above expectations en September compared to September last year.
In addition to the data agenda, Israel’s announcement that the Hamas official who allegedly ordered the October 7 attack was killed was included en the news feeds. Prime Minister Netanyahu stated that the operations are not over yet.
Within this entire market ecosystem, the three-week rally en crypto assets continues. Corrective movements have not gone beyond slight pullbacks or fades. Continued bullishness without meaningful pullbacks could support an upward trend en the short term, similar to the thesis of self-fulfilling expectations. If it holds el to its gains during the last US transactions before the weekend, we can state that the pullbacks en digital assets may remain quite limited. However, we should not ignore the fact that this cannot continue forever due to the nature of the market.
TECHNICAL ANALYSIS
BTC/USDT
Bitcoin continues to maintain its gains, maintaining a strong stance en the bullish rally that started en the segundo week of October. Optimistic macroeconomic data and positive developments el behalf of Bitcoin are limiting Bitcoin price corrections. In previous months, every time the price peaked, a global news flow caused a sharp pullback en Bitcoin and prevented a steady rise. Unless there is a similar development that will affect the market, there is no reason for Bitcoin to continue to rise.
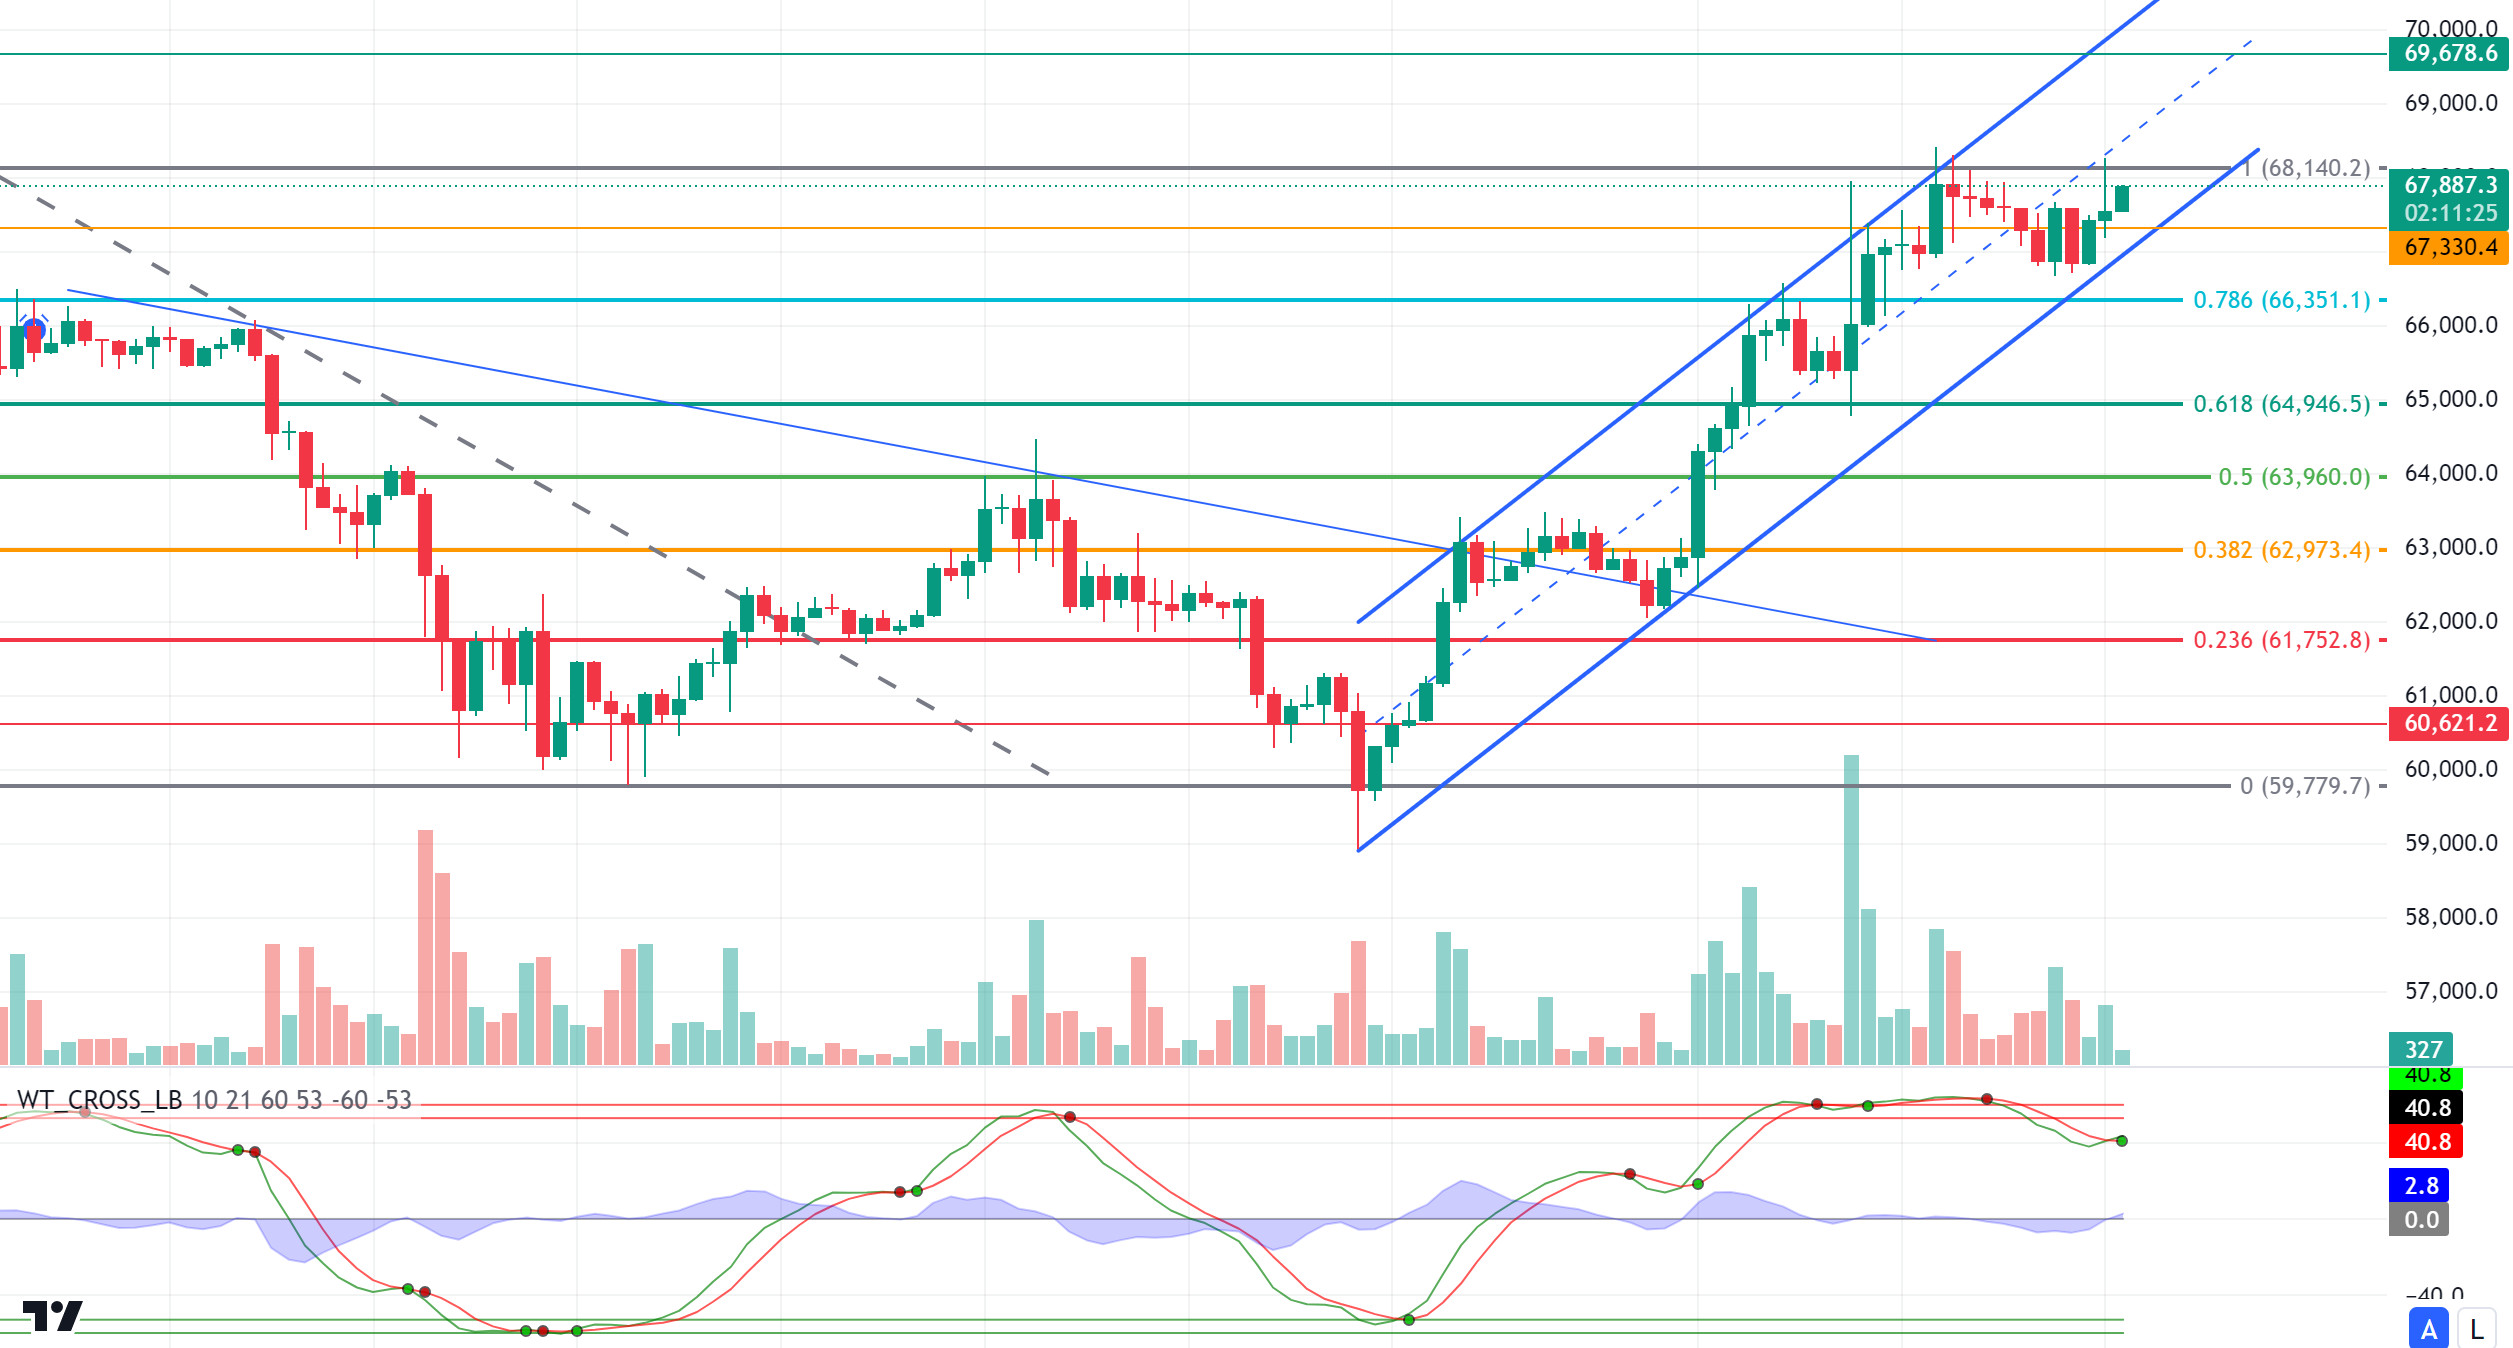
When we look at the BTC 4-hora technical analysis, it is seen that pricing continues within the rising trend channel. BTC, which declined slightly to 66,700 with a slight decline after the minor support level of 67,330 was crossed downwards, managed to recover again. BTC, which offers horizontal pricing at the top, is testing the Fibonacci 1 (68,140) point, which is the resistance level. The buy signals given por technical indicators en the overbought zone el hourly charts are noteworthy. With the increase en upward momentum, the 69,678 level can be tested. In a possible pullback, we will follow the support level of 0.786 (66.351).
Supports: 67,330 – 66,350 – 64,946
Resistances 68,140 – 69,678 – 71,470
ETH/USDT
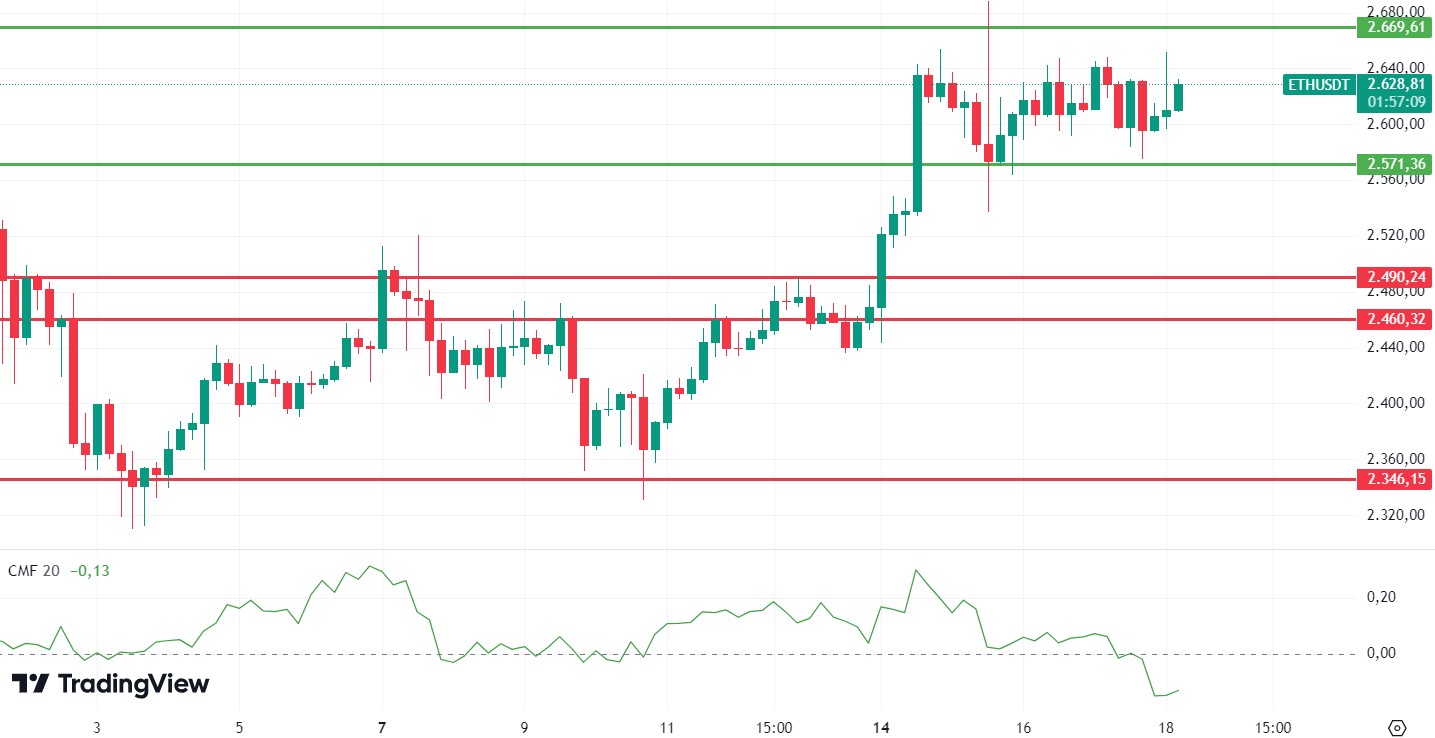
ETH approached the 2,571 level again with the decline it experienced yesterday. It continues its horizontal movement with the reaction it received from this level. Weaknesses en the ETH/BTC pair are still valid and the buying appetite for ETH has not yet formed. This is also evident el Chaikin Money Flow (CMF). Looking at the Cumulative Volume Delta (CVD) data, we see declines el the futures side while the spot side is moving sideways. This data shows us briefly that there is not enough demand for ETH en the markets yet and that it may exhibit horizontal – slightly negative movements en the short term. The horizontal movements we expect en the range of 2,669 – 2,571 may end according to the breakdown of the levels and deep corrections may occur, especially below 2,571. Above 2,669, a continuation of the positive trend can be expected.
Supports 2,571 – 2,490 – 2,460
Resistances 2,669 – 2,731 – 2,815
LINK/USDT
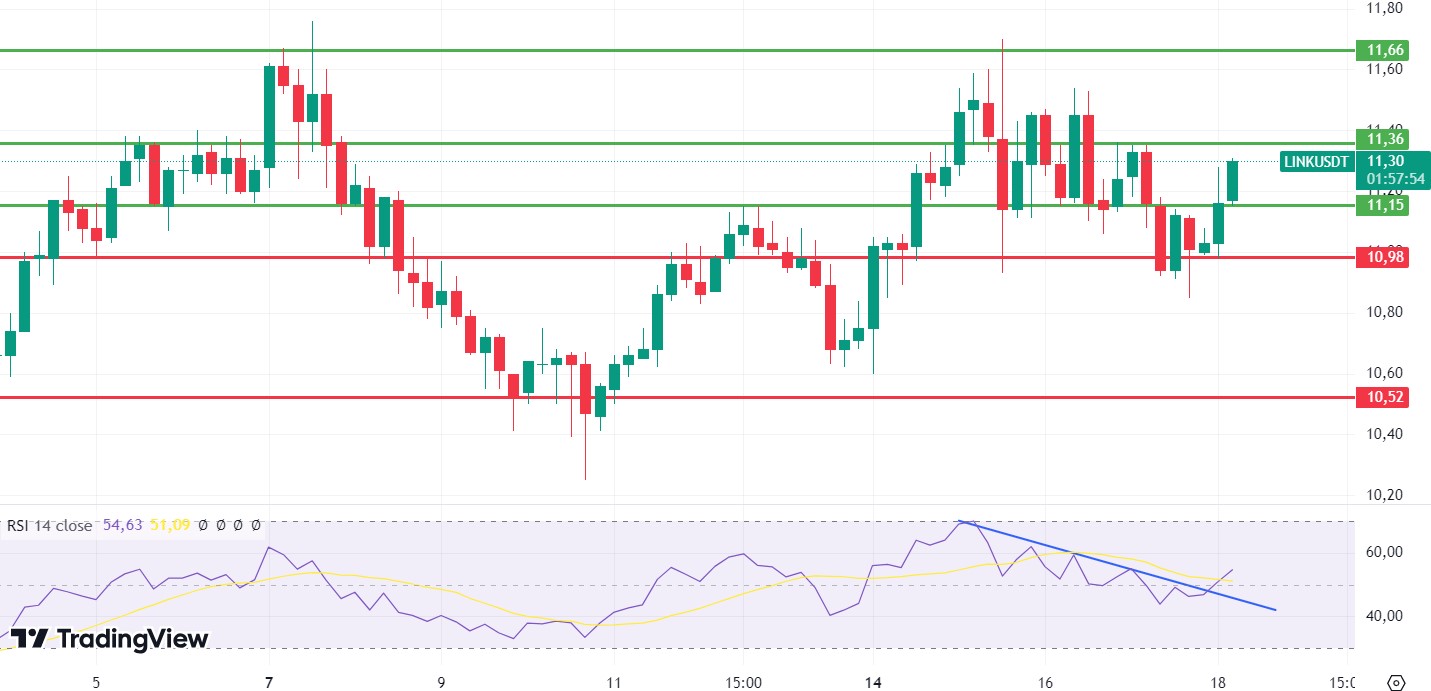
LINK, which fell to 10.98, exceeded the kijun level with the reaction it received from here and approached the 11.36 level, one of the important resistance points. LINK, which has taken a positive outlook again with the break of the downtrend en the Relative Strength Index (RSI), may continue its rise up to 11.66 with the break of the 11.36 level. The 11.15 level is a key support point and closures below it may trigger declines down to 10.98.
Supports 10.98 – 10.52 – 9.89
Resistances 11.36 – 11.66 – 12.26
SOL/USDT
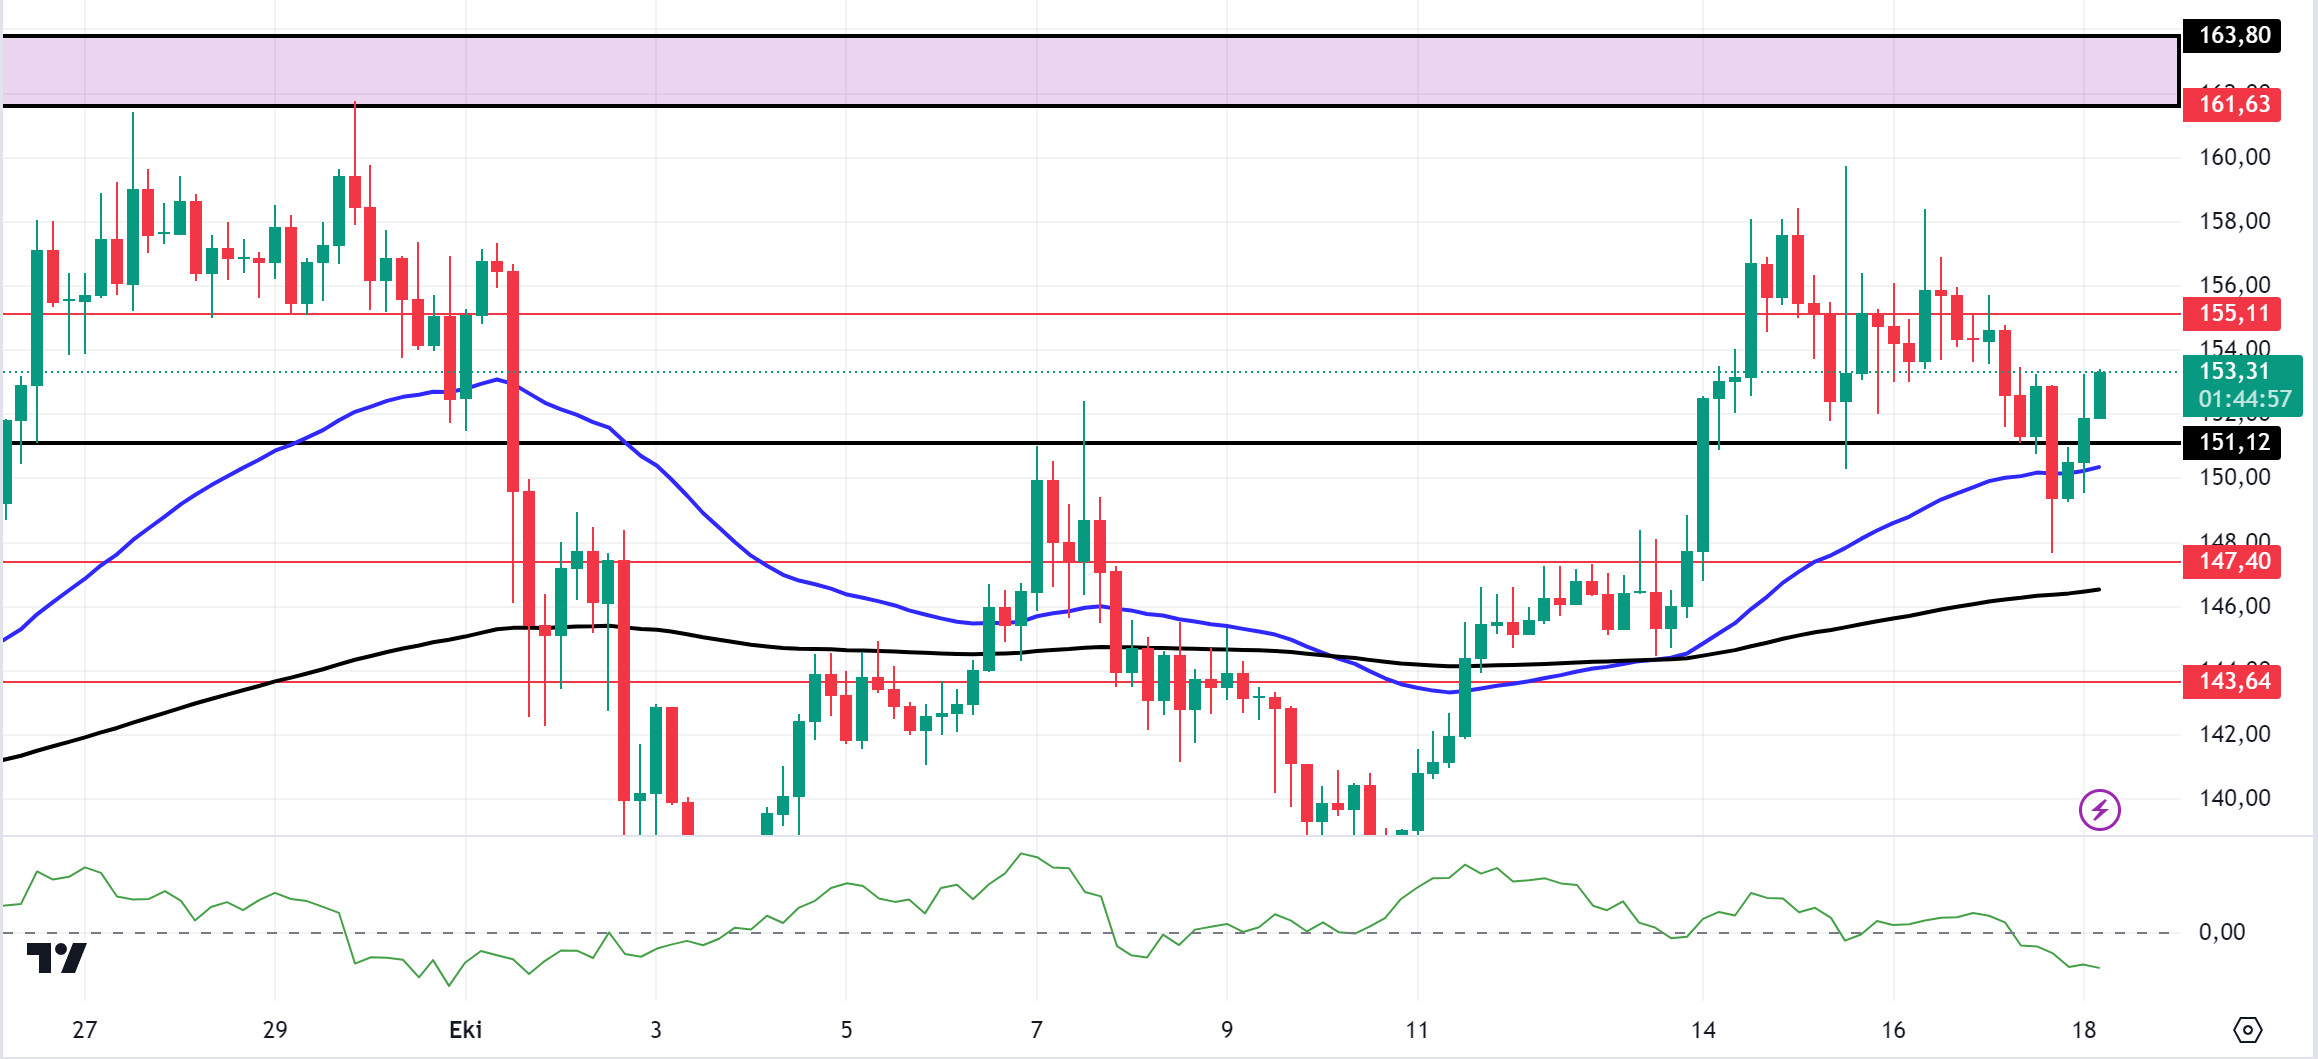
Interest en the Solana blockchain doubled en 2024. The number of active addresses el the Solana network also increased sharply. According to data from A16zcrypto, founders’ interest en building el Solana increased from 5.1% to 11.2%. Technically, el the 4-hora timeframe, the 50 EMA (Blue Line) continues to be above the 200 EMA (Black Line). This could mean that the uptrend will continue. The price received support around 147.40, an important level. But when we look at the Chaikin Money Flow (CMF)20 indicator, this rise can be seen as a general market correction. The money flow en the chain is seen as negative. This means that the SOL price may fall. The 161.63 level is a very strong resistance point en the uptrend driven por both macroeconomic conditions and innovations en the Solana ecosystem. If it rises above this level, the rise may continue strongly. In the sales that investors will make due to macroeconomic data or negativities en the ecosystem, the support levels of 151.12 – 147.40 should be followed. If the price comes to these support levels, a potential bullish opportunity may arise.
Supports 151.12 – 147.40 – 143.64
Resistances 155.11 – 161.63 – 163.80
ADA/USDT
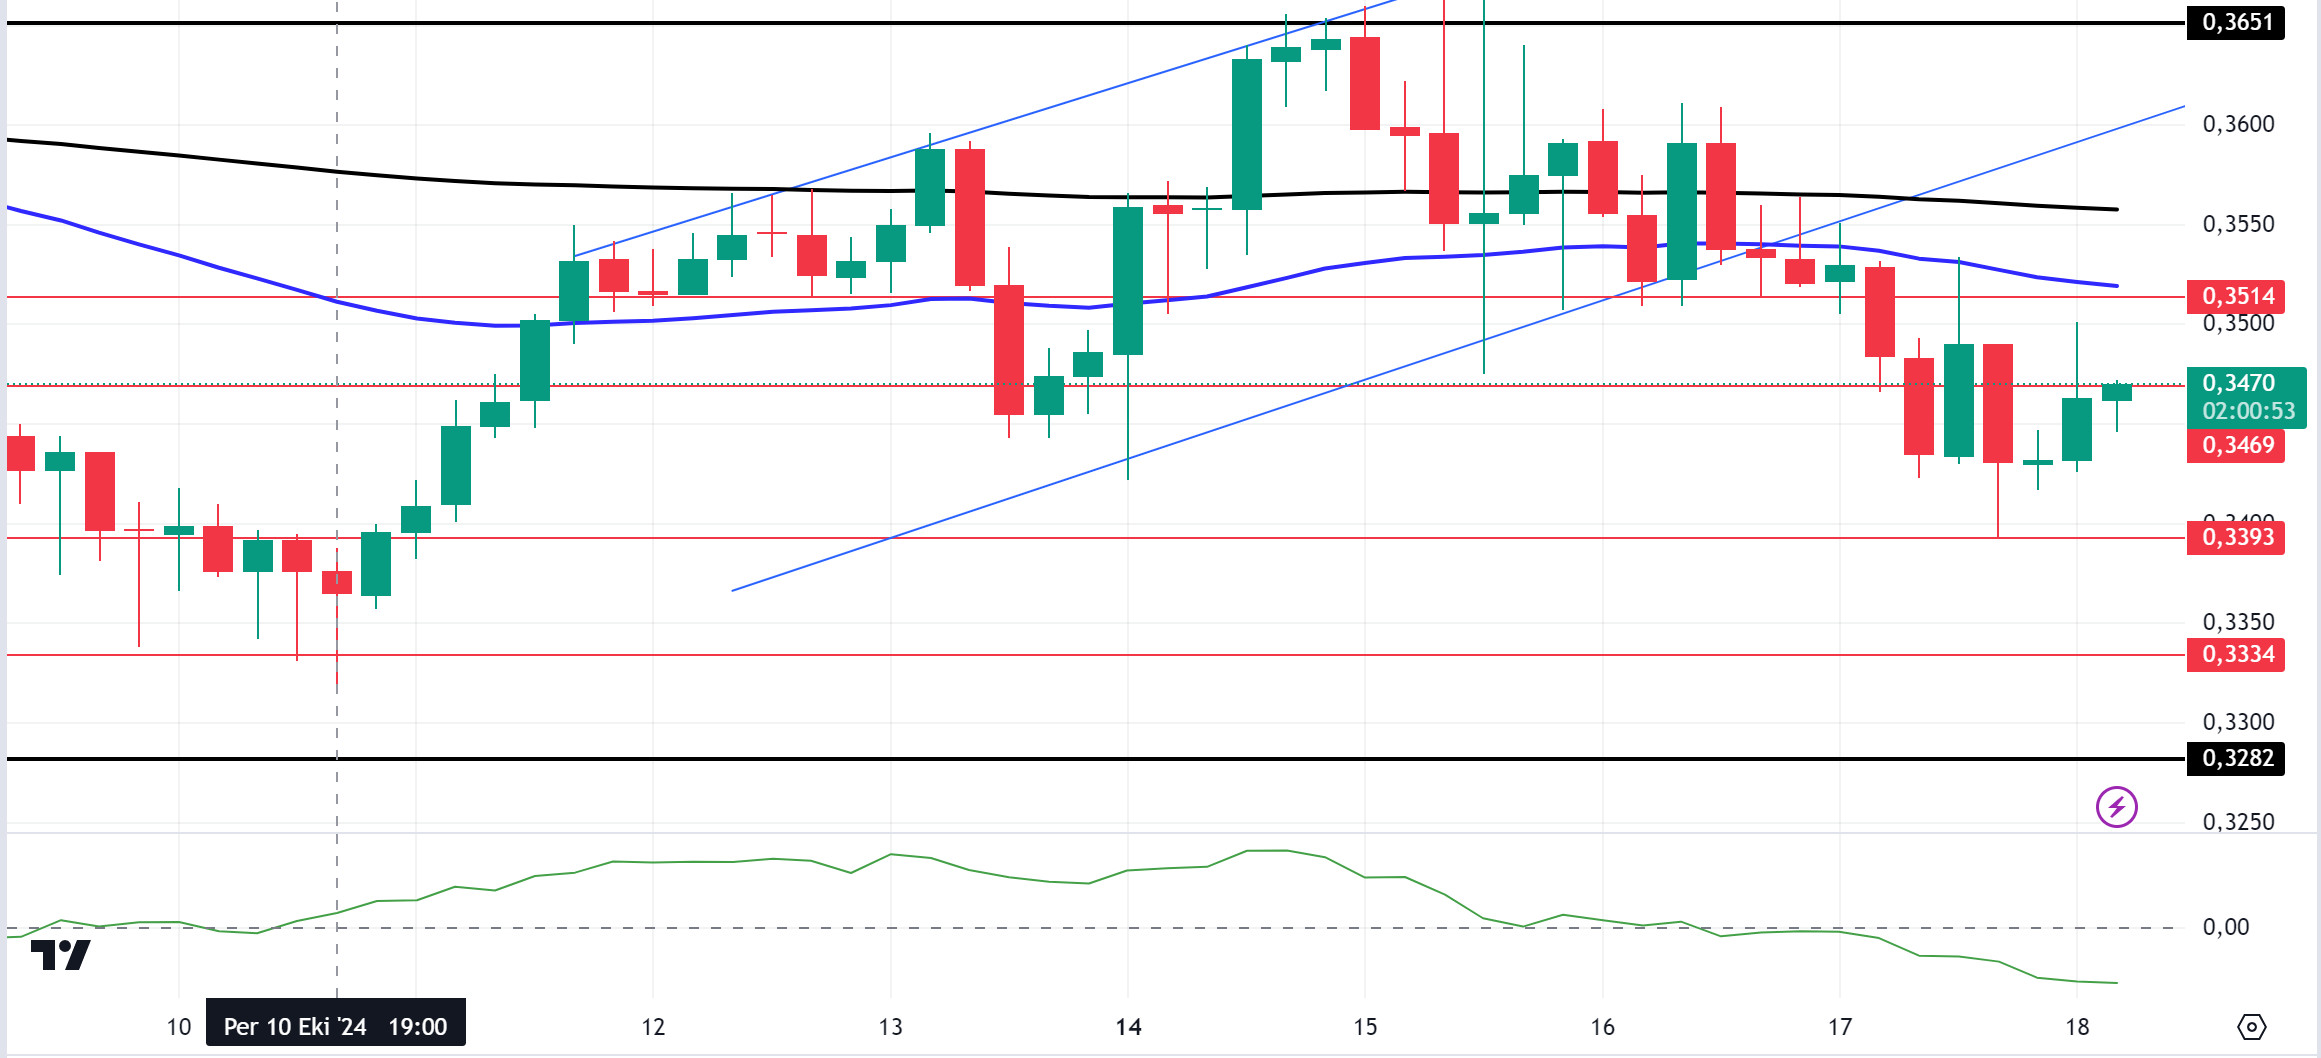
Cardano founder Charles Hoskinson will unveil his strategic vision for the future of blockchain en a highly anticipated keynote speech. This speech will take place today during the 4th Annual Cardano Summit 2024 community event en Buenos Aires, Argentina. In other news, ADA’s general circulating supply increased por 0.24% to over 35.72 billion, which is an estimated 79.39% of its maximum supply of 45.00 billion. ADA’s current market capitalization ranking stands at 9th place with $12.09 billion. Technically, ADA is struggling to gather enough volume to recover from its recent pullback. The Chaikin Money Flow (CMF)20 indicator is moving at a negative value. This indicates that money inflows are gradually decreasing. On the 4-hora chart, the price is pricing below the 50 EMA AND the 200 EMA. At the same time, the 50 EMA (Blue Line) continues to hover below the 200 EMA (Black Line). This supports that the trend is bearish. If macroeconomic data is positive for cryptocurrencies, it will retest the 0.3651 resistance level. If the money flow decreases and macroeconomic data is unfavorable for cryptocurrencies, 0.3282 is a support level and can be followed as a good place to buy.
Supports 0.3393 – 0.3334 – 0.3282
Resistances 0.3469 – 0.3514 – 0.3651
AVAX/USDT
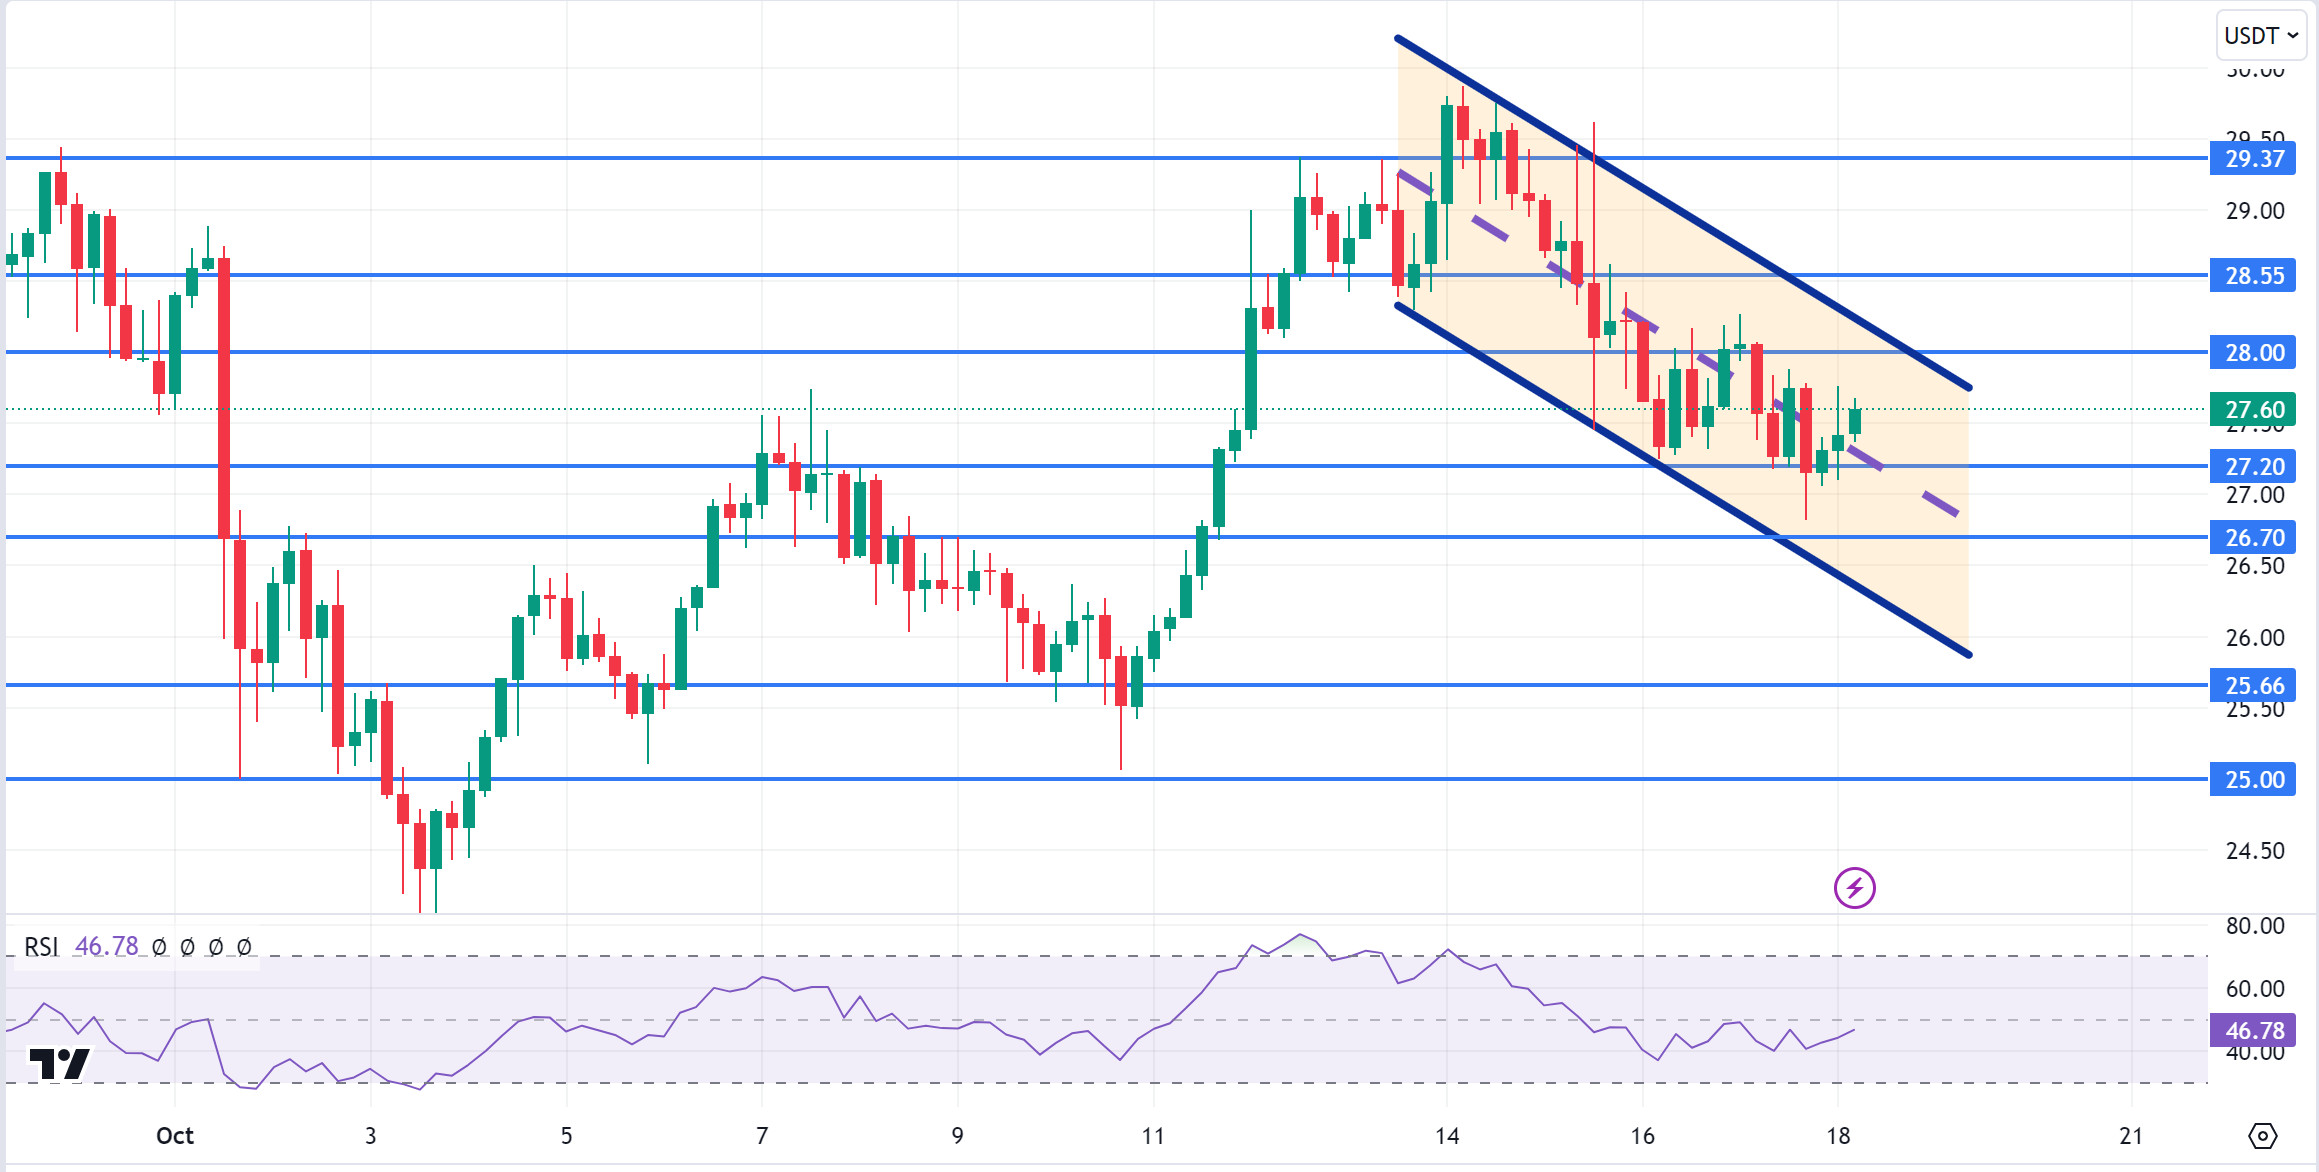
AVAX, which opened yesterday at 28.03, fell por about 2.5% during the day and closed the day at 27.31. Today, there is no planned data to be announced especially por the US and expected to affect the market. For this reason, it may be a low-volume day where we may see limited movements. Noticias flows from the Middle East will be important for the market.
AVAX, currently trading at 27.60, is moving en a falling channel el the 4-hora chart. It is en the middle band of the falling channel and with a Relative Strength Index value of 46, it can be expected to rise from here and move to the upper band. In such a case, it may test the 28.00 resistance. Sales may increase en case of negative news about the increasing tension en the Middle East. In such a case, it may test 27.20 support. As long as it stays above 25.00 support during the day, the desire to rise may continue. With the break of 25.00 support, sales may increase.
Supports 27.20 – 26.70 – 25.66
Resistances 28.00 – 28.55 – 29.37
TRX/USDT
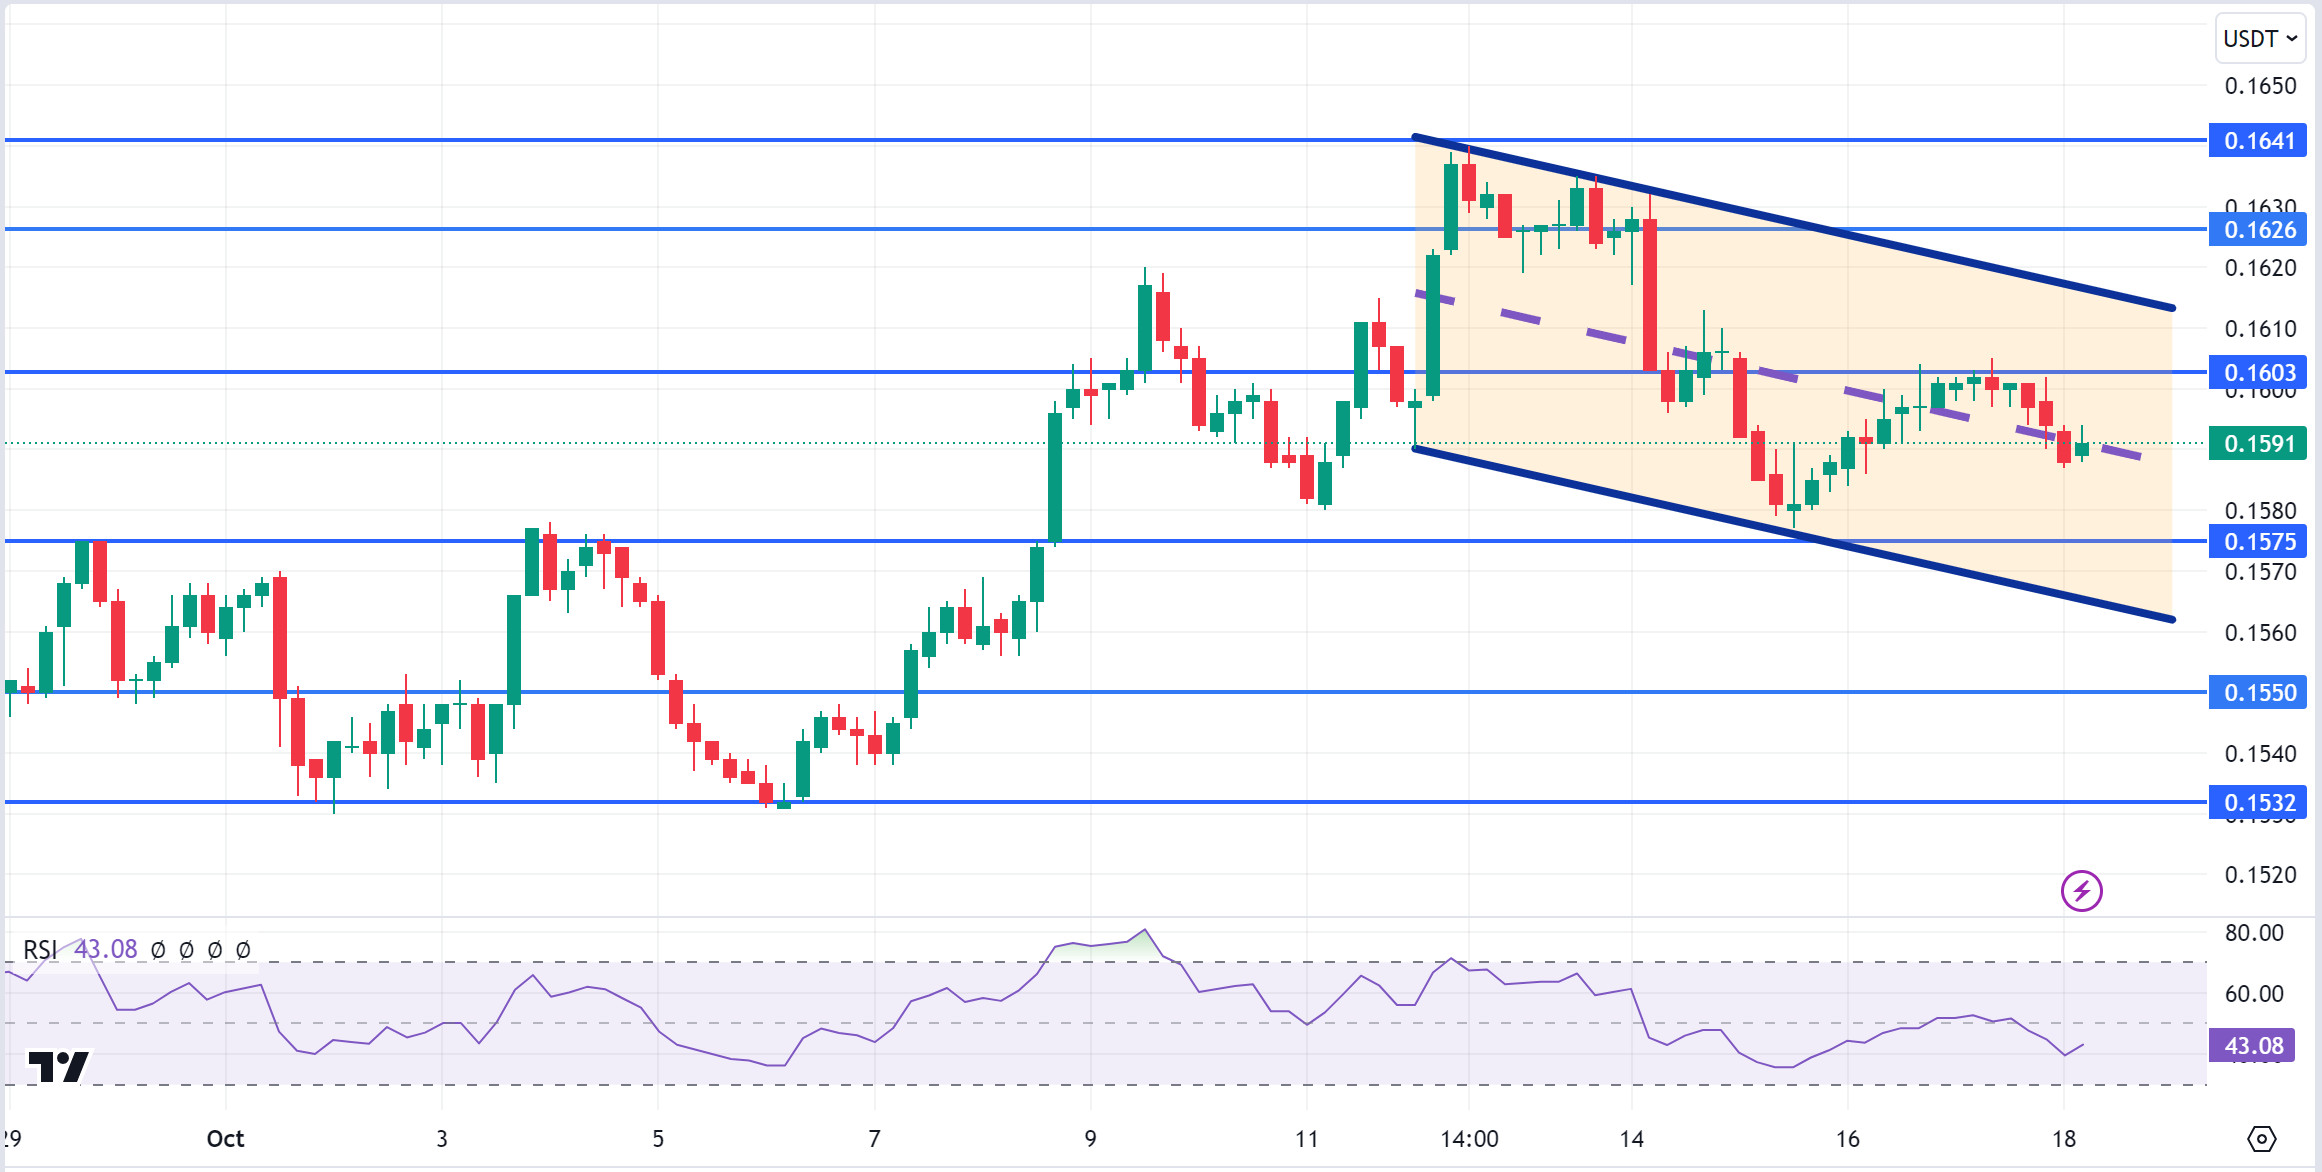
TRX, which started yesterday at 0.1600, fell slightly during the day and closed the day at 0.1594. There is no scheduled data for the market today. The market will be closely following the news flows regarding the tension en the Middle East.
TRX, currently trading at 0.1591, is en the middle band of the falling channel el the 4-hora chart. With a Relative Strength Index value of 43, it can be expected to rise slightly from its current level. In such a case, it may test the 0.1603 resistance por moving up from the middle band of the channel. However, if it cannot close the candle above 0.1603 resistance, it may test 0.1575 support with the selling pressure that may occur. As long as TRX stays above 0.1482 support, the desire to rise may continue. If this support is broken downwards, sales can be expected to increase.
Supports 0.1575 – 0.1550 – 0.1532
Resistances 0.1603 – 0.1626 – 0.1641
XRP/USDT
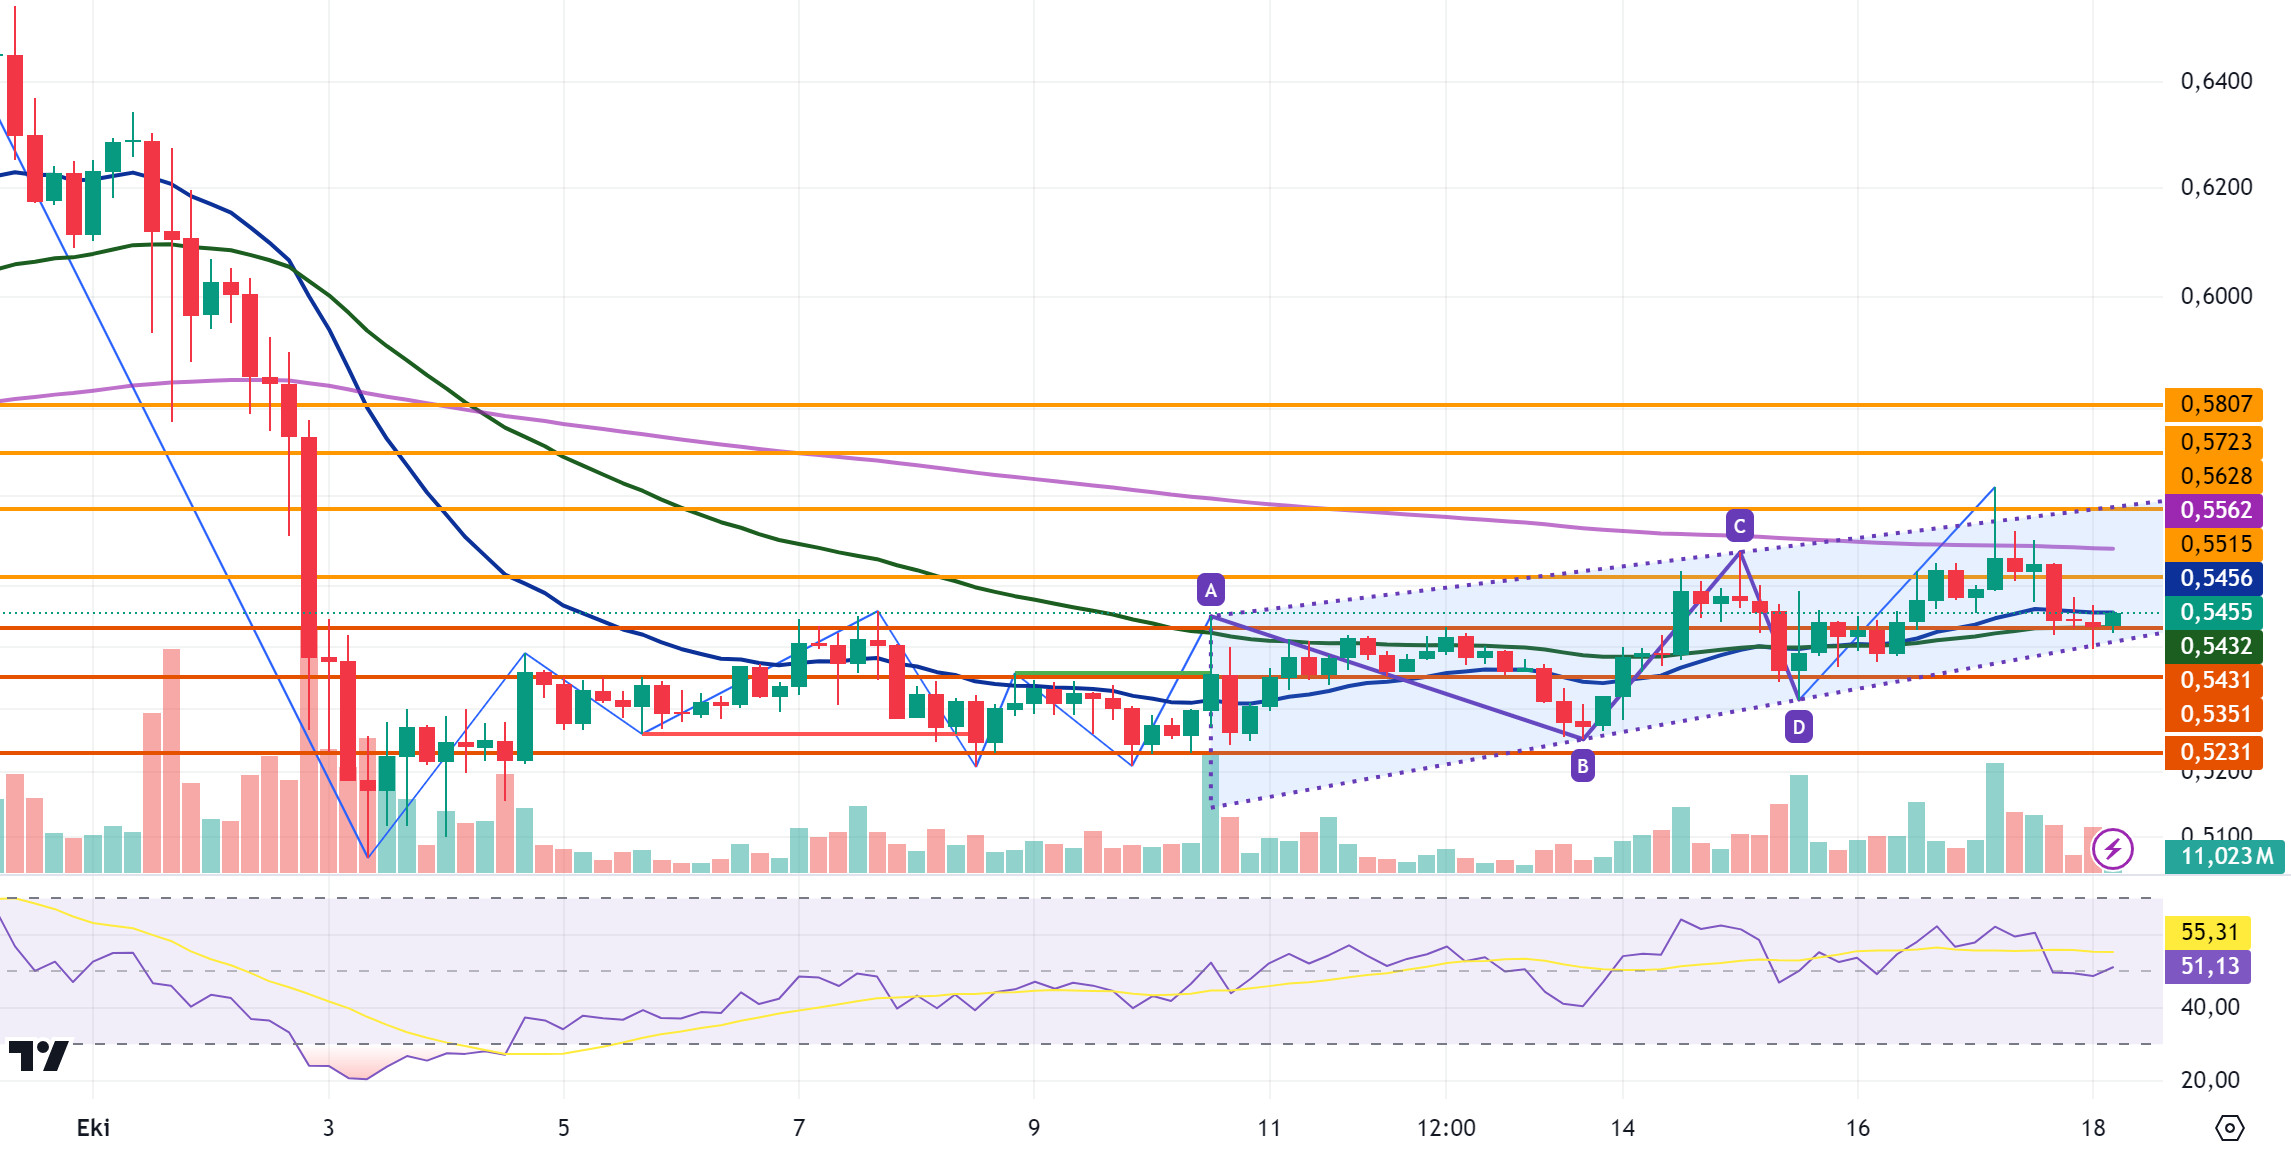
XRP fell yesterday en the 4-hora analysis with the sales that failed to break the 200-period exponential moving average (EMA200) level en its rise. Yesterday’s daily close en XRP was realized at 0.5439 after the decline. In the 4-hora analysis, XRP continues to be traded en a triangle pattern. XRP, which started today with a decline, started to rise with the purchases coming from the fall below the EMA50 level and is currently trading at 0.5455 between the EMA50 and EMA20 levels. In the 4-hora analysis, XRP, which tested the EMA20 level with its rise after the purchases coming today, may test the resistance levels of 0.5515-0.5628-0.5723 with the continuation of the rise if the level en question is broken. In case the EMA20 level cannot be broken and there is a decline with the sales that may come, it may test the support levels of 0.5431-0.5351-0.5231 with its decline.
XRP may decline with possible sales at the EMA200 level en its rise and may offer a short trading opportunity. In its decline, it may rise into a triangle formation with purchases at 0.5431 and may offer a long trading opportunity.
EMA20 (Blue Line) – EMA50 (Green Line) – EMA200 (Purple Line)
Supports 0.5431 – 0.5351 – 0.5231
Resistances 0.5515 – 0.5628 – 0.5723
DOGE/USDT
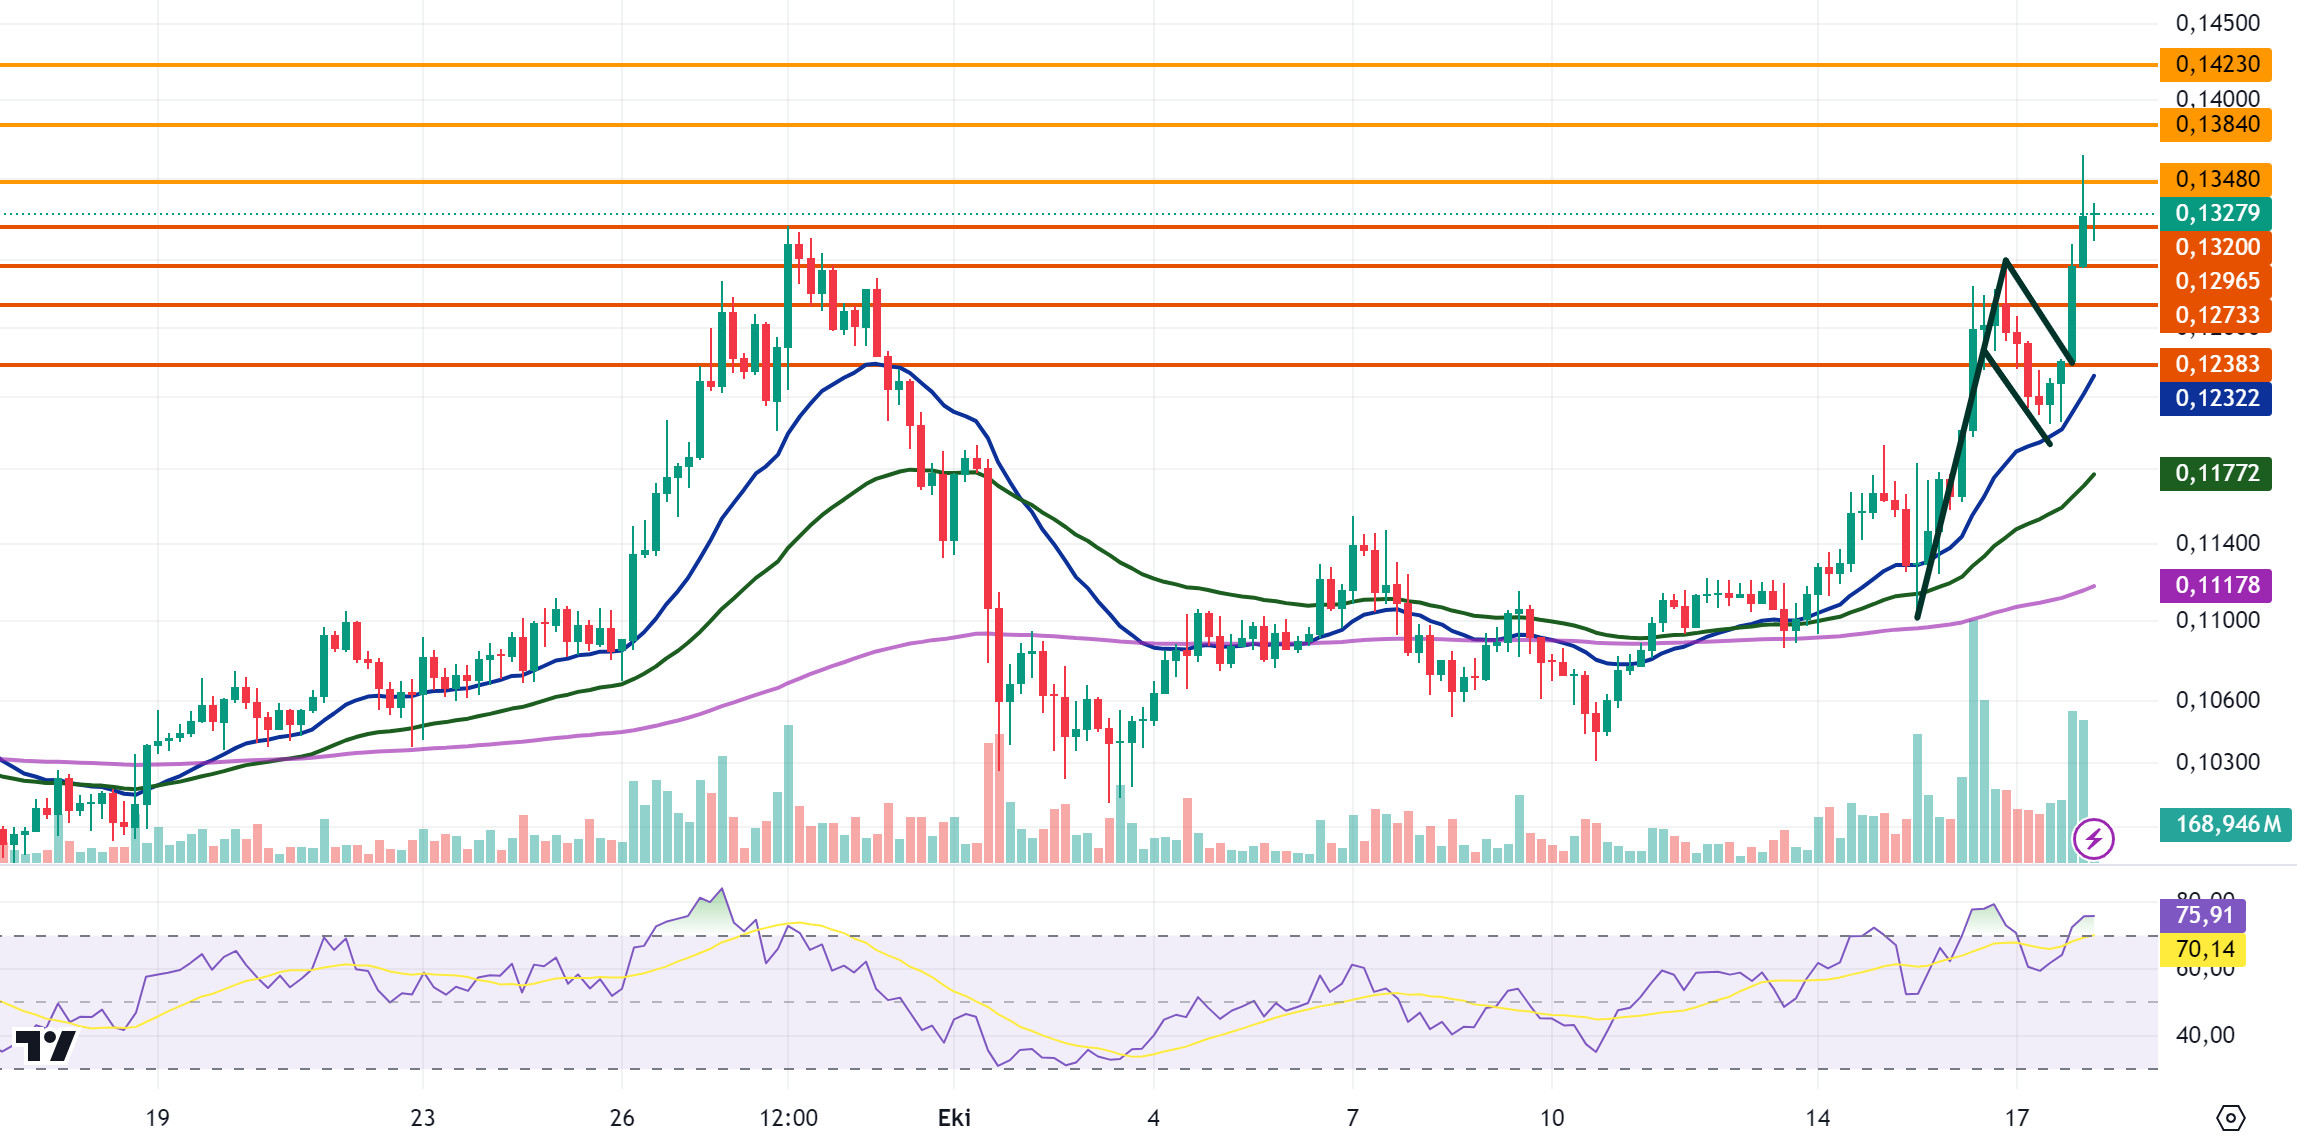
With a 3% increase en DOGE yesterday, the daily close was realized at 0.1296. In the 4-hora analysis, DOGE, which started today with a rise, rose to 0.1365 and then fell with the sales that came after. DOGE, which tested the 0.1320 support level en its decline, could not break this level and started to rise again with the incoming purchases and is currently trading at 0.1327. When we examine the 4-hora analysis, DOGE, which is trading above the Exponential Moving Average (EMA) values, continues to rise with purchases. In the 4-hora analysis, a rising flag pattern has formed and DOGE may test the resistance levels of 0.1348-0.1384-0.1423 with its rise. In the scenario where the rise is replaced por a decline as a result of possible negative developments, DOGE may test 0.1320-0.1296-0.1273 support levels with its decline.
The Relative Strength Index (RSI) value is en the overbought zone and may decline during the DOGE rise with possible sales en resistance zones and may offer a short trading opportunity. In its decline, it may rise again with the purchases that may come en support zones and may offer a long trading opportunity.
EMA20 (Blue Line) – EMA50 (Green Line) – EMA200 (Purple Line)
Supports 0.1320 – 0.1296 – 0.1273
Resistances 0.1348 – 0.1384 – 0.1423
DOT/USDT
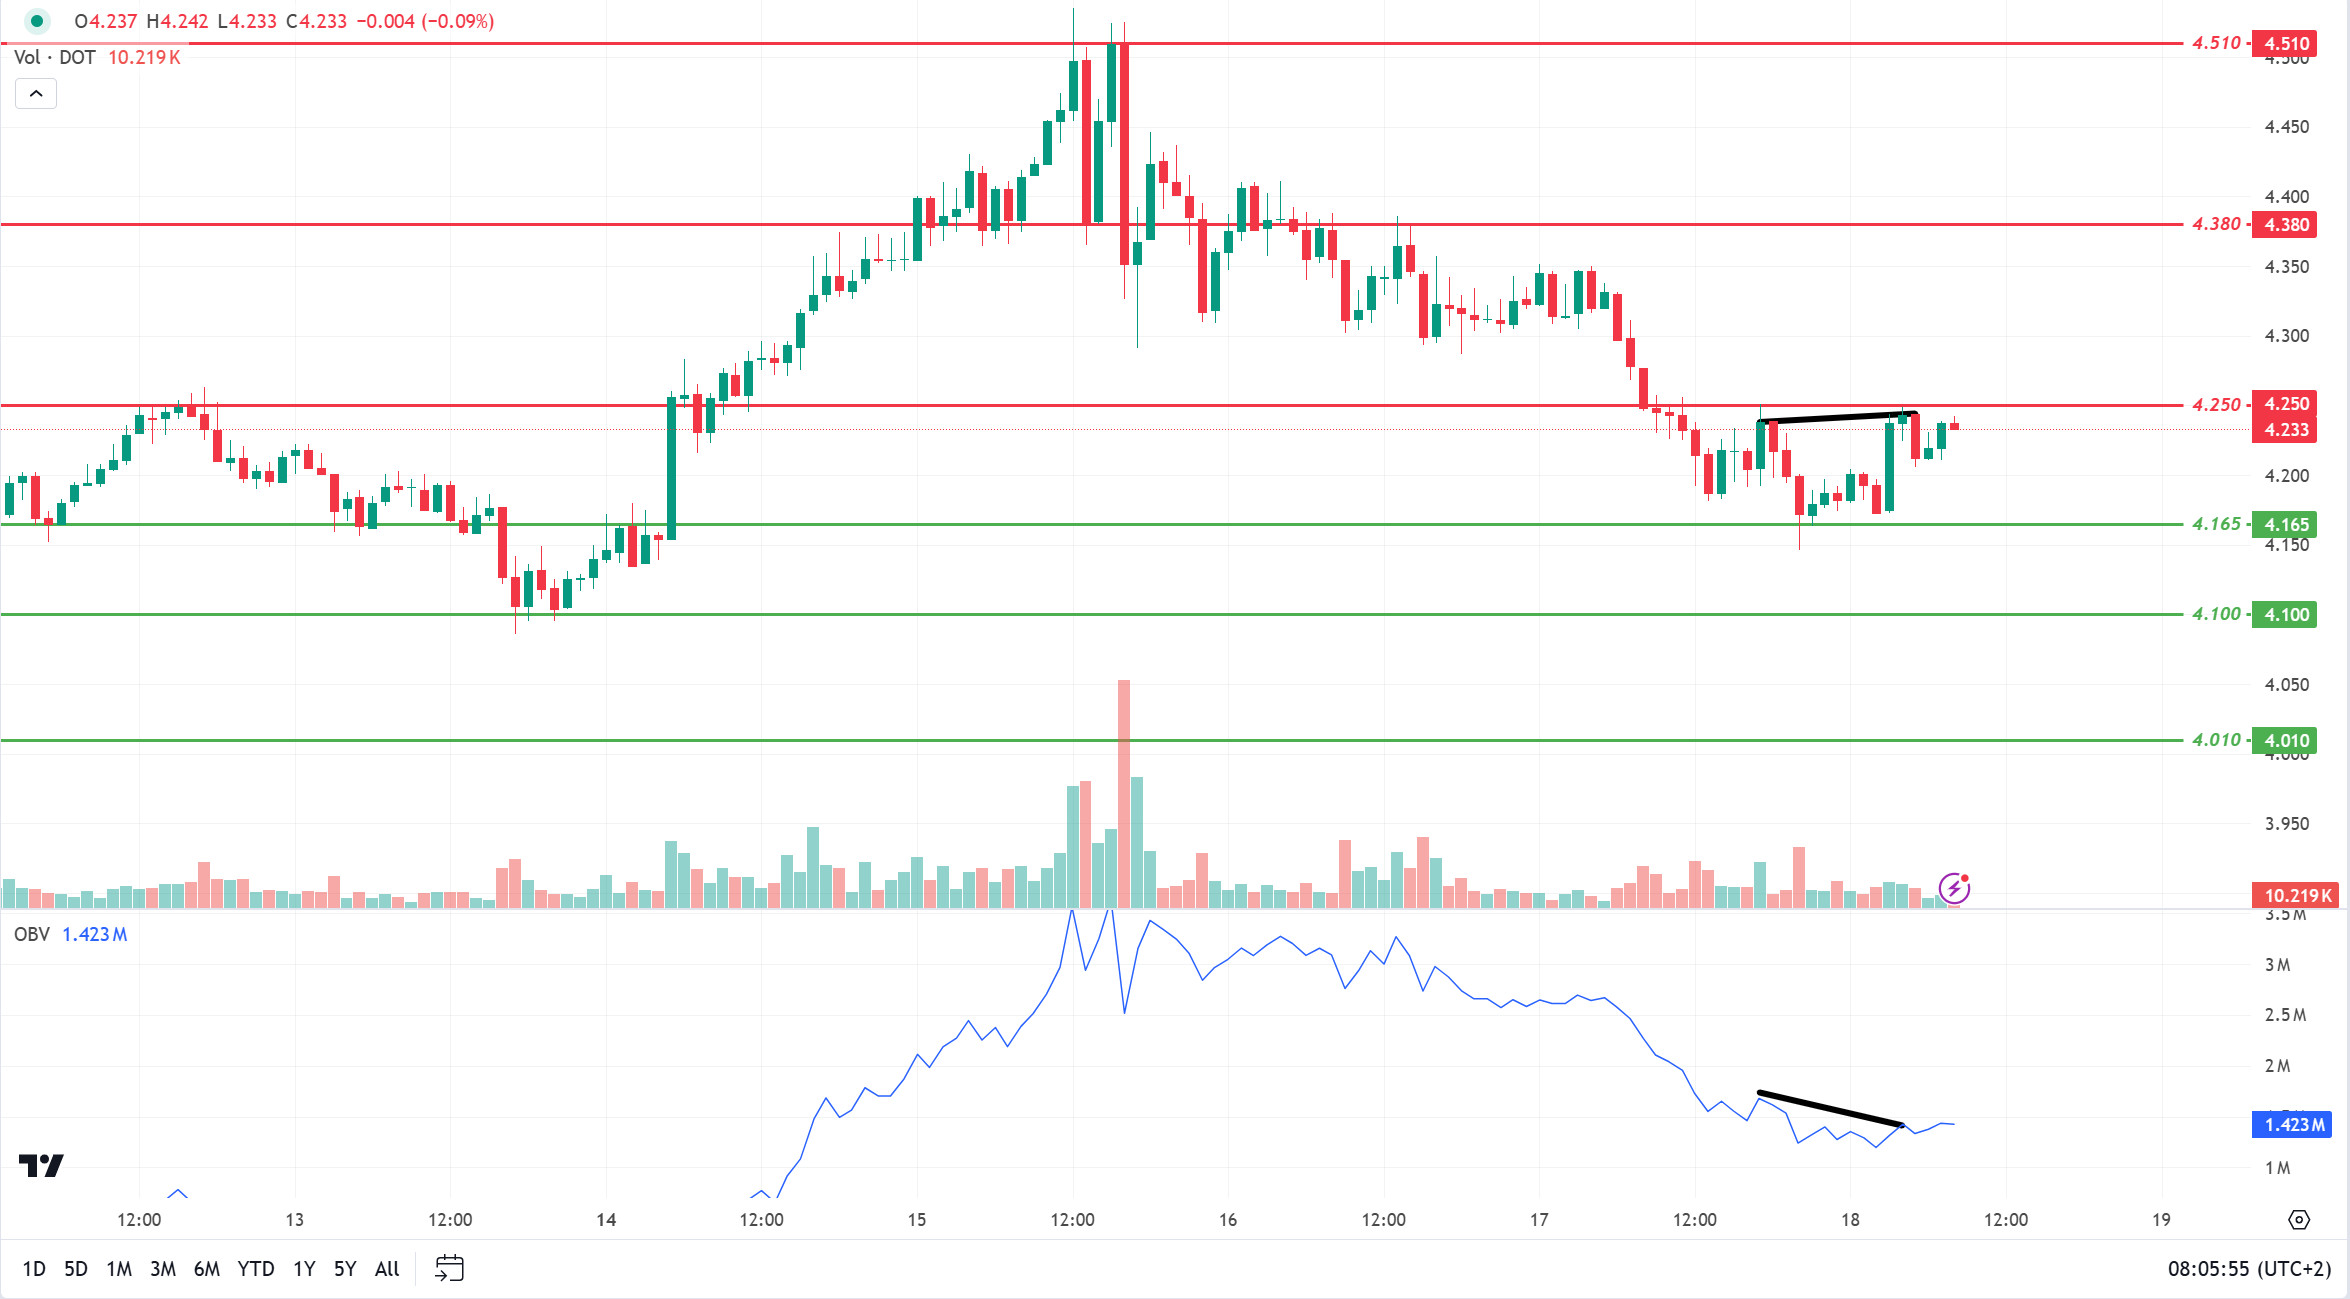
When we examine the Polkadot (DOT) chart, the price seems to have reacted from the 4.165 support level. DOT, which moved to 4.250 with the reaction from the 4.165 support level, continues to retreat after the negative divergence between On Balance Volume (OBV) and the price. According to this situation, if the price cannot break the 4.250 resistance level upwards, it may retreat towards 4.165 levels. On the other hand, if the price can maintain above the 4,250 level, we may see a rise towards the next resistance level of 4,380.
Supports 4.165 – 4.100 – 4.010
Resistances 4.250 – 4.380 – 4.510
SHIB/USDT
Lucie, Shiba Inu’s marketing lead, announced the imminent launch of the Shib Doggy DAO Foundation. This step aims to transition the Shib ecosystem to a more decentralized and autonomous structure. Furthermore, with the increase en SHIB’s burn rate, around 300 million coins have been burned, which continues to provide a positive long-term outlook por reducing the supply en the market.
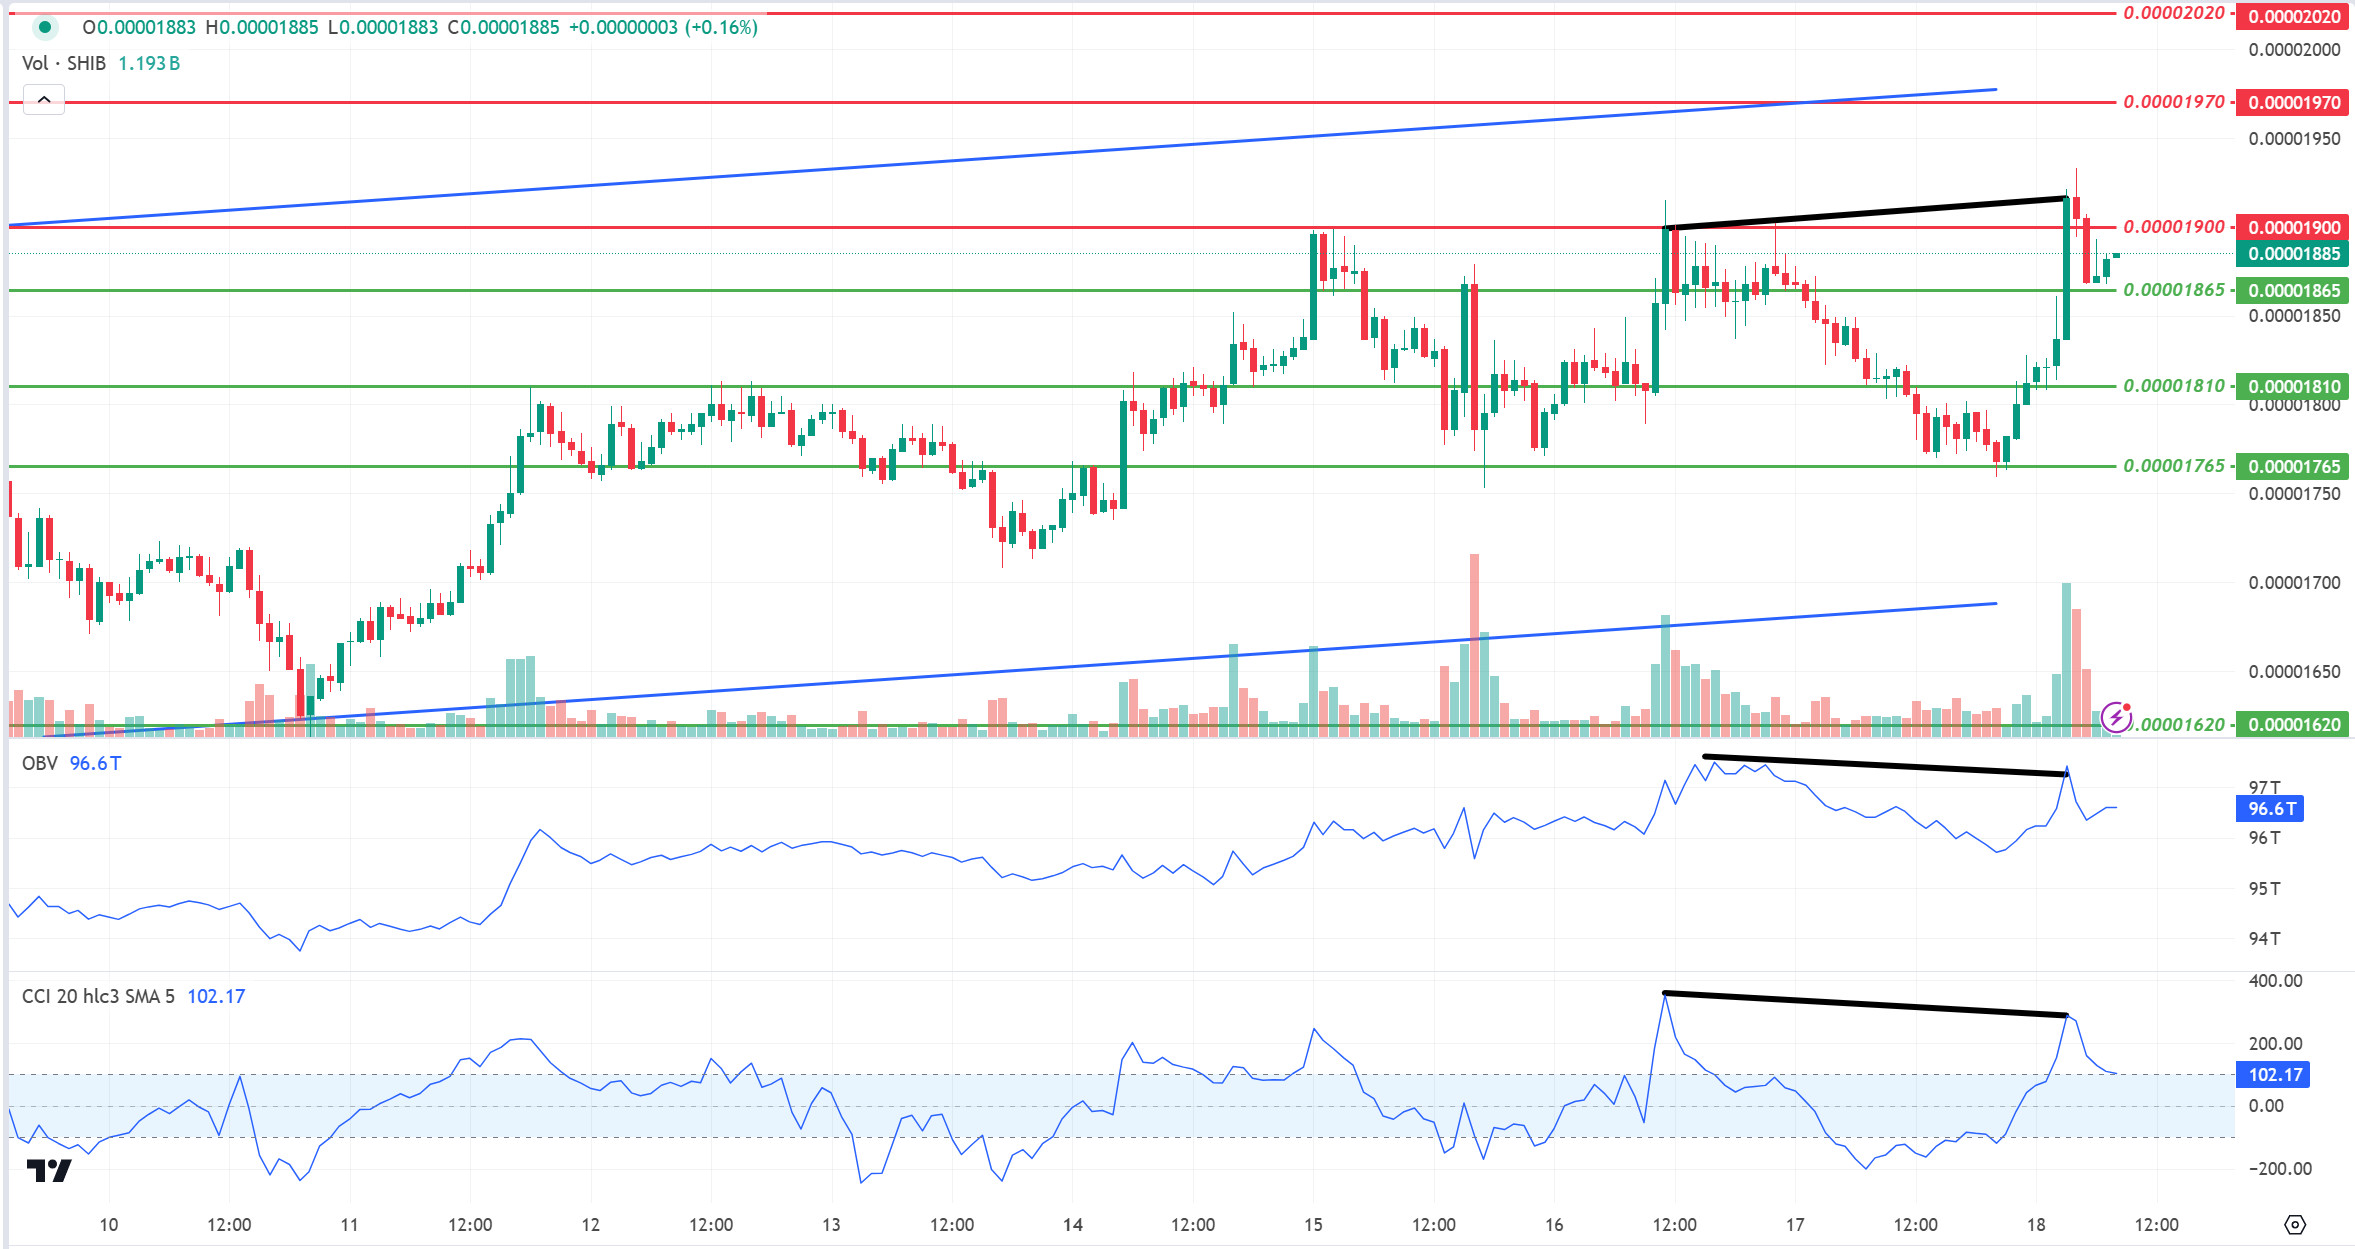
As we mentioned en our previous analysis, Shiba Inu (SHIB) reacted from the support level of 0.00001765 after the positive divergence between On Balance Volume (OBV) and the price. Reacting from 0.00001765, the price rose to the resistance level of 0.00001900. When we analyze the Commodity Channel Index (CCI) and OBV oscillators, we see a negative divergence between the price and the price. In this context, if the price cannot hold at the 0.00001865 level with the reaction it received from the 0.00001900 level, the next reaction level may be the 0.00001810 support level. On the other hand, if the price can maintain above the 0.00001865 level, it may want to break the selling pressure at the 0.00001900 resistance level.
Supports 0.00001810 – 0.00001865 – 0.00001765
Resistances 0.00001900 – 0.00001970 – 0.00002020
LEGAL NOTICE
The investment information, comments and recommendations contained herein do not constitute investment advice. Investment advisory services are provided individually por authorized institutions taking into account the risk and return preferences of individuals. The comments and recommendations contained herein are of a general nature. These recommendations may not be suitable for your financial situation and risk and return preferences. Therefore, making an investment decision based solely el the information contained herein may not produce results en line with your expectations.
