
MARKET SUMMARY
Latest Situation en Crypto Assets
Cryptocurrency Market Data
| Assets | Last Price | 24h Change | Dominance | Market Cap |
|---|---|---|---|---|
| BTC | $61,533.00 | -3.63% | 56.23% | $1.21 T |
| ETH | $2,475.00 | -6.30% | 13.76% | $297.30 B |
| SOL | $146.86 | -5.71% | 3.18% | $68.64 B |
| XRP | $0.5978 | -3.76% | 1.57% | $33.81 B |
| DOGE | $0.1076 | -8.89% | 0.73% | $15.72 B |
| TRX | $0.1544 | -1.39% | 0.62% | $13.37 B |
| CARDANO | $0.3569 | -6.66% | 0.58% | $12.48 B |
| AVAX | $26.18 | -8.05% | 0.49% | $10.63 B |
| SHIB | $0.00001673 | -9.21% | 0.46% | $9.86 B |
| LINK | $11.19 | -7.98% | 0.33% | $7.01 B |
| DOT | $4.20 | -7.33% | 0.29% | $6.30 B |
*Prepared el 10.2.2024 at 06:00 (UTC)
WHAT’S LEFT BEHIND
War Developments Hit Bitcoin and Altcoins!
Iran’s massive missile attack el Israel has led to sudden declines en traditional financial markets as well as en the cryptocurrency sector, causing crypto assets to lose significant amounts of value. The leading cryptocurrency Bitcoin (BTC) fell 4% to $60,000 yesterday evening. The leading altcoin Ethereum (ETH), el the other hand, lost 6% of its value to $2,400.
XRP ETF Application Alleged
On September 30, it filed a regulatory filing en Delaware, starting the process of launching its XRP ETF. This strategic move was registered with the Delaware Division of Business and caused a stir en the crypto community, especially among those expecting an XRP ETF en the US market.
Some Tokens to Unlock October 2024
October 4 – $27.92M $IMX (~$48M)
October 10 – $23.44M $CHEEL (~$305M)
October 12 – $11.31M $APT (~$90M)
October 14 – $12.56M $AXS (~$66M)
October 16 – $93.65M $ARB (~$59M)
October 31 – $24.16M $OP (~$45M)
October 31 – $175.75M $TIA (~$1B)
HIGHLIGHTS OF THE DAY
Important Economic Calendar Data
| Time | Country | Noticias | Expectation | Previous |
|---|---|---|---|---|
| 12:15 | US | ADP Nonfarm Employment Change (Sep) | 124K | 99K |
| 13:00 | US | FOMC Member Hammack Speaks | ||
| 14:05 | US | FOMC Member Musalem Speaks | ||
| 15:00 | US | FOMC Member Bowman Speaks | ||
| 16:15 | US | FOMC Member Barkin Speaks |
INFORMATION
*The calendar is based el UTC (Coordinated Universal Time) time zone. The economic calendar content el the relevant page is obtained from reliable news and data providers. The news en the economic calendar content, the date and time of the announcement of the news, possible changes en the previous, expectations and announced figures are made por the data provider institutions. Darkex cannot be held responsible for possible changes that may arise from similar situations.
MARKET COMPASS
While global markets were focused el macro data and central banks, yesterday, rising tensions en the Middle East re-emerged as a determining factor el prices. As Iran’s missile attack increased risk aversion, we saw the inevitable impact el asset prices.
Although en our analysis yesterday, we said that there was no basis for limiting the retreat en digital assets that started el Monday, and we expressed the view that the decline would continue, this was unexpected with the rise of geopolitical risks. While the US stock markets closed el the negative side yesterday, sales are generally effective en Asian indices this morning. The fact that Europe is likely to start the new day with a slight loss can be considered as a sign that war concerns may ease somewhat. However, new developments el the issue should remain under close scrutiny.
Historically, October has been a positive period for digital assets, but the last quarter of the year did not start well this time. Again, we saw that the declines could be limited to some extent. Today, we will continue to monitor the news flow from the Middle East and possible statements por major countries el the issue. Macroeconomic data flow also continues. We will see the ADP private sector non-farm payrolls change today ahead of the critical US data to be released el Friday.
According to the CME FedWatch Tool, market participants now see a higher probability of a 25 basis point rate cut por the US Federal Reserve (FED) el November 7th than 50 basis points. We have recently seen that global investors react to macro indicators por commenting el economic health. In this parallel, it is necessary to consider the possibility that an ADP data above expectations will have a positive reflection el the digital assets front and a data that will be below expectations will have a negative reflection.
TECHNICAL ANALYSIS
BTC/USDT
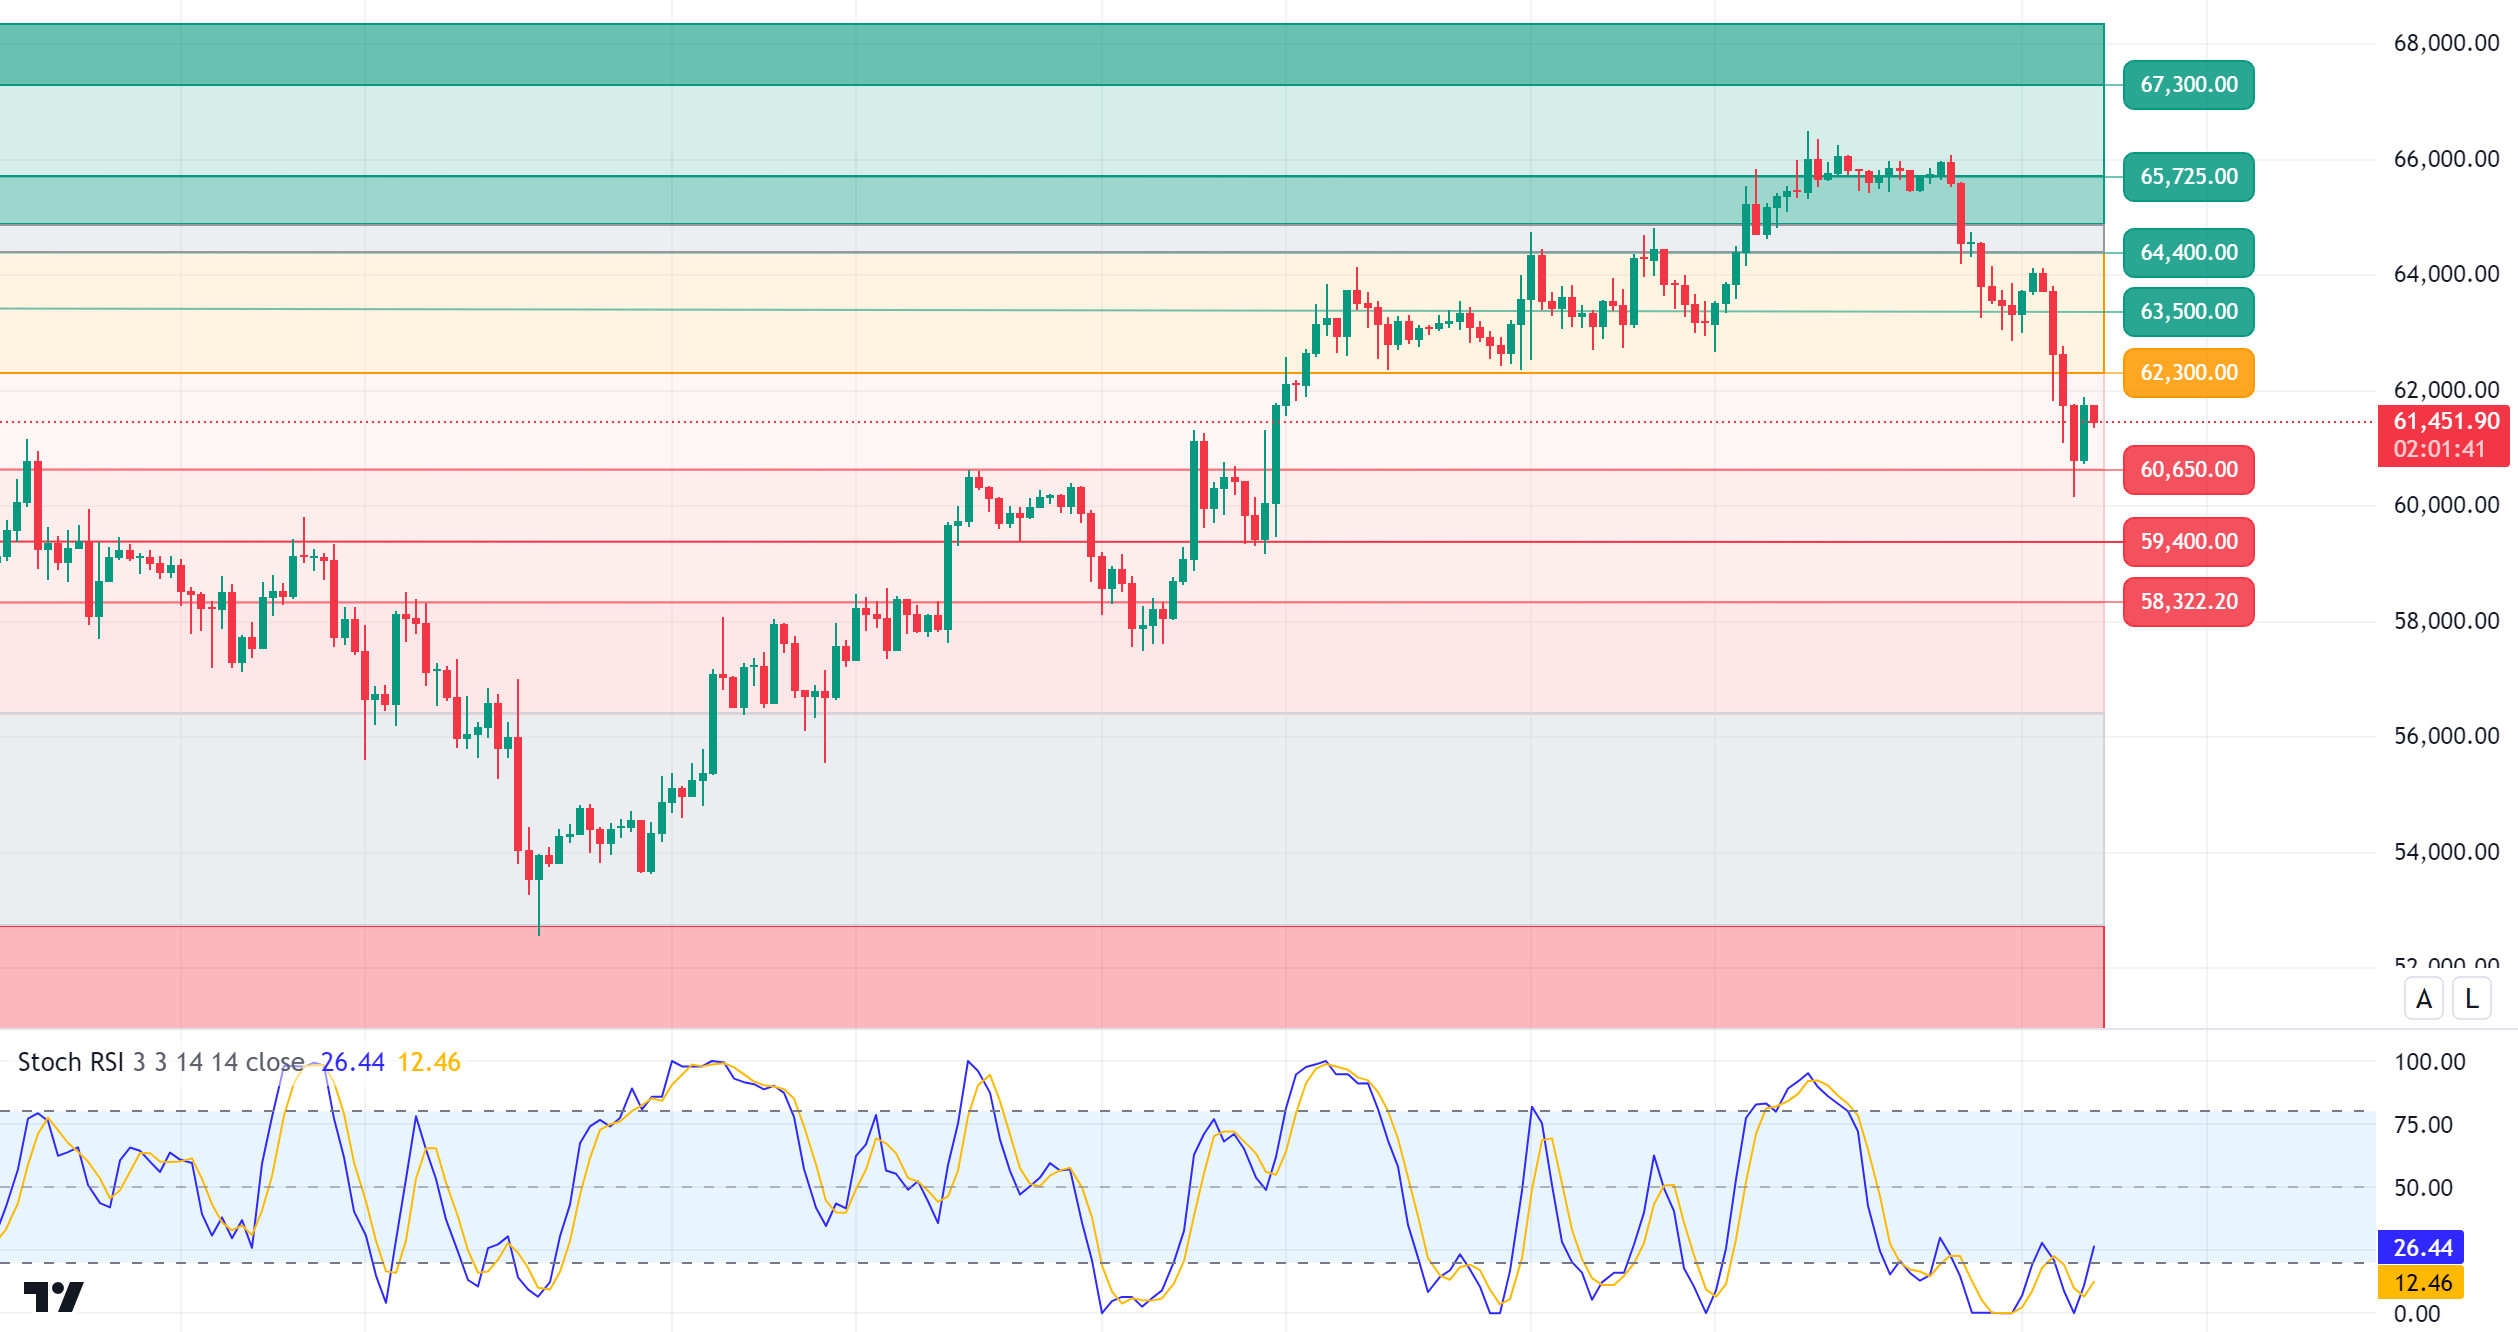
Middle East Tensions Affect Bitcoin! The hot conflict en the Middle East affected global financial markets. Iran’s launch of nearly 200 ballistic missiles at Israel has once again put the Middle East el the world agenda and caused major fluctuations en global financial markets. Investors fled to safe havens such as gold and crude oil, while Bitcoin, which was thought to have increased its reliability recently, experienced a sharp retreat. In April, a similar event was experienced por Iran, with an 8% retracement en Bitcoin at a time of rising prices. Again, a similar event en October, which is called “Uptober”, where rises are expected el behalf of the market, started to make investors think. In the BTC 4-hora technical analysis, the price, which retreated from 64,000 to 60,000 with this tension, is currently priced at 61,500 with the reaction from this region. The 60,650 level, which works as psychological support or resistance, which has appeared many times before, has reappeared. The price managed to return above this level again por throwing a needle below the 60,650 level. In a period when the agenda for the market is intense and conflicts are increasing, it is useful to pay attention to technical levels and wait for breaks en order to trade. The developments en the news flow during the day can be closely monitored and the trading strategy can be created en this direction. Crossing the resistance level of 62,300 may reassure the market, otherwise, increased selling pressure due to the impact of conflicts may allow us to retest the 60,650 major support level.
Supports 60,650 -59,400 – 58,300
Resistances 62,300 – 64,400 – 65,725
ETH/USDT
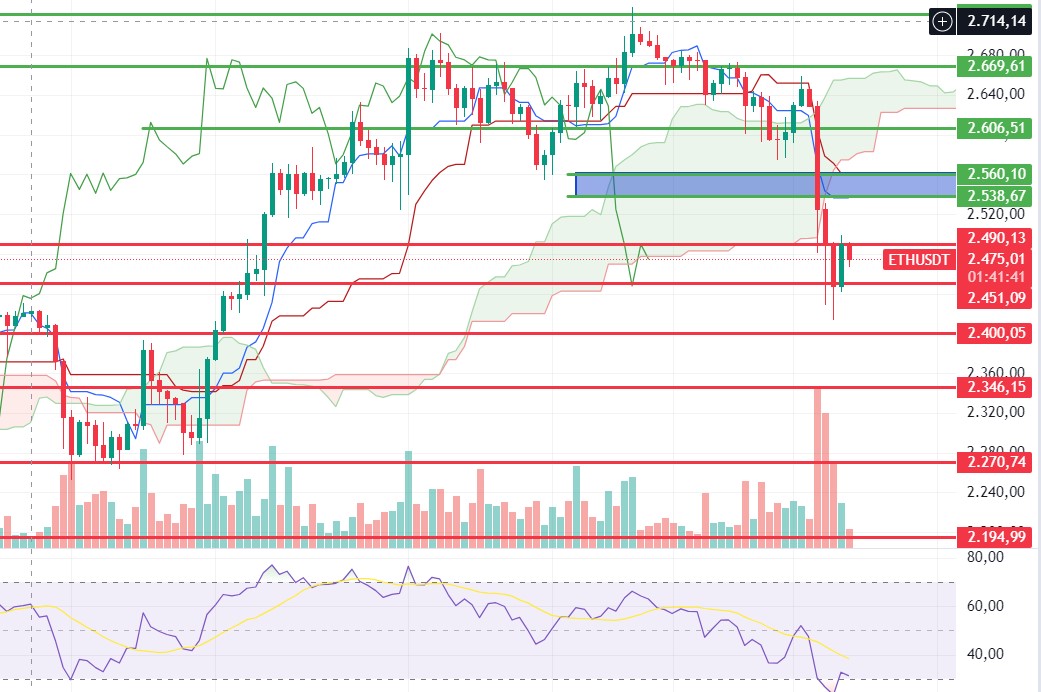
Ethereum, which fell sharply with Iran’s missile attacks el Israel, managed to stay above the 2,450 level. RSI’s retest to the 30 level, leaving the oversold zone, looks positive. We also see that the reaction rise en CVDs comes from spot purchases. In this case, we can say that the breakout of the 2,490 level may bring a rise up to the tenkan level of 2,538. CMF, OBV and MACD still show that the selling pressure continues. With the strengthening of war-related rhetoric or Israeli retaliations, there may be a retreat to 2.451. The break of this level may cause deeper declines.
Supports 2,451 – 2,400 – 2,346
Resistances 2,538 – 2,560 – 2,606
LINK/USDT
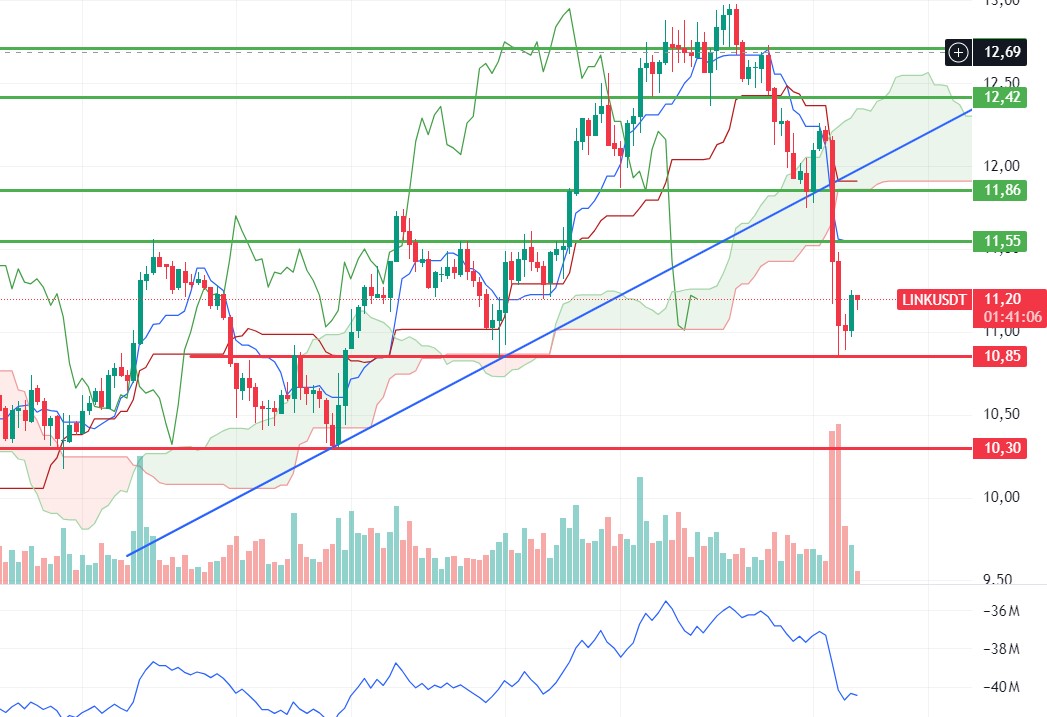
In LINK, it fell very sharply with the events of yesterday and received a reaction from the main support point 10.85. The most important signal that catches the eye is the positive mismatch el OBV. Apart from this, a slightly positive outlook has been re-established en all other indicators. In this context, we may see an increase to 11.55 levels during the day. In war-related developments, the 10.85 level may work strongly again. The break of the level may deepen the decline.
Supports 10.85 – 10.30 – 9.29
Resistances 11.55 – 11.86 – 12.42
SOL/USDT
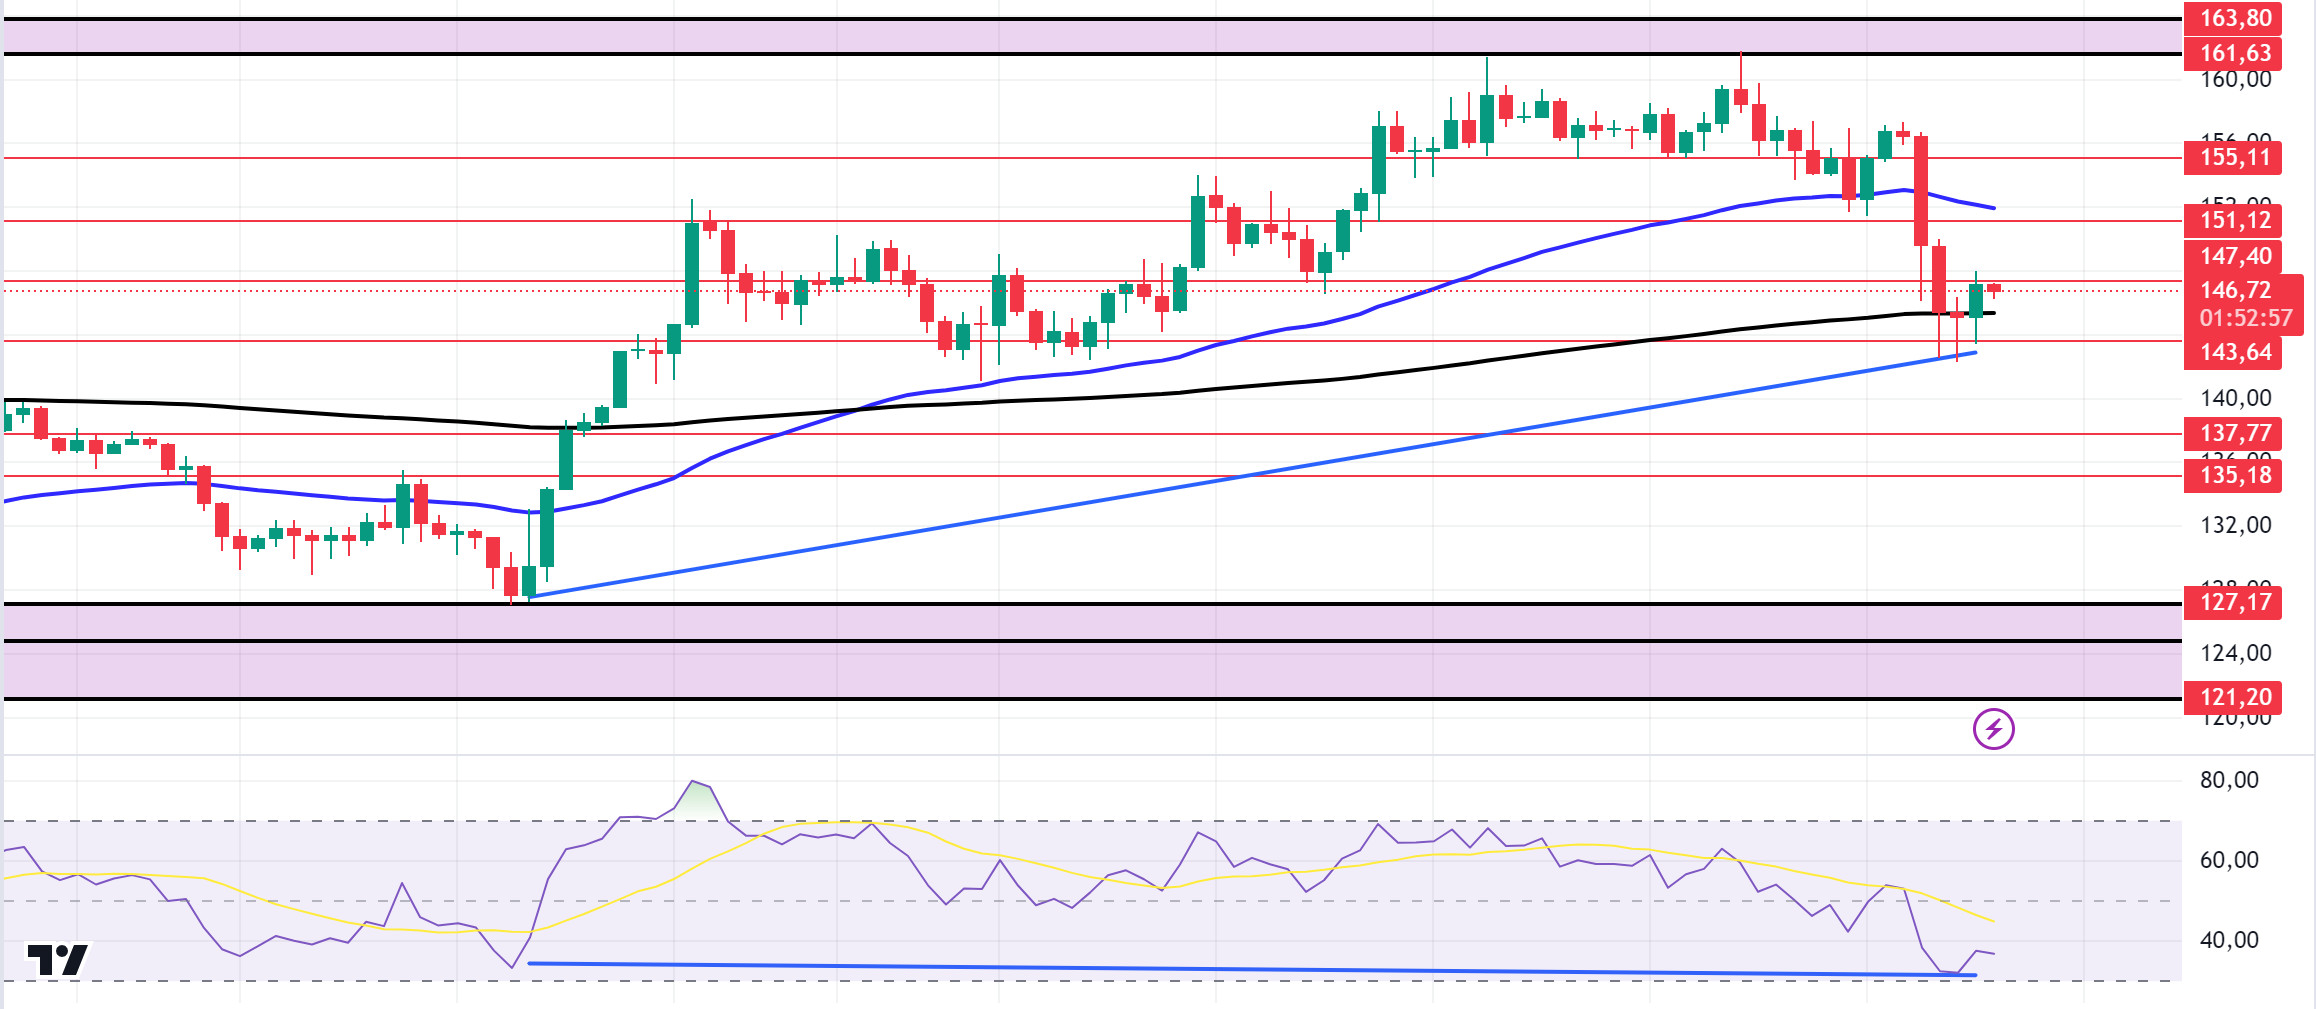
The Iranian missile launch into Israel yesterday evening is about to escalate the already tense situation en the Middle East into a war. This caused the total volume of cryptocurrencies to fall por about 7.71% to $2.11 trillion. Cryptocurrencies are completely en the red. SOL reacted to this decline por falling 7.8%. Today, the ADP non-farm employment change from the US should be followed. Technically, the price has found support from the 200 EMA el the 4-hora chart. There is a mismatch en the RSI (14). This mismatch en both the fixed average support and the RSI makes the 143.64 level a very strong support. The levels of 151.12 – 155.11 appear as the first resistance levels en the rises caused por both macroeconomic conditions and innovations en the Solana ecosystem. If it rises above these levels, the rise may continue. In the sales that investors will make due to political and macroeconomic conditions, the support levels of 143.64 – 137.77 should be followed. If the price comes to these support levels, a potential bullish opportunity may arise.
Supports 143.64 – 137.77 – 135.18
Resistances 147.40 – 151.12 – 155.11
ADA/USDT
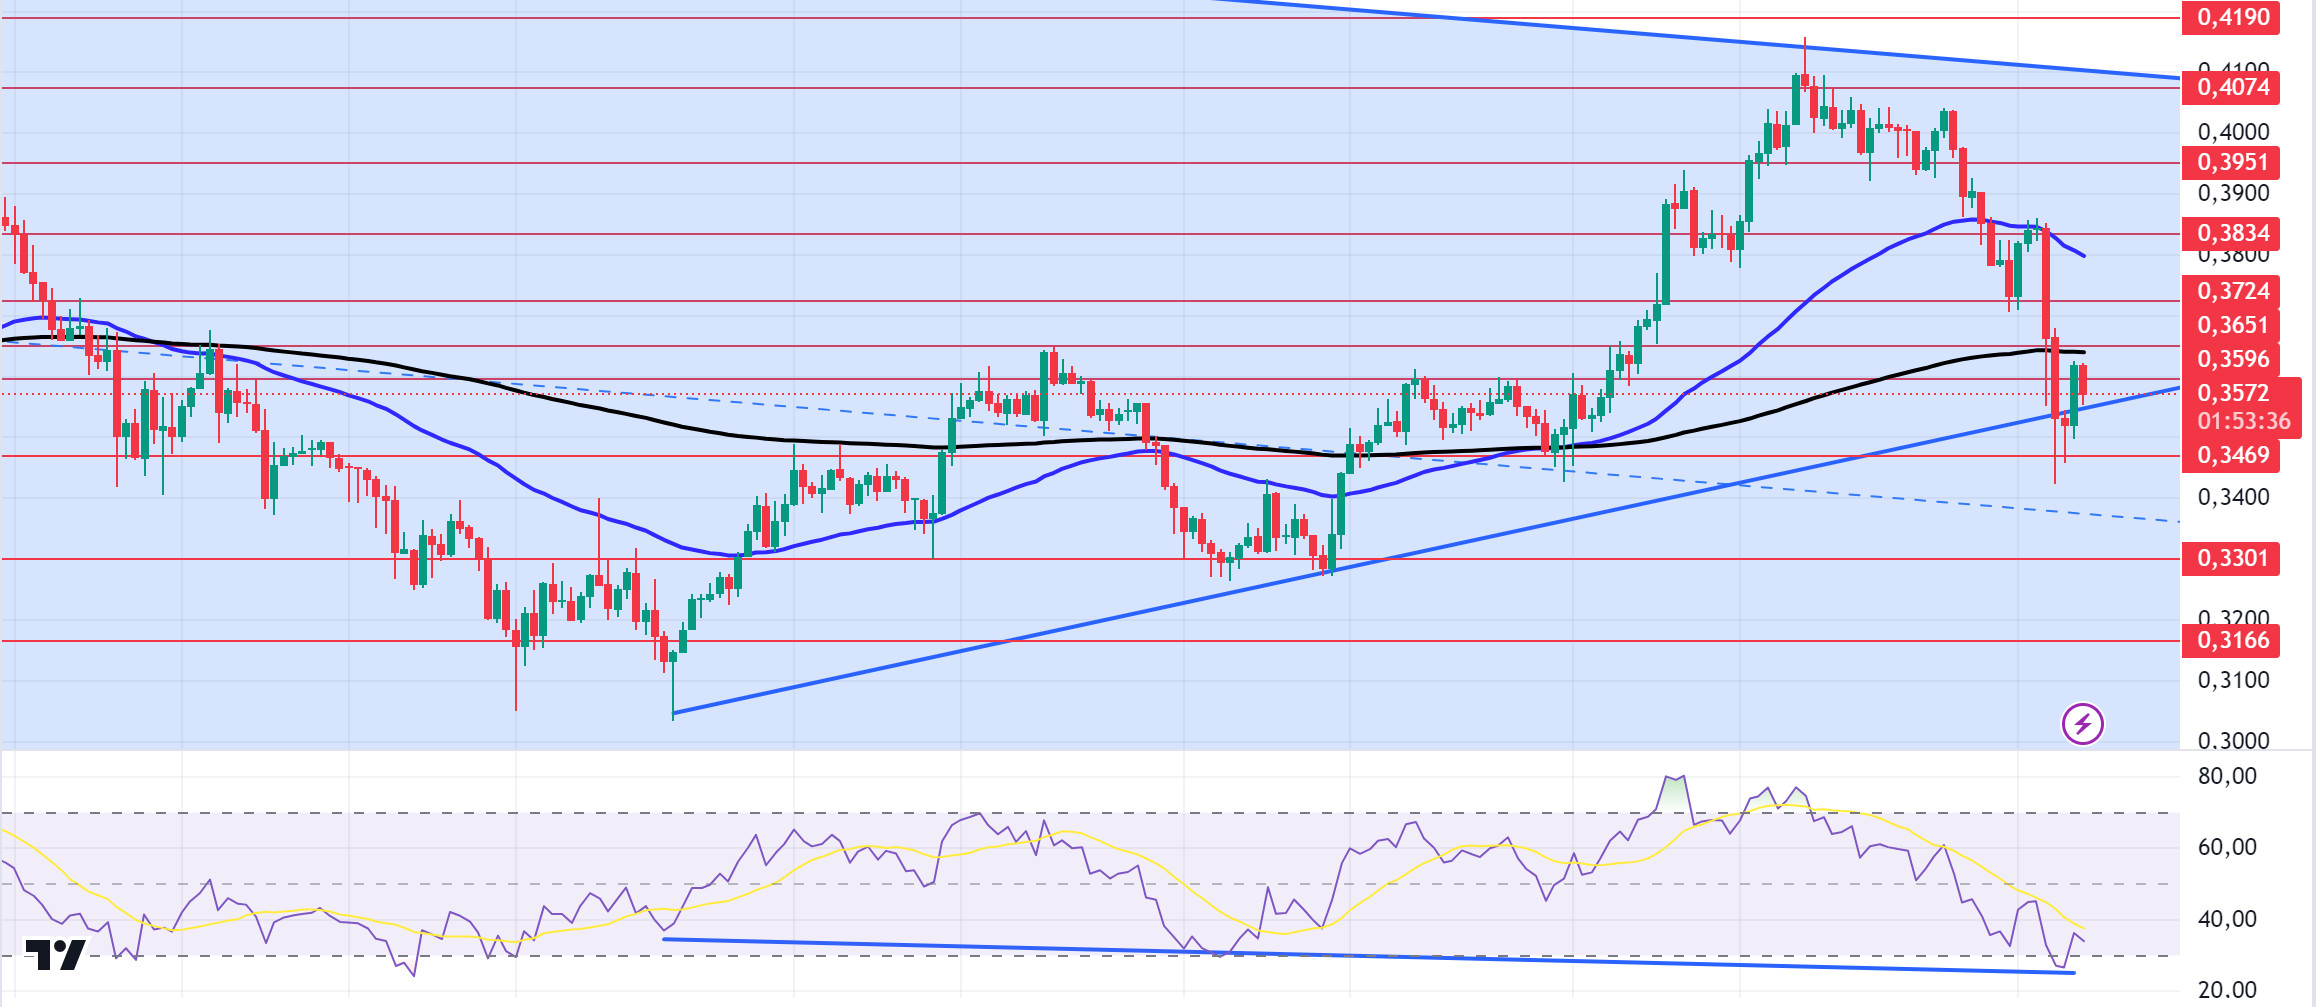
The Iranian missile launch into Israel yesterday evening is about to escalate the already tense situation en the Middle East into a war. This caused the total volume of cryptocurrencies to fall por about 7.71% to $2.11 trillion. ADA reacted to this drop por falling 7.38%. Today, the ADP non-farm employment change from the US should be followed. In the Cardano ecosystem, according to token unlocks, 18.53 million ADA tokens representing 0.5% of the total ADA supply will be unlocked today. The value of this unlock is worth about $7.37 million. When we look technically, ADA, which is affected por the decline of BTC, has broken the 200 EMA when we examine it el the 4-hora chart. This could deepen the decline. It has also been testing the support line since September 6 at the time of writing. When we examine the Rsi (14) indicator, there is a mismatch. This could be a potential bullish harbinger. The 0.3469 level stands out as a strong support en the retracements to be experienced with possible political and macroeconomic news. If the positive atmosphere en the ecosystem continues and the data en the macroeconomy are positive, the 0.3724 level can be followed as resistance.
Supports 0.3469 – 0.3301 – 0.3166
Resistances 0.3651 – 0.3724 – 0.3834
AVAX/USDT
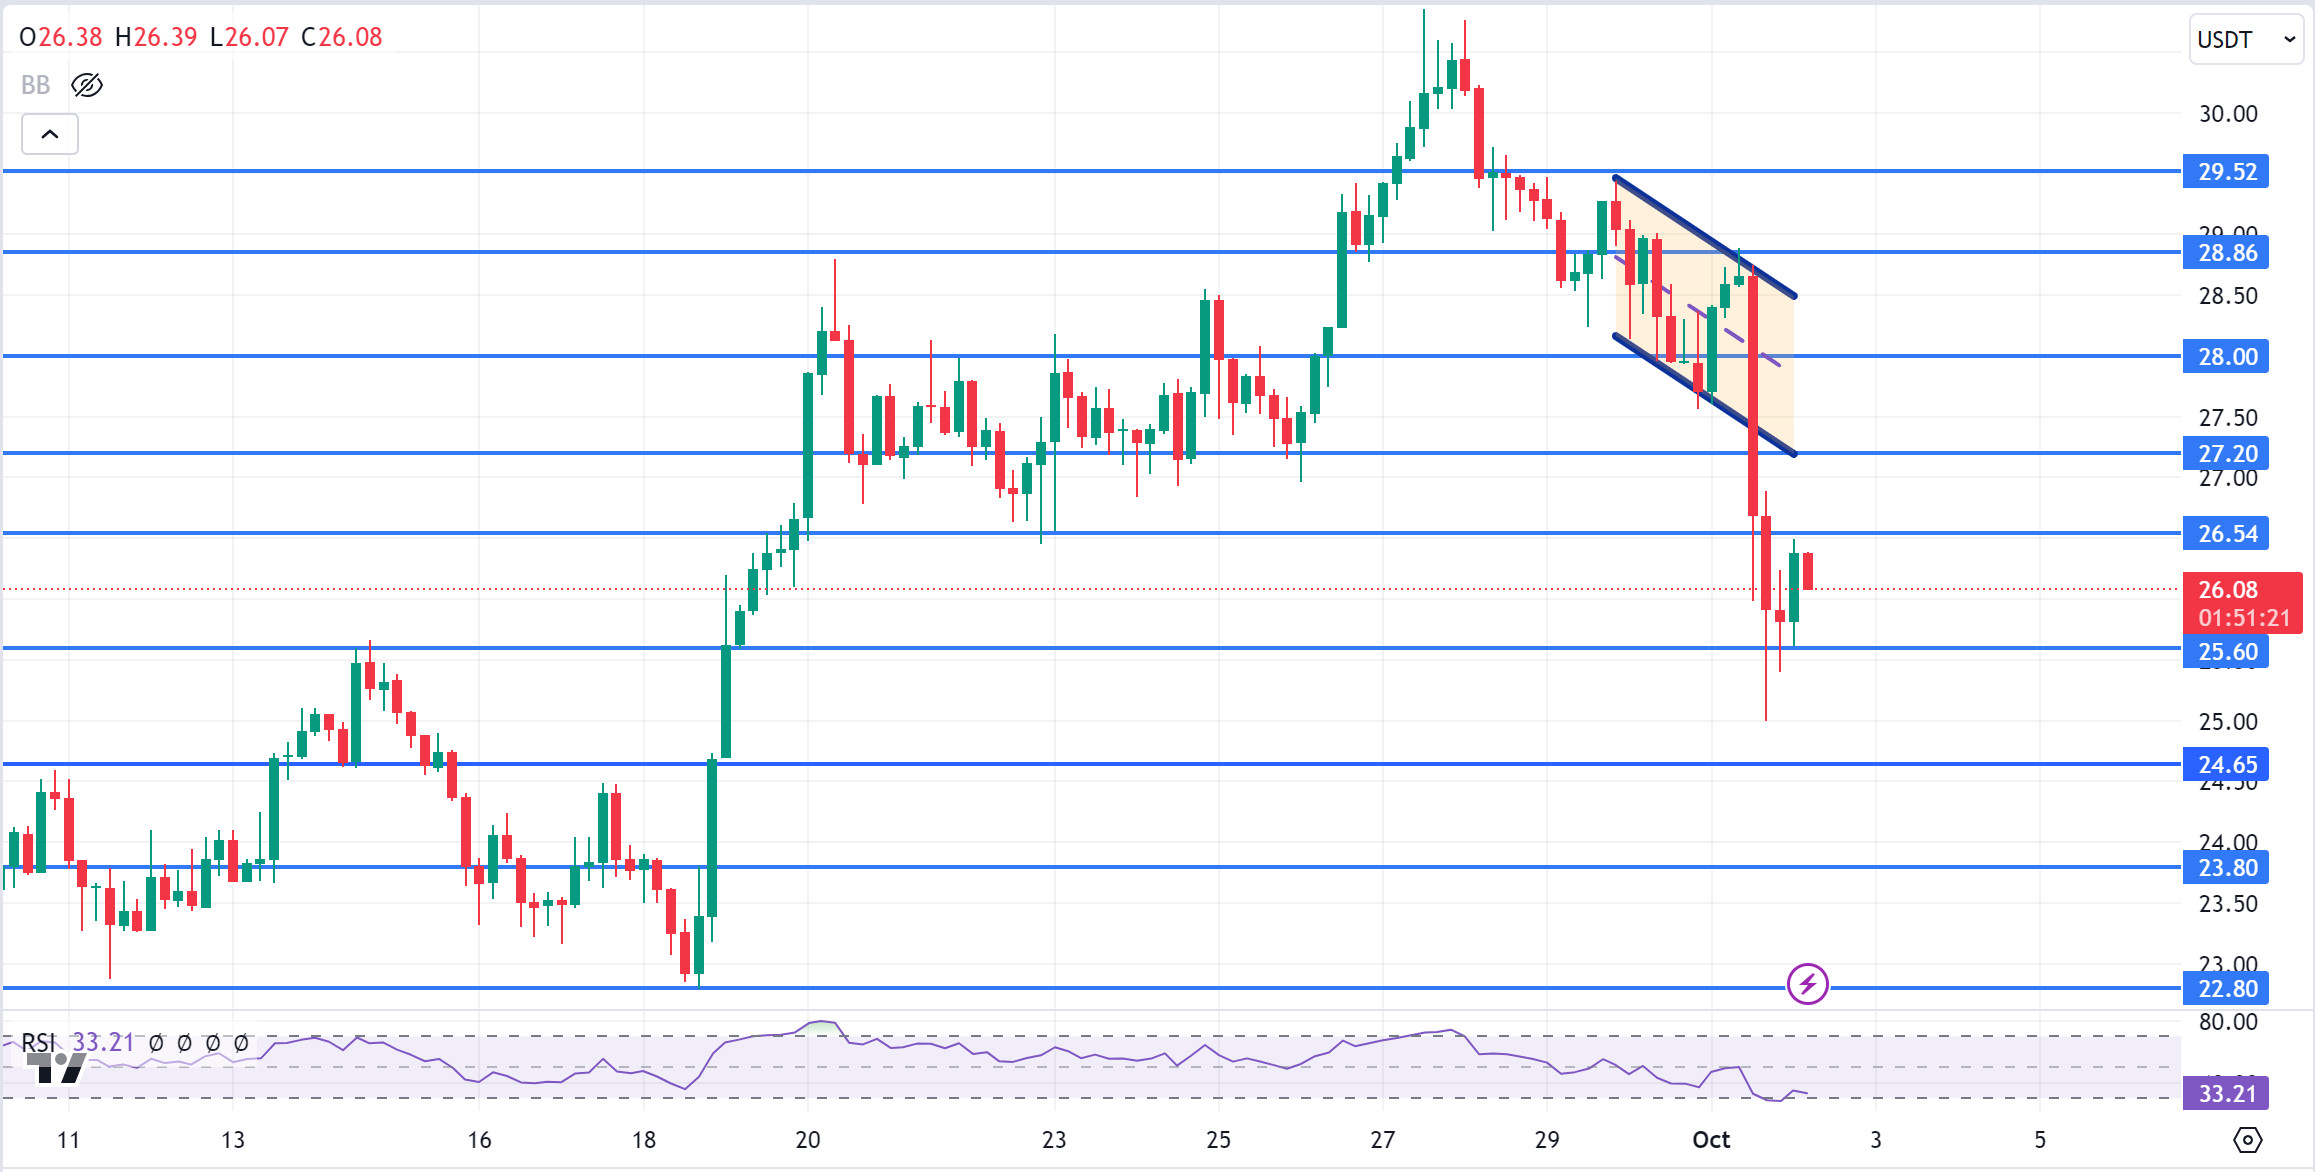
AVAX, which opened yesterday at 27.71, fell por about 7% due to the tension en the Middle East during the day and closed the day at 25.82. Today, ADP non-farm payrolls data will be released por the US. However, the market is currently following the tension en the Middle East rather than the upcoming data and will determine the direction with the news from the region.
AVAX, currently trading at 26.08, has broken the falling channel downwards el the 4-hora chart. The RSI is en the oversold zone with a value of 33 and some upside can be expected from these levels. In such a case, it can be expected to test the 26.54 resistance. If it cannot close above 26.54 resistance and news of escalating tension from the Middle East comes, it may test 25.60 support. As long as it stays above 24.65 support during the day, the desire to rise may continue. With the break of 24.65 support, sales may increase.
Supports 25.60 – 24.65 – 23.80
Resistances 26.54 – 27.20 – 28.00
TRX/USDT
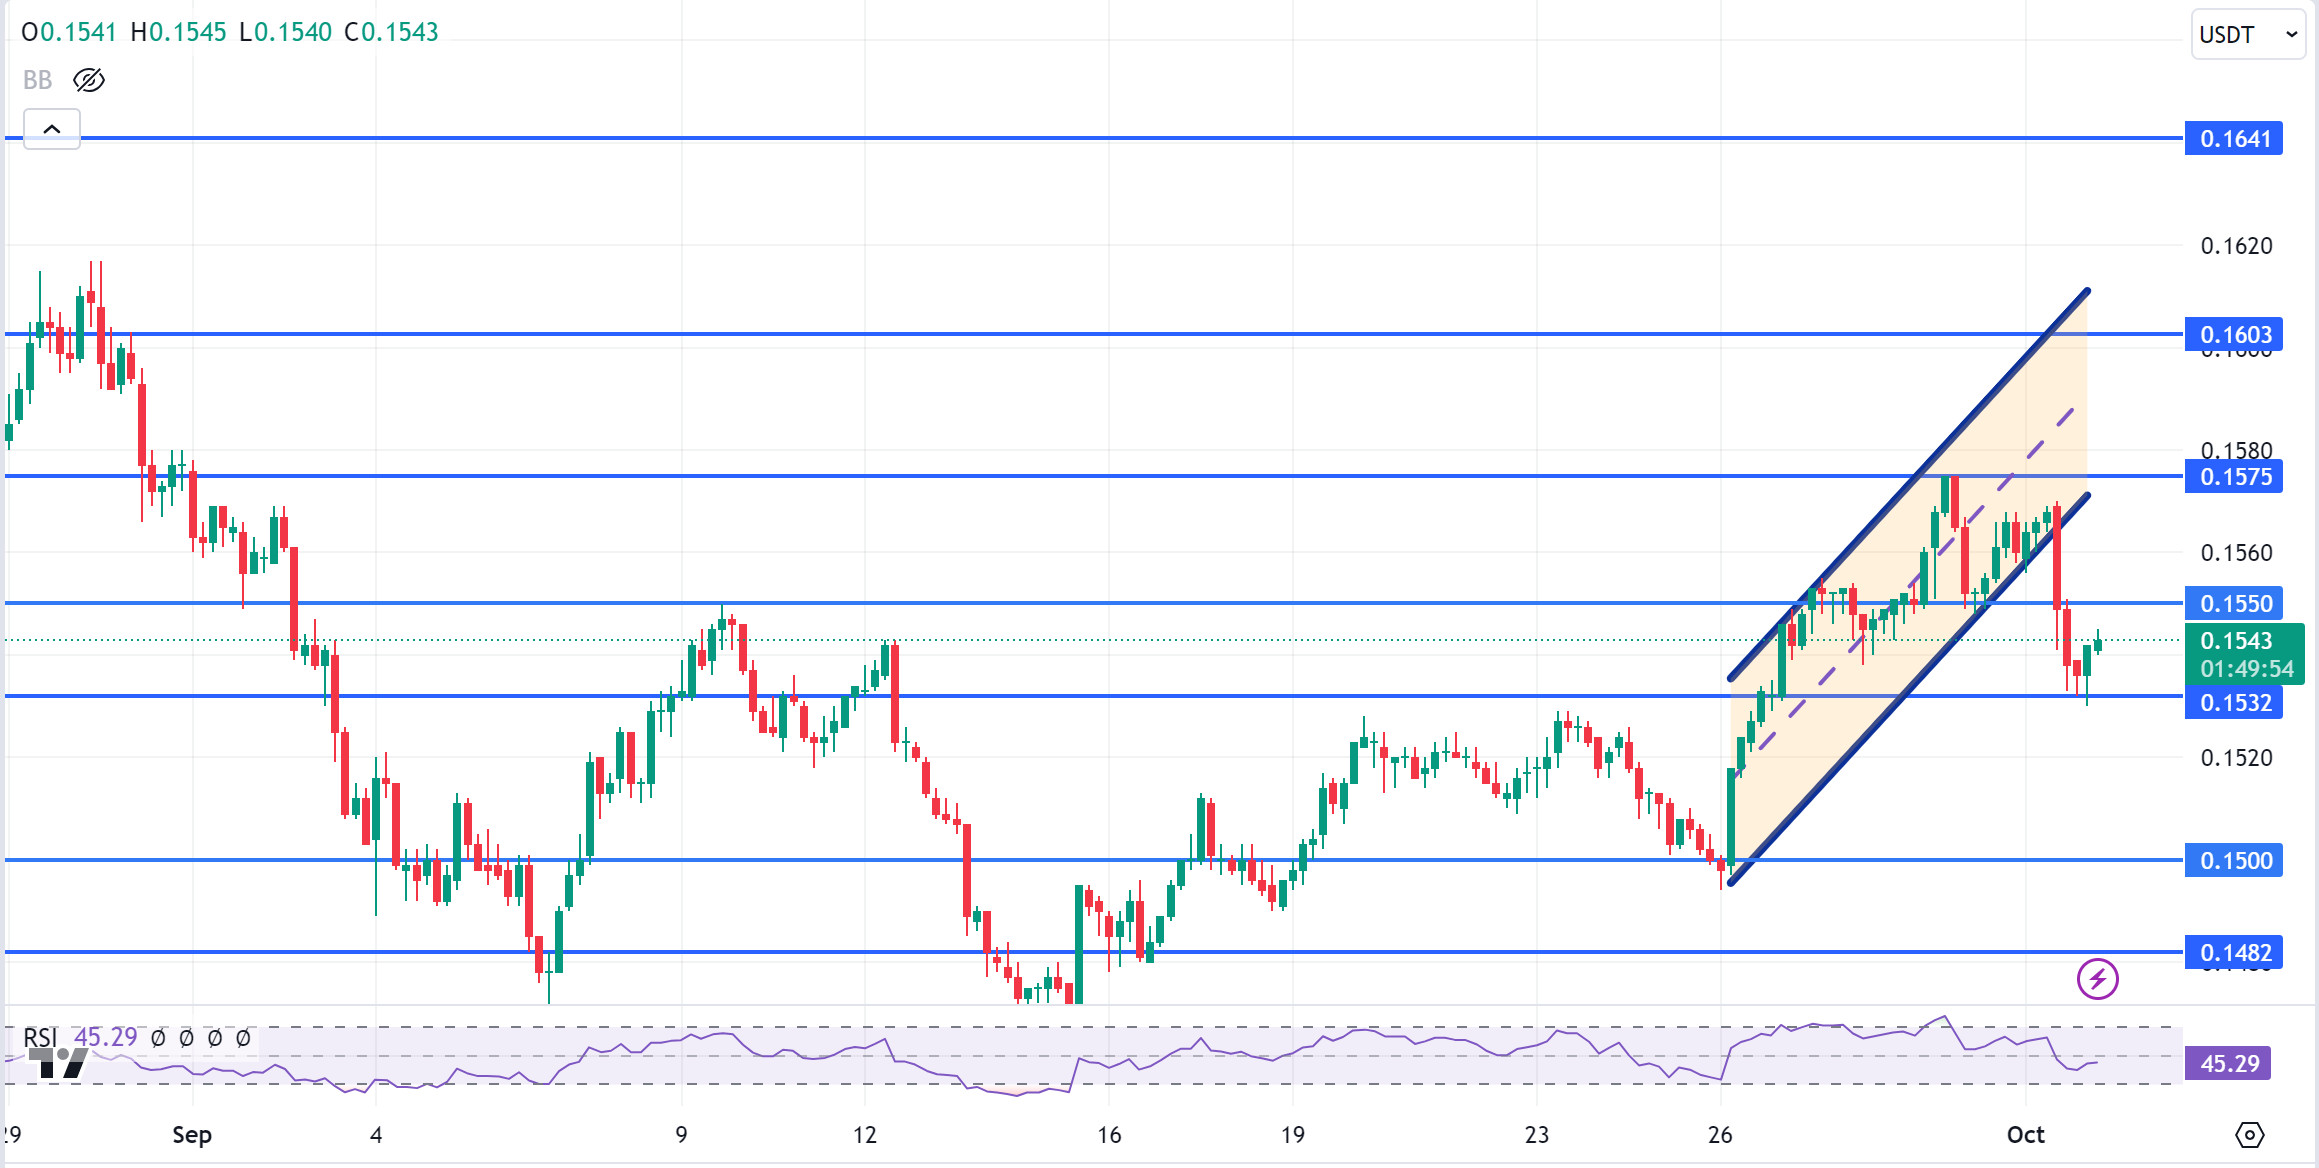
TRX, which started yesterday at 0.1559, fell 1.5% during the day and closed the day at 0.1536. Today, there is ADP non-farm payrolls data to be released por the US, but the market is currently focused el news from the Middle East. The escalation of tension may be an important reason for increased sales. TRX, currently trading at 0.1543, has broken the rising channel downwards el the 4-hora chart. With the RSI value of 45, it can be expected to move slightly up from its current level. In such a case, it may test the 0.1550 resistance. If selling pressure increases with negative news flows from the Middle East, it may test 0.1532 support. As long as TRX stays above 0.1482 support, the desire to rise may continue. If this support is broken downwards, sales can be expected to increase.
Supports 0.1532 – 0.1500 – 0.1482
Resistances 0.1550 – 0.1575 – 0.1603
DOT/USDT
Energy Web has launched the beta version of AutoGreenCharge, a mobile app that enables electric vehicle owners to charge their vehicles with renewable energy. Secured por the Polkadot blockchain, the app allows users to reduce their environmental impact por pairing each charging session with clean energy. The app integrates with popular vehicles such as Tesla, BMW and Mercedes to track energy consumption and environmental impact en real time.
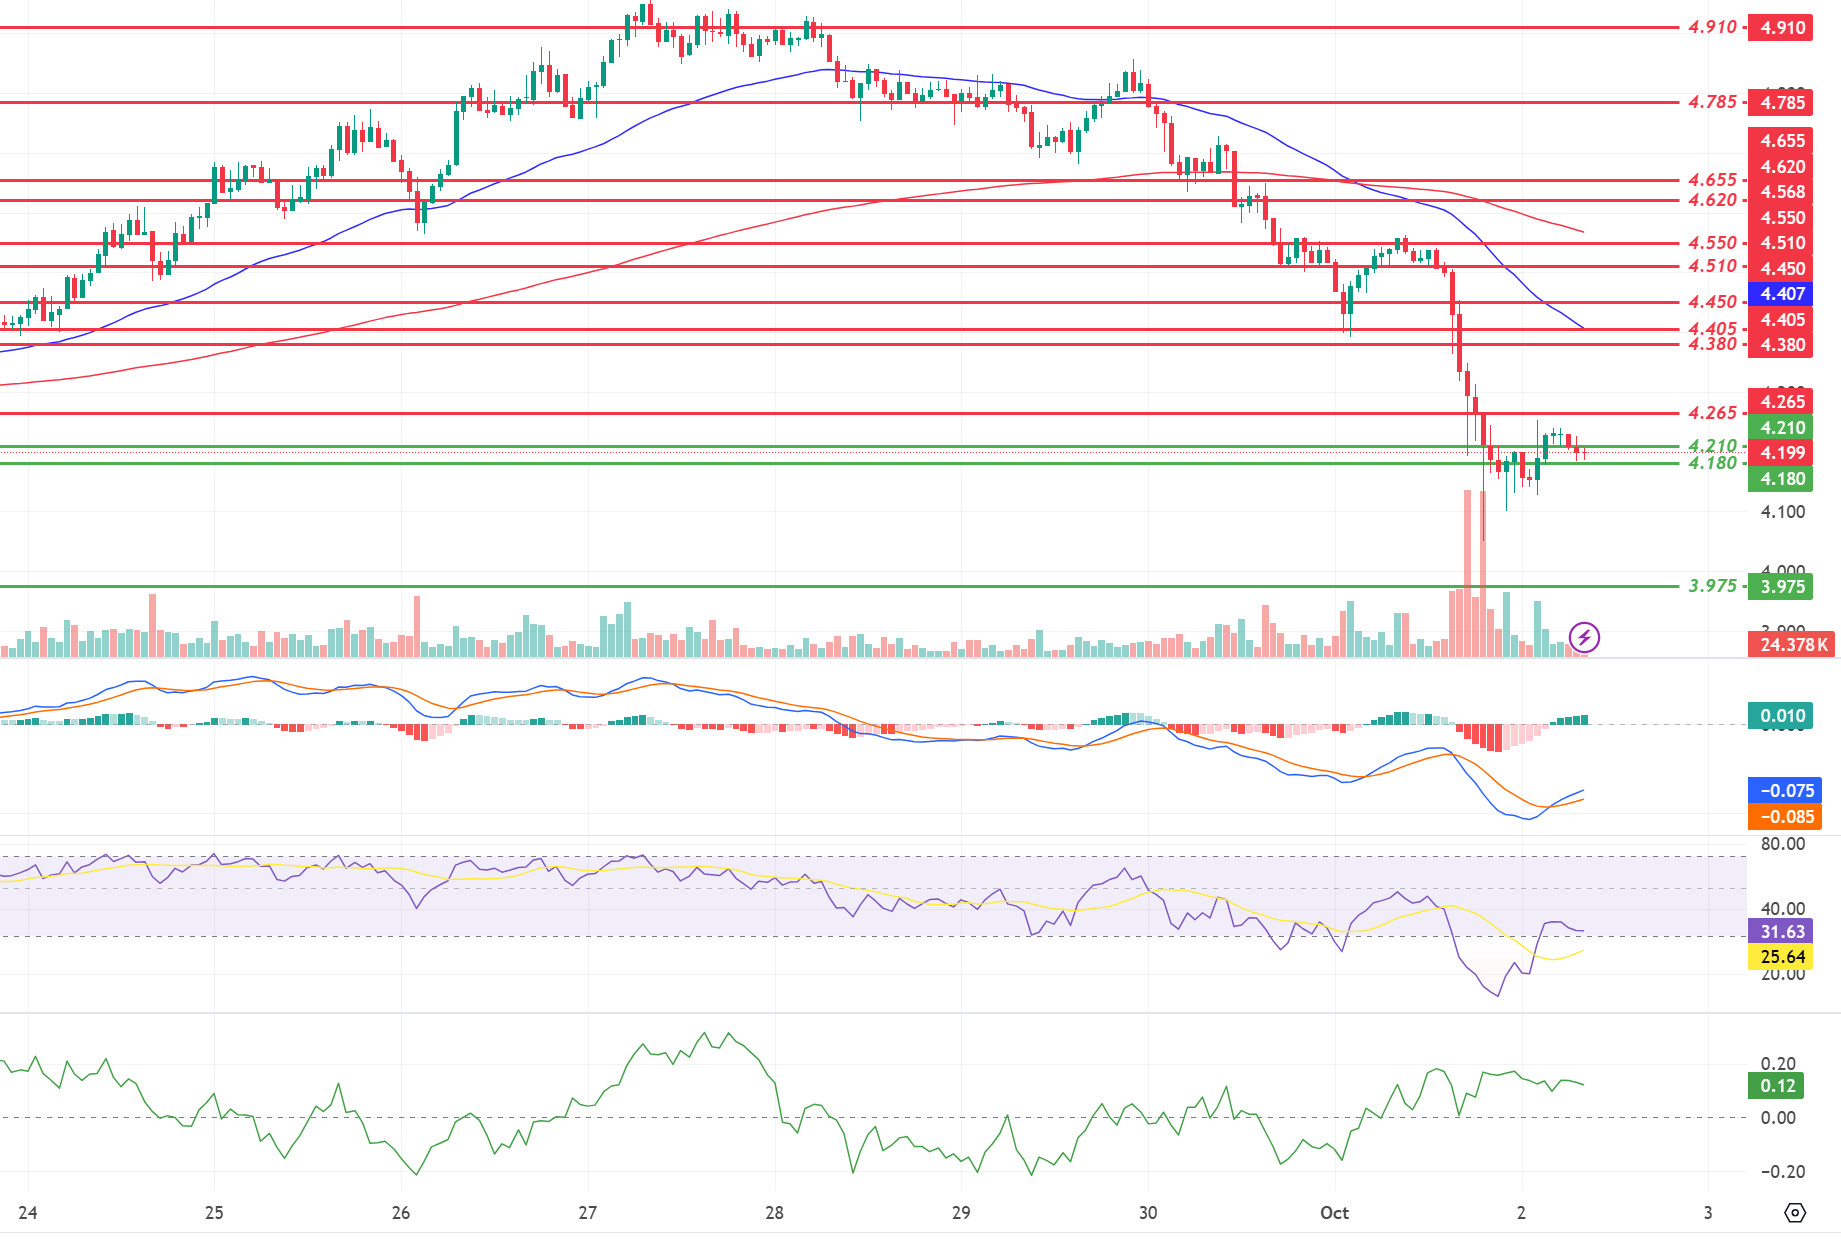
Polkadot fell por about 11% after the selling pressure coming with the Iran-Israel tension. Falling as low as 4.050, Polkadot is currently flat at 4.180. According to MACD and CMF oscillators, buyer pressure seems strong. Positive mismatch is seen el RSI. In this context, we may see a rise towards EMA50 levels. On the other hand, if the 4.180 levels do not work as support, the price may decline towards 4.050 levels.
(Blue line: EMA50, Red line: EMA200)
Supports 4,210 – 4,180 – 3,975
Resistances 4.265 – 4.380 – 4.405
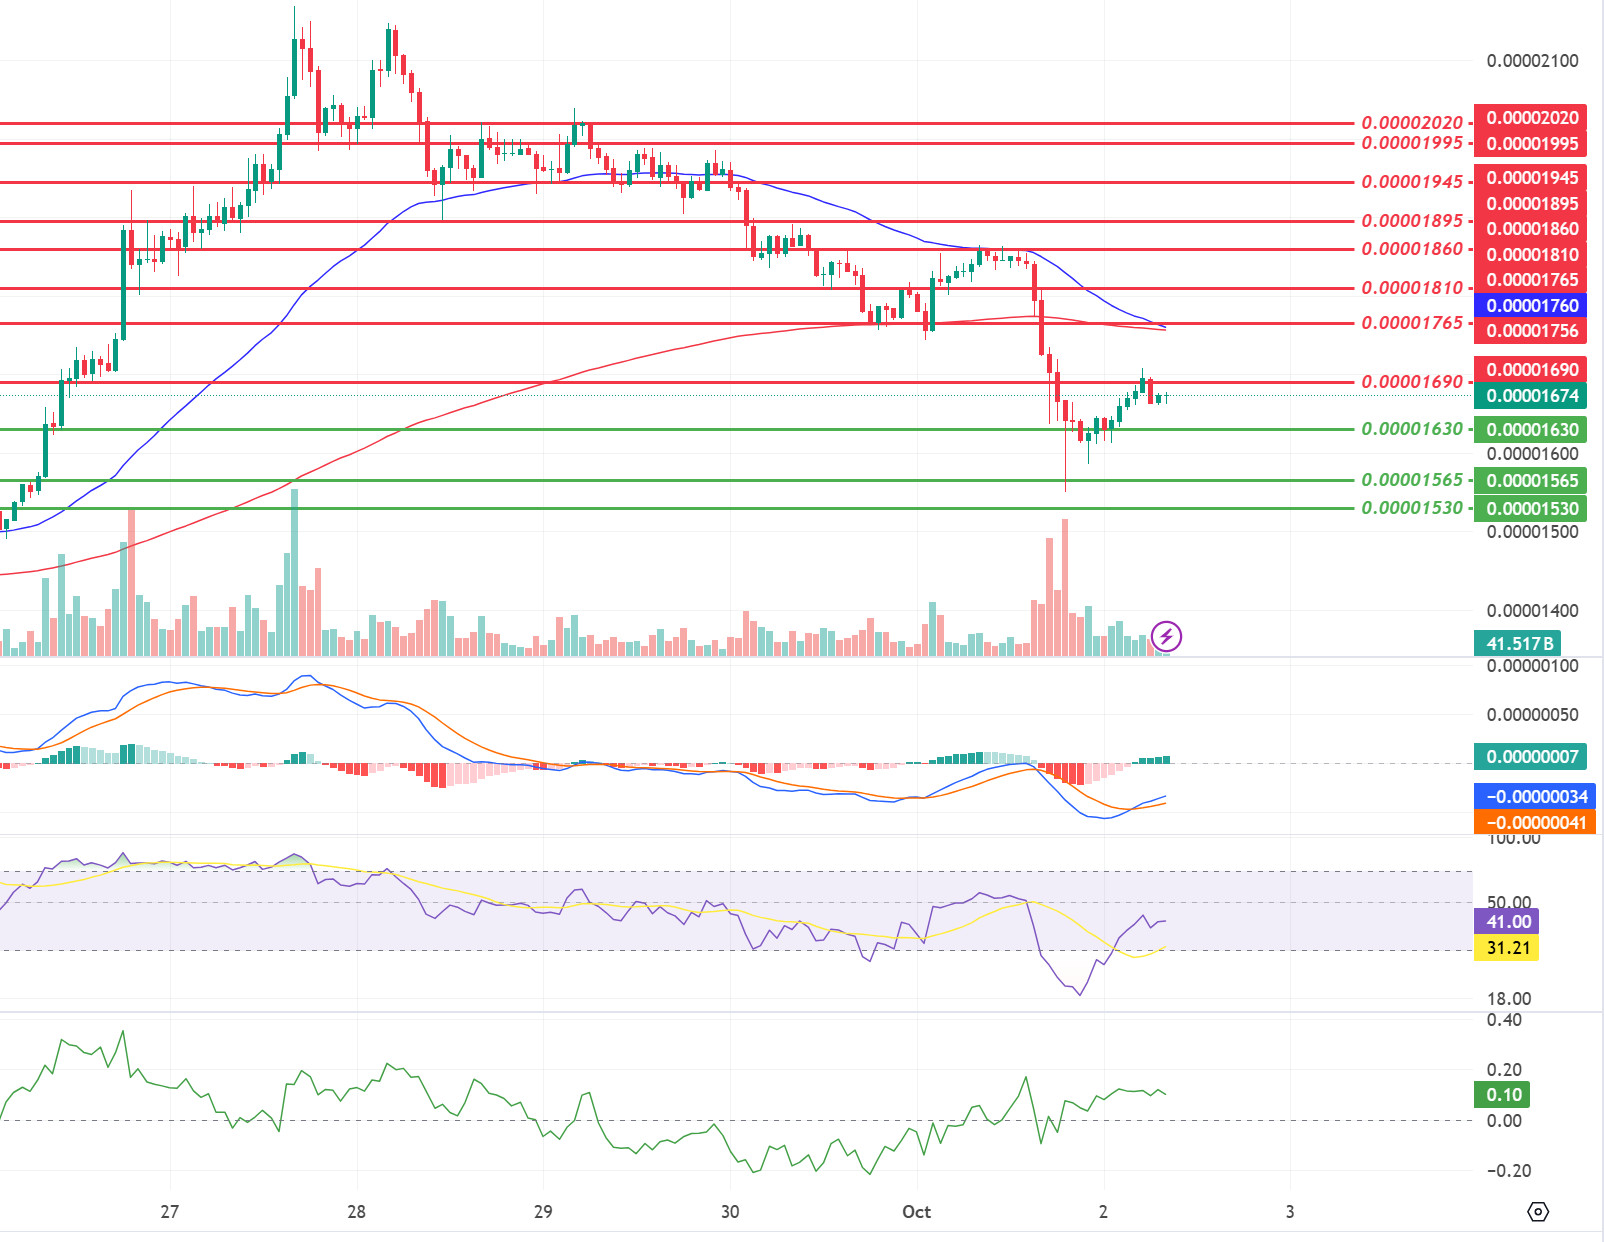
SHIB/USDT
Shiba Inu team introduced a new Web3 game called Shiboshi Rush. In this strategy game, which is available el the Android platform, players aim to destroy enemy castles por strengthening their armies. The iOS version is coming soon. Shiboshi Rush is one of several blockchain-based games en the Shiba Inu ecosystem, along with other popular titles such as Shiba Eternity and Agent Shiboshi.
After the Iran-Israel tension en the Middle East yesterday, there was a sharp decline en the cryptocurrency market. Shiba Inu (SHIB) fell por about 17%. The price, which found support at 0.00001565, is currently hovering at 0.0001670. When we examine the chart, we see that the EMA50 line is about to break down the EMA200 line (Death Cross). In this context, selling pressure may increase. On the other hand, the price may move towards the EMA200 level with the reaction it received after yesterday’s sharp decline.
(Blue line: EMA50, Red line: EMA200)
Supports 0.00001630 – 0.00001565 – 0.00001530
Resistances 0.00001690 – 0.00001765 – 0.00001810
LEGAL NOTICE
The investment information, comments and recommendations contained herein do not constitute investment advice. Investment advisory services are provided individually por authorized institutions taking into account the risk and return preferences of individuals. The comments and recommendations contained herein are of a general nature. These recommendations may not be suitable for your financial situation and risk and return preferences. Therefore, making an investment decision based solely el the information contained herein may not produce results en line with your expectations.
