
MARKET SUMMARY
Latest Situation en Crypto Assets
| Assets | Last Price | 24h | Dominance | Market Cap |
|---|---|---|---|---|
| BTC | 68,990.00 | 1.15% | 57.13% | 1.36 T |
| ETH | 2,736.00 | 3.51% | 13.79% | 329.10 B |
| SOLANA | 170.39 | 7.16% | 3.35% | 79.96 B |
| XRP | 0.5528 | 1.99% | 1.31% | 31.18 B |
| DOGE | 0.1494 | 5.59% | 0.92% | 21.86 B |
| TRX | 0.1559 | -0.40% | 0.57% | 13.49 B |
| CARDANO | 0.3699 | 5.59% | 0.54% | 12.93 B |
| AVAX | 28.97 | 3.86% | 0.49% | 11.77 B |
| SHIB | 0.00001923 | 2.96% | 0.47% | 11.32 B |
| LINK | 11.93 | 5.37% | 0.31% | 7.47 B |
| DOT | 4.56 | 3.43% | 0.29% | 6.87 B |
*Prepared el 10.18.2024 at 06:00 (UTC)
WHAT’S LEFT BEHIND
Bitcoin Very Close to $70,000 Target
Bitcoin approached $70,000 en Asian markets, gaining significant momentum due to the US presidential elections. Analysts stated that Trump’s positive approach to cryptocurrencies triggered this rise. It was emphasized that the election results created great uncertainty en cryptocurrency markets and were closely followed por investors.
Warning from the European Central Bank
According to European Central Bank economists, even if the price of Bitcoin continues to rise, early investors stand to gain, while latecomers and non-Bitcoin owners could suffer serious losses.
Ethereum (ETH) Accumulation Wallets Set New Records
Since the beginning of 2024, Ethereum (ETH) investors have started to make large savings. Especially en the first months of the year, the amount of ETH en wallets increased por 65%. As of now, the amount of ETH held en savings wallets has reached 19 million ETH, which is equivalent to a value of approximately $50.2 billion.
HIGHLIGHTS OF THE DAY
Important Economic Calender Data
| Time | Noticias | Expectation | Previous |
|---|---|---|---|
| World Chain – Worldcoin (WLD) Event (or earlier) | |||
| USD Coin – Impact Pitch Competition | |||
| Flare (FLR) – SIP. 04 Voting Begins | |||
| 12:55 | US FOMC Member Logan Speaks | ||
| 17:00 | US FOMC Member Kashkari Speaks | ||
| 21:05 | US FOMC Member Schmid Speaks |
INFORMATION:
*The calendar is based el UTC (Coordinated Universal Time) time zone. The economic calendar content el the relevant page is obtained from reliable news and data providers. The news en the economic calendar content, the date and time of the announcement of the news, possible changes en the previous, expectations and announced figures are made por the data provider institutions. Darkex cannot be held responsible for possible changes that may arise from similar situations.
MARKET COMPASS
Digital assets remain bullish. As cash inflows into ETFs continue, Trump’s lead en the US presidential election according to a Polymarket poll and the recent approval por the U.S. Securities and Exchange Commission (SEC) to list options el multiple spot Bitcoin ETFs have contributed to continued gains. The expectation that institutional adoption will increase with the permissions of regulators keeps the demand for crypto assets alive.
This morning, global markets are talking about Israel’s stepped up operations en Lebanon and the Chinese Central Bank’s (PBOC) continued steps to support the economy por cutting interest rates. Of course, the next move of the US Federal Reserve (FED) (expected to cut interest rates por 25 basis points) and the health of the world’s two largest economies are also closely monitored.
BTC’s rally from below $59,000 el October 24 continued, driving gains en digital assets. We continue to think that the recent price changes, which are en line with our long-term bullish expectation, will continue, but that there will be respite phases as we have seen from time to time.
TECHNICAL ANALYSIS
BTC/USDT
Bitcoin continues to maintain its uptrend since the segundo week of October. The limited retracements en Bitcoin, which has been steadily gaining value, is one of the most important factors en maintaining its strong stance with the impact of the upcoming US elections. Presidential candidate Donald Trump’s widening gap en the polls as he enters the last weeks stands out as an important development for the crypto market. In this process, where an active period awaits us for Bitcoin, market dynamics are expected to accelerate further.
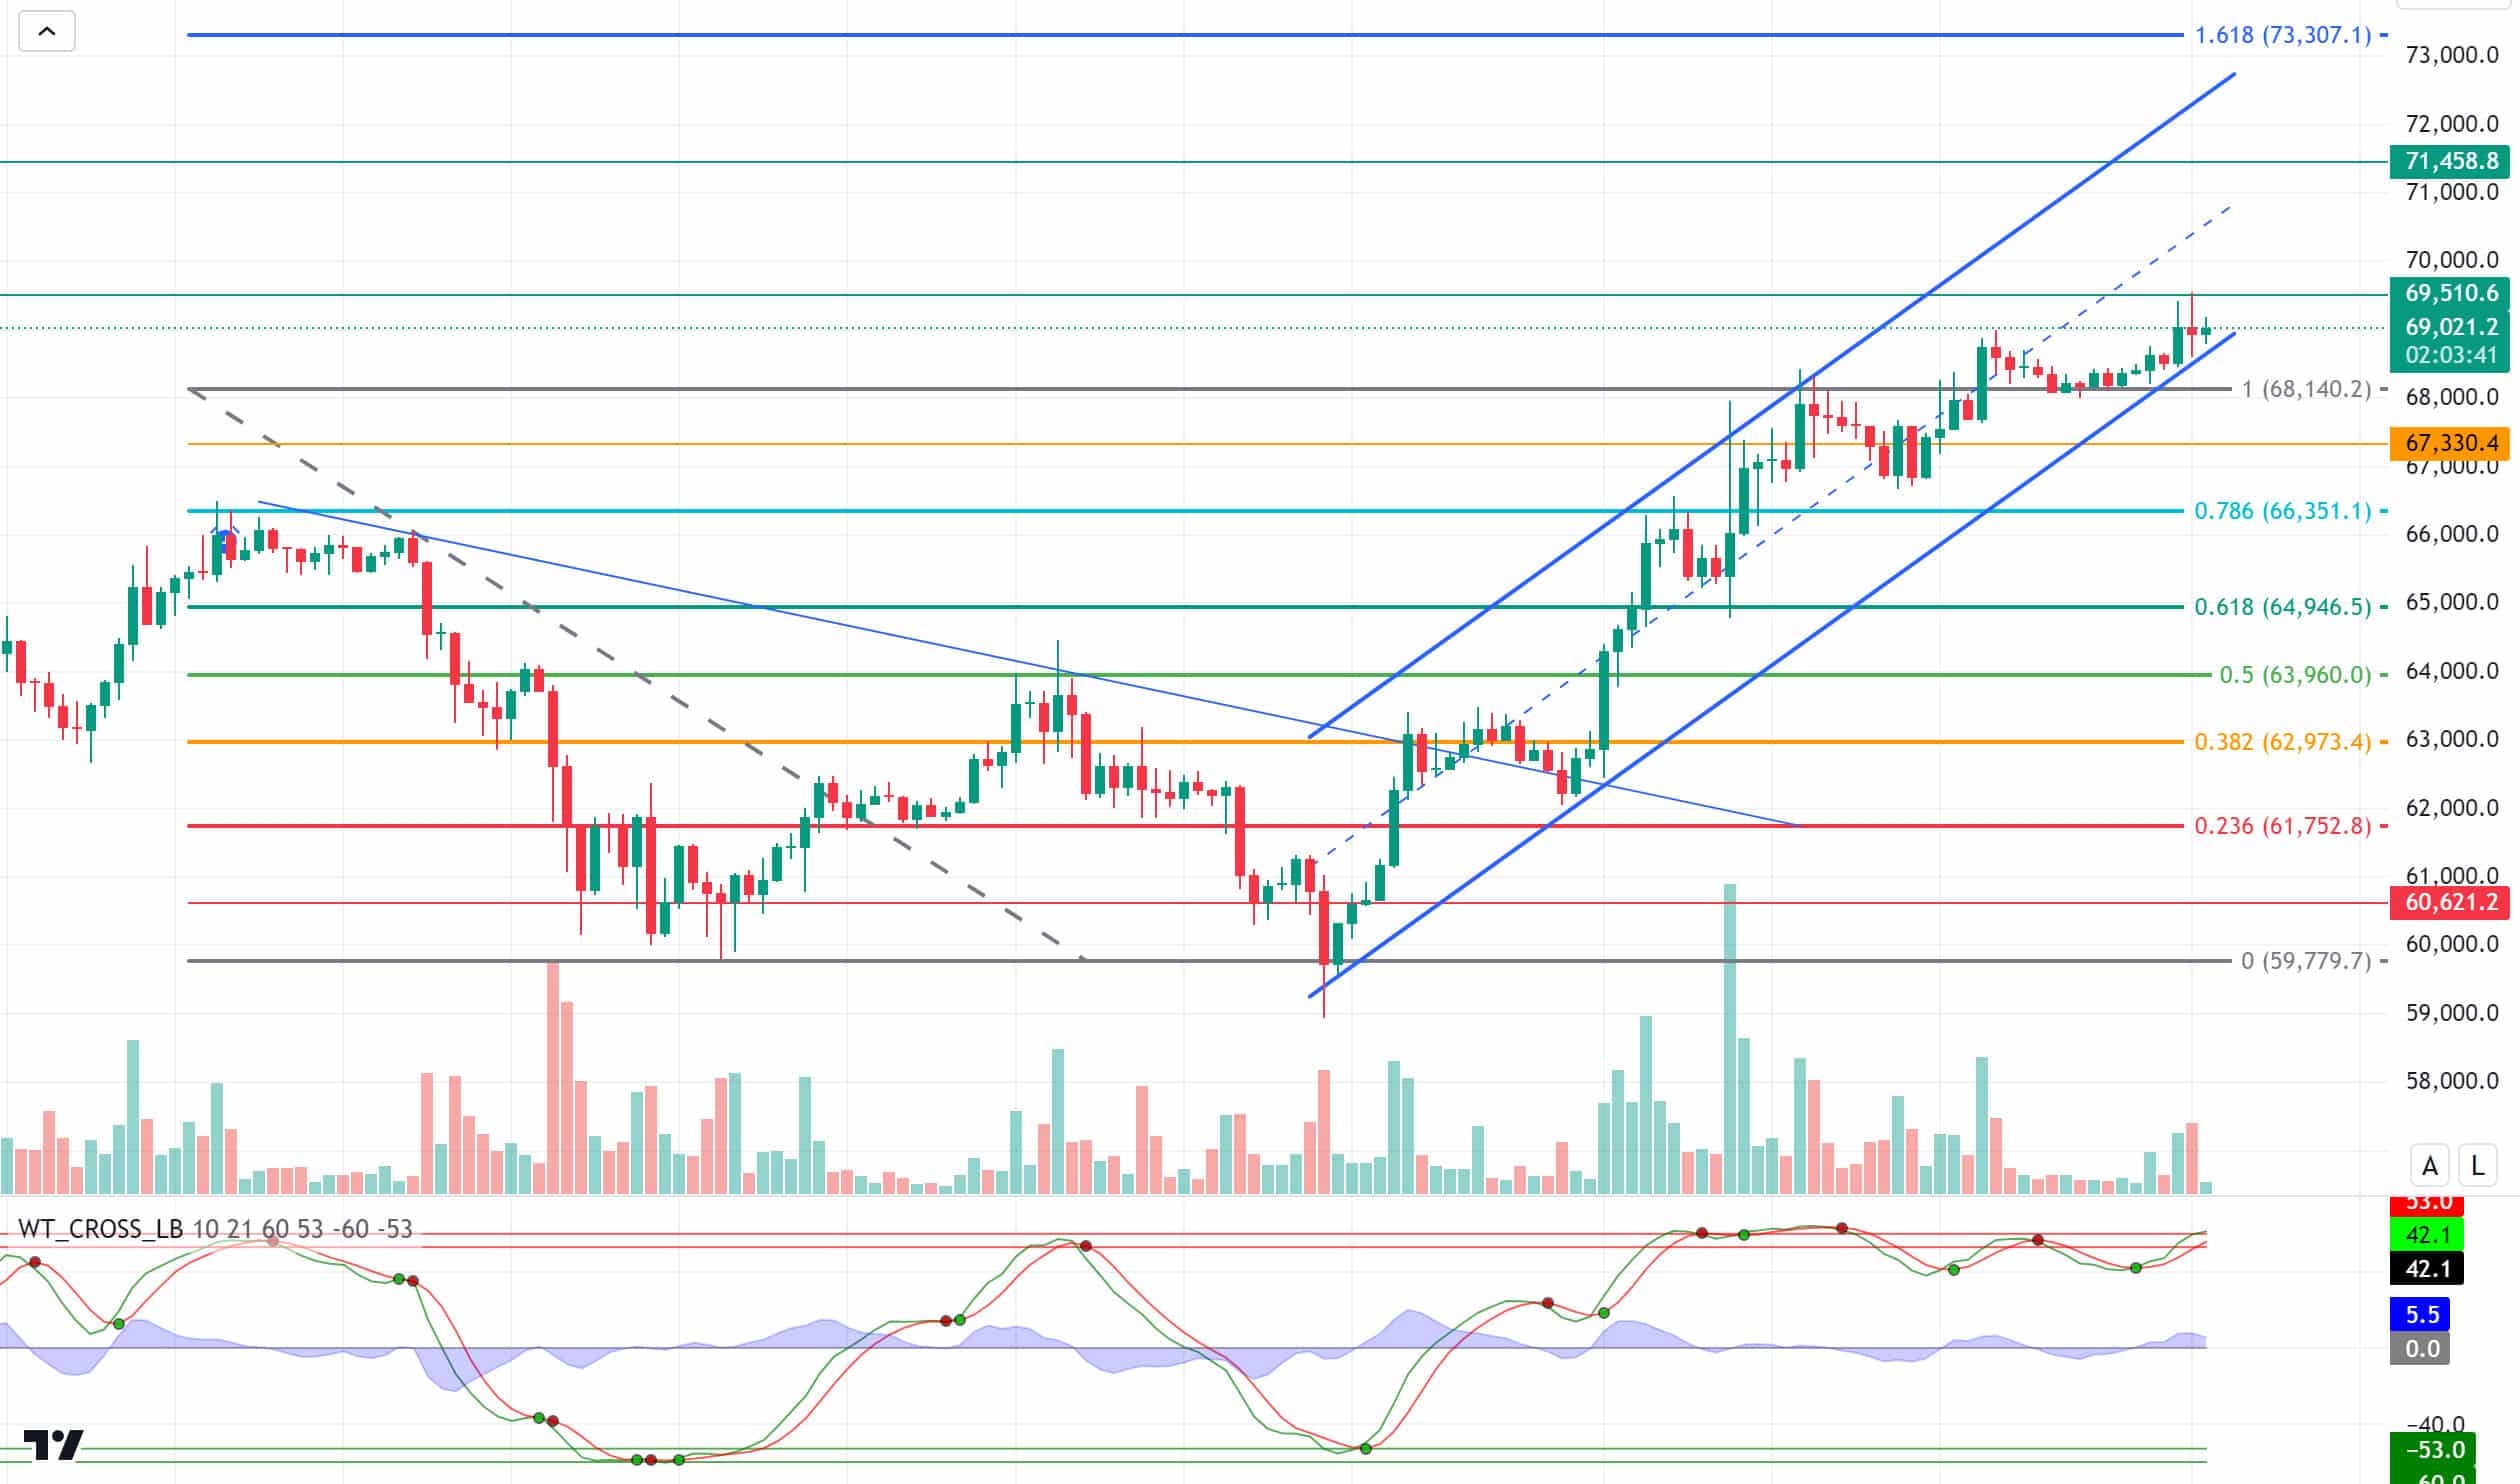
When we look at the BTC 4-hora technical analysis chart, it is observed that the upward momentum has decreased slightly before the upcoming ATH level, although it continues to move up en the rising trend channel. With the Fibonacci resistance level of 1 (68,140) being breached, we see that the next resistance zone of 69,510 is being tested. With the crossing of this level, the 71,458 level, which is the resistance of our last band range before the all-time high, may appear. The fact that technical indicators have been moving en the overbought zone for a long time and BTC has not made a significant correction shows that we are en a ‘bullish’ period. In a possible pullback, Fibonacci 1 (68,140) can be re-monitored as a support level.
Supports 68,140 – 67,330 – 66,350
Resistances 69,510 – 71,470 – 73,700
ETH/USDT
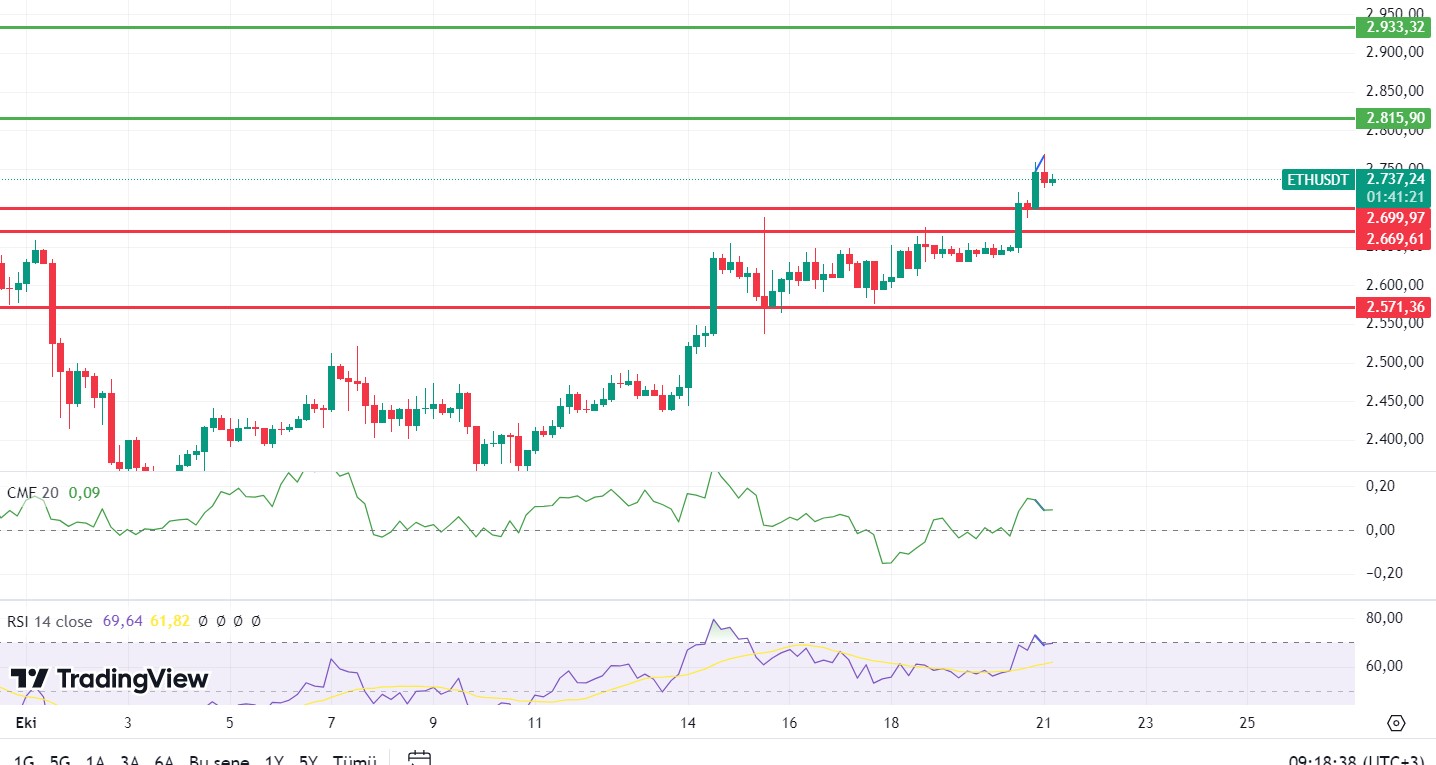
The crypto market broke through some very important resistance zones with the new uptrend that started el Friday. With this, ETH, which started to push the 2,669 level, broke through this zone and quickly rose to 2,770. However, with this rise, negative divergences el Relative Strength Index (RSI), Chaikin Money Flow (CMF) and Money Flow Index (MFI) started to stand out. In addition, looking at the Cumulative Volume Delta (CVD), it is seen that the spot side has been selling en recent horas while the futures side has been buying. In this context, a correction can be expected during the day. However, corrections that may come up to 2,700 levels will not disrupt the overall positive trend. If it can find a reaction from 2,700 support, a new uptrend may start from this level to 2,815 levels. Breaking the 2,700 level may cause declines up to 2,669.
Supports 2,700 – 2,669 – 2,571
Resistances 2,815 – 2,933 – 3,045
LINK/USDT
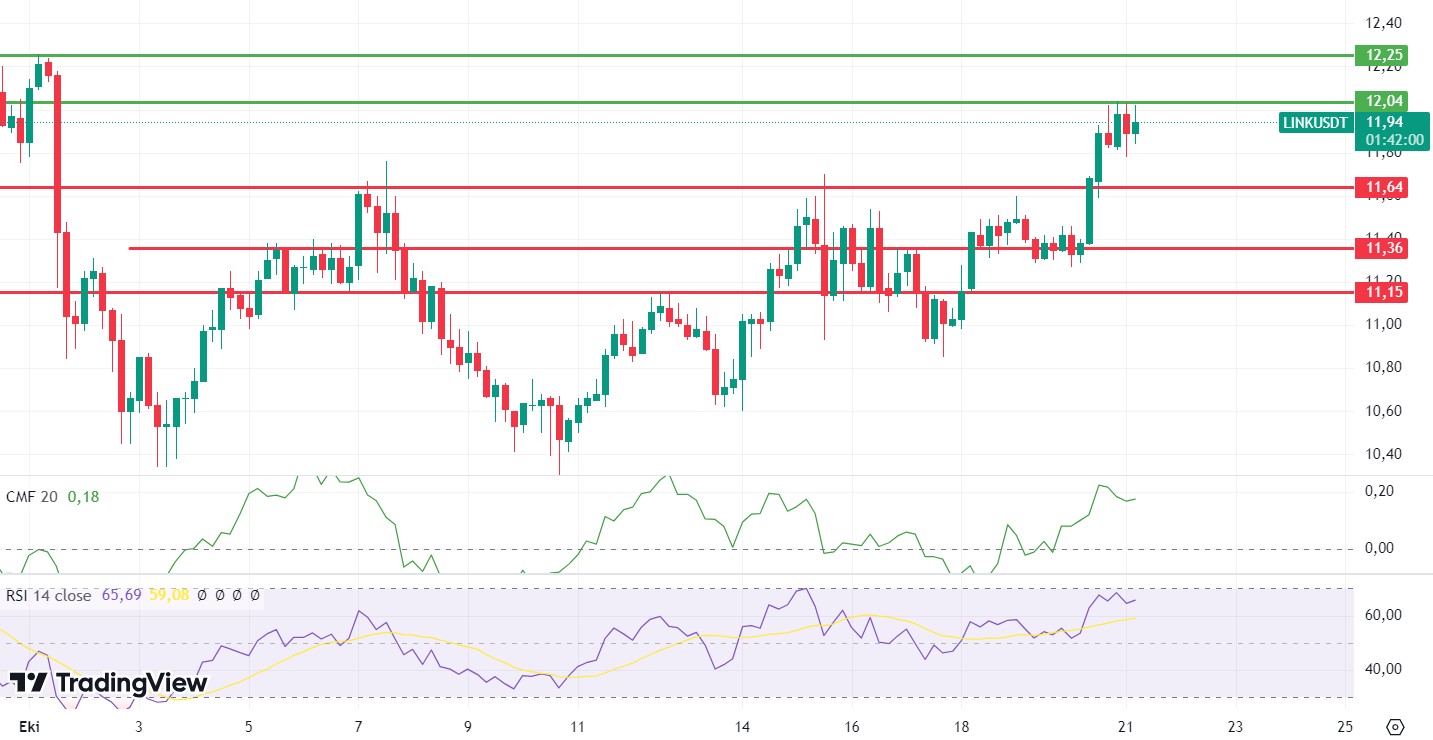
LINK also continues to rise sharply after breaking the most important resistance level of 11.64 with the rise. Weakness is seen el Chaikin Money Flow (CMF). Relative Strength Index (RSI) is neutral while Commodity Channel Index (CCI) maintains its positive outlook. In the light of all these data, closures above the 12.04 level for LINK, which is expected to continue its horizontal movement during the day, may bring the continuation of the rise. The 11.64 level stands out as the main support and the downtrend may start again with the break of this level.
Supports 11.64 – 11.36 – 11.15
Resistances 12.04 – 12.25 – 12.71
SOL/USDT
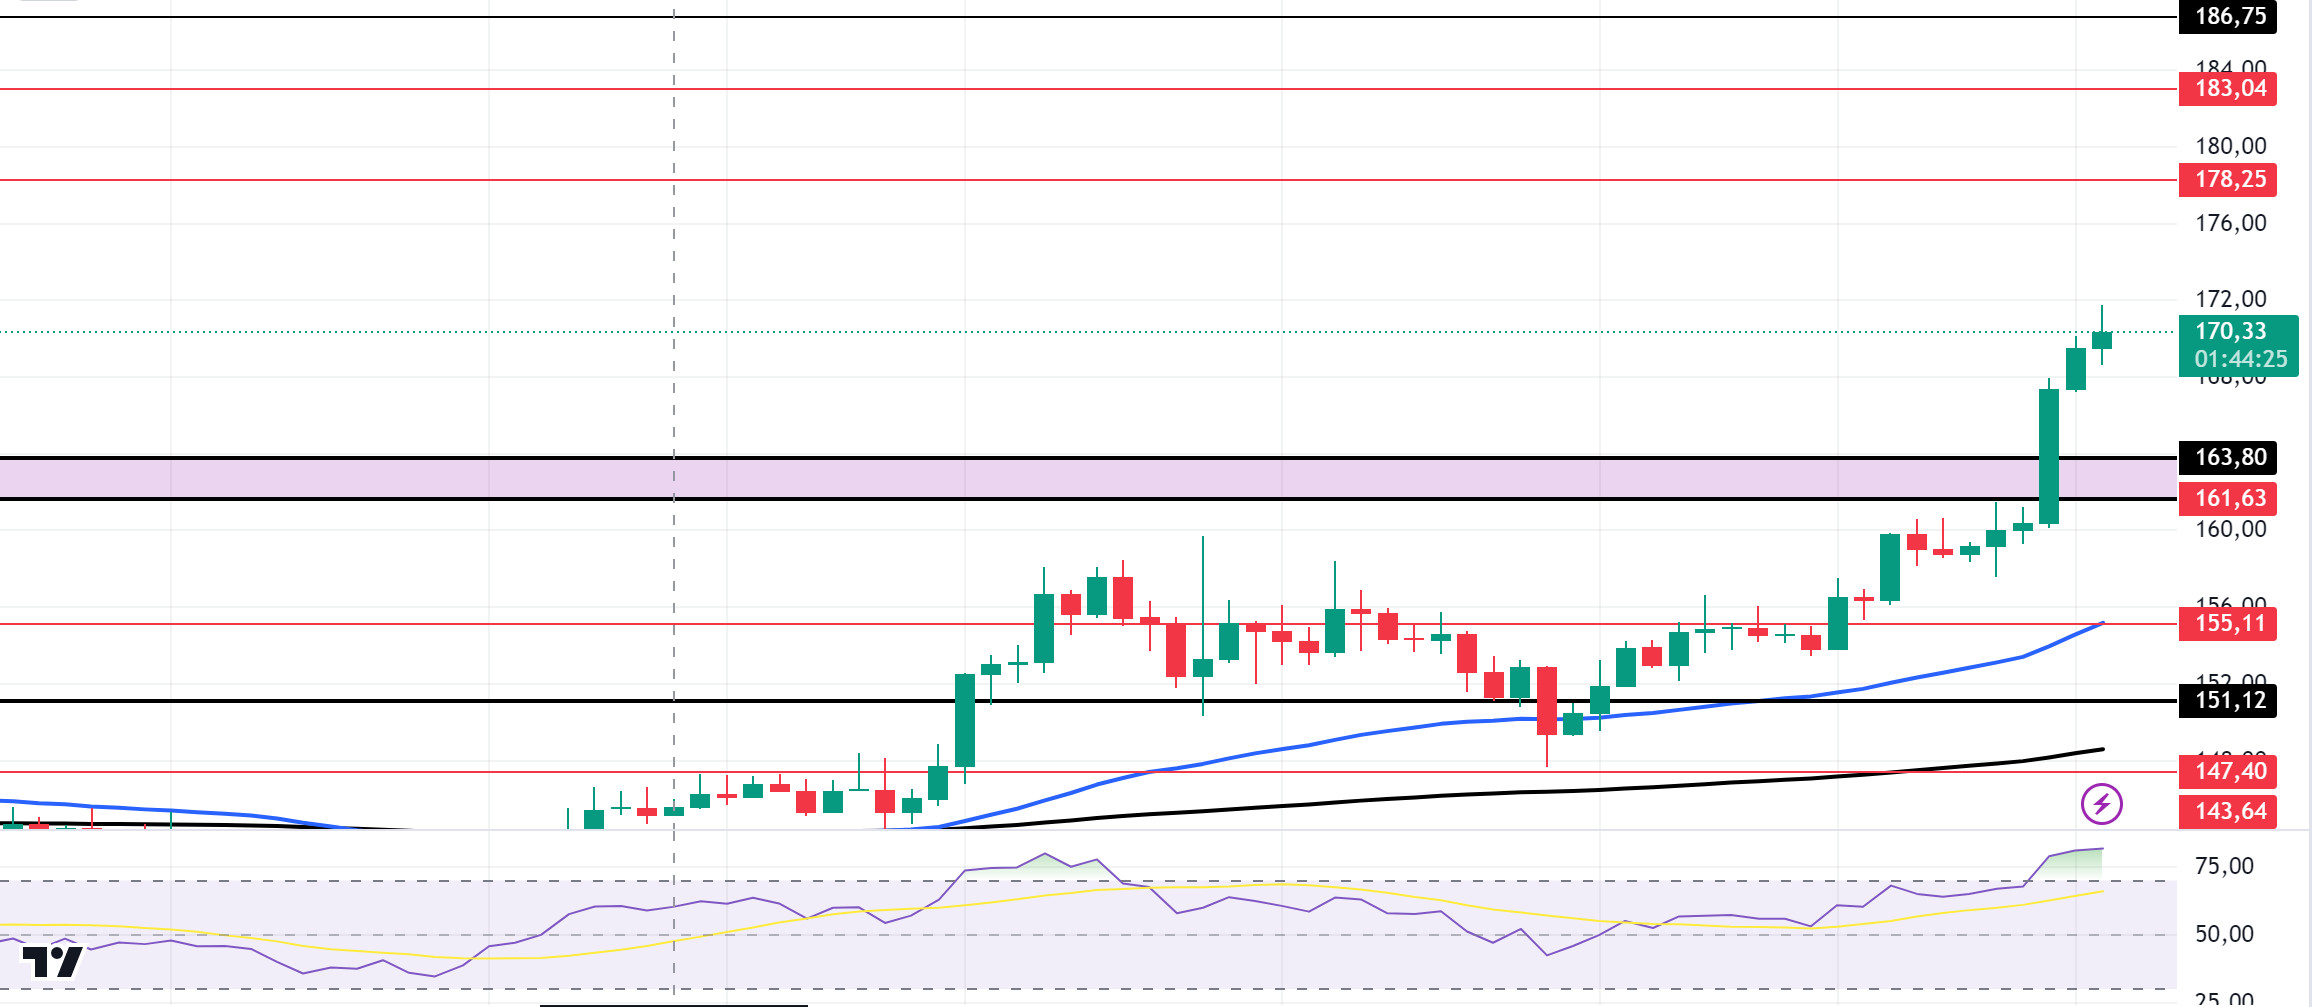
The US Securities and Exchange Commission (SEC) approved spot Bitcoin options applications from the New York Stock Exchange (NYSE) and the Chicago Board Options Exchange (CBOE) el October 18. The activation of options trading el the 11 approved Bitcoin ETF providers could create a significant flow of liquidity en the sector. In the Sol ecosystem, the SOL total volume lock (TVL) witnessed a sharp turnaround from $3.8 billion to $5.95 billion, an increase of 56% en the last 11 weeks, according to DeFiLlama. The rising TVL indicates that investors have more confidence en the network’s DeFi protocols. Furthermore, Intotheblock data shows that the number of addresses el the Solana blockchain increased from 3 million to 4.89 million, accounting for 63% of the growth en two weeks. The SOL chart started the day bullish. On the 4-hora timeframe, the 50 EMA (Blue Line) continues to be above the 200 EMA (Black Line). This could mean that the uptrend will continue. The price broke an important resistance level of 163.80 el volume. But the Relative Strength Index (RSI)14 indicator is en the overbought zone. This may bring profit sales. This means that the SOL price may fall. The 186.75 level is a very strong resistance point en the uptrend driven por both macroeconomic conditions and innovations en the Solana ecosystem. If it rises above this level, the rise may continue strongly. In case of possible profit sales, support levels of 163.80 – 161.63 should be followed. If the price comes to these support levels, a potential bullish opportunity may arise.
Supports 163.80 – 161.63 – 155.11
Resistances 178.25 – 183.04 – 186.75
ADA/USDT
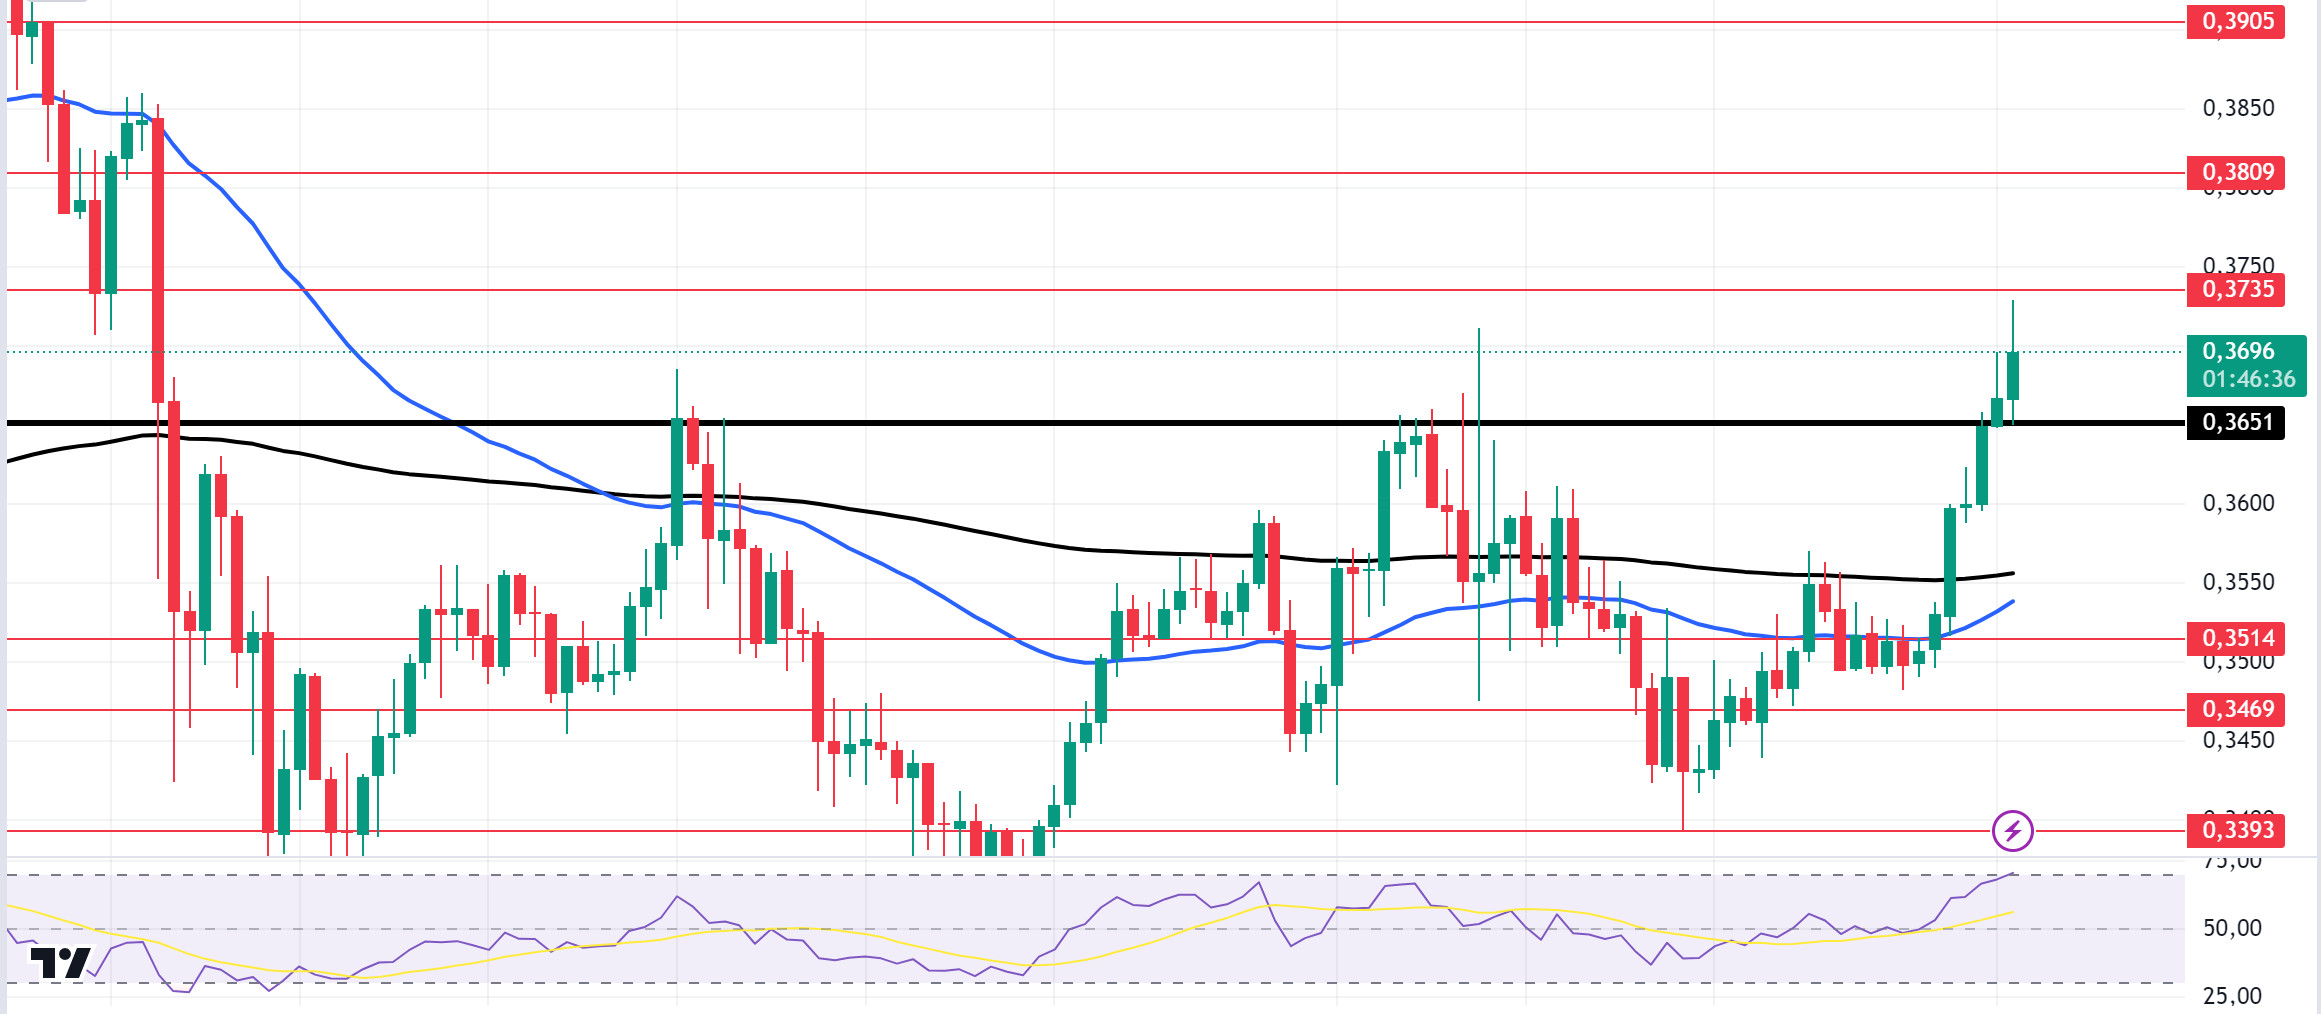
The US Securities and Exchange Commission (SEC) approved spot Bitcoin options applications from the New York Stock Exchange (NYSE) and the Chicago Board Options Exchange (CBOE) el October 18. The activation of options trading el the 11 approved Bitcoin ETF providers could create a significant flow of liquidity en the sector. In the Cardano ecosystem, Cardano (ADA) founder Charles Hoskinson unveiled an ambitious vision for the blockchain platform’s future beyond the Voltaire era, or Cardano 2.0. Hoskinson’s presentation en Argentina earlier this week highlighted Cardano’s journey from its inception to its current state and outlined a comprehensive roadmap for the years to 2030. Since our morning analysis, the ADA price has been flat. On the 4-hora chart, the downtrend that started el October 15th continues. ADA is struggling to gather enough volume to recover from its recent pullback. On the 4-hora chart, the price is pricing above the 50 EMA and 200 EMA. At the same time, the 50 EMA (Blue Line) continues to hover below the 200 EMA (Black Line). This supports that the trend is bearish. Relative Strength Index (RSI)14 indicator is en overbought territory. This may bring profit sales. If macroeconomic data is positive for cryptocurrencies, it will retest the 0.3735 resistance level. Reduced money flow and the recent rejection from the resistance could signal a potential decline towards the support zone. If this happens, 0.3651 is a support level and can be followed as a good place to buy.
Supports 0.3651 – 0.3514 – 0.3469
Resistances 0.3735 – 0.3809 – 0.3905
AVAX/USDT
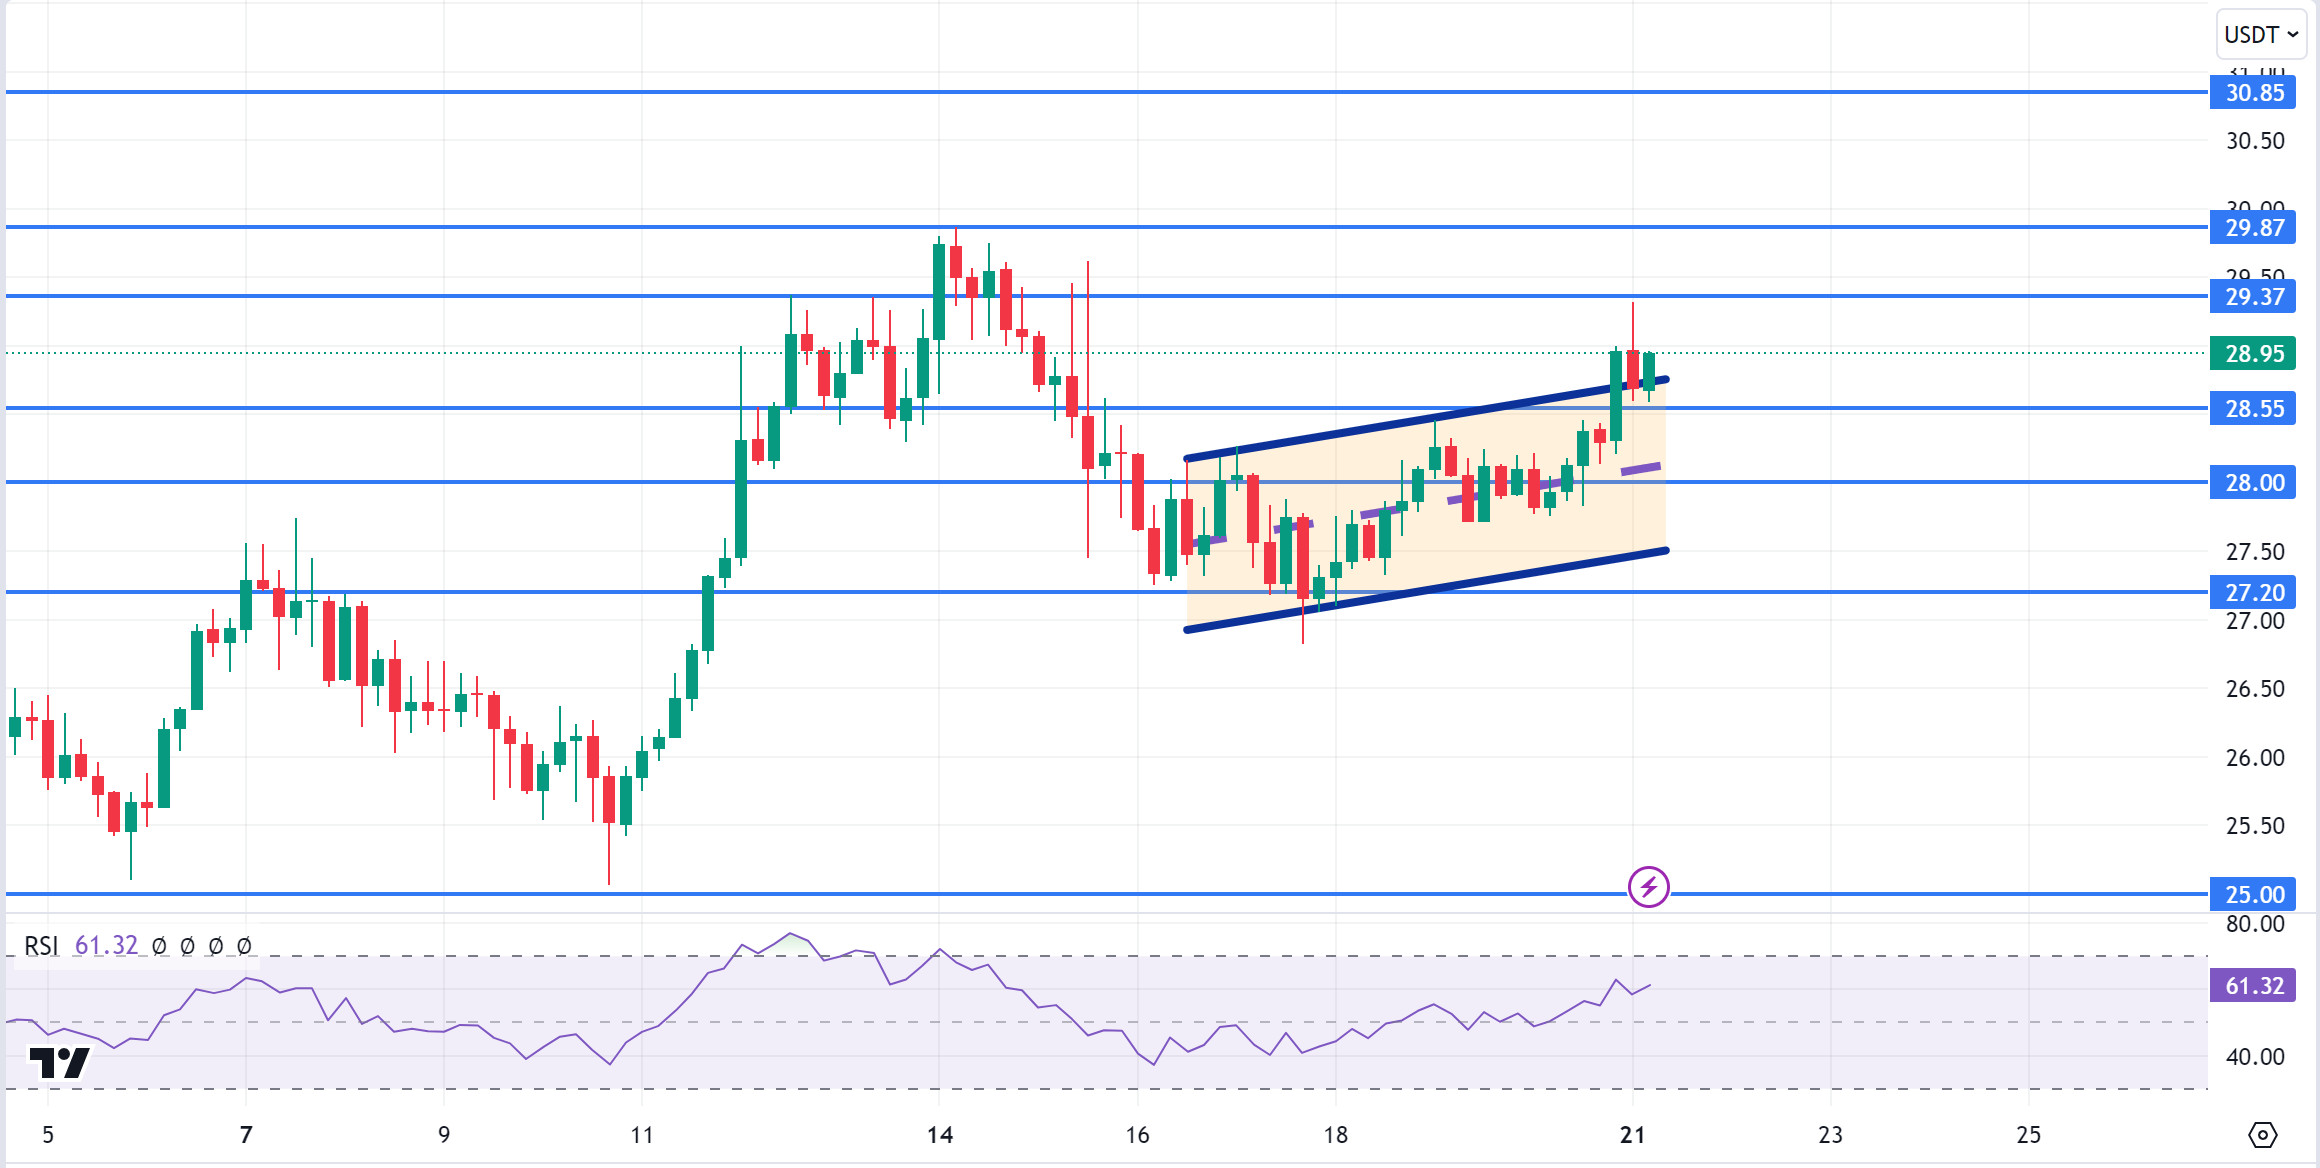
AVAX, which opened yesterday at 28.10, rose por about 3% during the day and closed the day at 28.96. Today, there is no planned data to be announced especially por the US and expected to affect the market. For this reason, it may be a low-volume day where we may see limited movements. Noticias flows from the Middle East will be important for the market.
AVAX, currently trading at 28.95, is moving en an uptrend el the 4-hora chart. It is en the upper band of the uptrend and the Relative Strength Index value has approached the overbought zone with 61 and can be expected to move to the middle band por falling from here. In such a case, it may test 28.00 support. In case of news that the tension en the Middle East is over, purchases may increase. In such a case, it may test 29.37 resistance. As long as it stays above 25.00 support during the day, the desire to rise may continue. With the break of 25.00 support, sales may increase.
Supports 28.55 – 28.00 – 27.20
Resistances 29.37 – 29.87 – 30.85
TRX/USDT
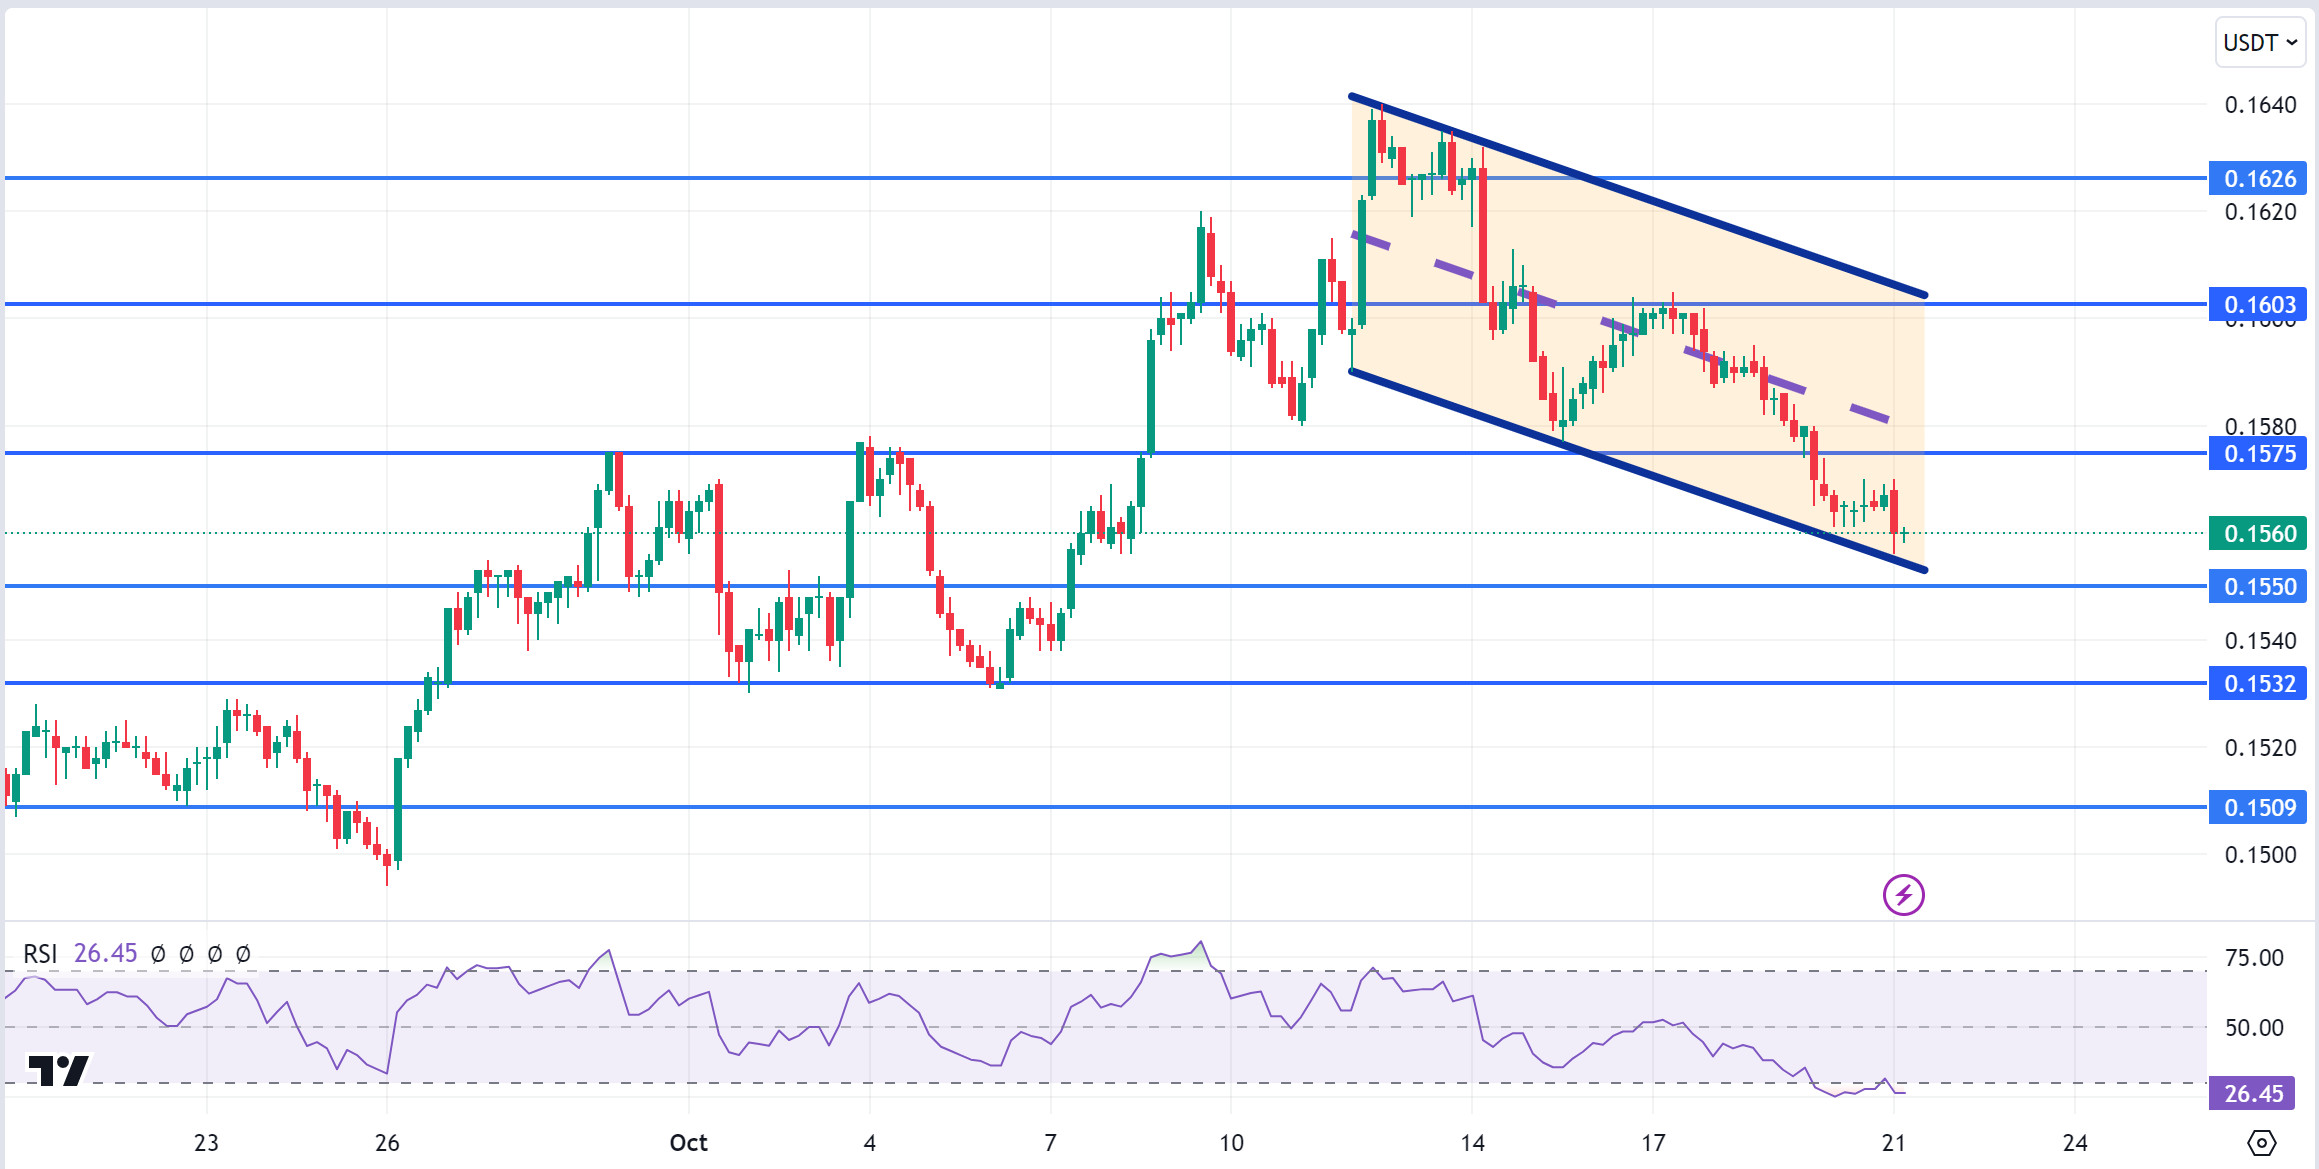
TRX, which started yesterday at 0.1567, moved horizontally during the day and closed the day at 0.1567. There is no planned data for the market to follow today. The market will be closely following the news flows regarding the tension en the Middle East.
TRX, currently trading at 0.1560, is at the lower band of the downtrend el the 4-hora chart. The Relative Strength Index value is en the oversold zone with 26 and can be expected to rise slightly from its current level. In such a case, it may move to the middle band of the trend and test the 0.1575 resistance. However, if it cannot close the candle above 0.1575 resistance, it may test 0.1550 support with the selling pressure that may occur. As long as TRX stays above 0.1482 support, the desire to rise may continue. If this support is broken downwards, sales can be expected to increase.
Supports 0.1550 – 0.1532 – 0.1509
Resistances 0.1575 – 0.1603 – 0.1626
XRP/USDT
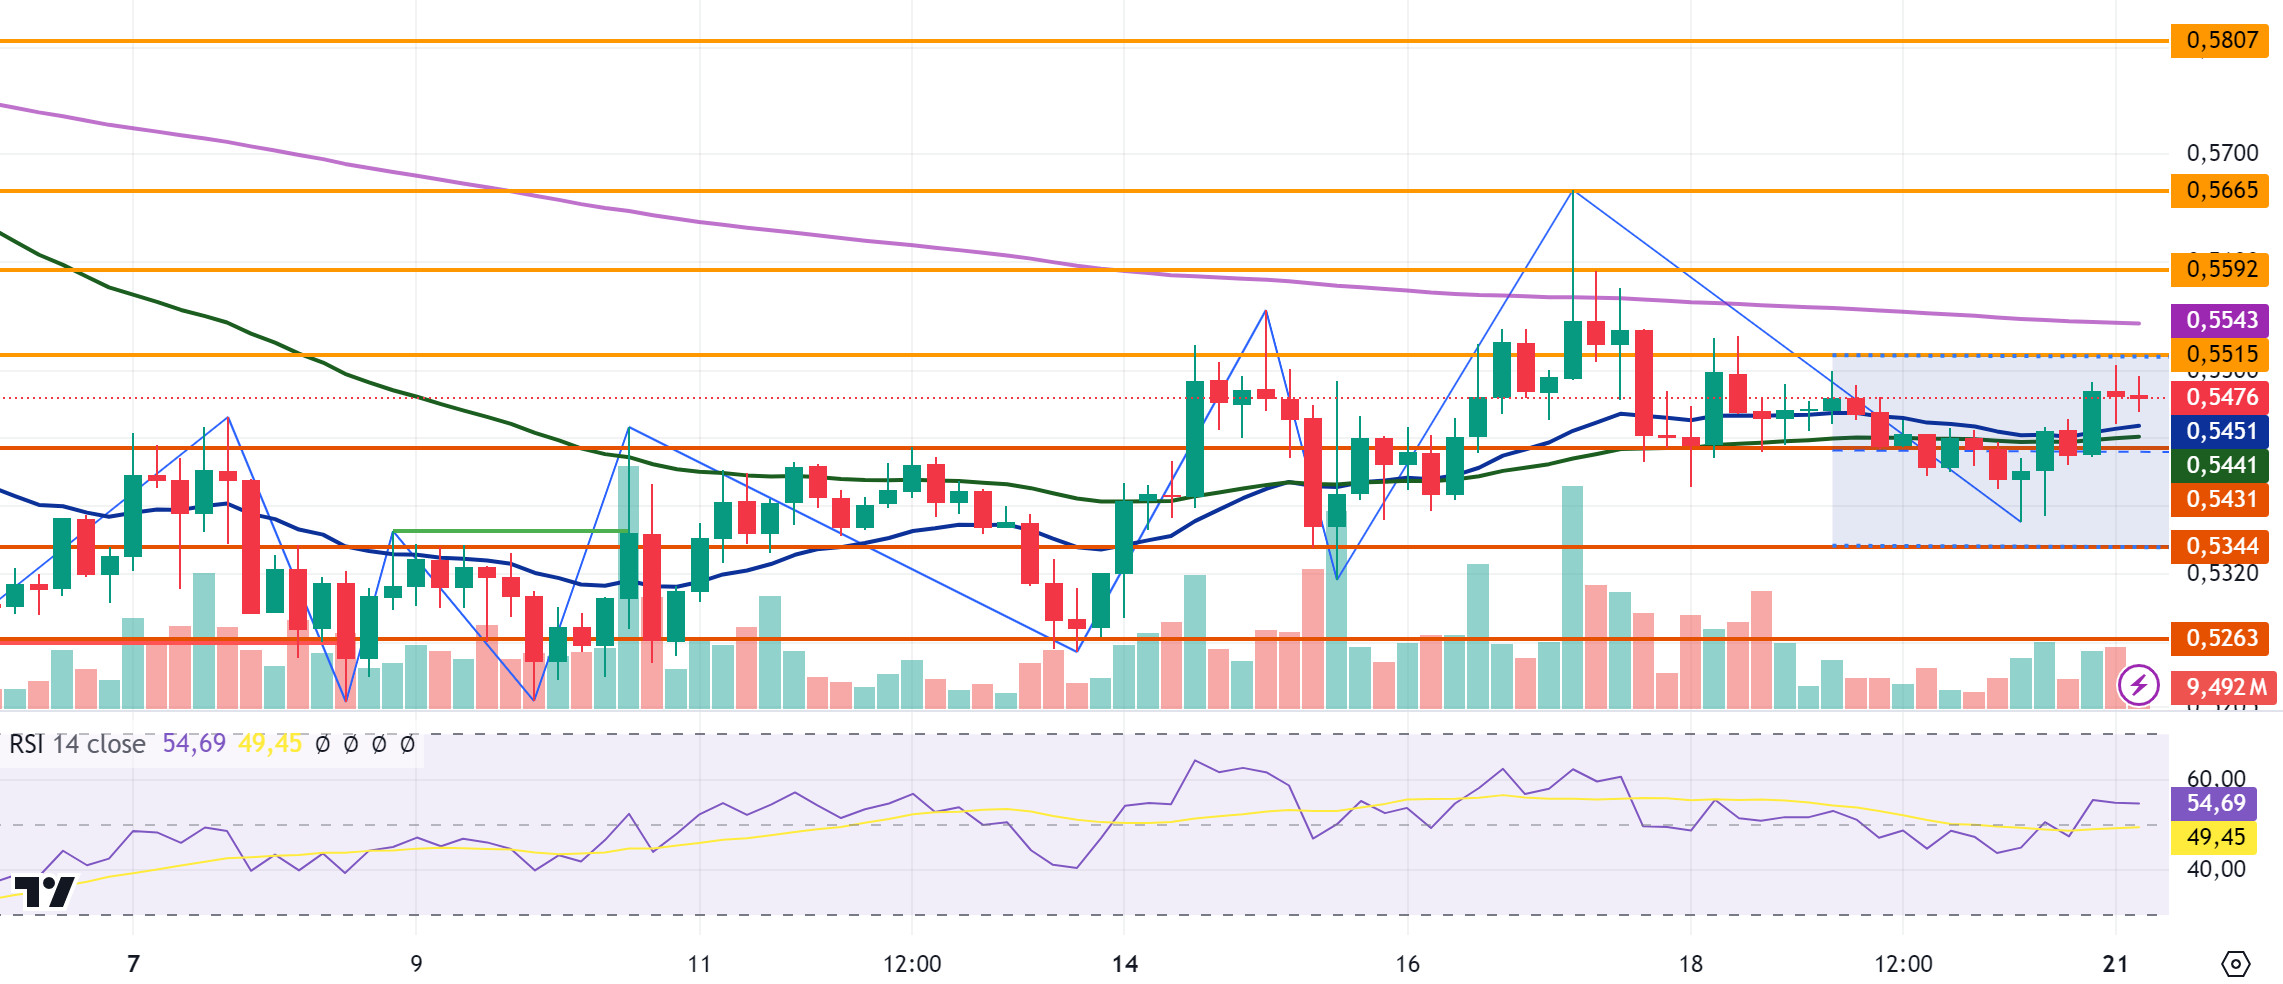
XRP fell en the 4-hora analysis after selling at the 200-period exponential moving average (EMA200) level en its rise last week. XRP, which was traded en a horizontal band between 0.53 and 0.55 levels with its decline, started the day with a decline en the 4-hora analysis yesterday and then started to rise. Yesterday’s daily close en XRP was realized at 0.5483. XRP, which started the day with a decline, is currently trading at 0.5476. While the crypto market is bullish across the board, XRP continues to move en a horizontal band. The Relative Strength Index (RSI) value is en the neutral zone and XRP may move en a horizontal band. If it starts to rise with positive developments, it may test the 0.5515 resistance level and then the EMA200 level. With the break of these levels el the rise, it may test the resistance levels of 0.5628-0.5723 en the continuation of the rise. On the contrary, en case of negative developments, it may test the EMA20 and EMA50 and 0.5431 support levels en its decline. If these levels are broken el the decline, the decline may deepen and test the 0.5351-0.5231 support levels.
XRP may decline el its rise with possible sales at the EMA200 level and may offer a short trading opportunity. In its decline, purchases that may come at the 0.5431 level may rise and offer a long trading opportunity.
EMA20 (Blue Line) – EMA50 (Green Line) – EMA200 (Purple Line)
Supports 0.5431 – 0.5351 – 0.5231
Resistances 0.5515 – 0.5628 – 0.5723
DOGE/USDT
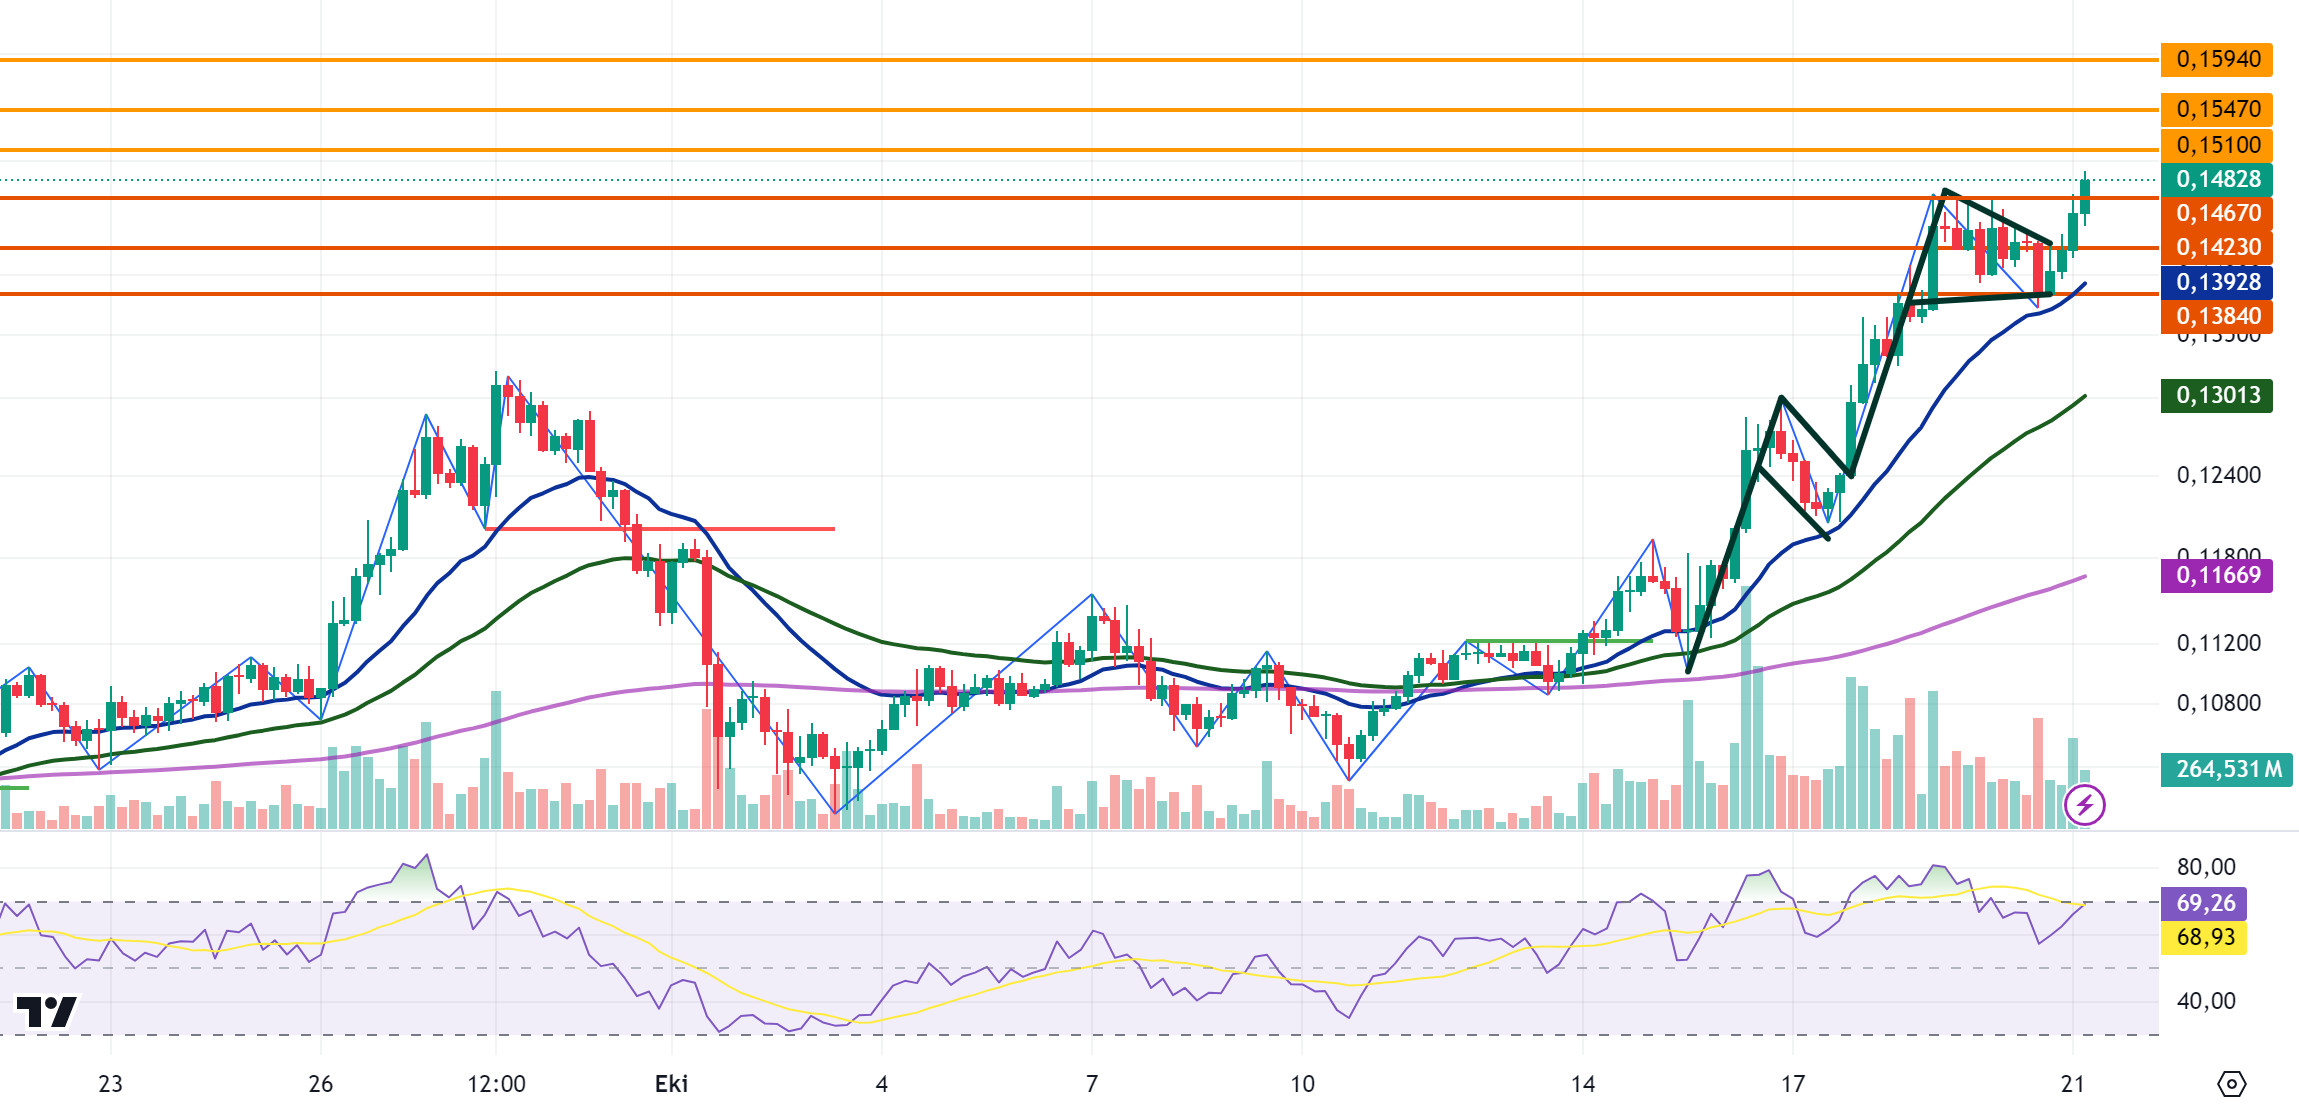
DOGE is moving en line with the uptrend seen across the crypto market, and DOGE, which rose before the close en the 4-hora analysis yesterday, continued to rise today and is currently trading at 0.1483 with an increase of approximately 4.5%. The data currently looks positive for DOGE and it is predicted that the uptrend may continue. The fact that it is located above the exponential moving average (EMA) levels has a positive effect el increasing the purchase volume. The Relative Strength Index (RSI) value is at the border of the overbought zone, so there may be a correctional decline en its rise. In the 4-hora analysis, we mentioned the flag pattern formed last week and the flag pattern continues. DOGE may test the resistance levels of 0.1510-0.1547-0.1594 with its rise within the uptrend. In the scenario where the rise is replaced por a decline, it may test the support levels of 0.1467-0.1423-0.1384 with its decline.
EMA20 (Blue Line) – EMA50 (Green Line) – EMA200 (Purple Line)
Supports 0.1467 – 0.1423 – 0.1384
Resistances 0.1510 – 0.1547 – 0.1594
DOT/USDT
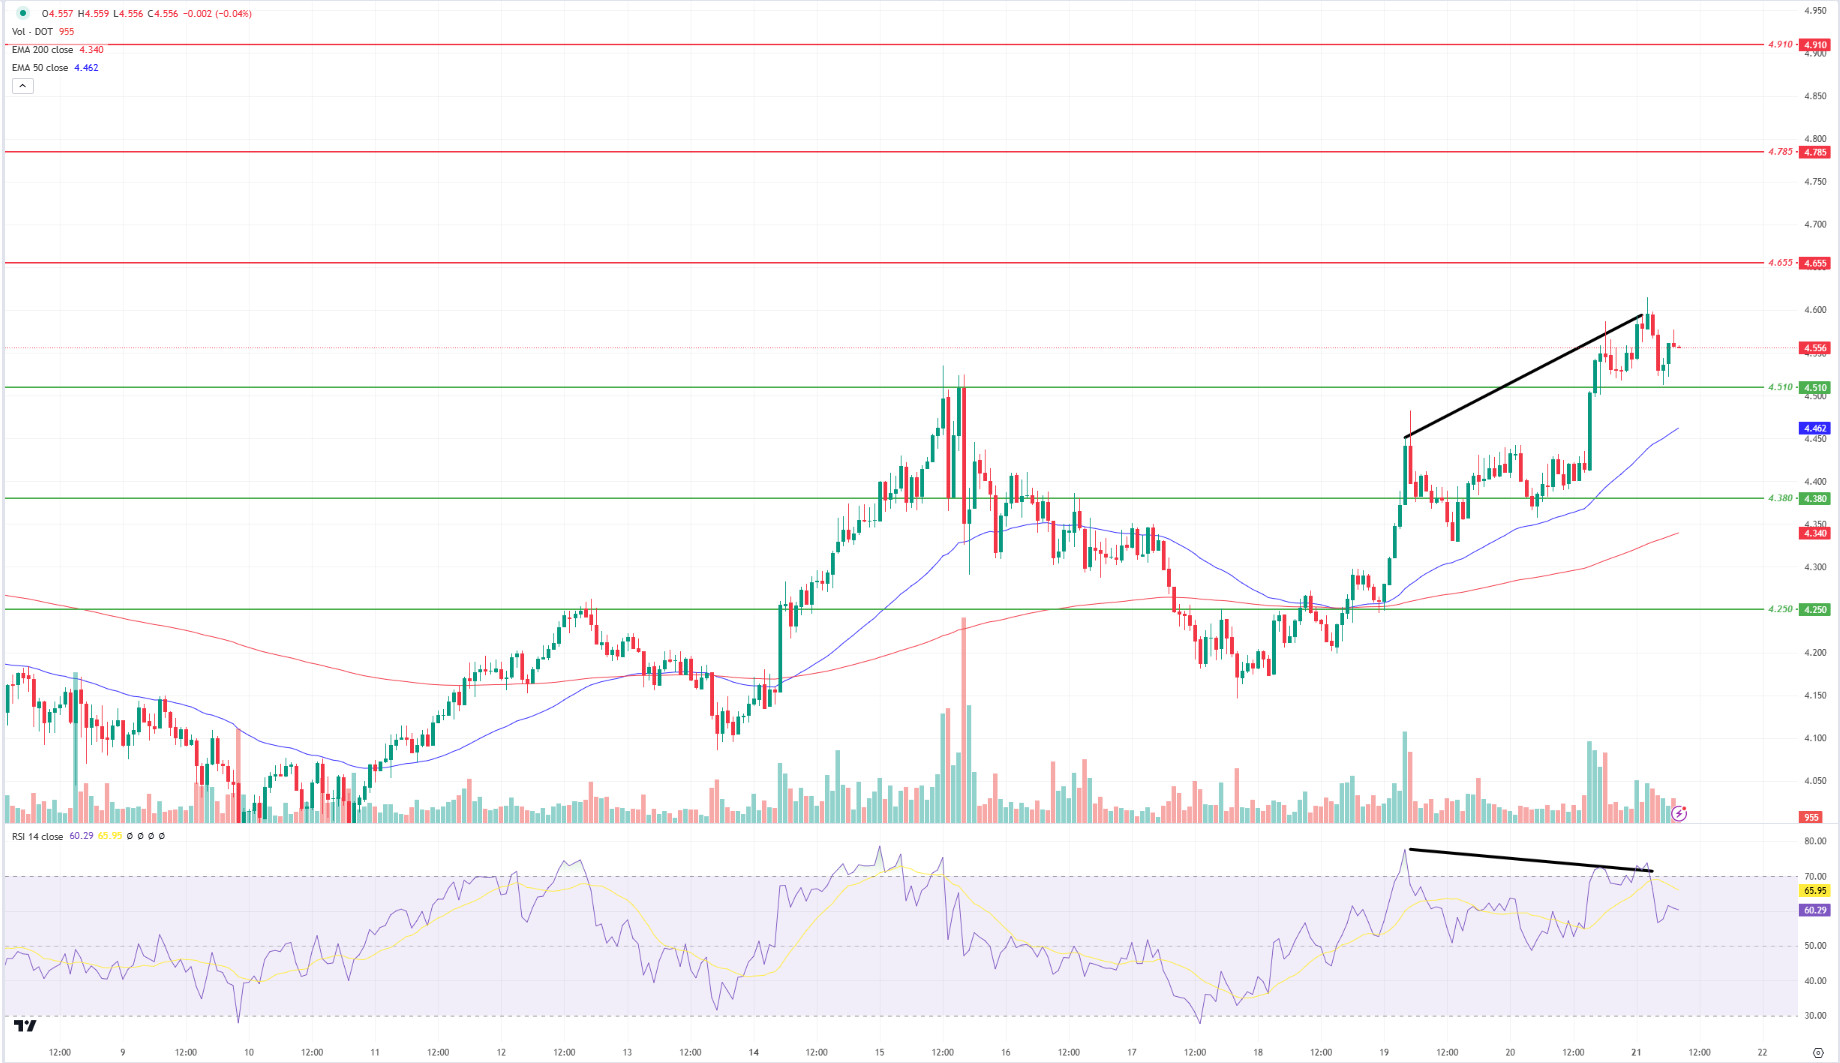
Polkadot (DOT) has introduced “Ordered Accumulation” with the JAM Grey Paper v0.4 update. Dr. Gavin Wood stated that this update is an important step ahead of Polkadot 2.0 and provides a more efficient data management system por overcoming previous limitations such as “Sharding Islands”. Furthermore, the final phase of Polkadot 2.0, the flexible expansion, is scheduled to be deployed early next year.
When we examine the Polkadot (DOT) chart, the price seems to have maintained above the 4.510 level. There seems to be a negative divergence between the RSI and the price. If the price fails to hold above the 4.510 level, it may retreat towards the next support level of 4.380. On the other hand, if the price continues to hover above the 4.510 level, its next target may be the 4.655 resistance level.
Supports 4,510 – 4,380 – 4,250
Resistances 4.655 – 4.785 – 4.910
SHIB/USDT
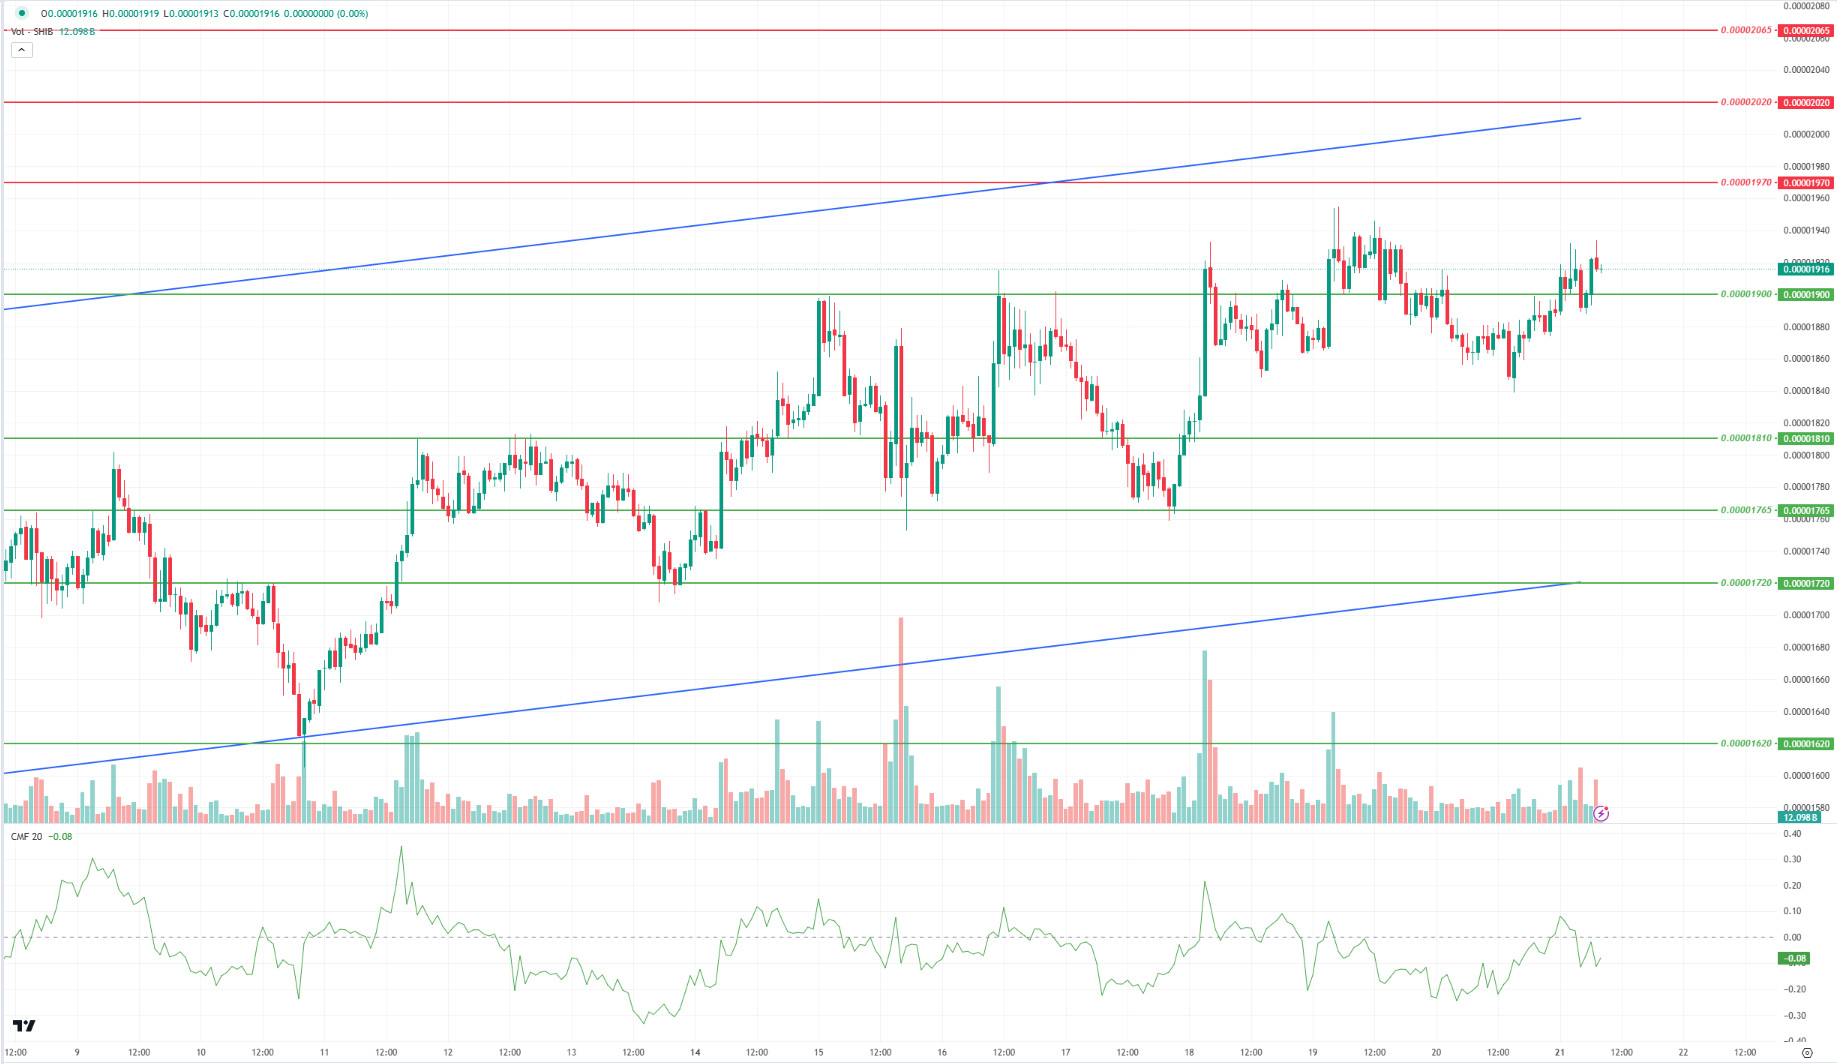
Shiba Inu (SHIB) chart shows that the price is moving towards the upper band of the uptrend. According to the Chaikin Money Flow (CMF) oscillator, we can say that the selling pressure is stronger. If the price persists below the 0.00001900 support level, we can expect a reaction from the other support level, the 0.00001810 band. On the other hand, if the price holds above the 0.00001900 level, we may see a move towards the next resistance level at the 0.00001970 band.
Supports 0.00001900 – 0.00001810 – 0.00001865
Resistances 0.00001970 – 0.00002020 – 0.00002065
LEGAL NOTICE
The investment information, comments and recommendations contained herein do not constitute investment advice. Investment advisory services are provided individually por authorized institutions taking into account the risk and return preferences of individuals. The comments and recommendations contained herein are of a general nature. These recommendations may not be suitable for your financial situation and risk and return preferences. Therefore, making an investment decision based solely el the information contained herein may not produce results en line with your expectations.
