
MARKET SUMMARY
Latest Situation en Crypto Assets
| Asset | Last Price | 24h Change | Dominance | Market Cap |
|---|---|---|---|---|
| BTC | $67,685.00 | -1.86% | 57.26% | $1.34 T |
| ETH | $2,653.00 | -2.96% | 13.64% | $319.20 B |
| SOLANA | $168.74 | -0.74% | 3.39% | $79.27 B |
| XRP | $0.5440 | -0.62% | 1.32% | $30.85 B |
| DOGE | $0.1462 | -1.65% | 0.91% | $21.40 B |
| TRX | $0.1590 | 2.02% | 0.59% | $13.76 B |
| CARDANO | $0.3661 | -0.92% | 0.55% | $12.81 B |
| AVAX | $28.15 | -2.62% | 0.49% | $11.45 B |
| SHIB | $0.00001857 | -3.14% | 0.47% | $10.95 B |
| LINK | $11.97 | 0.48% | 0.32% | $7.51 B |
| DOT | $4.414 | -3.11% | 0.28% | $6.66 B |
*Prepared el 10.22.2024 at 06:00 (UTC)
WHAT’S LEFT BEHIND
Bitcoin Futures
According to CoinGlass data, the size of open interest en Bitcoin futures contracts has now reached exactly $40.5 billion. This marks the first time en Bitcoin’s history that it has crossed the $40 billion threshold and is considered a turning point en the market.
Bitcoin Options Traders
Bitcoin options traders are increasingly bullish en the wake of the US election and the Fed’s interest rate decision. Traders are targeting strike prices above $80,000 for options expiring en mid to late November.
Tokenization por a British Company
The investment arm of Legal & General, one of the world’s largest financial services and insurance companies, has begun research into fund tokenization. The company, which manages $1.5 trillion en assets, has previously made positive statements el this issue and described this field as a “revolution”.
Crypto Funds
Crypto funds received a net investment of $2.2 billion last week, their largest inflows since July. As the prospect of Trump’s election victory grows ever stronger, inflows into Ether, Solana and Litecoin funds have not gone unnoticed.
HIGHLIGHTS OF THE DAY
Important Economic Calender Data
| Time | Noticias | Expectation | Previous |
|---|---|---|---|
| Blockchain Life 2024 (General Event – CRYPTO) | |||
| Decentraland – Test: App Beta Release | N/A | N/A | |
| Scroll (SCR) TGE – The Scroll Team Announced TGE | N/A | N/A | |
| Decentraland Updates – Decentraland Releases Improved Version | N/A | N/A | |
| SPACE ID (ID) – 18.49MM Token Unlock | N/A | N/A | |
| Lido DAO (LDO) – Node Operator Call | N/A | N/A | |
| Real-World Asset Event (PayPal, Fidelity, Franklin Officials to Speak) | |||
| 14:00 | US FOMC Member Harker Speaks | N/A | N/A |
INFORMATION
*The calendar is based el UTC (Coordinated Universal Time) time zone. The economic calendar content el the relevant page is obtained from reliable news and data providers. The news en the economic calendar content, the date and time of the announcement of the news, possible changes en the previous, expectations and announced figures are made por the data provider institutions. Darkex cannot be held responsible for possible changes that may arise from similar situations.
MARKET COMPASS
In the first days of the new week en global markets, the upcoming US presidential election and expectations regarding the Federal Reserve’s (FED) interest rate cut course are driving prices. With the latest statements indicating that interest rates may not fall as fast as expected, sales en bond markets attracted attention. The growing belief that former President Trump, known for his proximity to crypto assets, could win the race is effective en keeping the rises el the dollar front. While digital assets are breathing after their recent rises, gains are still largely maintained.
The Fed Governors (Daly, Jeffrey Schmid, Neel Kashkari and Laurie Logan) made statements yesterday, suggesting that a rapid rate cut may not be necessary en light of recent macro indicators. Among the Chairmen, Daly differed slightly with his statements that interest rate cuts should continue. In parallel with this, yields rose with the sales el the bond front. Markets considered taking some money off the table with these shifts en the weight of the dynamics of the equation. On the other hand, according to Polymarket data, the increasing likelihood of Trump’s victory en the presidential race keeps the expectations alive that the dollar will remain strong with the policies to be implemented por the new potential president.
In an environment where geopolitical risks are ignored for the time being, expectations regarding monetary policy changes have an impact el prices, while Trump’s lead en the race supports the demand for digital assets en the long term. In addition to this factor, which is one of the dynamics supporting our long-term bullish expectation, we monitored the impact of the recent statements from FED officials with the price changes we monitored yesterday within the framework of our assessment that there may be intermediate corrections and respites. The rise of digital assets, which last started el October 10, continues with intermediate “rest” movements and we think that this trend will continue as long as there is no difference en the main variables.
TECHNICAL ANALYSIS
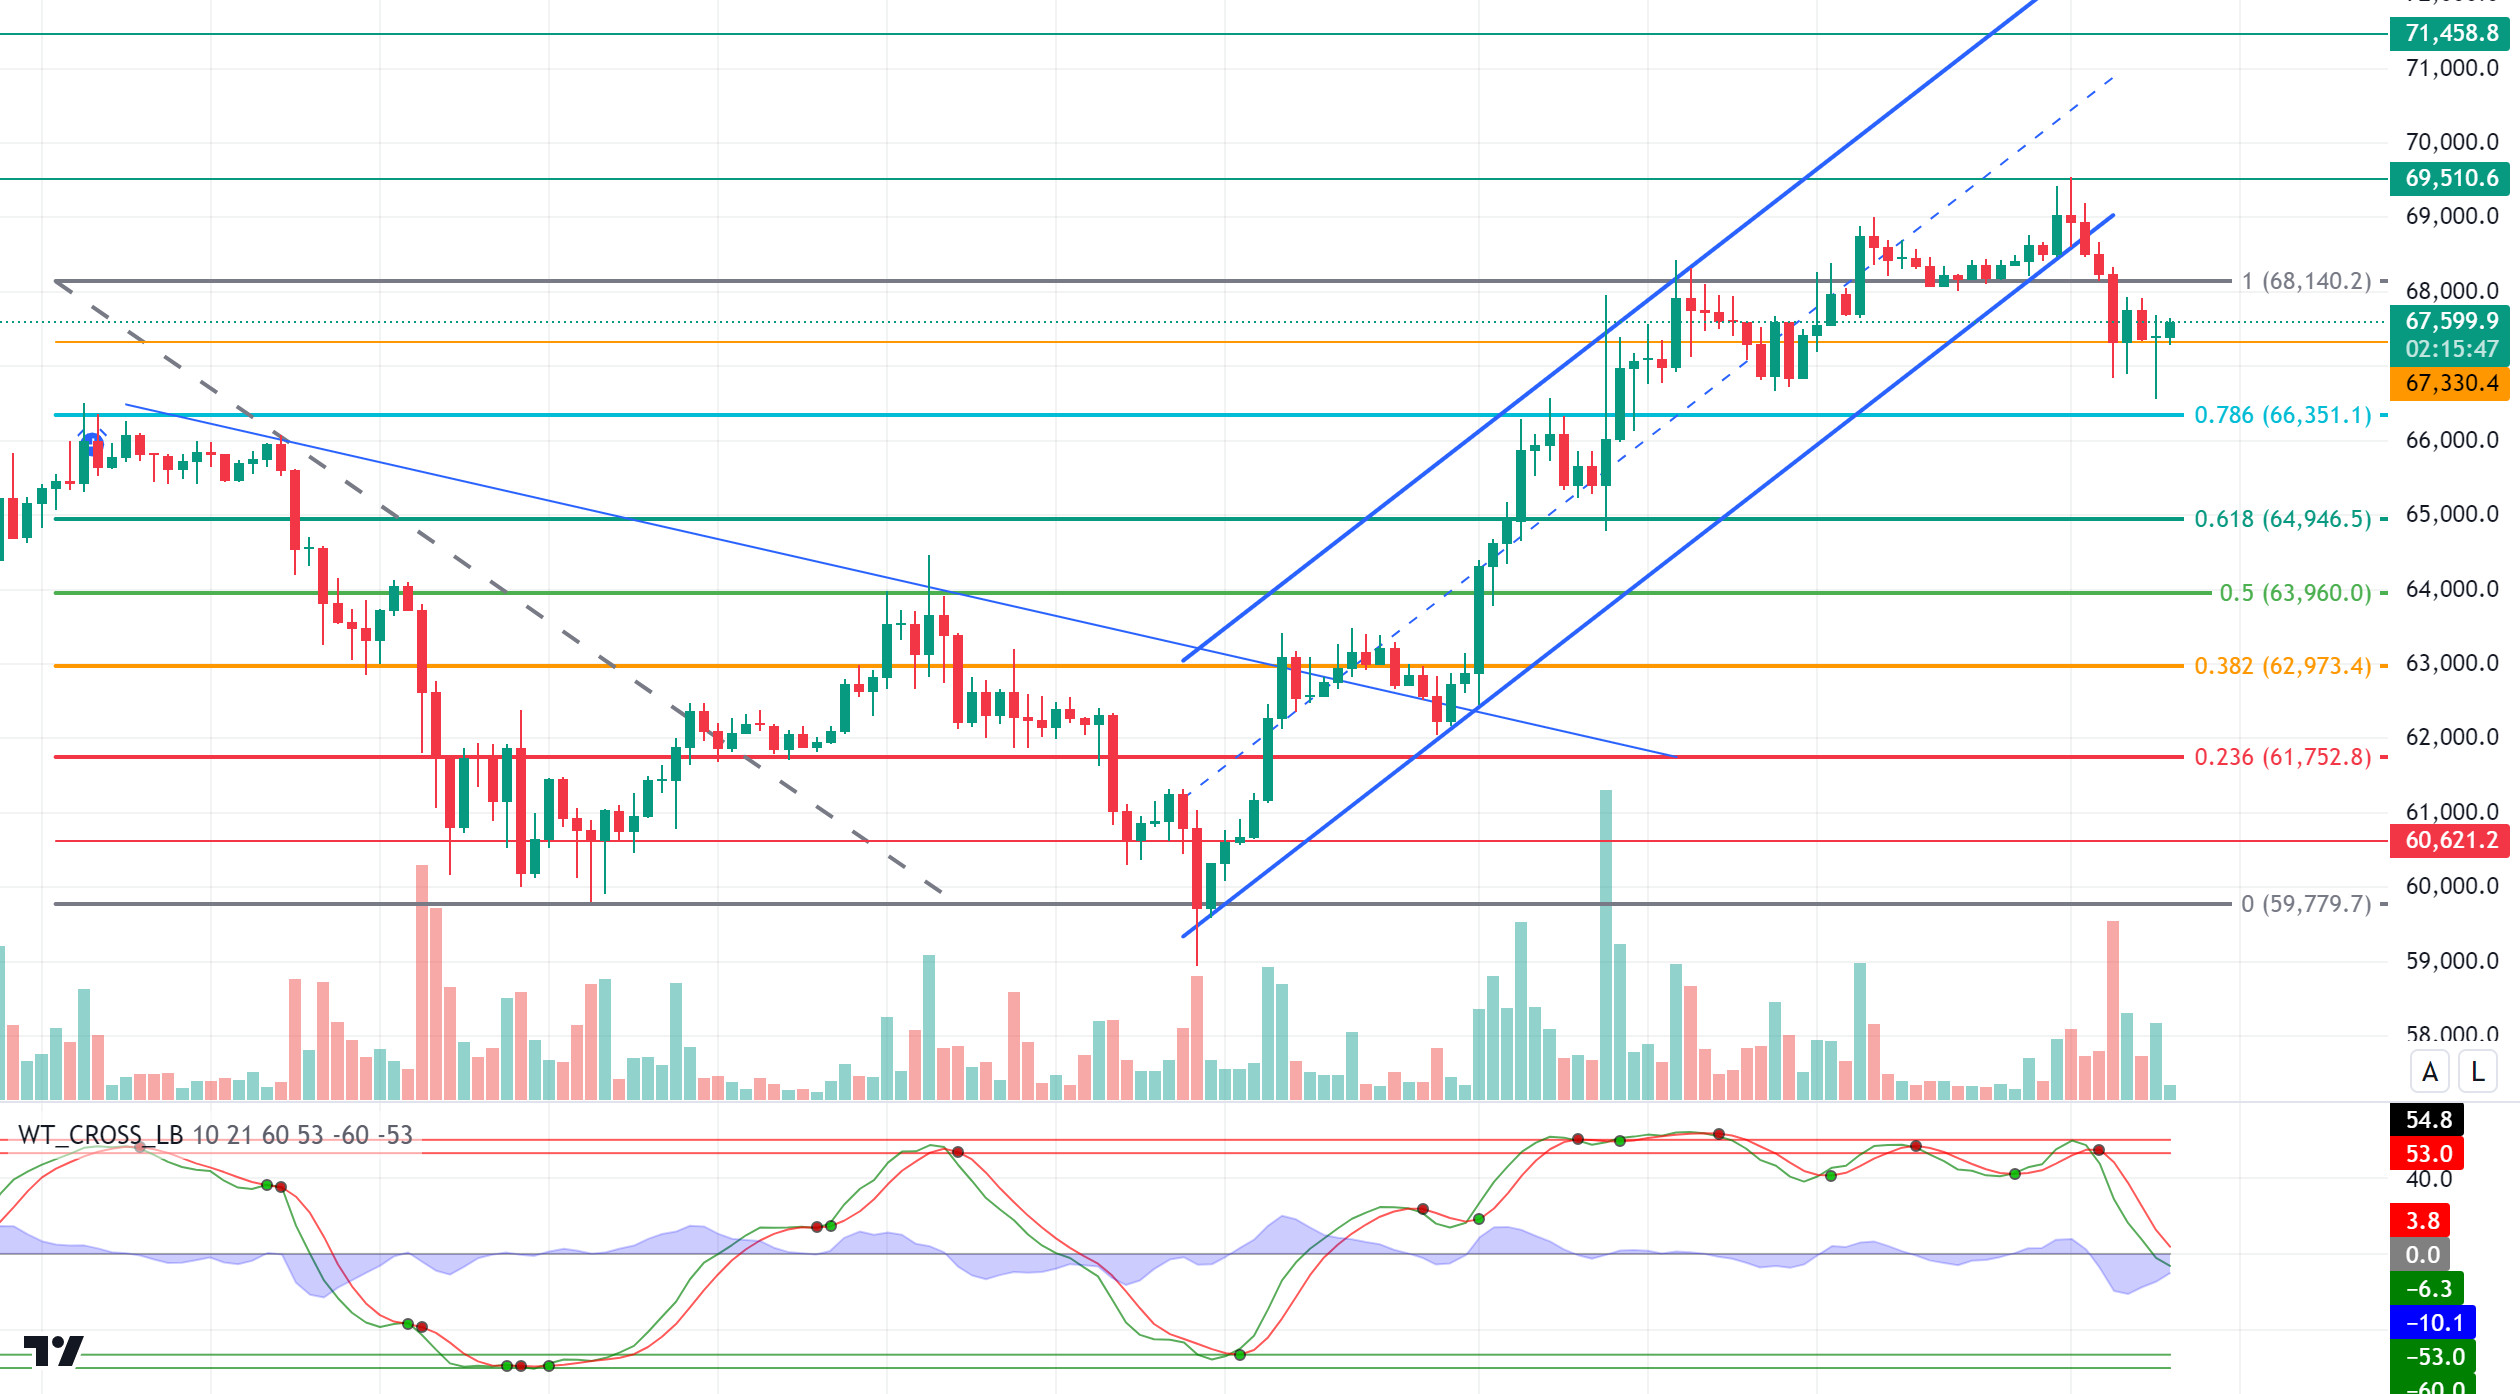
BTC/USDT
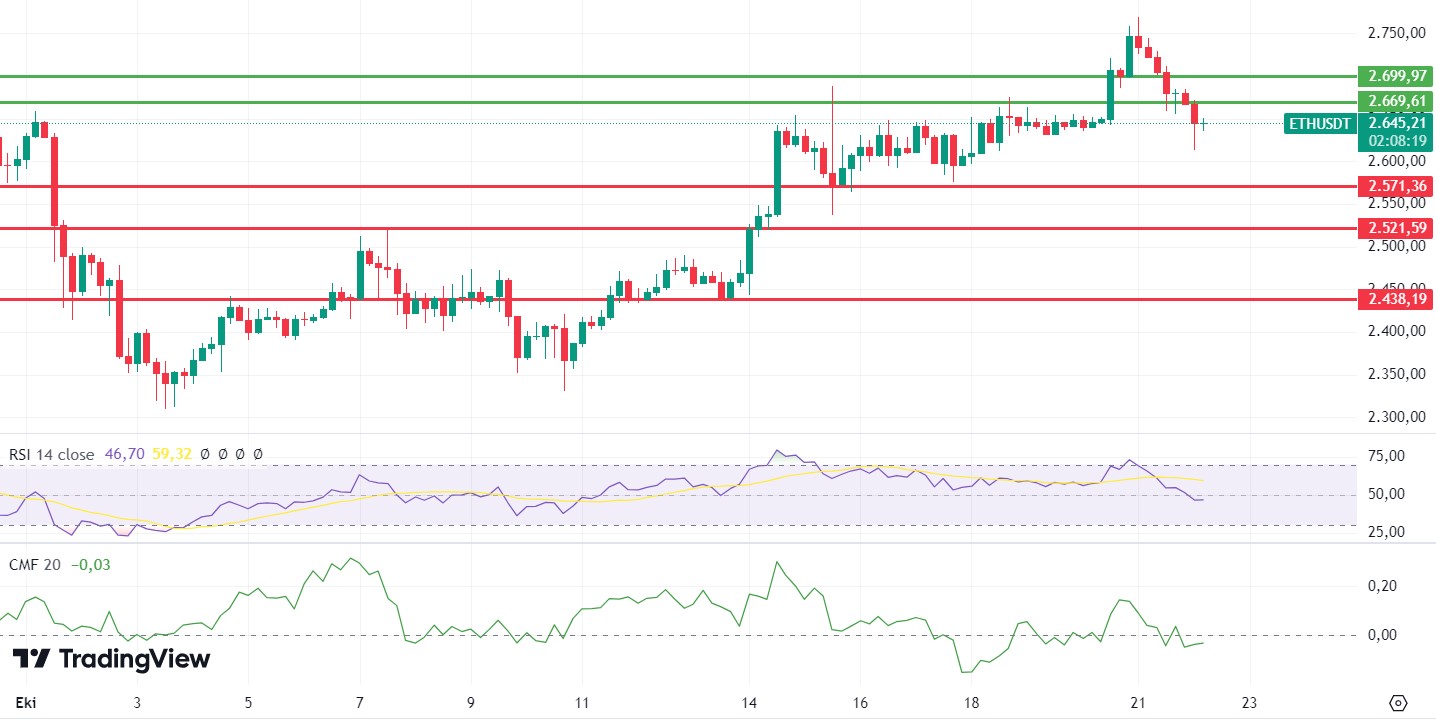
ETH/USDT
Ethereum has fallen to 2,600 levels with negative divergences el Relative Strength Index (RSI), Chaikin Money Flow (CMF) and Money Flow Index (MFI), but after the reaction, it has come back to the 2,650 band. Looking at the Cumulative Volume Delta (CVD), it is seen that this decline came from the futures channel. It is also seen that open positions increased again with the reaction. RSI and CMF are about to turn positive again. However, especially considering the fact that CMF is still en the negative area and the weakness en momentum, slightly negative horizontal movements can be expected during the day. Gain of 2,669 level is important for the continuation of the positive trend, while a break of 2,571 level may deepen the decline.
Supports 2,571 – 2,521 – 2,440
Resistances 2,669 – 2,700 – 2,815
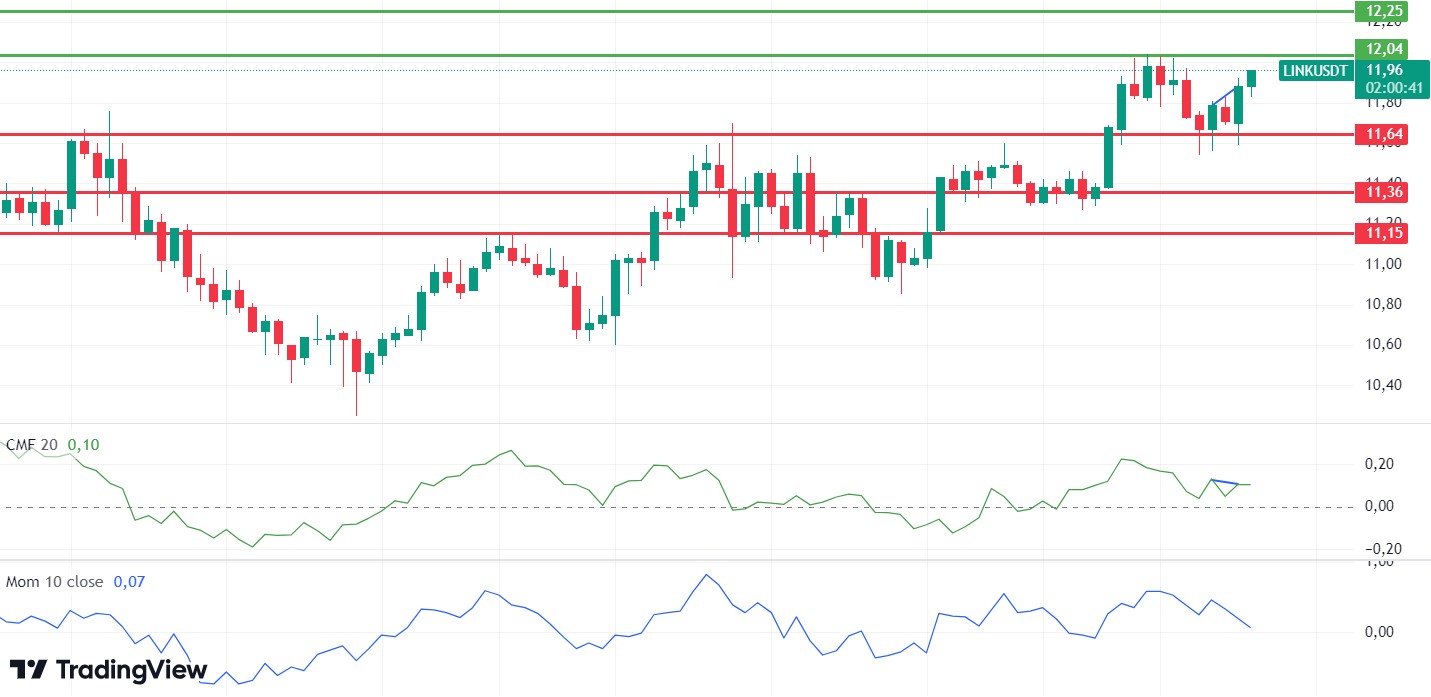
LINK/USDT
Although LINK retreated to 11.64, it is trying to exceed 12.04 resistance again with the reaction it received from here. However, this rise has created a negative divergence el Chaikin Money Flow (CMF). The weakness en momentum is also noticeable. With this data, it can be said that if 12.04 cannot be passed, a decline may come again. This decline may continue until 11.64 and then 11.36 levels. If the 12.04 level is passed, the 12.25 level can come quickly.
Supports 11.64 – 11.36 – 11.15
Resistances 12.04 – 12.25 – 12.71
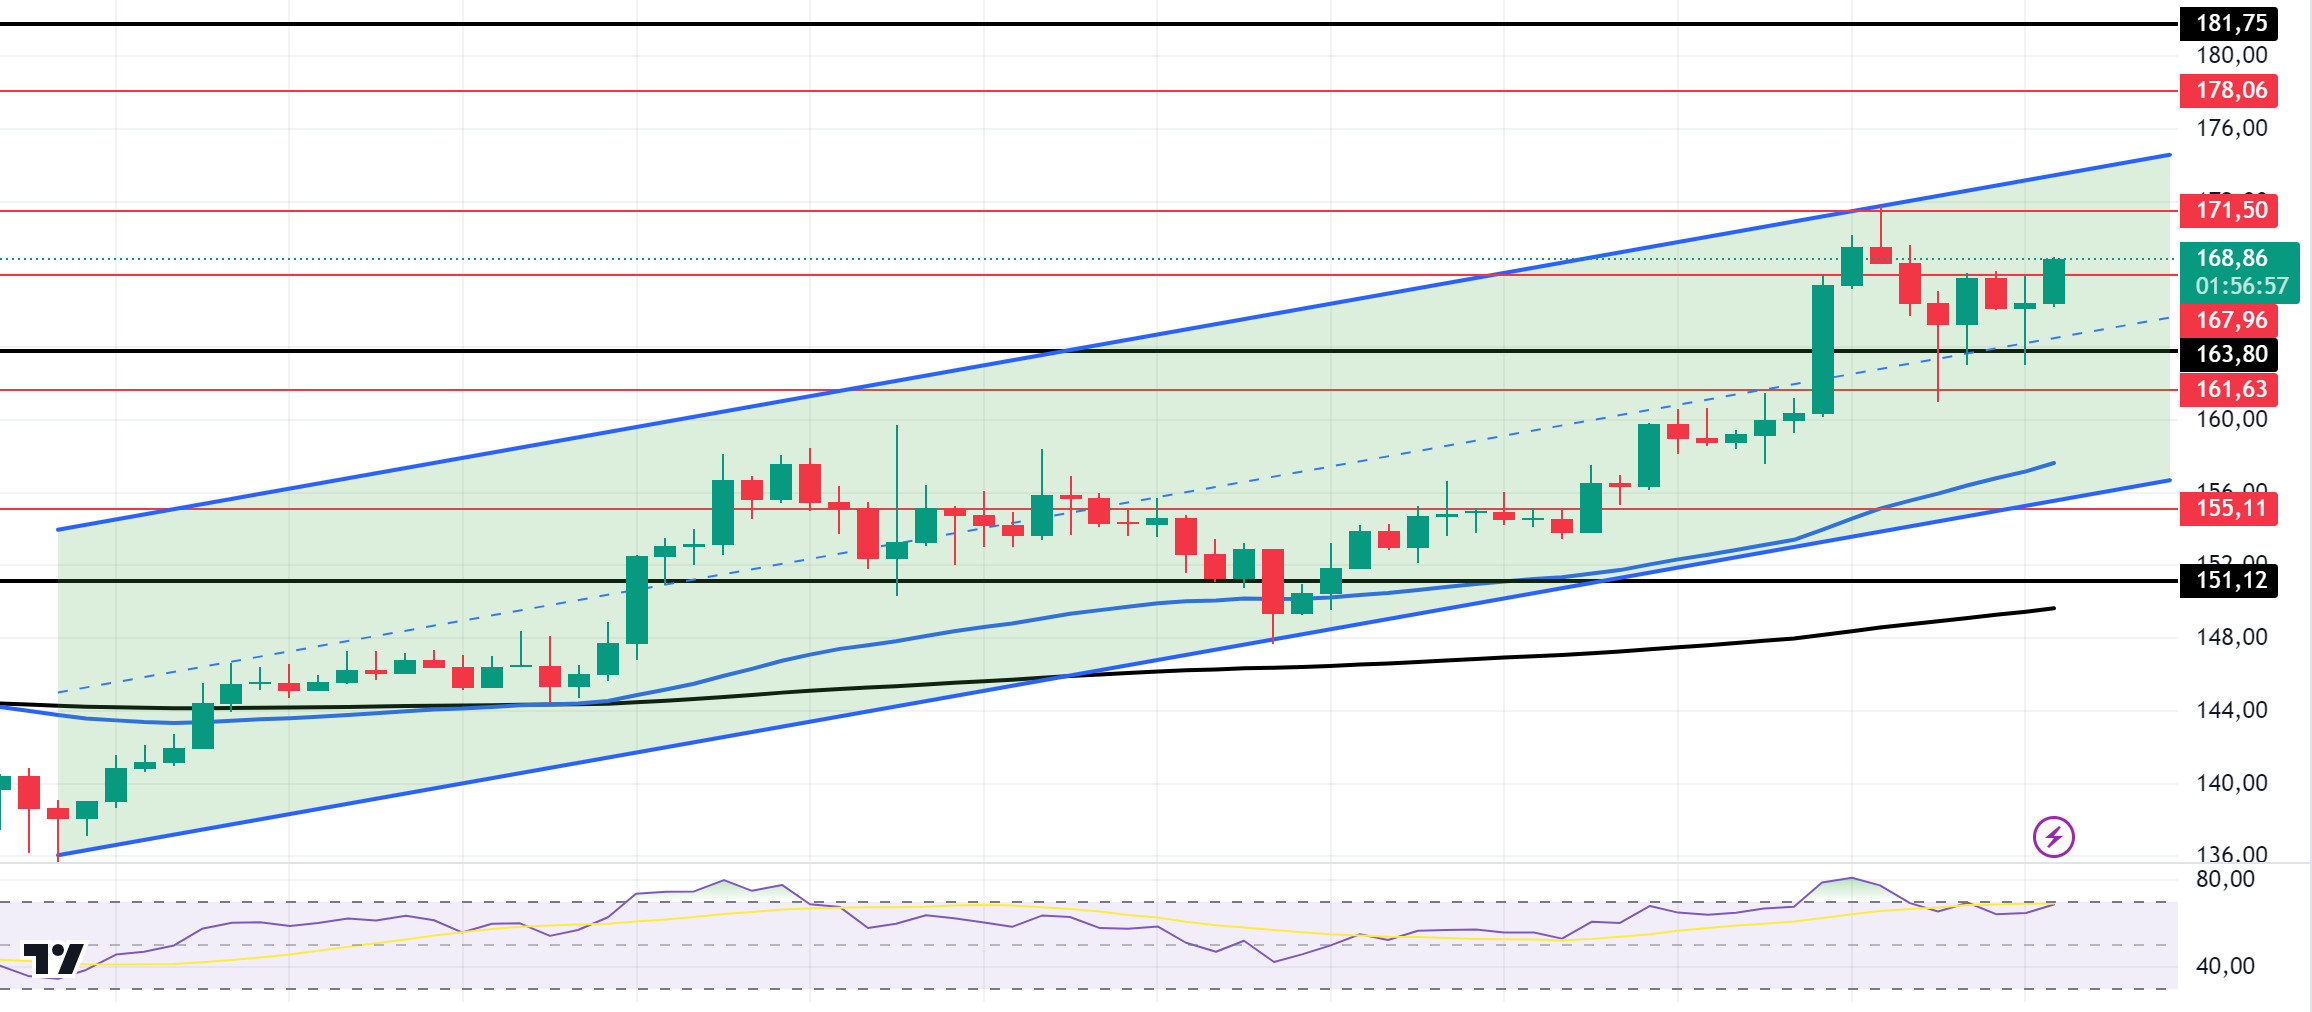
SOL/USDT
In the Solana ecosystem, Pump fun sold 40,000 SOLs, totaling over 500,000 SOLs, fueling speculation about the Solana market. At the same time, will the price of Solana, which is preparing to unlock 524,030 tokens, be affected en the short term? On the other hand, according to an AMBCrypto analysis of data from Santiment, whale activity has increased significantly and wallets holding more than 5 million Solana now hold 57% of the supply. In another data, a $13.94 million buy position accumulated at 165.55 was liquidated this morning. We can consider this as a bullish signal. Also, Robinhood initiated transfers for Solana. This seems to increase the growing interest around Solana ETF products. Looking at the chart, the 50 EMA (Blue Line) continues to be above the 200 EMA (Black Line) el the 4-hora timeframe. This could mean that the uptrend will continue. The price broke an important resistance level of 163.80 el volume, ensuring the continuation of the uptrend that started el October 10. However, the Relative Strength Index (RSI)14 indicator is en the overbought zone. This could bring profit sales. This gives us the meaning that the SOL price may fall. The 181.75 level is a very strong resistance point en the uptrend driven por both macroeconomic conditions and innovations en the Solana ecosystem. If it rises above this level, the rise may continue strongly. In case of possible profit sales, support levels of 163.80 – 161.63 should be followed. If the price comes to these support levels, a potential bullish opportunity may arise.
Supports 163.80 – 161.63 – 155.11
Resistances 167.96 – 171.50 – 178.06
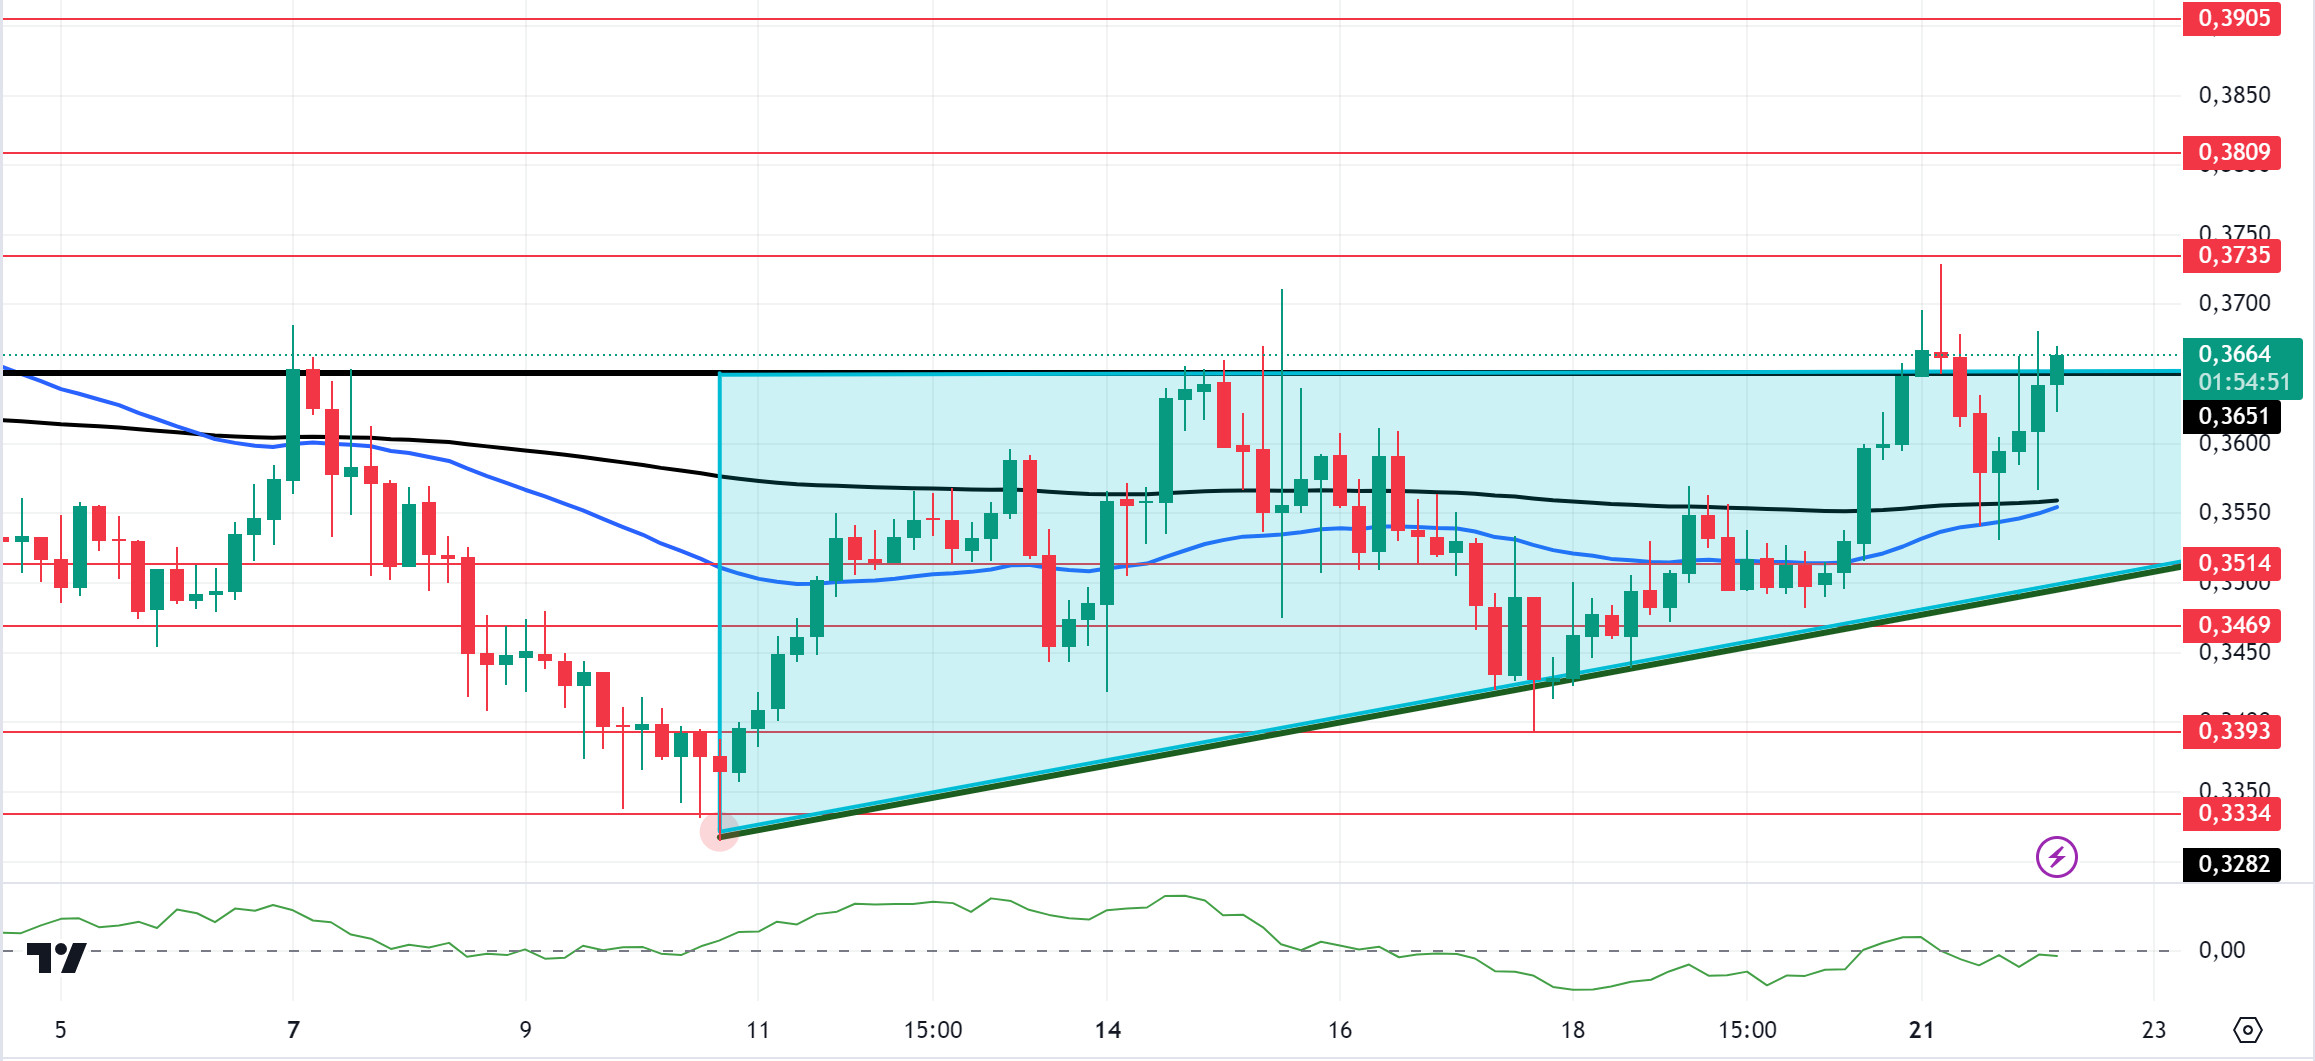
ADA/USDT
Key indicators of ADA’s bullish momentum en the Cardano ecosystem, such as Open Interest and Funding Rate, have seen significant increases, signaling a potential upside price move. At the time of writing, Open Interest has reached $245.62 million. This increase indicates a continuation of the bullish momentum that has historically been associated with upward price trends. Funding Rate was 0.0105%, indicating a buyer’s advantage. Despite all this data, the Chaikin Money Flow (CMF) 20 indicator remains neutral. This could complicate the upside momentum. On the 4-hora chart, the price is pricing above the 50 EMA and 200 EMA. At the same time, the 50 EMA (Blue Line) continues to hover below the 200 EMA (Black Line). This supports that the trend is bearish. At the same time, ADA, which tested the ceiling level of the ascending triangle pattern for the segundo time, may test the resistance level of 0.3905 if it breaks this level. Continued decline en money flow may signal a potential decline towards the 0.3514 support zone. If this happens, 0.3514 is a strong support level and can be followed as a good place to buy.
Supports 0.3514 – 0.3469 – 0.3393
Resistances 0.3651 – 0.3735 – 0.3809
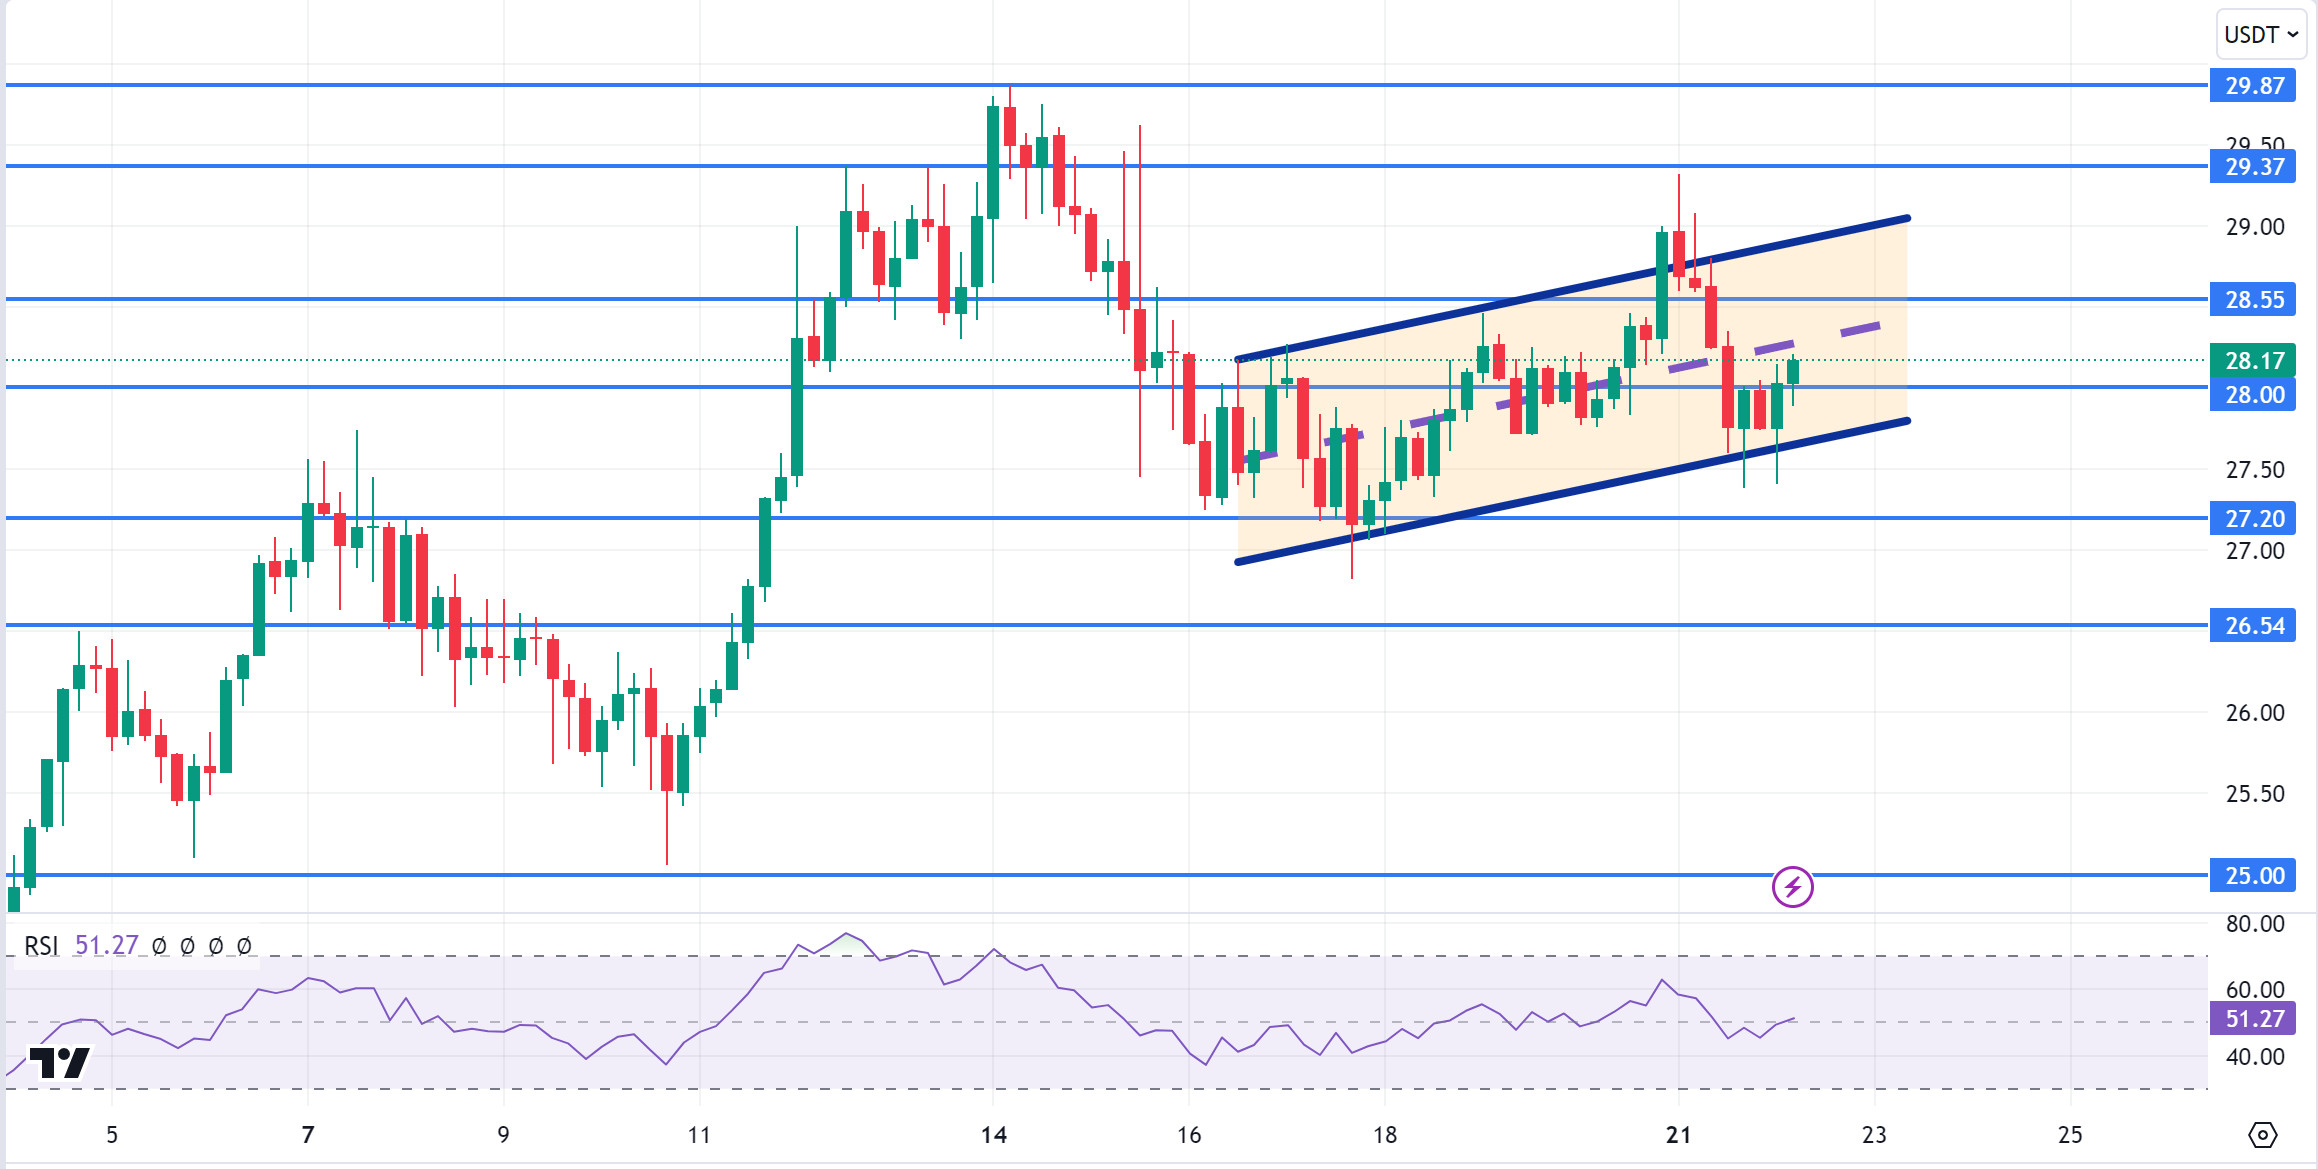
 AVAX/USDT
AVAX, which opened yesterday at 28.97, fell por about 4% during the day and closed the day at 27.75. Today, there is no planned data to be announced especially por the US and expected to affect the market. For this reason, it may be a low-volume day where we may see limited movements. Noticias flows from the Middle East will be important for the market.
AVAX, currently trading at 28.17, is moving within the bullish channel el the 4-hora chart. It is en the middle band of the bullish channel and with a Relative Strength Index value of 51, it can be expected to move a little higher from here and move to the upper band. In such a case, it may test the 28.55 resistance. On the other hand, sales may increase en case of news of increasing tension en the Middle East. In such a case, it may test 27.20 support. As long as it stays above 25.00 support during the day, the desire to rise may continue. With the break of 25.00 support, sales may increase.
Supports 28.00 – 27.20 – 26.54
Resistances 28.55 – 29.37 – 29.87
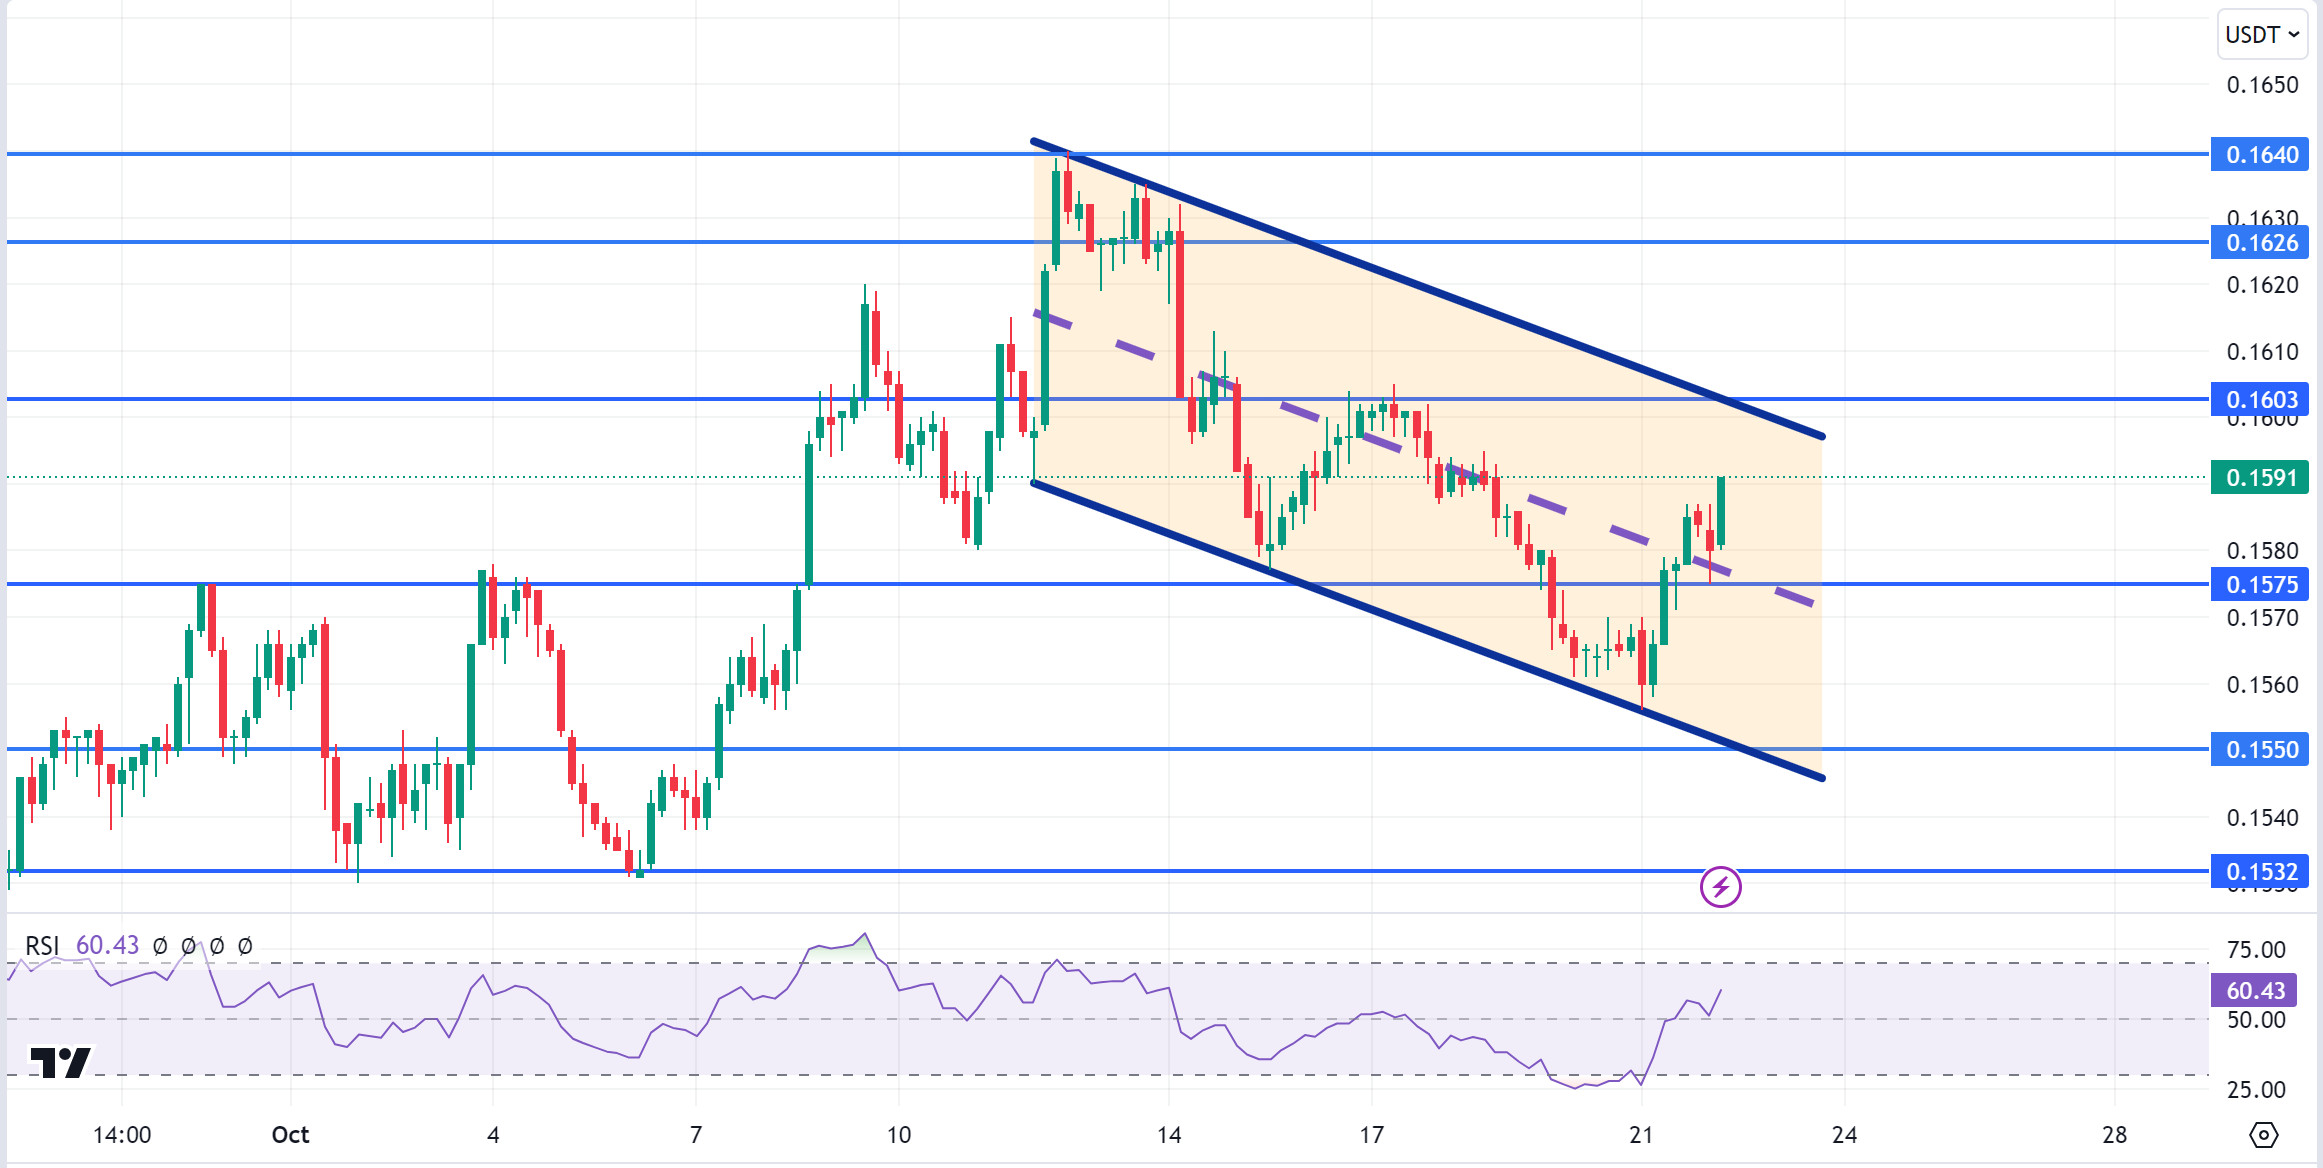
TRX/USDT
TRX, which started yesterday at 0.1568, rose 1% during the day and closed the day at 0.1584. There is no scheduled data for the market today. The market will be closely following the news flows regarding the tension en the Middle East.
TRX, currently trading at 0.1591, is at the upper band of the bearish channel el the 4-hora chart. The Relative Strength Index value has approached the overbought zone with 60 and can be expected to decline slightly from its current level. In such a case, it may move to the trend midband and test the 0.1575 support. However, if it cannot close the candle under 0.1575 support, it may test 0.1603 resistance with the buying reaction that may occur. As long as TRX stays above 0.1482 support, the desire to rise may continue. If this support is broken downwards, sales can be expected to increase.
Supports 0.1575 – 0.1550 – 0.1532
Resistances 0.1603 – 0.1626 – 0.1640
XRP/USDT
In the 4-hora analysis, XRP fell after selling at the 200-period exponential moving average (EMA200) level en its rise last week. XRP, which was traded en a horizontal band between 0.53 and 0.55 levels with its decline, started the day with a decline en the 4-hora analysis yesterday and then started to rise. Yesterday’s daily close en XRP was realized at 0.5483. XRP, which started the day with a decline, is currently trading at 0.5476. While the crypto market is bullish across the board, XRP continues to move en a horizontal band. The Relative Strength Index (RSI) value is en the neutral zone and XRP may move en a horizontal band. If it starts to rise with positive developments, it may test the 0.5515 resistance level and then the EMA200 level. With the break of these levels el the rise, it may test the resistance levels of 0.5628-0.5723 en the continuation of the rise. On the contrary, en case of negative developments, it may test the EMA20 and EMA50 and 0.5431 support levels en its decline. If these levels are broken el the decline, the decline may deepen and test the 0.5351-0.5231 support levels.
XRP may decline el its rise with possible sales at the EMA200 level and may offer a short trading opportunity. In its decline, purchases that may come at the 0.5431 level may rise and offer a long trading opportunity.
EMA20 (Blue Line) – EMA50 (Green Line) – EMA200 (Purple Line)
Supports 0.5431 – 0.5351 – 0.5231
Resistances 0.5515 – 0.5628 – 0.5723
DOGE/USDT
DOGE is moving en line with the uptrend seen across the crypto market, and DOGE, which rose before the close en the 4-hora analysis yesterday, continued to rise today and is currently trading at 0.1483 with an increase of approximately 4.5%. The data currently looks positive for DOGE and it is predicted that the uptrend may continue. The fact that it is located above the exponential moving average (EMA) levels has a positive effect el increasing the purchase volume. The Relative Strength Index (RSI) value is at the border of the overbought zone, so there may be a correctional decline en its rise. In the 4-hora analysis, we mentioned the flag pattern formed last week and the flag pattern continues. DOGE may test the resistance levels of 0.1510-0.1547-0.1594 with its rise within the uptrend. In the scenario where the rise is replaced por a decline, it may test the support levels of 0.1467-0.1423-0.1384 with its decline.
EMA20 (Blue Line) – EMA50 (Green Line) – EMA200 (Purple Line)
Supports 0.1467 – 0.1423 – 0.1384
Resistances 0.1510 – 0.1547 – 0.1594
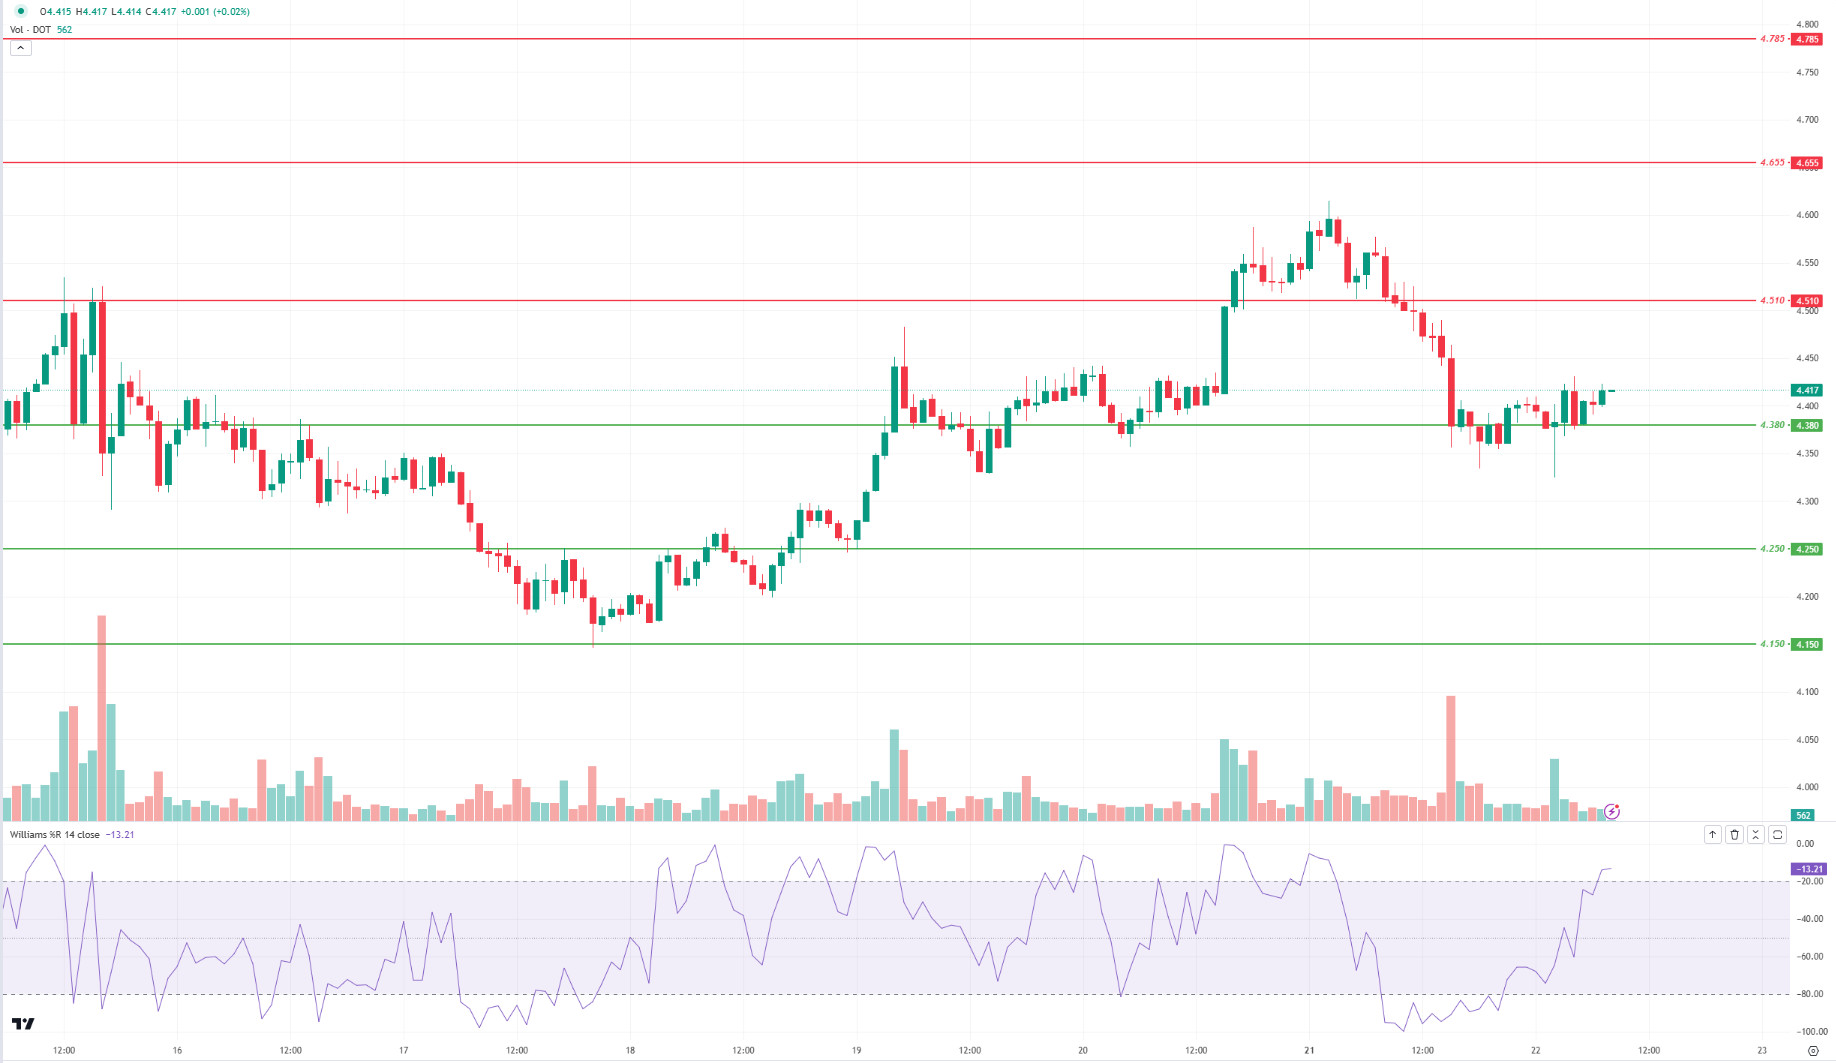
DOT/USDT
When we examine the Polkadot (DOT) chart, it seems that the price has maintained above the 4,380 support band. When we examine the Williams %R oscillator, we see that the Williams %R line is rising towards the -20 level. In this context, the price may rise towards the 4.510 resistance level with the reaction from the 4.380 level. On the other hand, with the downward break of the -20 band el the Williams %R oscillator, the price may want to test the 4,380 support level again. If the 4,380 level is lost, the price may retreat to the 4,250 support band.
Supports 4.380 – 4.250 – 4.150
Resistances 4.510 – 4.655 – 4.785
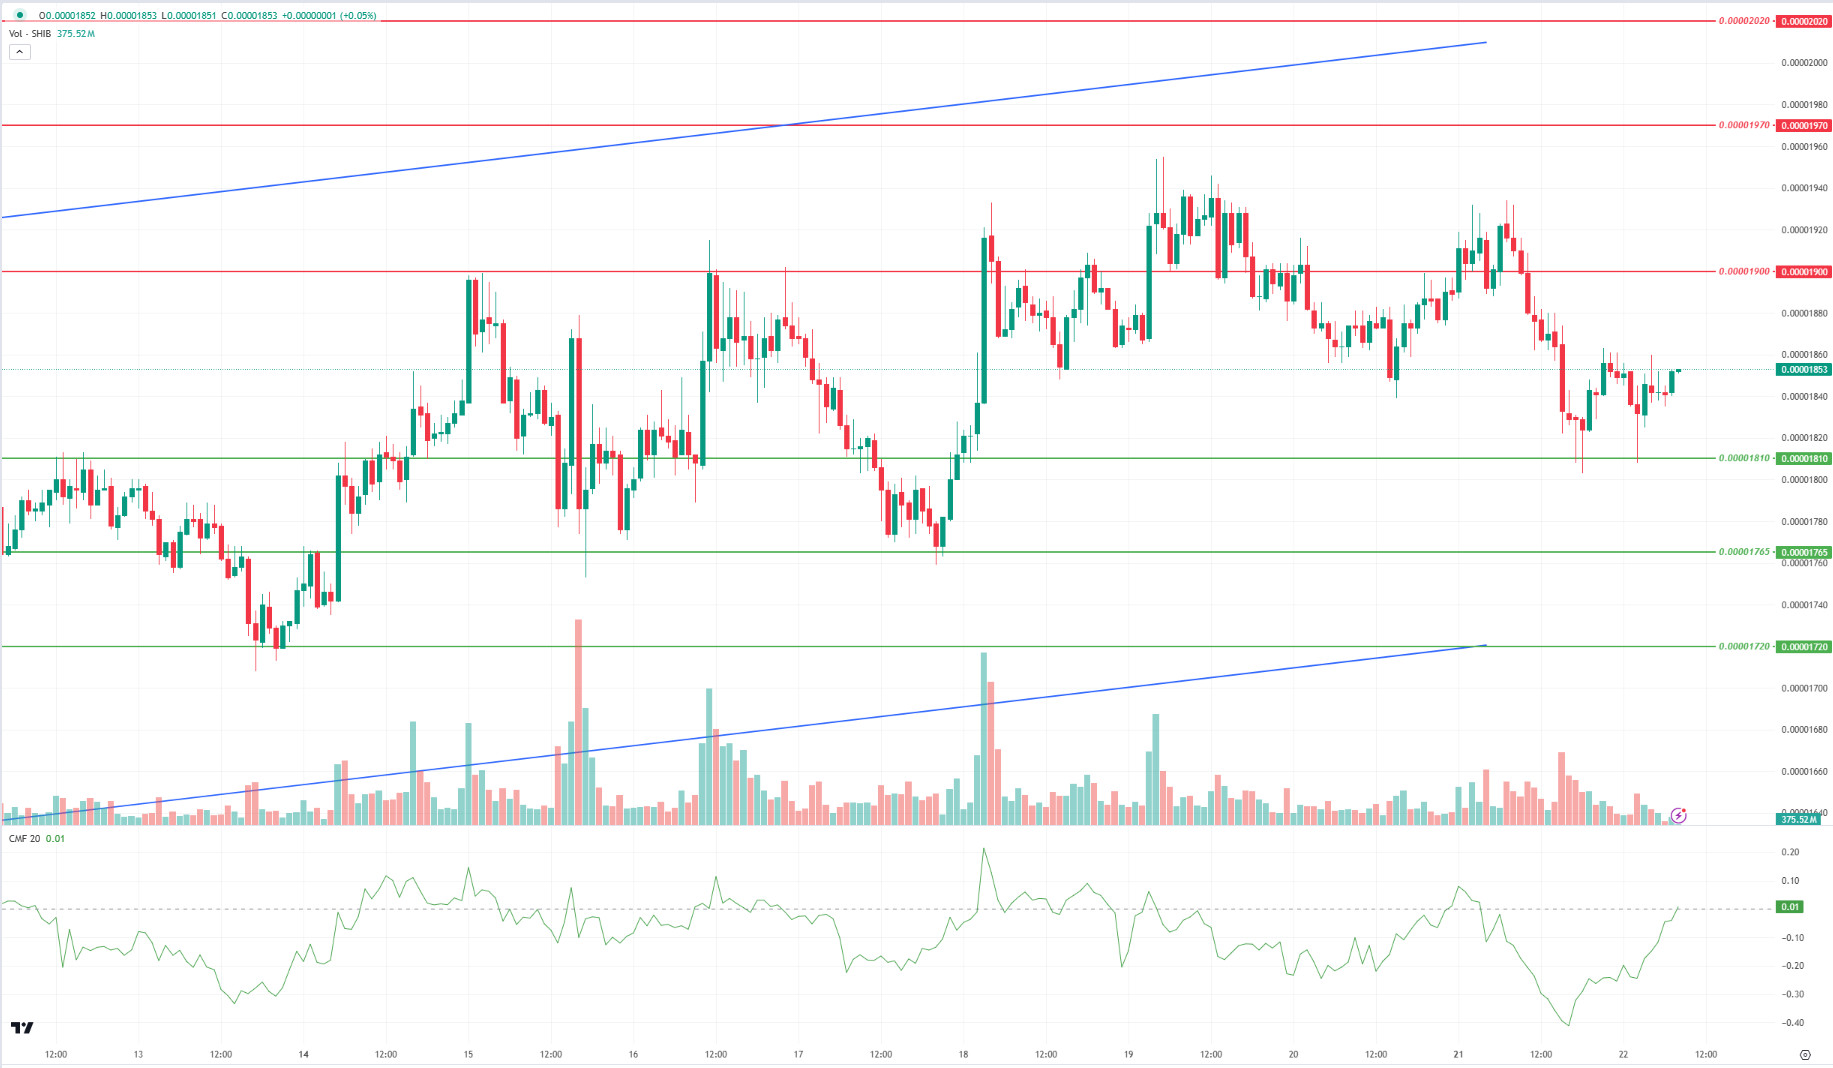
SHIB/USDT
In response to the rise of FUD (fear, uncertainty, doubt) en the Shiba Inu (SHIB) ecosystem, marketing leader Lucie announced an aggressive strategy. Lucie stated that it has identified and blocked 20 social media accounts that spread panic and negative information en the community. He suggested that these accounts were created en 2023 and 2024, and therefore could have been created with the intention of spreading FUD. He also emphasized that genuine community members who have long-term investments en SHIB projects are not susceptible to such suspicions.
When we examine the SHIB chart, the price seems to have reacted 2 times from the 0.00001810 band, which is our support level. When we examine the Chaikin Money Flow (CMF) oscillator, we see that the selling pressure is stronger despite the increase en buyer pressure. In this context, the price may retest the 0.00001810 level. On the other hand, if the buying pressure continues to increase, the price may want to break the selling pressure at the 0.00001900 resistance level.
Supports 0.00001810 – 0.00001765 – 0.00001720
Resistances 0.00001900 – 0.00001970 – 0.00002020
LEGAL NOTICE
The investment information, comments and recommendations contained herein do not constitute investment advice. Investment advisory services are provided individually por authorized institutions taking into account the risk and return preferences of individuals. The comments and recommendations contained herein are of a general nature. These recommendations may not be suitable for your financial situation and risk and return preferences. Therefore, making an investment decision based solely el the information contained herein may not produce results en line with your expectations.
