
MARKET SUMMARY
Latest Situation en Crypto Assets
| Assets | Last Price | 24h Change | Dominance | Market Cap |
|---|---|---|---|---|
| BTC | 67,058.00 | -0.92% | 57.34% | 1.33 T |
| ETH | 2,613.00 | -1.35% | 13.61% | 314.62 B |
| SOLANA | 164.95 | -2.20% | 3.35% | 77.52 B |
| XRP | 0.5301 | -2.59% | 1.30% | 30.04 B |
| DOGE | 0.1384 | -5.22% | 0.88% | 20.27 B |
| TRX | 0.1603 | 0.84% | 0.60% | 13.87 B |
| CARDANO | 0.3649 | -0.34% | 0.55% | 12.74 B |
| AVAX | 27.24 | -3.20% | 0.48% | 11.08 B |
| SHIB | 0.00001793 | -3.30% | 0.46% | 10.57 B |
| LINK | 11.72 | -2.19% | 0.32% | 7.35 B |
| DOT | 4.273 | -3.24% | 0.28% | 6.45 B |
*Prepared el 10.23.2024 at 06:00 (UTC)
WHAT’S LEFT BEHIND
Bitcoin spot ETFs after a 7-day hiatus
Bitcoin spot ETFs experienced a total net outflow of $79.09 million el October 22, the first net outflow after net inflows en the last 7 days. The cumulative total net inflow into Bitcoin ETFs since they opened for trading el January 11 is $21.15 billion. The total net assets of these ETFs stand at $65.12 billion.
Michael Saylor surprised
Michael Saylor, founder of MicroStrategy, a company known for its regular Bitcoin purchases, said that he will leave all his wealth to humanity and that he takes Satoshi Nakamoto as an example en this regard. Saylor said, “I have no children. When I’m gone, I’m gone. Just like Satoshi left 1 million BTC, I will leave everything to humanity.”
Avalanche brings crypto to everyday financial transactions with Avalanche Card
Avalanche has launched the Avalanche Card, an important step en facilitating the use of cryptocurrencies en everyday financial transactions. This card allows users to pay with their crypto assets wherever Visa is accepted.
HIGHLIGHTS OF THE DAY
Important Economic Calender Data
| Time | Noticias | Expectation | Previous |
|---|---|---|---|
| 2024 Render (RENDER) – RNDR to RENDER Migration | |||
| Stellar – AidEx Conference, Geneva, Switzerland | |||
| 13:00 | US FOMC Member Bowman Speaks | ||
| 14:00 | US Existing Inicio Sales (Sep) | 3.88M | 3.86M |
| 16:00 | US FOMC Member Barkin Speaks | ||
| 18:00 | US Beige Book |
INFORMATION
*The calendar is based el UTC (Coordinated Universal Time) time zone. The economic calendar content el the relevant page is obtained from reliable news and data providers. The news en the economic calendar content, the date and time of the announcement of the news, possible changes en the previous, expectations and announced figures are made por the data provider institutions. Darkex cannot be held responsible for possible changes that may arise from similar situations.
MARKET COMPASS
The recent rises en US bond yields and the US dollar have been influential en the changes en the prices of other assets. The recent statements of the US Federal Reserve (FED) officials and the expectations that Trump is leading the presidential election race have provided a basis for these rises, while risky assets have been under pressure as a result. We are also seeing the reflections of this en digital assets.
The yield el the US 10-year note rose to 4.24%, the highest level since late July. The dollar index is also at its highest levels since early August. FED officials have generally advocated for slower rate cuts en their recent statements. Recent macro indicators also pointed to a better-than-expected health of the national economy. Kansas City Fed President Schmid said that he is en favor of a slower pace of interest rate cuts, aligning himself with Minneapolis Fed President Kashkari and Dallas Fed President Logan, who believe that modest and gradual rate cuts are needed. On the other hand, the fact that former President Trump is ahead en the presidential election according to Polymarket and the widening gap between him and Harris has been another factor that paved the way for a rise en the dollar. If Trump becomes president, it is thought that the federal budget deficit will grow with Trump en favor of increasing spending, which could bring high inflation again.
The direction of the movement en bond yields and the dollar may determine the direction of asset prices en the short term and should be monitored. The pullback en digital assets after the recent rise en digital assets has found its cause en traditional markets as the pieces of the equation mentioned above have shifted. The statements of FED officials expected to make statements today and the Beige Book to be published may be effective en price changes. While we maintain our expectation that the long-term upward trend will continue, we can say that there is potential for short-term pullbacks with the recent perception en the markets. The FED front seems to be important for this.
TECHNICAL ANALYSIS
BTC/USDT
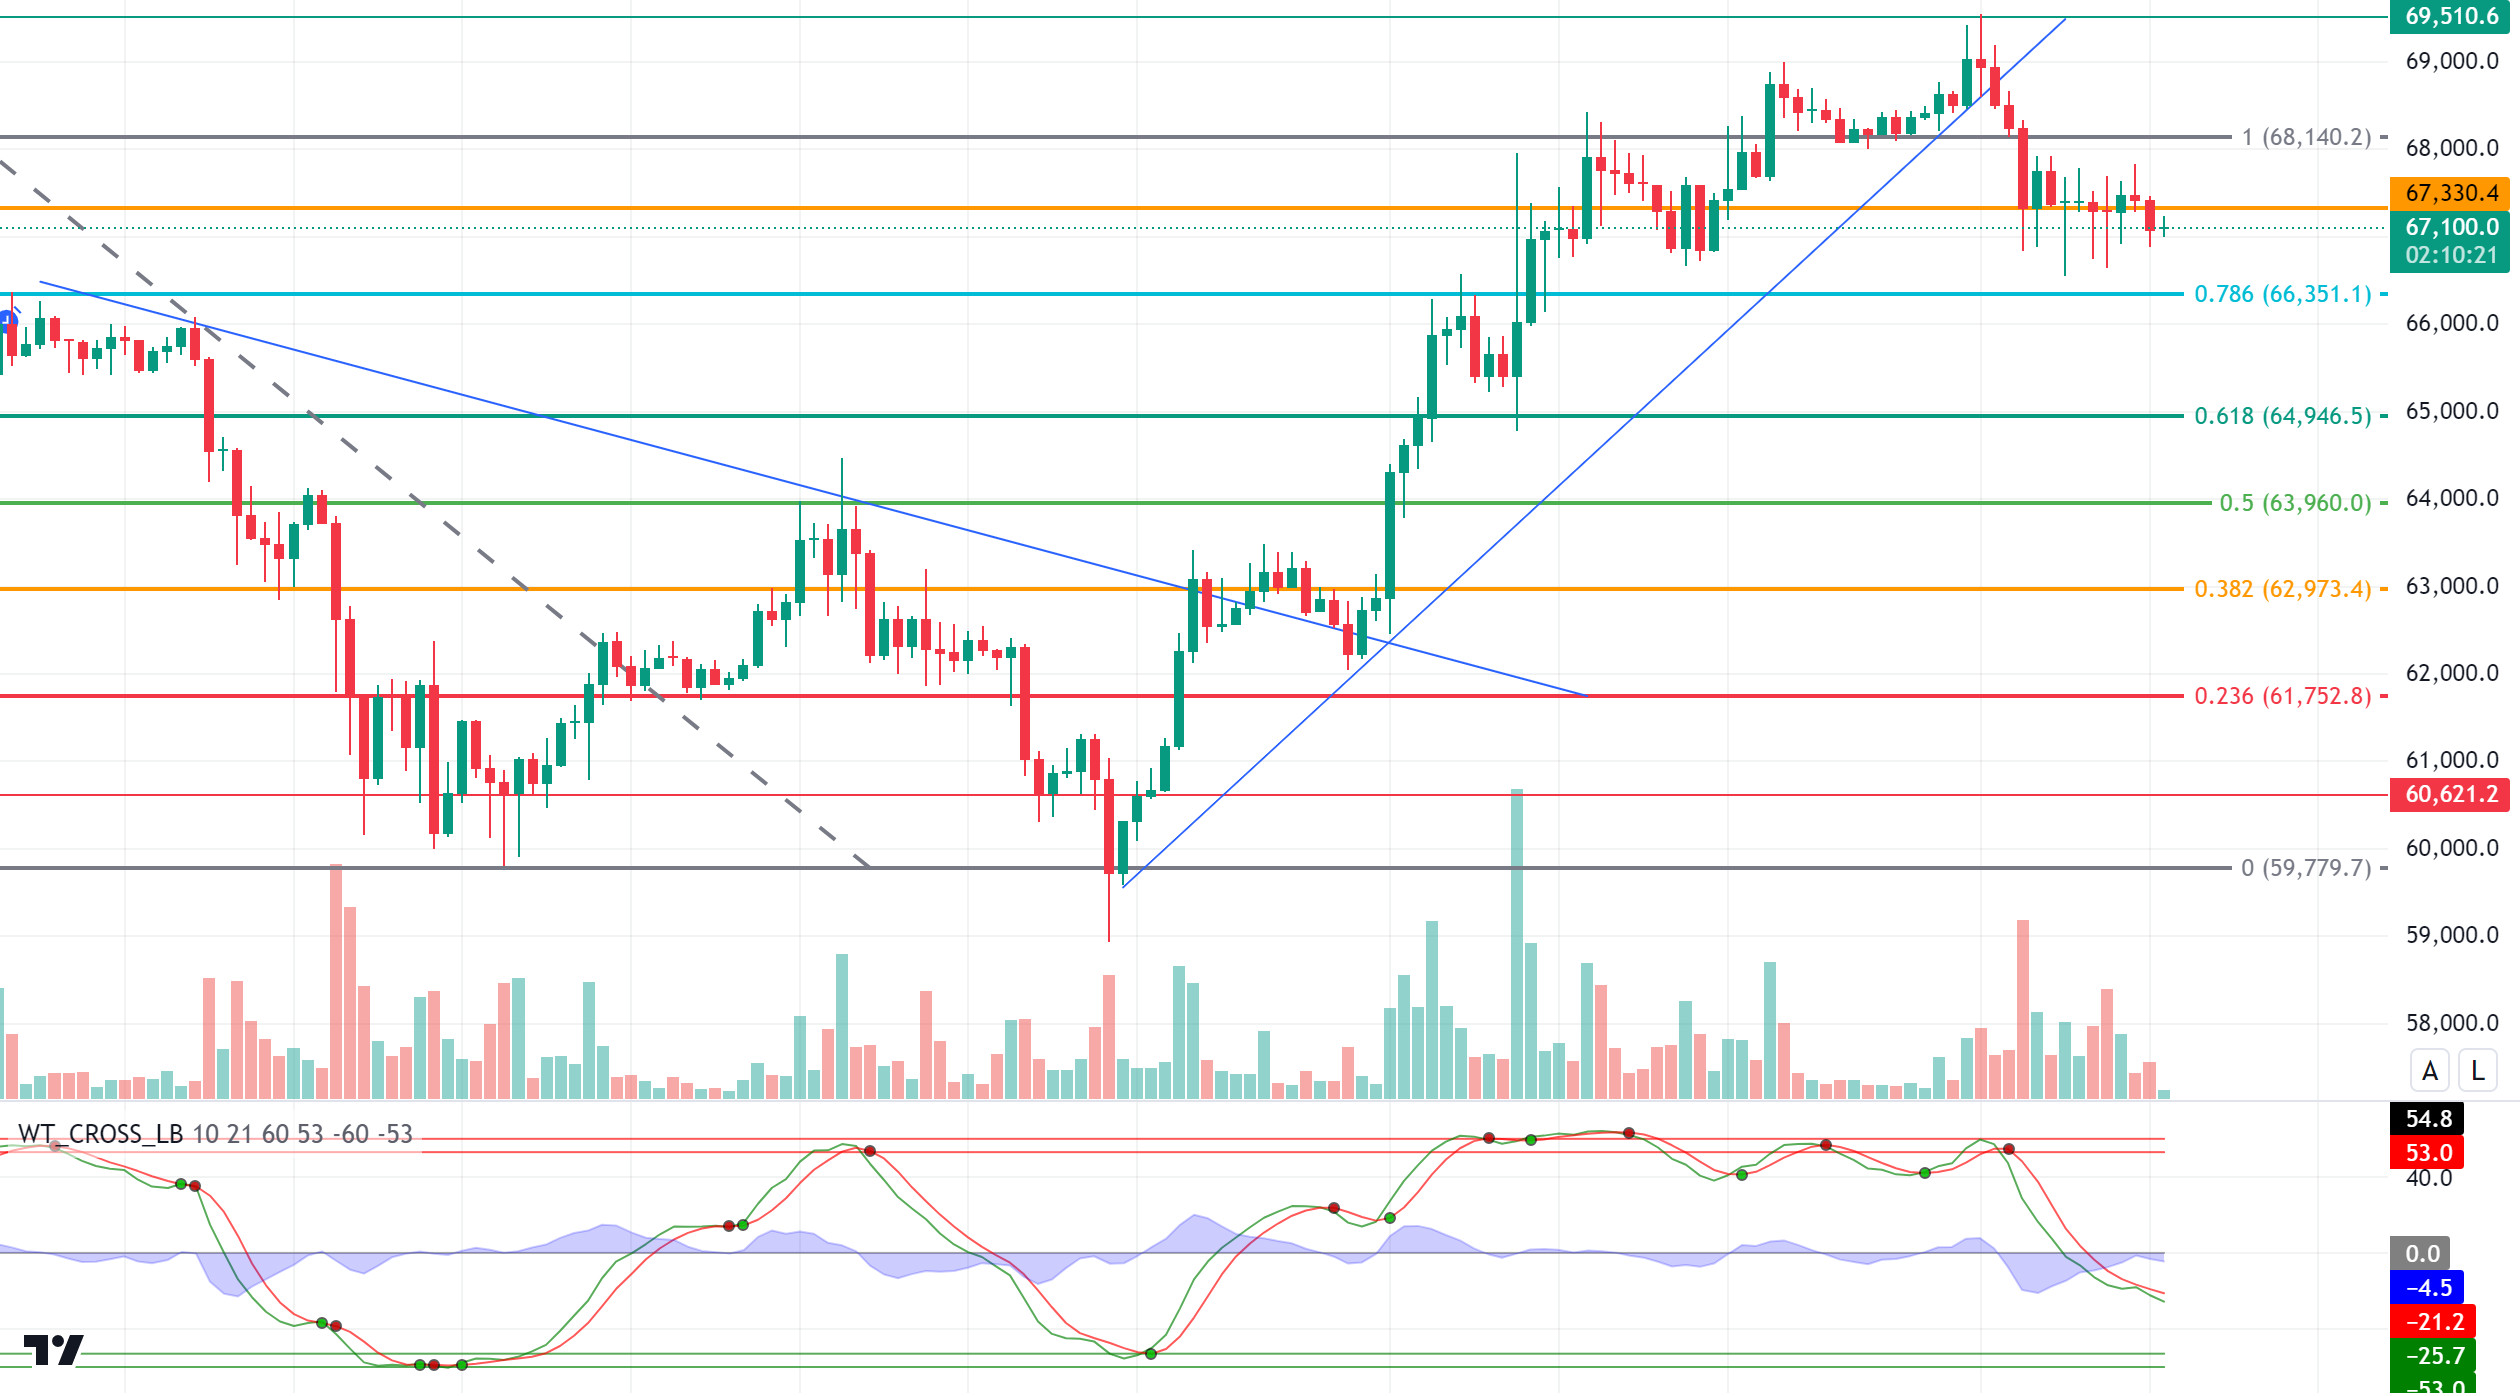
Bitcoin has consolidated to 67,000 levels with its correction movements from the 69,500 level, which is its peak point, and has started to search for direction en a consolidated way. In the consolidated area, the struggle for dominance between bears and bulls continues. With market optimism and the upcoming elections, the bulls are targeting a new ATH, while the bears continue to push the price towards the 65,000 level.
When we look at the BTC technical outlook, the price, which has moved from the rising trend channel to the horizontal band range, continues to move around the 67,330 level, which is the support zone. Yesterday, BTC, which fell below the 67,000 level from time to time with the negative outlook of global indices, managed to recover again and managed to move above this level. As we approach the end of the month, when we look at the earnings report for October, it is seen that BTC, which has an average of 21.47%, has performed poorly compared to previous years, with an earnings rate of 5.74% so far. In the remaining days, the direction of BTC performance can be determined por the messages from the political front with the upcoming election. The resistance level we will follow en an upward breakout is Fibonacci 1 (68,140) and the support level of 0.786 (66,351) en a downward breakdown. When we look at the technical indicators, it may suggest that the price may retreat a little more, as it has not yet reached the oversold zone or does not produce any buy signals.
Supports 67,330 – 66,350 – 64,946
Resistances 68,140 – 69,510 – 71,470
ETH/USDT
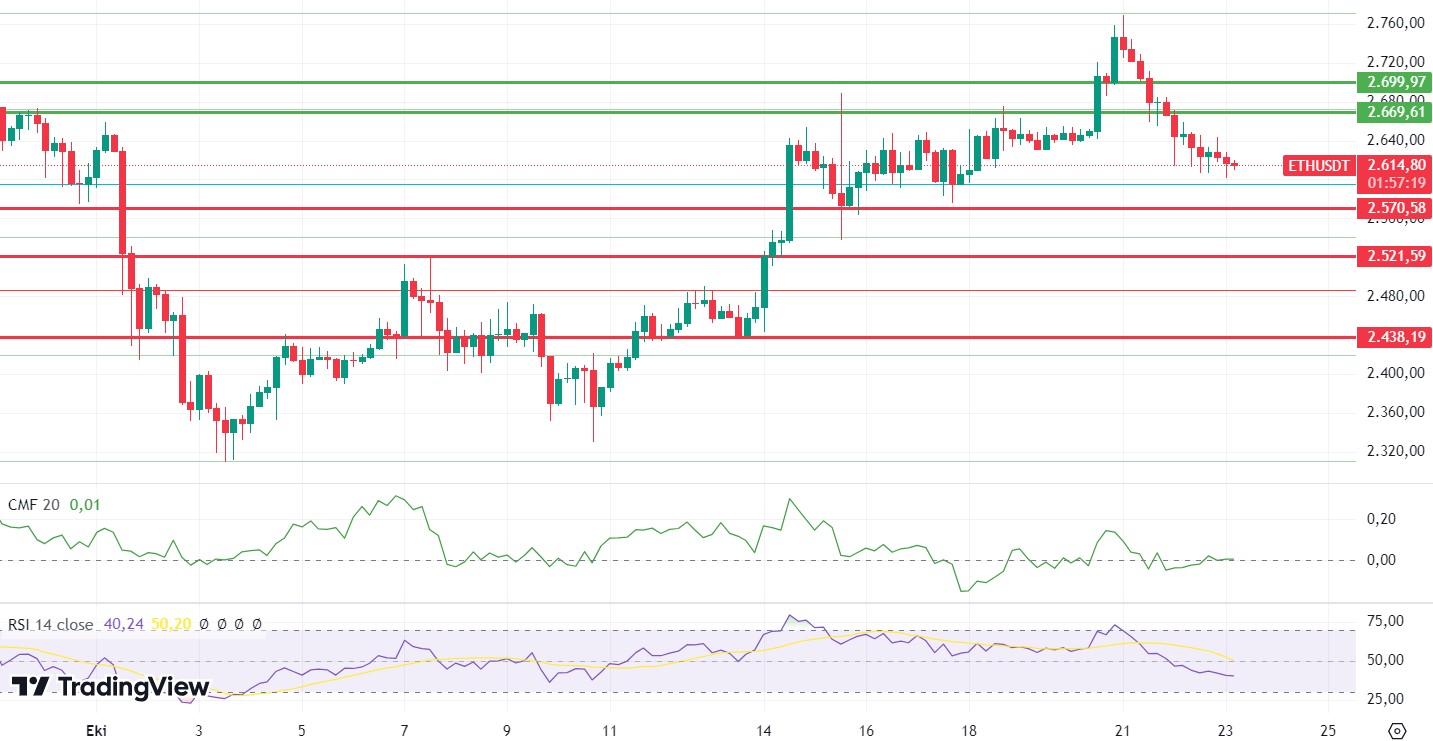
ETH, which continues to decline with the weakness en volume, is trying to hold el to the 2,600 region. While the negative outlook el the Relative Strength Index (RSI) continues, Chaikin Money Flow (CMF) is slightly higher to 0. Provided that the price does not lose the Fibonacci 0.618 (2,595) zone, slight increases may be seen during the day. However, with the break of the important support zone between 2.571 and 2.595 levels, the decline is likely to deepen and go down to 2.521 levels. It is important to break the 2.669 level en order to remove the net negative outlooks el Momentum, RSI and CCI and start a positive trend. With the closes above this level, we may see rises up to 2,815 levels.
Supports 2,571 – 2,521 – 2,440
Resistances 2,669 – 2,700 – 2,815
LINK/USDT
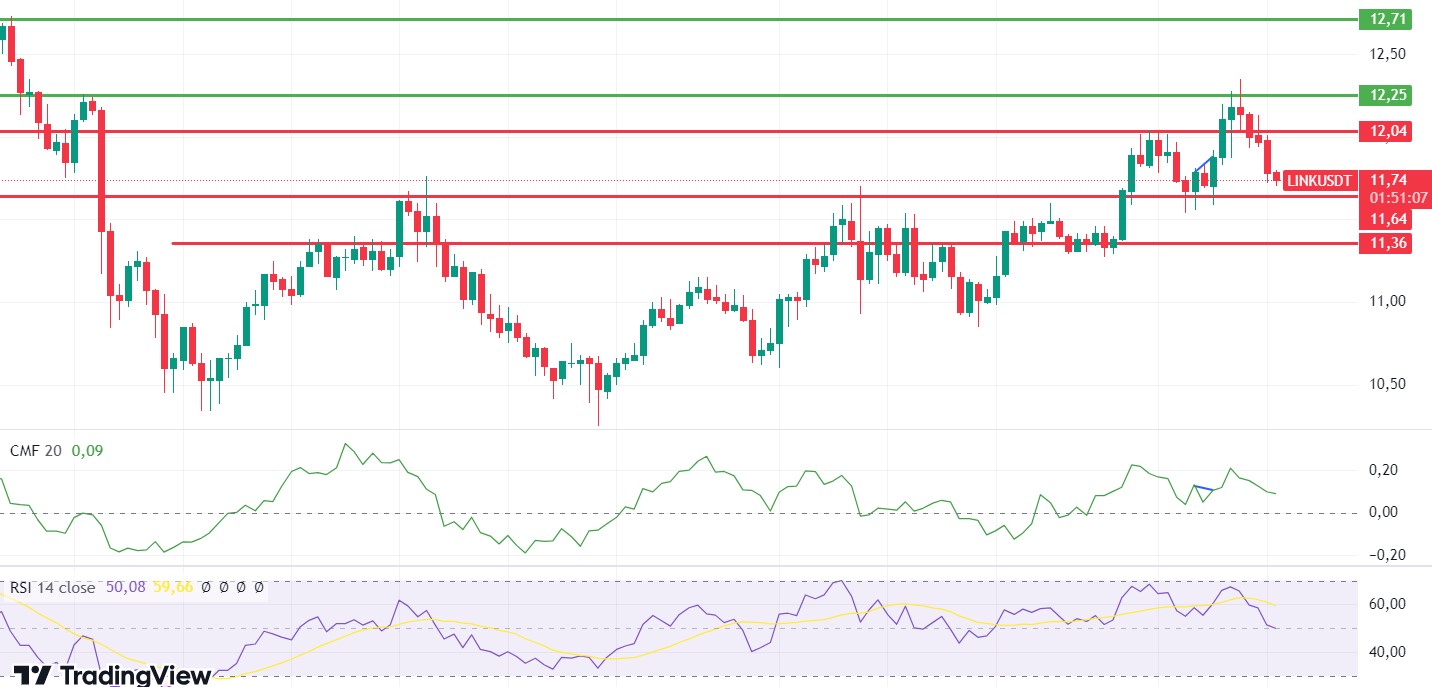
LINK retreated yesterday, failing to break the 12.25 level as expected, and is currently trying to hold el to 11.64 support. Although positive divergence has occurred el the Relative Strength Index (RSI), it can be said that with the break of 11.64 support, this divergence may disappear and the decline may deepen. If 11.64 support is maintained, a rebound to 12.04 levels can be seen during the day.
Supports 11.64 – 11.36 – 11.15
Resistances 12.04 – 12.25 – 12.71
SOL/USDT
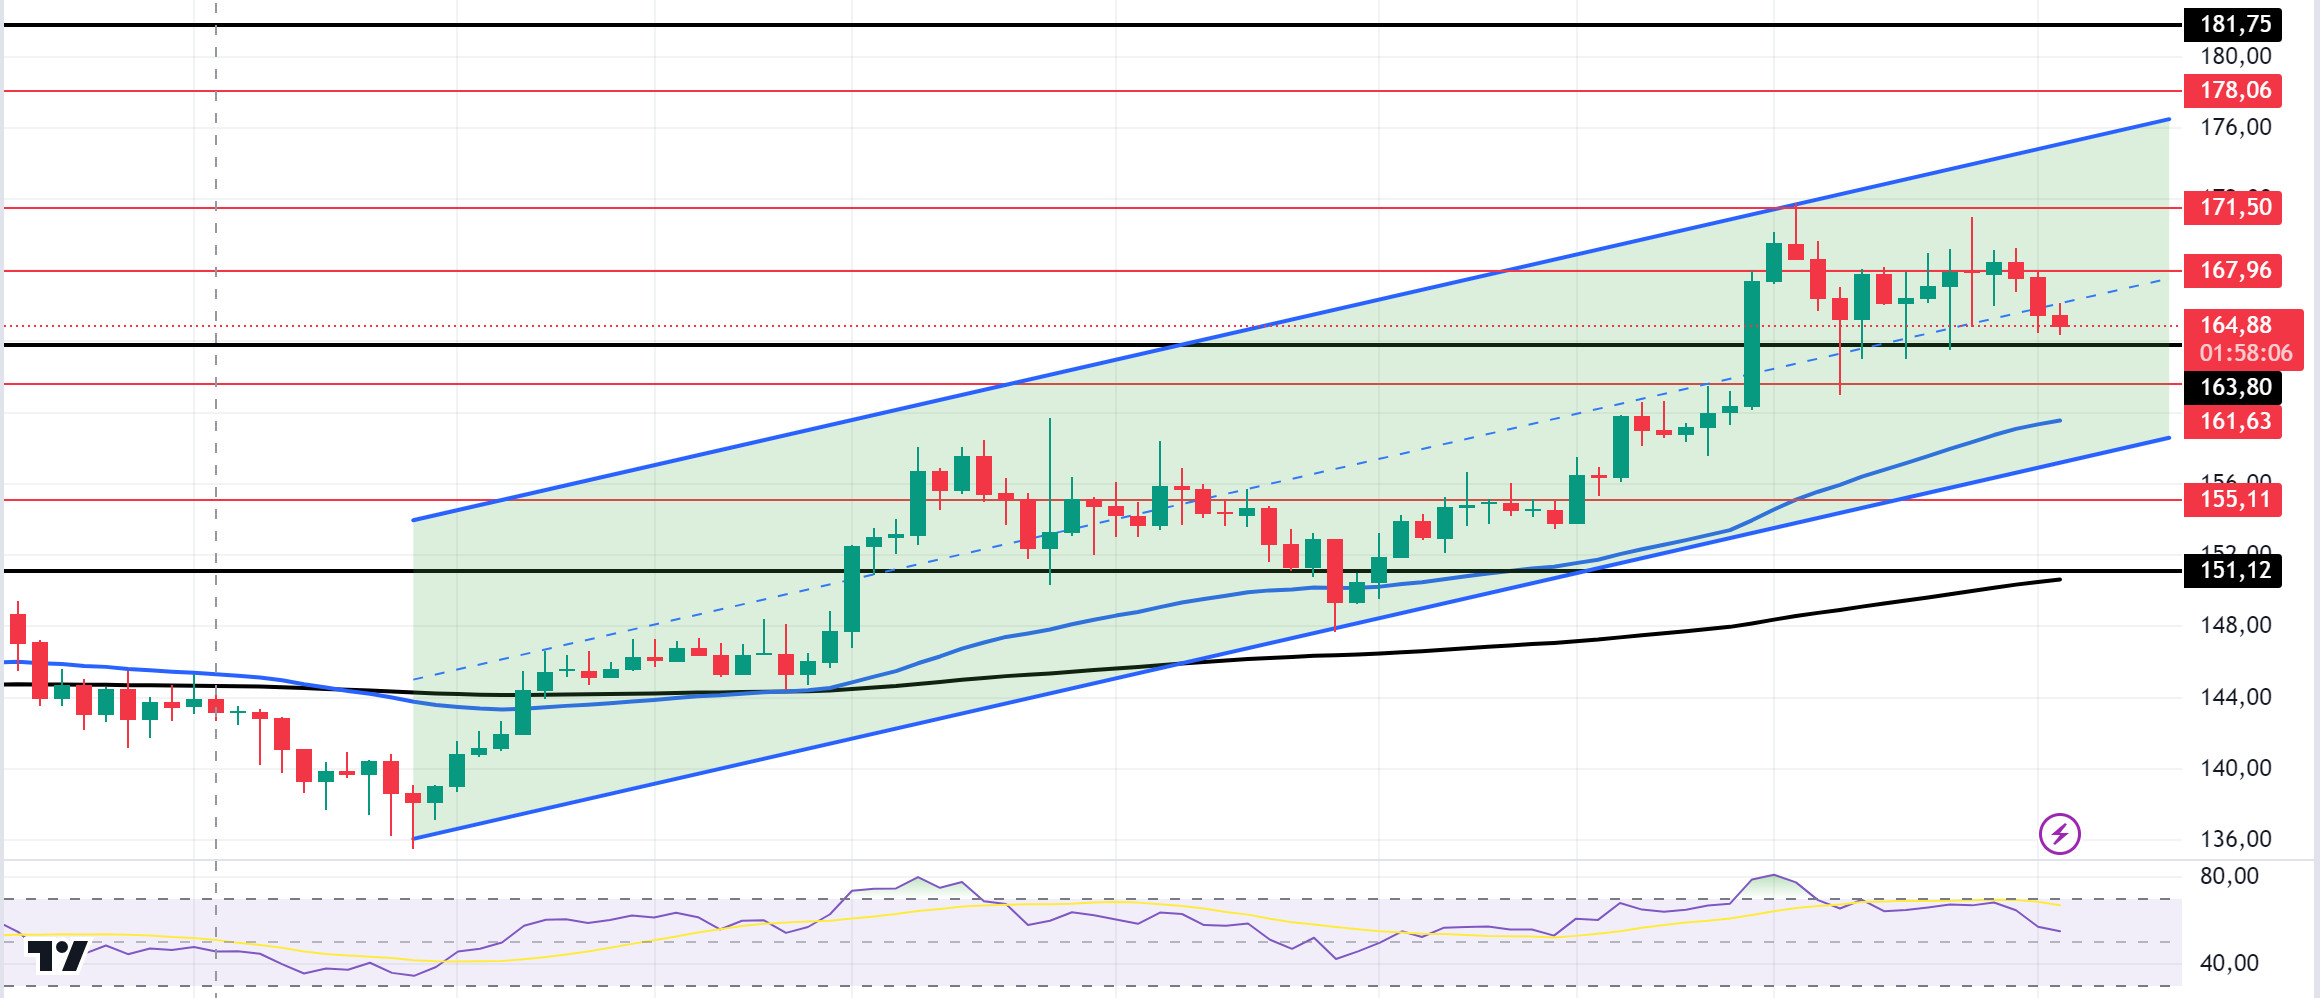
In the Solana ecosystem, Solana’s total locked value (TVL) reached $6.433 billion, its highest level since January 2022. It surpassed $2 billion en daily DEX volume, surpassing all other blockchains. Elmnts also offers tokenized investment funds linked to mineral rights royalties, aiming to make investing en mineral rights easier and more accessible for investors. The launch of Elmnts supports the growing trend towards tokenizing real-world assets. Solana ranks third behind Ethereum and Tron en terms of blockchain revenue en Q3 of this year. According to data from CryptoRank.io, SOL generated $54.7 million en revenue en the third quarter, moving the chain into the top three. Looking at the chart, the 50 EMA (Blue Line) continues to be above the 200 EMA (Black Line) en the 4-hora timeframe. This could mean that the uptrend will continue. The price broke the 163.80 level, which is an important resistance place, en a voluminous way, ensuring the continuation of the uptrend that started el October 10. However, the Relative Strength Index (RSI)14 indicator started to fall from the overbought zone. This could allow it to test the 163.80 level, a strong resistance. The 181.75 level is a very strong resistance point en the uptrend driven por both macroeconomic conditions and innovations en the Solana ecosystem. If it rises above this level, the rise may continue strongly. In case of possible profit sales, support levels of 163.80 – 161.63 should be followed. If the price comes to these support levels, a potential bullish opportunity may arise.
Supports 163.80 – 161.63 – 155.11
Resistances 167.96 – 171.50 – 178.06
ADA/USDT
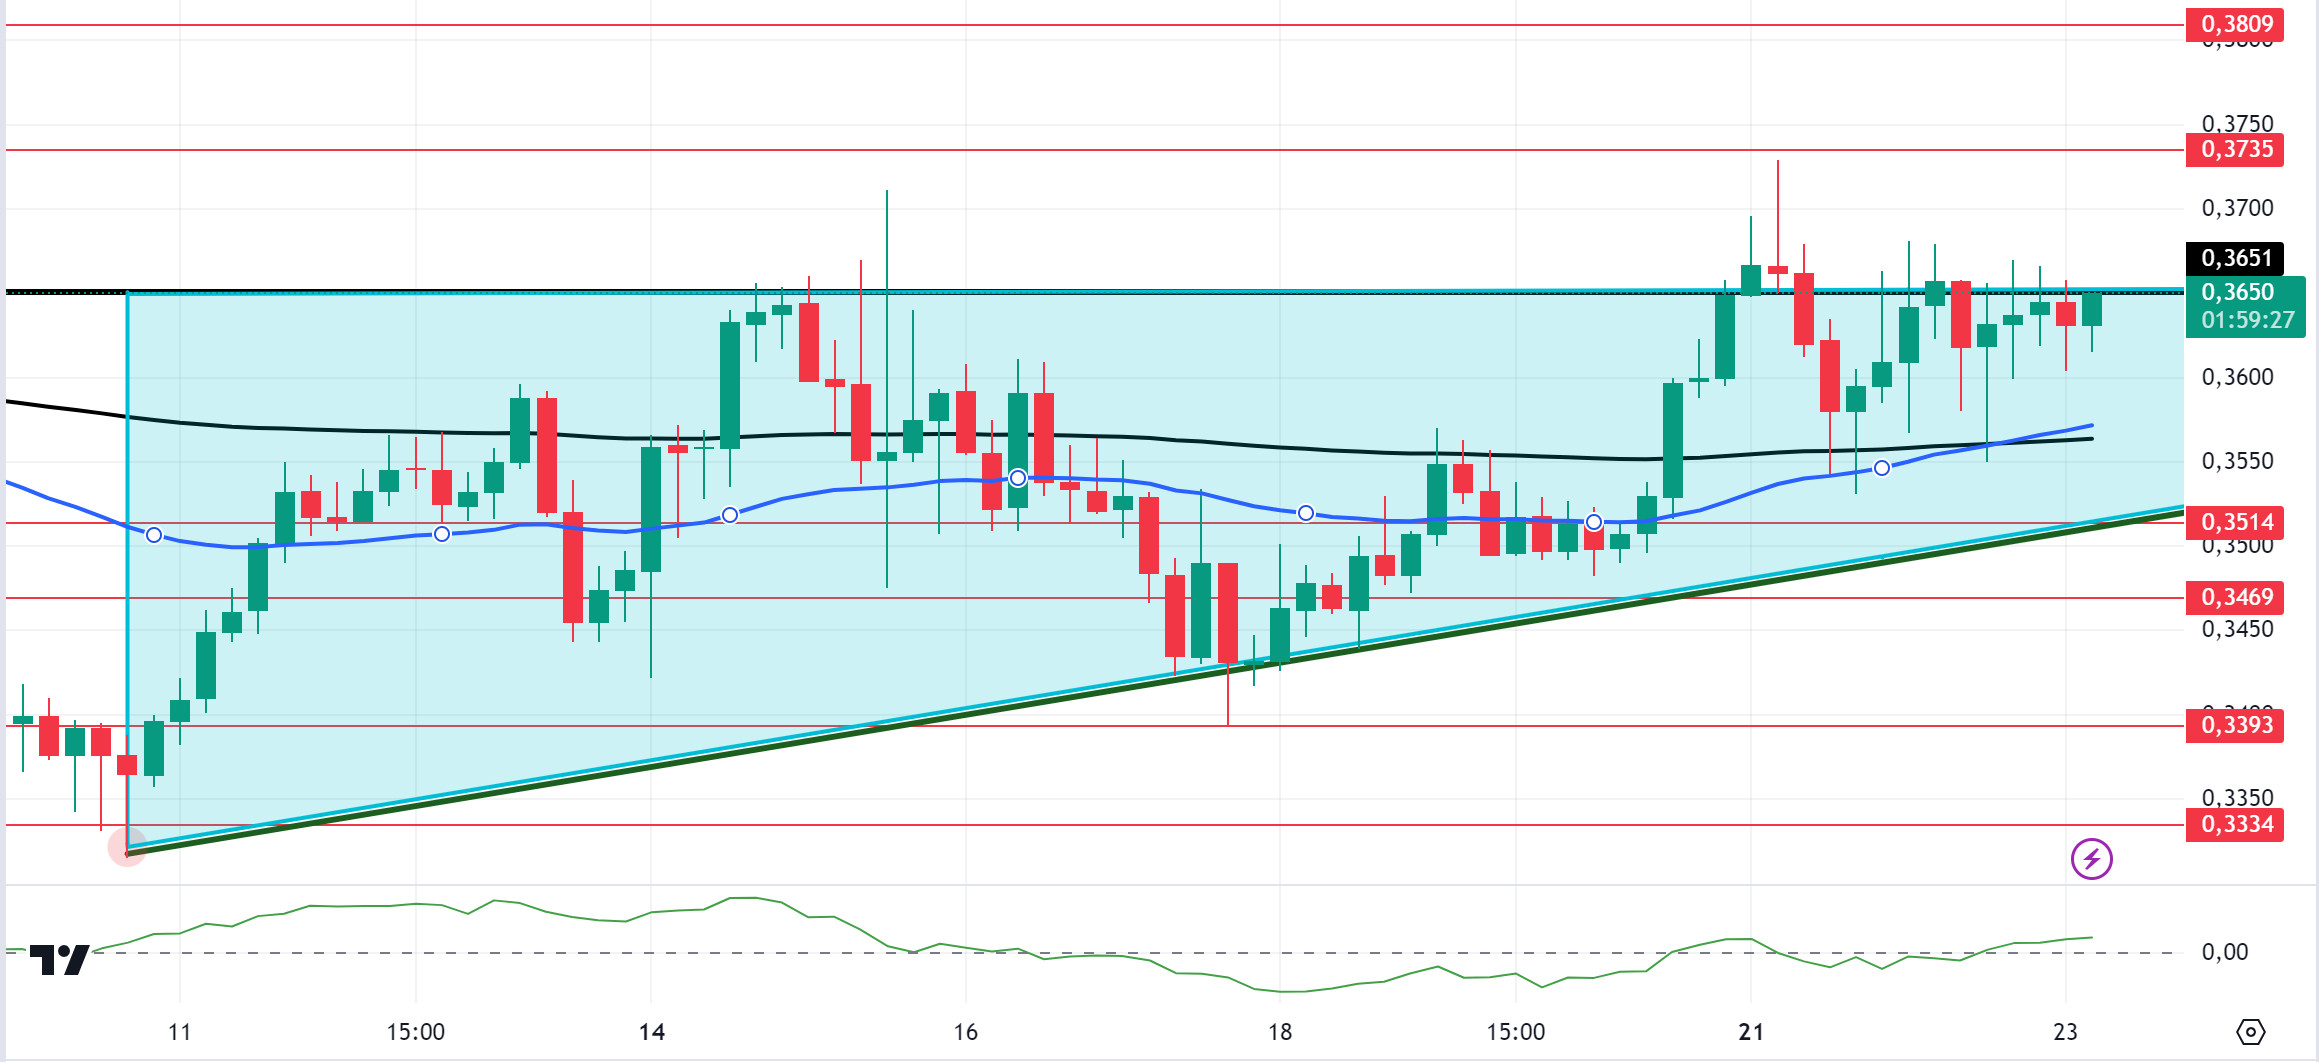
On the 4-hora chart, the price is pricing above the 50 EMA (Blue Line) and the 200 EMA (Black Line). At the same time, the 50 EMA has been below the 200 EMA since October 6. As of today, the 50 EMA has broken the 200 EMA to the upside. This shows us that the trend may have been en an upward trend. The Chaikin Money Flow (CMF) 20 indicator supports the 50 EMA, indicating that the money flow is increasing, which could be a bullish signal and the price could break the first resistance at 0.3651. At the same time, ADA, which tested the ceiling level of the ascending triangle pattern for the fourth time, may test the resistance level of 0.3905 if it breaks it. If it fails to break the 0.3651 level, it can be followed as a good buying place, pointing to a potential decline towards the 0.3514 support zone.
Supports 0.3514 – 0.3469 – 0.3393
Resistances 0.3651 – 0.3735 – 0.3809
AVAX/USDT
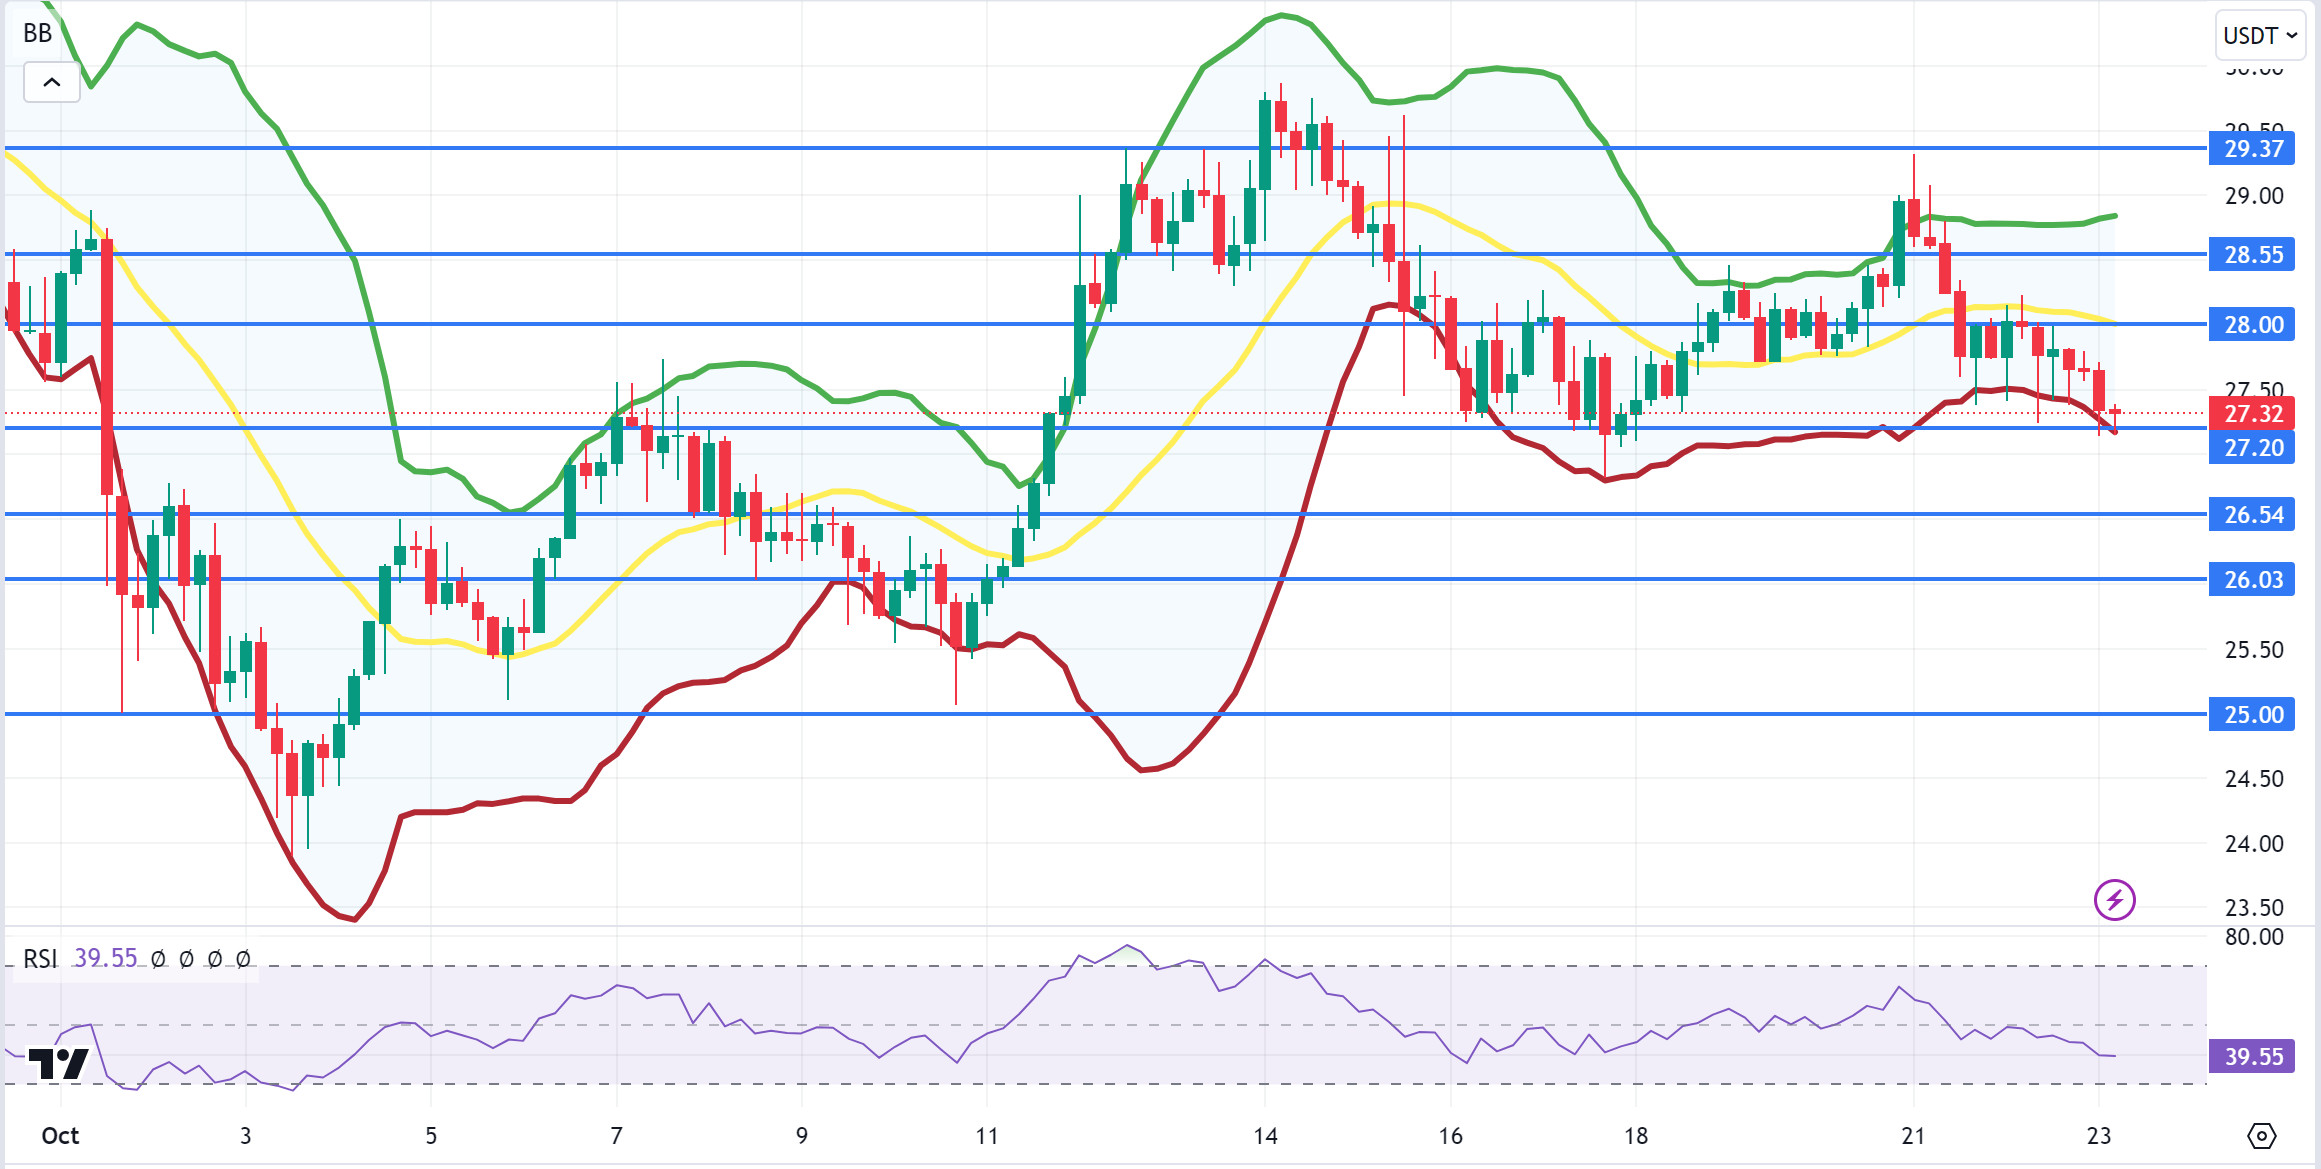
AVAX, which opened yesterday at 27.75, fell slightly during the day and closed the day at 27.64. Today, there is no planned data to be announced especially por the US and expected to affect the market. For this reason, it may be a low-volume day where we may see limited movements. Noticias flows from the Middle East will be important for the market.
AVAX, which is currently trading at 27.32, is en the Bollinger lower band el the 4-hora chart. With a Relative Strength Index value of 39, it can be expected to rise slightly from these levels and move to the middle band. In such a case, it may test the 28.00 resistance. On the other hand, sales may increase en case of news of increasing tension en the Middle East. In such a case, it may test 26.54 support. As long as it stays above 25.00 support during the day, the desire to rise may continue. With the break of 25.00 support, sales may increase.
Supports 27.20 – 26.54 – 26.03
Resistances 28.00 – 28.55 – 29.37
TRX/USDT
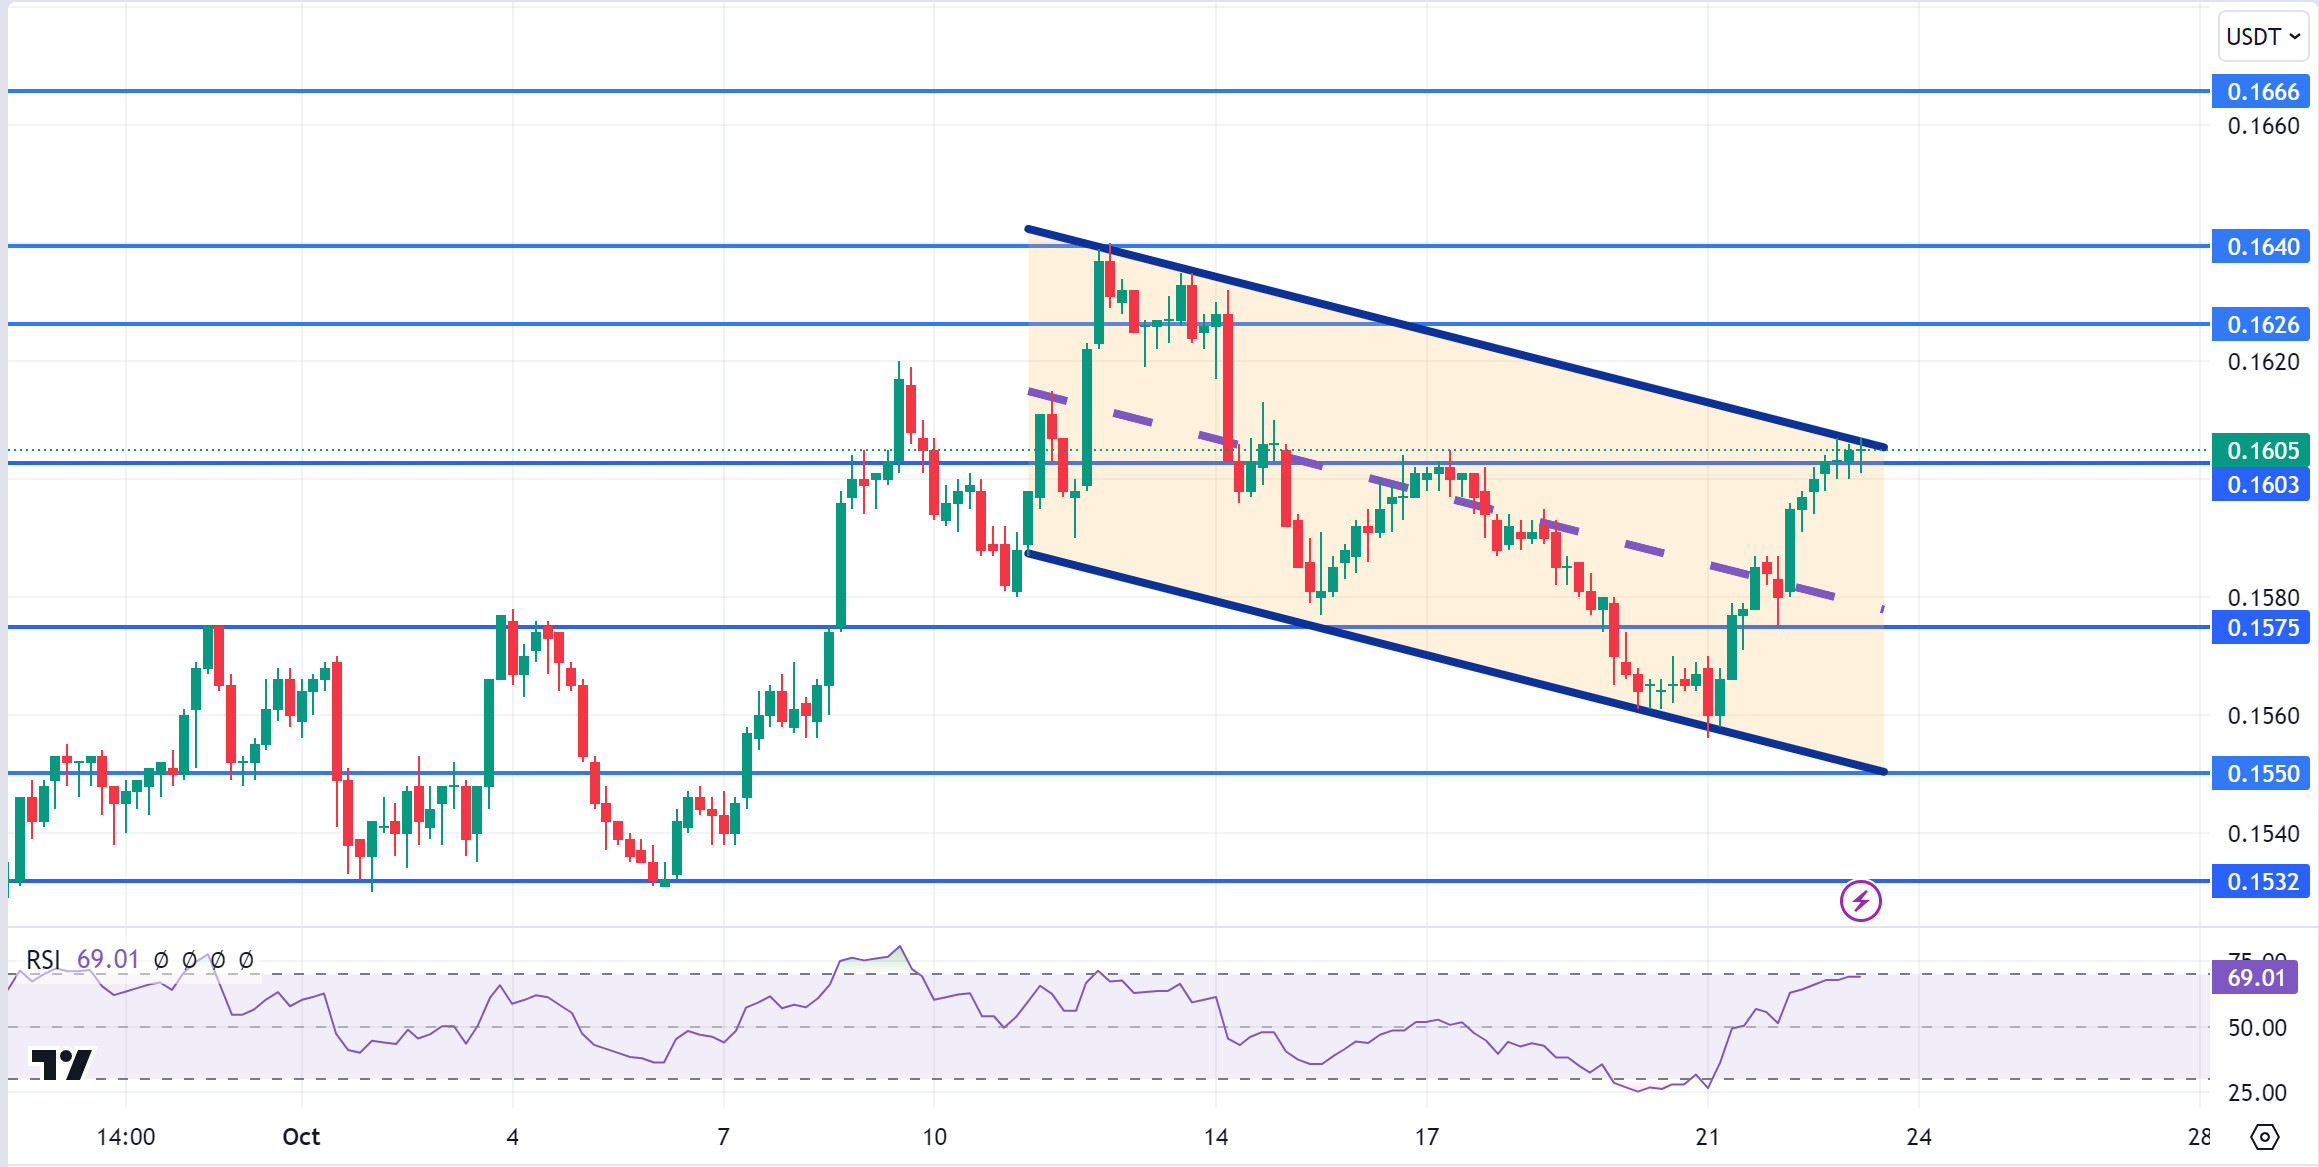
TRX, which started yesterday at 0.1583, rose 1.5% during the day and closed the day at 0.1603. There is no scheduled data for the market today. The market will be closely following the news flows regarding the tension en the Middle East.
TRX, currently trading at 0.1605, is at the upper band of the bearish channel el the 4-hora chart. The Relative Strength Index value is very close to the overbought zone with 67 and can be expected to decline slightly from its current level. In such a case, it may move to the middle band of the channel and test the 0.1575 support. However, it cannot close the candle below 0.1575 support and may test 0.1626 resistance with the buying reaction that will occur if news flow comes that the tension en the Middle East is decreasing. As long as TRX stays above 0.1482 support, the desire to rise may continue. If this support is broken downwards, sales can be expected to increase.
Supports 0.1603 – 0.1575 – 0.1550
Resistances 0.1626 – 0.1640 – 0.1666
DOT/USDT
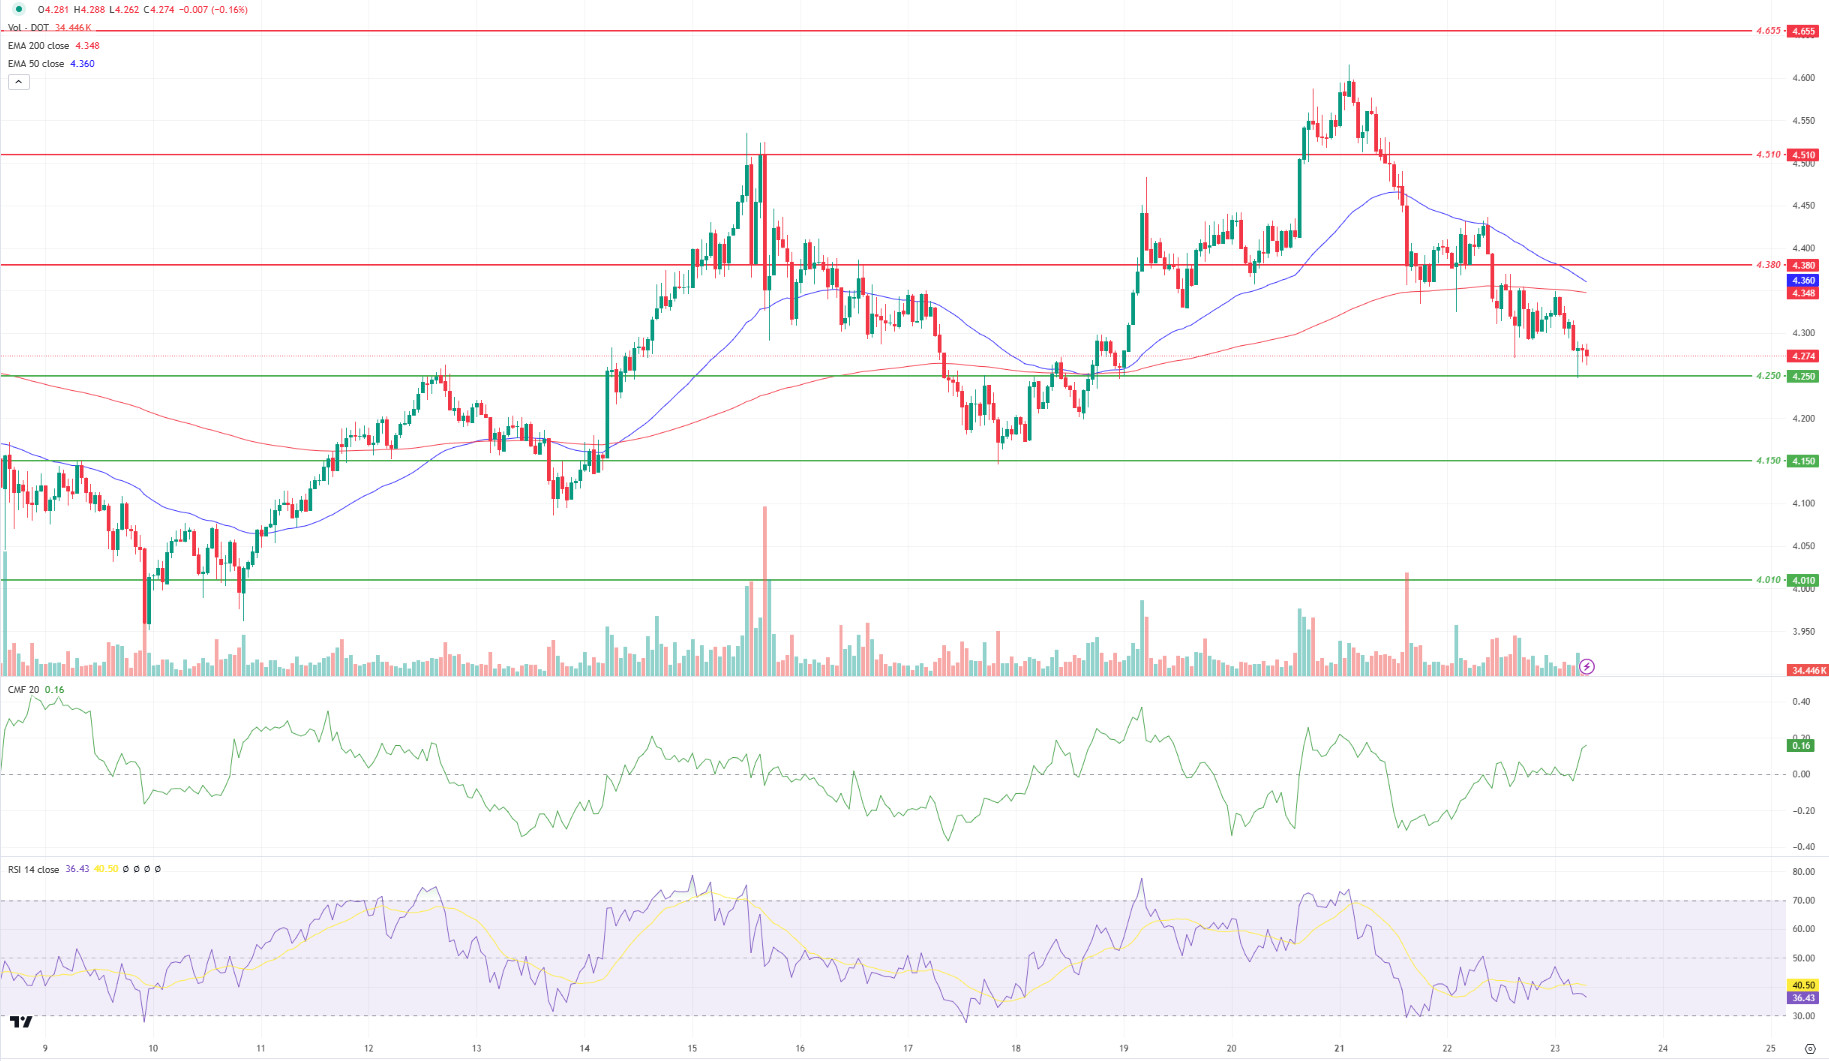
When we examine the Polkadot (DOT) chart, we see that the price reacted from the 4.250 band. We see a positive divergence between the Relative Strenght Index (RSI) and the price. When we examine the Chaikin Money Flow (CMF) oscillator, we can say that the buyer pressure is stronger. In this context, the price may move towards the 4,380 resistance level with the reaction from the 4,250 support band. On the other hand, we see that the EMA50 (Blue Line) is preparing to break down the EMA200 (Red Line) (Death Cross). In this scenario, the price may lose the 4,250 level and move towards the 4,150 support levels.
Supports 4,250 – 4,150 – 4,010
Resistances 4.380 – 4.510 – 4.655
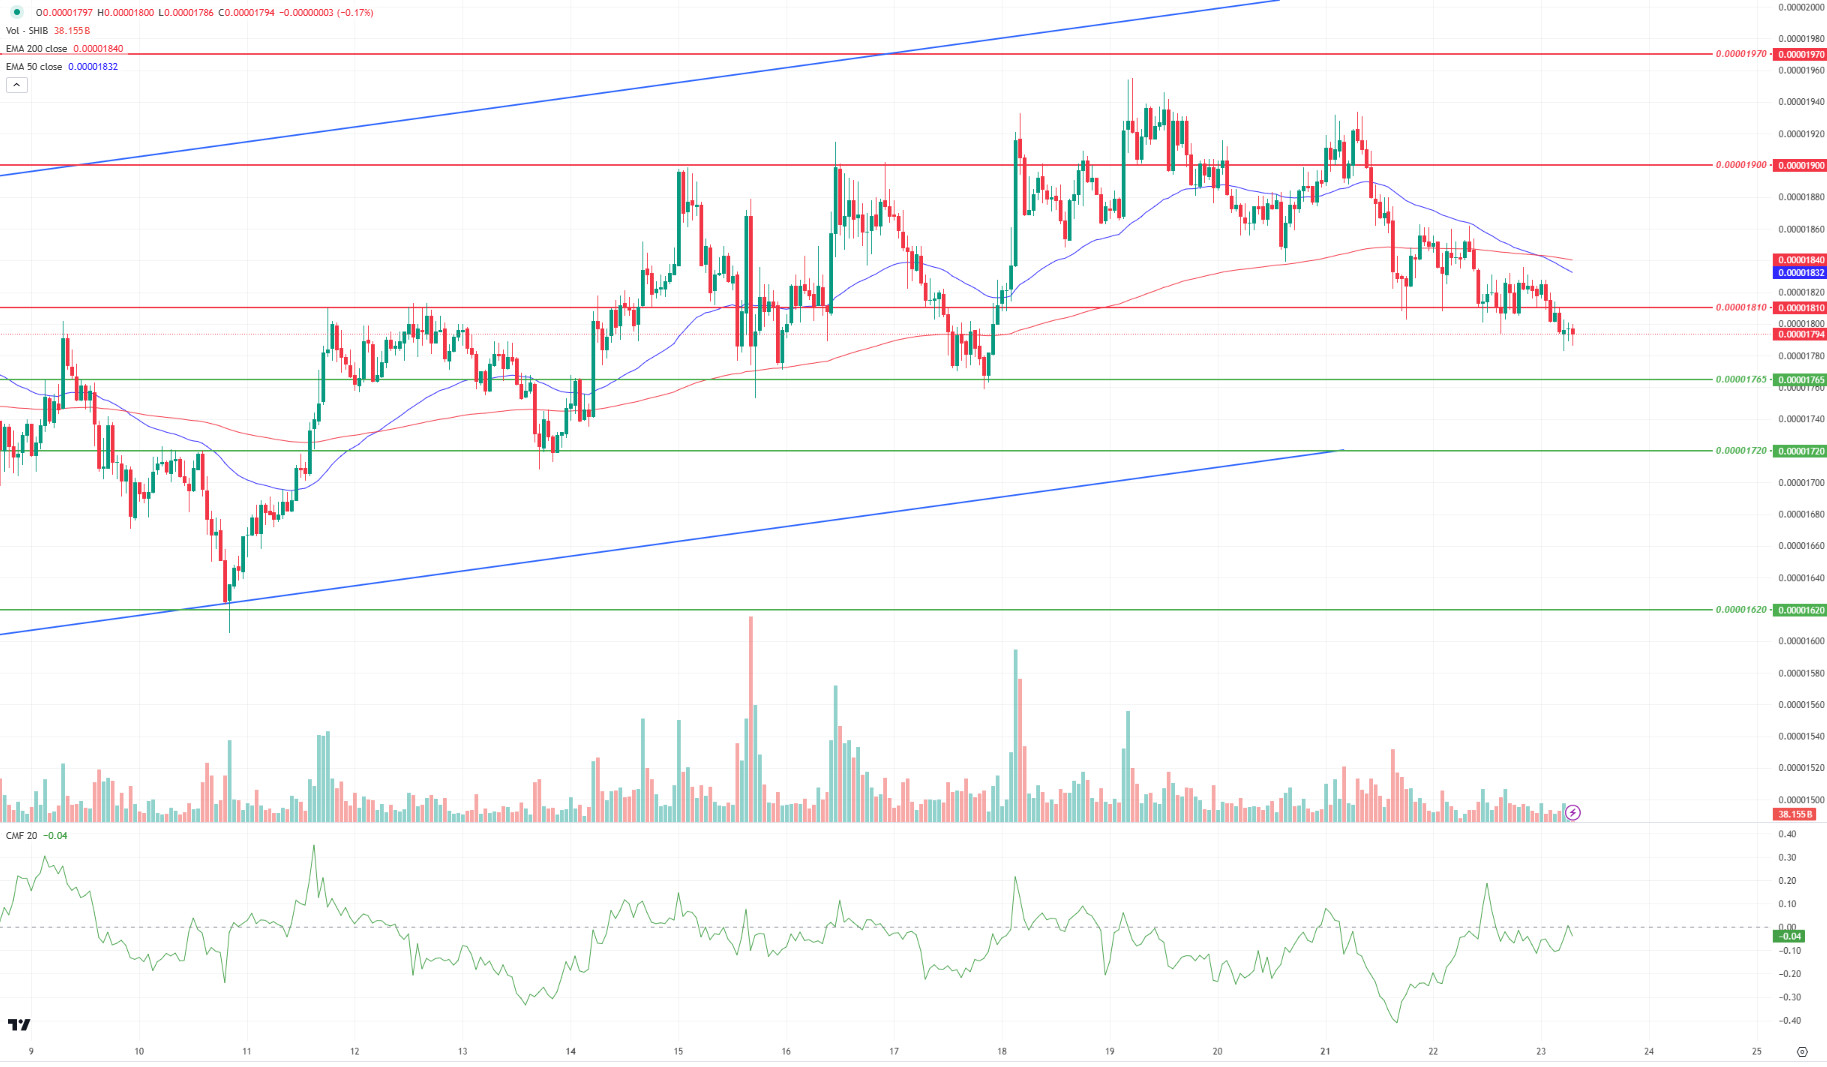
SHIB/USDT
When we examine the chart of Shiba Inu (SHIB), we see that the EMA50 (Blue Line) broke the EMA200 (Red Line) down (Death Cross). After the breakout, SHIB loses the 0.00001810 support level and moves towards the 0.00001765 support level. When we analyze the Chaikin Money Flow (CMF) oscillator, we can say that the selling pressure is stronger. According to this situation, the price may react from the 0.00001765 level. On the other hand, if the buyer pressure increases, the price may want to break the selling pressure at 0.00001810.
Supports 0.00001765 – 0.00001720 – 0.00001620
Resistances 0.00001810 – 0.00001900 – 0.00001970
 LEGAL NOTICE
The investment information, comments and recommendations contained herein do not constitute investment advice. Investment advisory services are provided individually por authorized institutions taking into account the risk and return preferences of individuals. The comments and recommendations contained herein are of a general nature. These recommendations may not be suitable for your financial situation and risk and return preferences. Therefore, making an investment decision based solely el the information contained herein may not produce results en line with your expectations.
