MARKET SUMMARY
Latest Situation en Crypto Assets
| Assets | Last Price | 24h Change | Dominance | Market Cap |
|---|---|---|---|---|
| BTC | 67,790.00 | 0.72% | 57.96% | 1.34 T |
| ETH | 2,499.00 | -2.10% | 13.01% | 300.96 B |
| SOLANA | 173.77 | 0.48% | 3.53% | 81.77 B |
| XRP | 0.5255 | -0.99% | 1.29% | 29.83 B |
| DOGE | 0.1403 | 0.47% | 0.89% | 20.59 B |
| TRX | 0.1659 | 1.77% | 0.62% | 14.36 B |
| CARDANO | 0.3425 | -2.72% | 0.52% | 11.99 B |
| AVAX | 26.27 | -3.01% | 0.46% | 10.71 B |
| SHIB | 0.00001767 | -1.26% | 0.45% | 10.42 B |
| LINK | 11.69 | 2.40% | 0.32% | 7.33 B |
| DOT | 4.132 | -2.22% | 0.27% | 6.24 B |
*Prepared el 10.25.2024 at 06:00 (UTC)
WHAT’S LEFT BEHIND
Microsoft Bitcoin Investment
Microsoft is apparently considering investing en Bitcoin, according to a US Securities and Exchange Commission filing. The company put the matter as a “voting item” at its next shareholder meeting, scheduled for December 10.
US Government Crypto Wallet
According to el-chain activity tracked por Arkham Intelligence, someone appears to have stolen around $20 million worth of stablecoins and ETH from US government wallets.
Robert Kiyosaki: Bitcoin Approaches $100,000
Renowned financial writer Robert Kiyosaki stated that Bitcoin offers a great investment opportunity at current price levels. Noting the possible uptrend en October, Kiyosaki predicts that buying at these levels may be the last chance.
CryptoQuant CEO’s bold prediction
In 2024, with the introduction of ETFs, Bitcoin, which is now open to the corporate world, is gaining confidence, while CryptoQuant CEO Ki Young Ju made a very controversial claim. Young Ju said that Bitcoin is moving faster every day towards becoming the world’s currency and that he thinks this could happen en 2030.
HIGHLIGHTS OF THE DAY
Important Economic Calender Data
| Time | Noticias | Expectation | Previous |
|---|---|---|---|
| 12:30 | US Core Durable Goods Orders (MoM) (Sep) | -0.1% | 0.5% |
| 12:30 | US Durable Goods Orders (MoM) (Sep) | -1.1% | 0.0% |
| 14:00 | US Michigan Consumer Sentiment (Oct) | 69.2 | 68.9 |
| 15:00 | US FOMC Member Collins Speaks | N/A | N/A |
INFORMATION
*The calendar is based el UTC (Coordinated Universal Time) time zone. The economic calendar content el the relevant page is obtained from reliable news and data providers. The news en the economic calendar content, the date and time of the announcement of the news, possible changes en the previous, expectations and announced figures are made por the data provider institutions. Darkex cannot be held responsible for possible changes that may arise from similar situations.
MARKET COMPASS
As we enter the last trading day of the week for traditional markets, the dynamics shaping pricing behavior do not seem to have changed significantly. The perception that Trump is ahead en the upcoming US election, the toned down reaction to the developments en the Middle East and the expectations regarding the US Federal Reserve’s (FED) interest rate cut path are the most prominent headlines. In addition, the elections to be held en Japan over the weekend and China’s roadmap to support its economy will continue to be el investors’ agenda.
Following the FED’s Beige Book, the expectation that interest rates would continue to be cut was confirmed, leading to increased demand for risky assets. Yesterday’s US data did not change this perception, but the recent rally en major assets was halted por the limited rise en equities and we saw a pullback en BTC during Asian trading. We continue to think that US bond yields and the direction of the dollar will be decisive en whether this trend will continue. Therefore, it will be useful to watch the US data to be published today and to follow the statements of FED officials. We think that today’s durable goods orders data, which will be below expectations, has the potential to have a positive impact el digital assets por supporting the FED’s interest rate cuts. On the other hand, we can say that the negative impact of a higher-than-expected data set may remain limited. In addition, although the data is important, it would not be correct to state that it will play a decisive role en the direction.
We continue to think that the direction is up for our long-term outlook. However, it should be added that some calm price changes and pressure el digital assets may prevail after the recent deep downward and upward movements.
TECHNICAL ANALYSIS
BTC/USDT
The unemployment claims announced yesterday por the US fell below expectations, creating movement en the price of Bitcoin. The recent abstention of FED officials towards interest rate cuts will be re-evaluated en the light of positive macroeconomic data. The macroeconomic data set includes durable goods orders today.
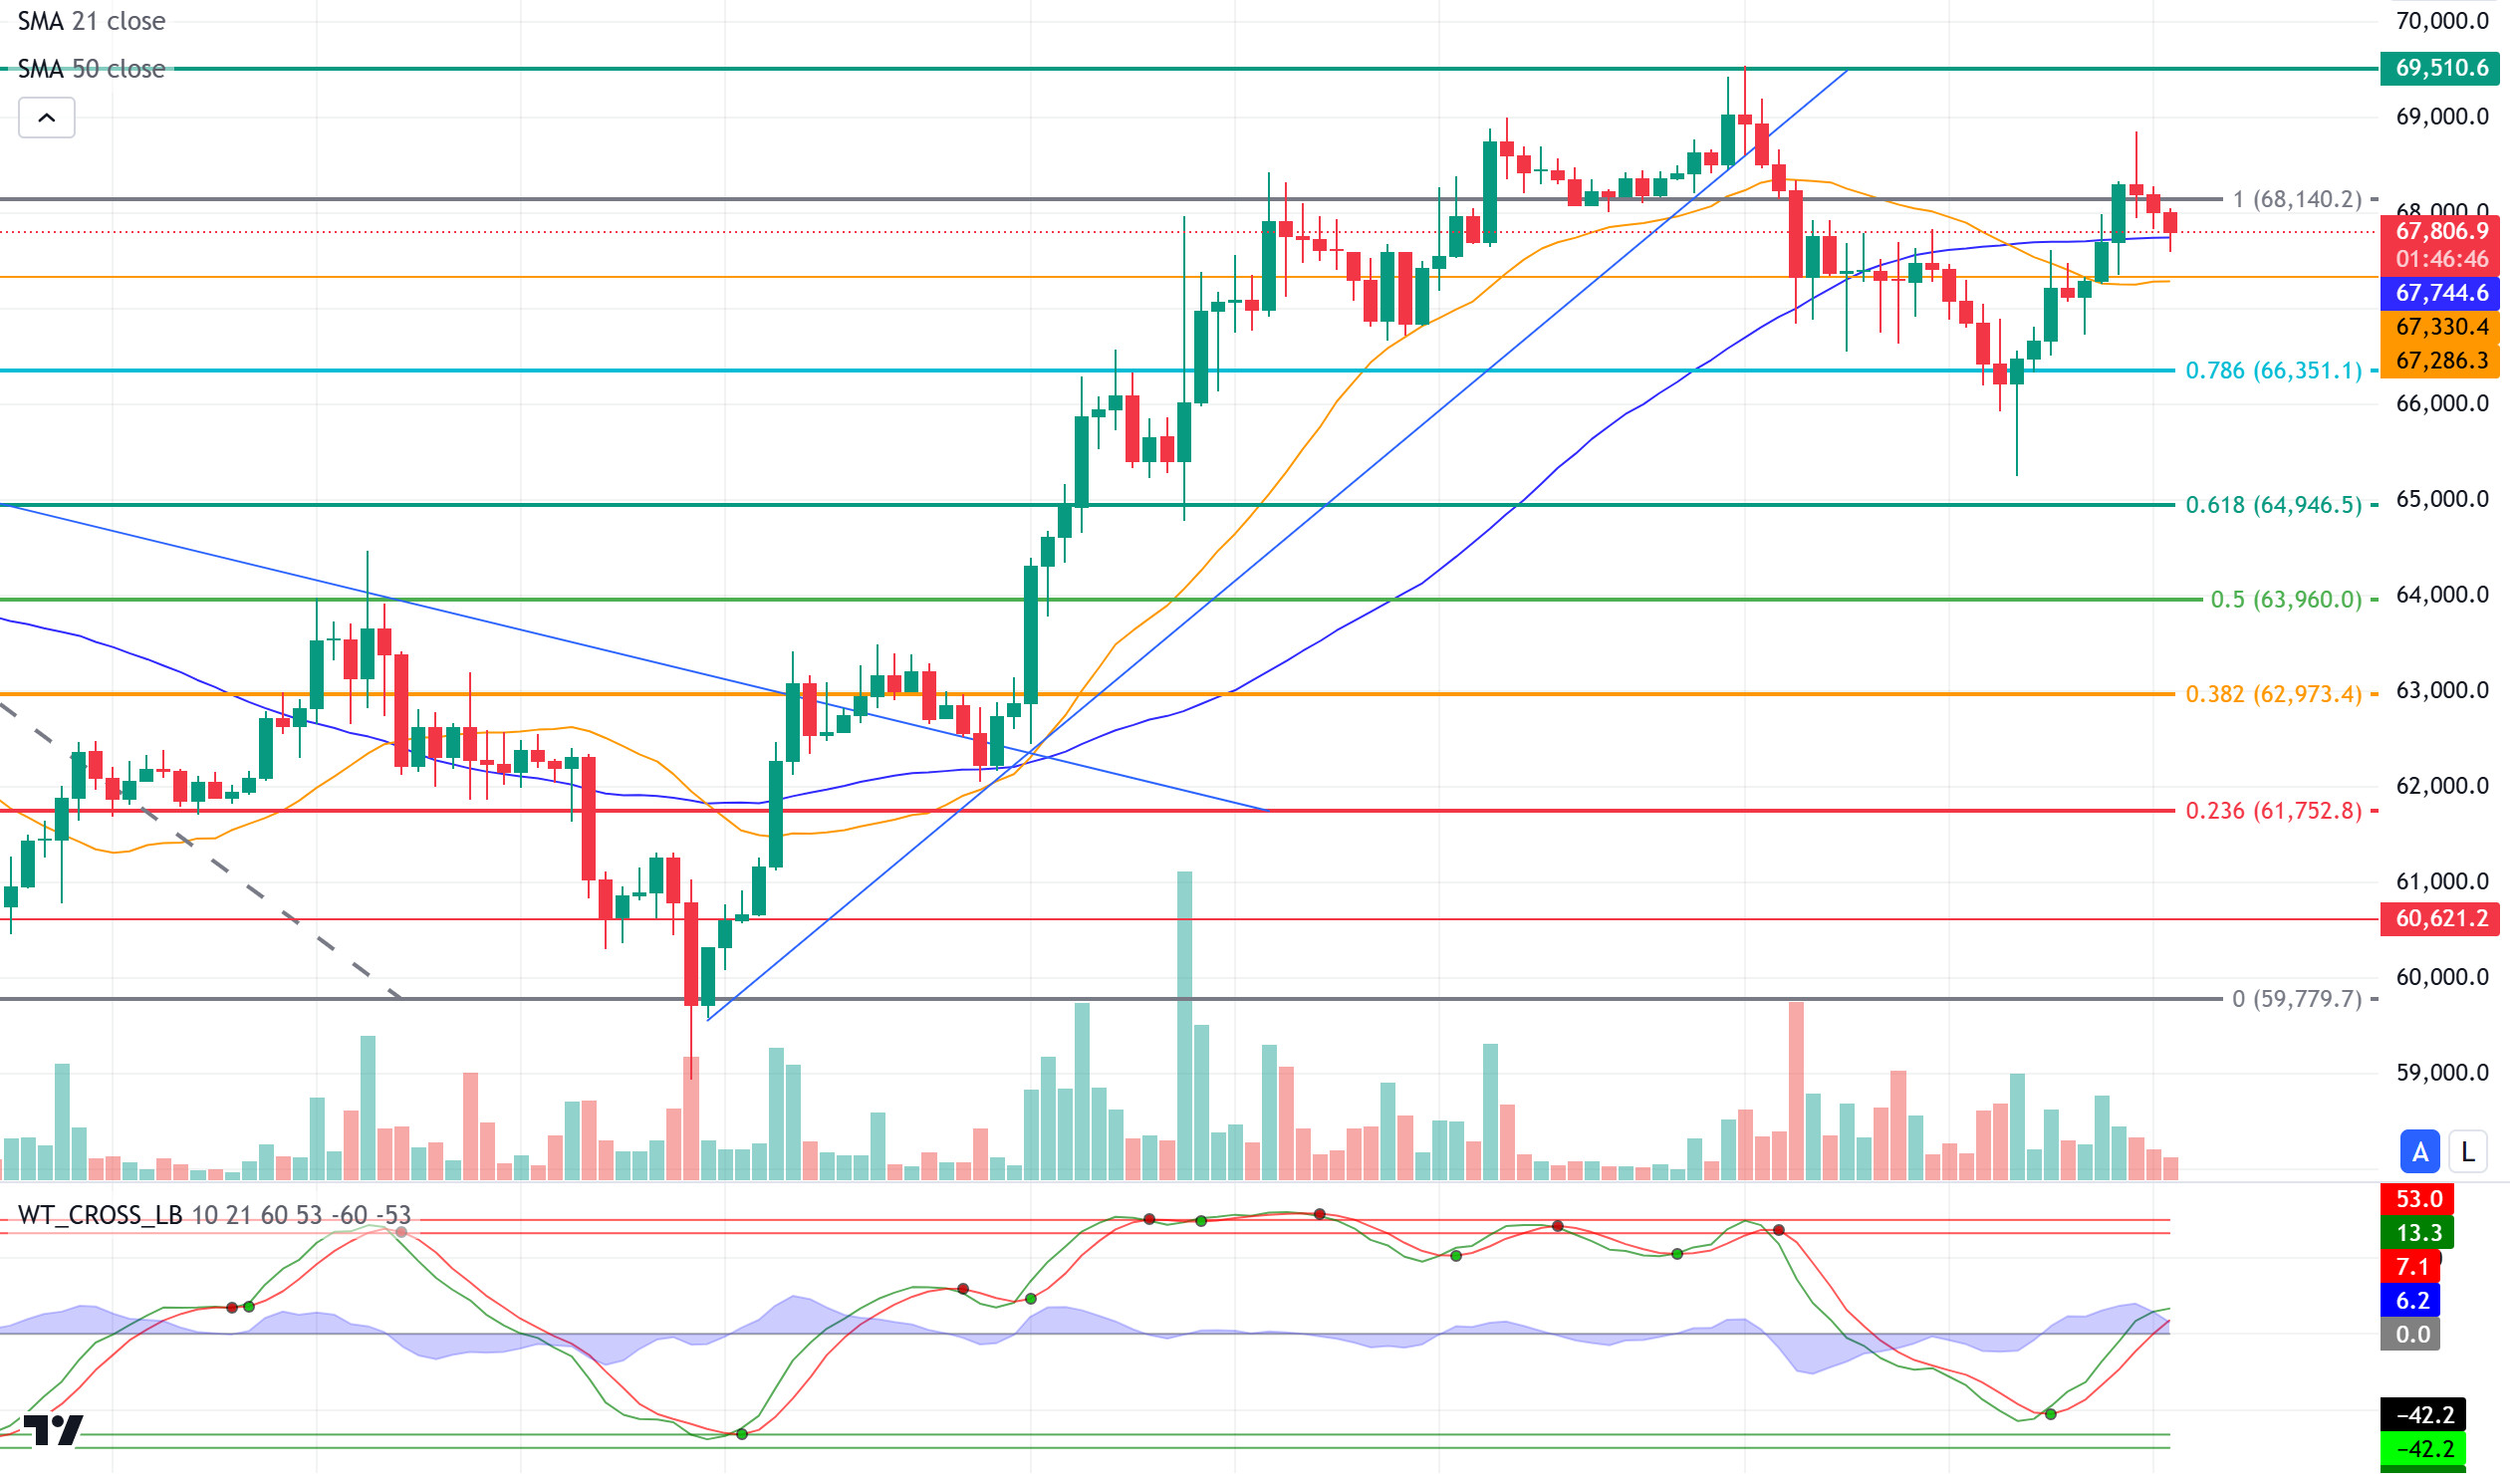
In the BTC technical outlook, the relatively low volatility price turned upwards with the release of unemployment claims. Technical indicators gave buy signals as the technical indicators reached the oversold zone and the 50 SMA (blue line) crossed the 21 SMA (orange line), allowing the resistance level of Fibonacci 1 (68,140) to be crossed and the price pinned the 68,800 level. BTC, which then retreated, is currently priced at 67,770. In the continuation of upward movements, the 69,510 point, which is the level where it peaked with the crossing of the Fibonacci 1 (68,140) level, may be retested. In case of a pullback, the minor support level of 67,330 will be followed.
Supports 67,330 – 66,350 – 64,946
Resistances 68,140 – 69,510 – 71,458
ETH/USDT
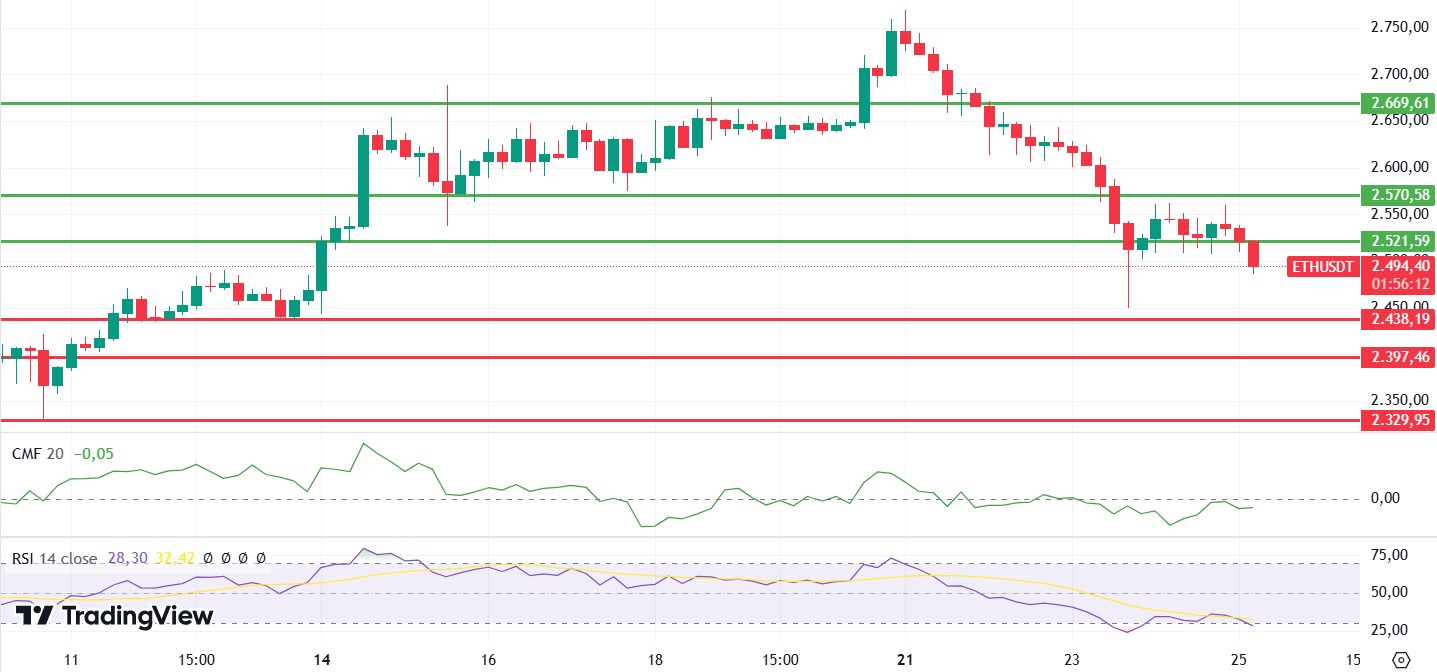
ETH continues to decline as expected. With the break of the 2,521 level, weakness continues to prevail en ETH, which moves downwards. Chaikin Money Flow (CMF) remains en negative territory while moving sideways. Relative Strength Index (RSI) has entered the oversold zone again. The rise en the Long/Short ration to 2,419 and the decline en open positions when looking at the Open Interest data also support the negative outlook, indicating that the decline may continue. The 2,438 level is one of the important support points and deeper declines may come if it breaks. The regain of the 2,571 level may turn the trend back to positive.
Supports 2,438 – 2,397 – 2,329
Resistances 2,521 – 2,571 – 2,669
LINK/USDT
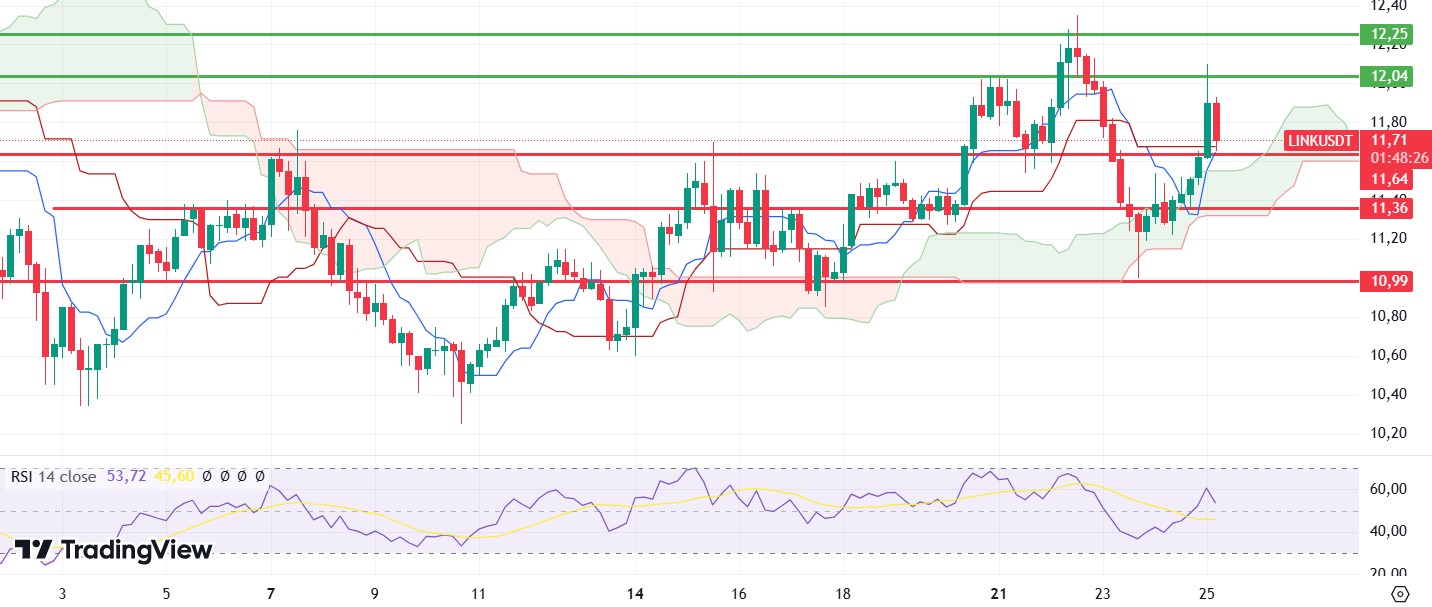
As mentioned en yesterday evening’s analysis, LINK, which rose to 11.64, rose sharply to the next resistance level of 12.04 with the breakout of this level and retreated back to 11.64 levels. Looking at the Ichimoku indicator, while the pricing above the tenkan, kijun and kumo cloud levels looks positive, we see that a reversal signal has occurred en the Relative Strength Index (RSI). Chaikin Money Flow (CMF), el the other hand, maintains its neutral outlook while continuing its horizontal movement. In the light of this data, it may be healthier to evaluate the direction according to the breakdowns for LINK, where we can see horizontal movements en the range of 11.64 – 12.04.
Supports 11.64 – 10.36 – 10.99
Resistances 12.04 – 12.25 – 12.71
SOL/USDT
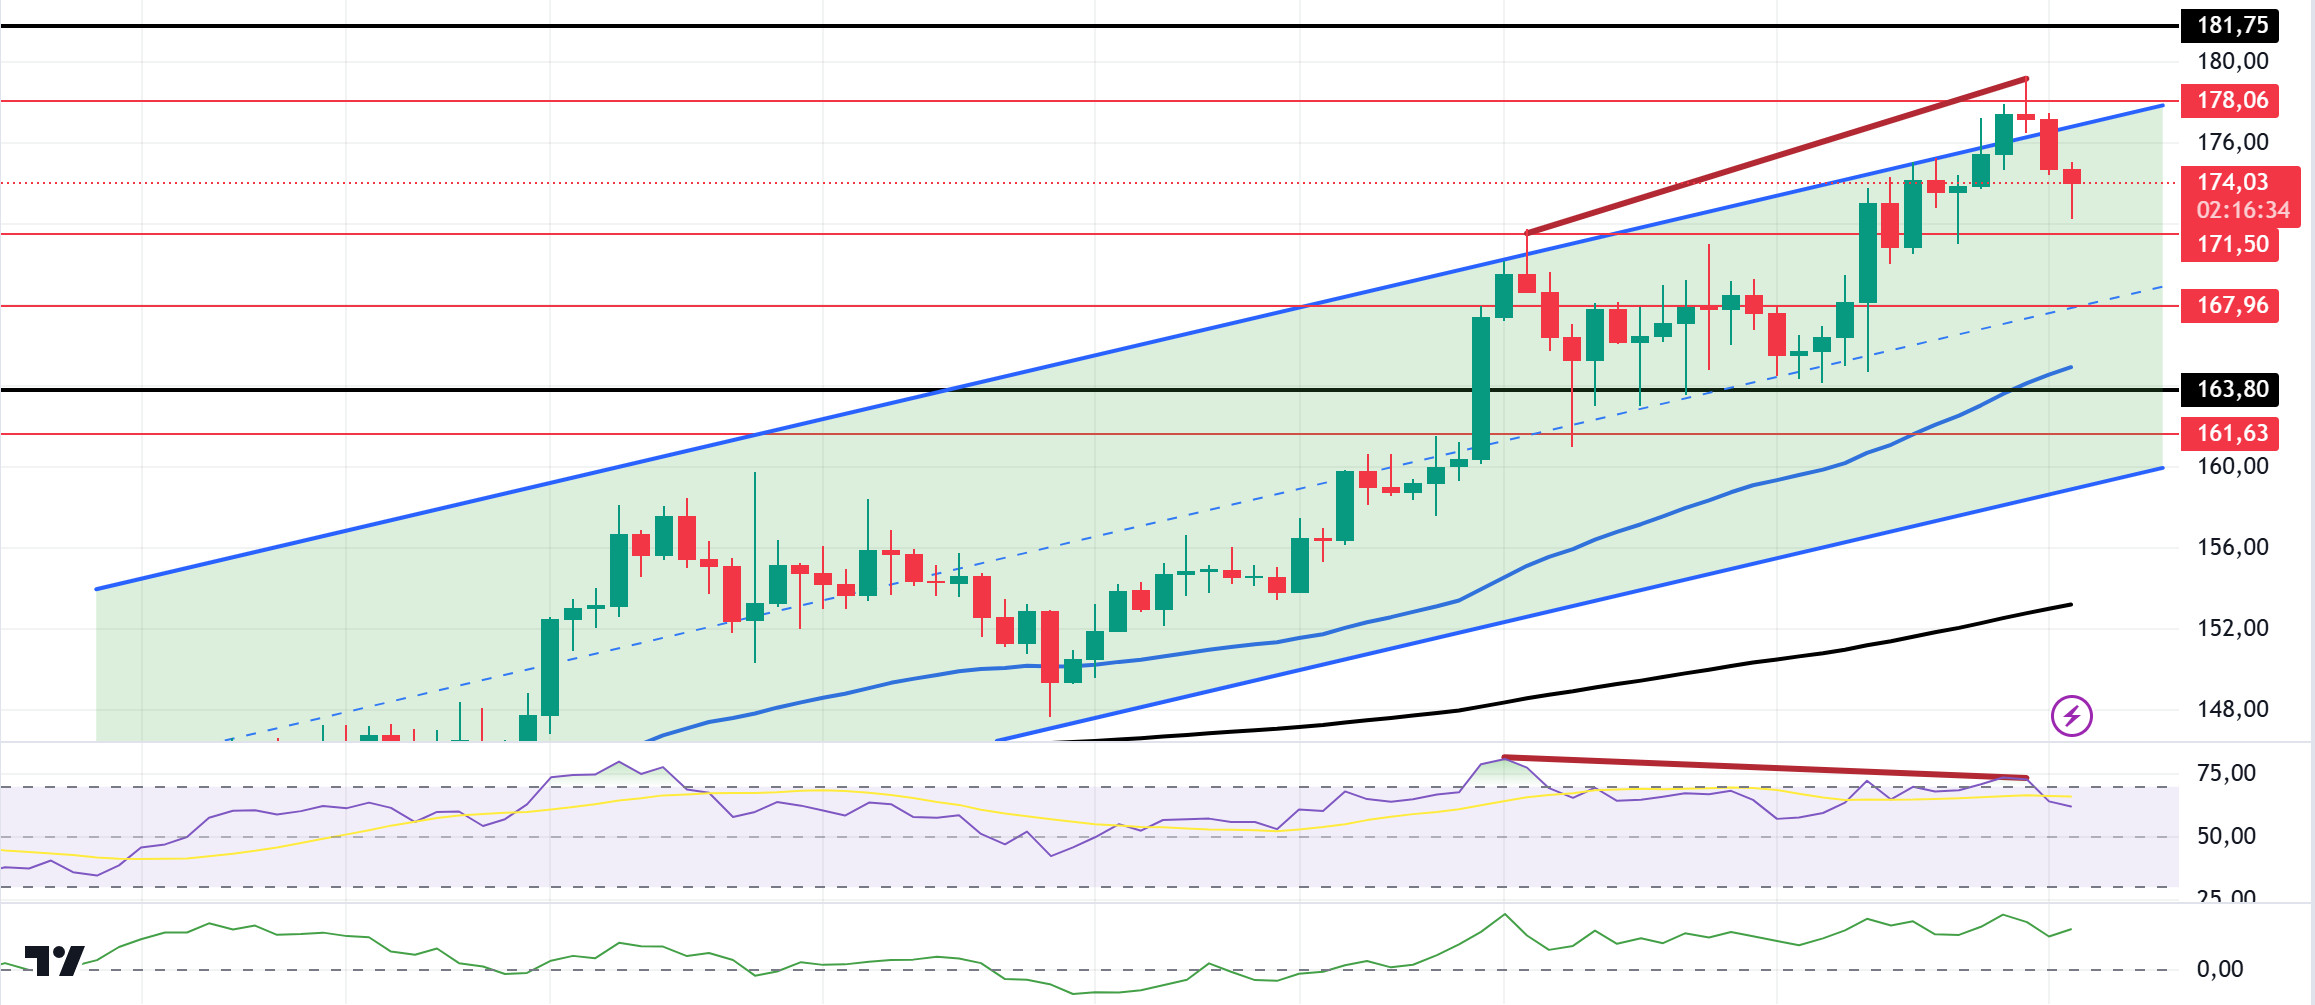
Solana hit a twelve-week high of 179.30, down 3.83% from here. In the ecosystem, MetalCore will utilize Solana Labs’ GameShift platform, which includes a storefront and payment systems for en-game purchases. Game development company Studio369 is moving its mech shooter game MetalCore to the Solana blockchain. According to an announcement made el October 24, the move aims to improve the player experience with faster transactions el the chain. The Solana blockchain currently processes an average of 3,000 transactions per segundo. This is seen as one of the key metrics used to measure the network’s performance. Looking at the chart, the 50 EMA (Blue Line) continues to be above the 200 EMA (Black Line) en the 4-hora timeframe. This may mean that the uptrend will continue. However, the Relative Strength Index (RSI)14 indicator re-entered the overbought levels and a divergence occurred between the price and the indicator. However, Chaikin Money Flow (CMF)20 is at a very strong level. This indicates a large amount of money inflows. This enabled the price to break the top of the uptrend. However, due to the profit selling, it has re-entered the uptrend. The 181.75 level is a very strong resistance point en the uptrend driven por both macroeconomic conditions and innovations en the Solana ecosystem. If it rises above this level, the rise may continue strongly. In case of possible profit sales, support levels 163.80 – 161.63 can be triggered again. If the price comes to these support levels, a potential bullish opportunity may arise.
Supports 171.50 – 167.96 – 163.80
Resistances 178.06 – 181.75 – 186.75
ADA/USDT
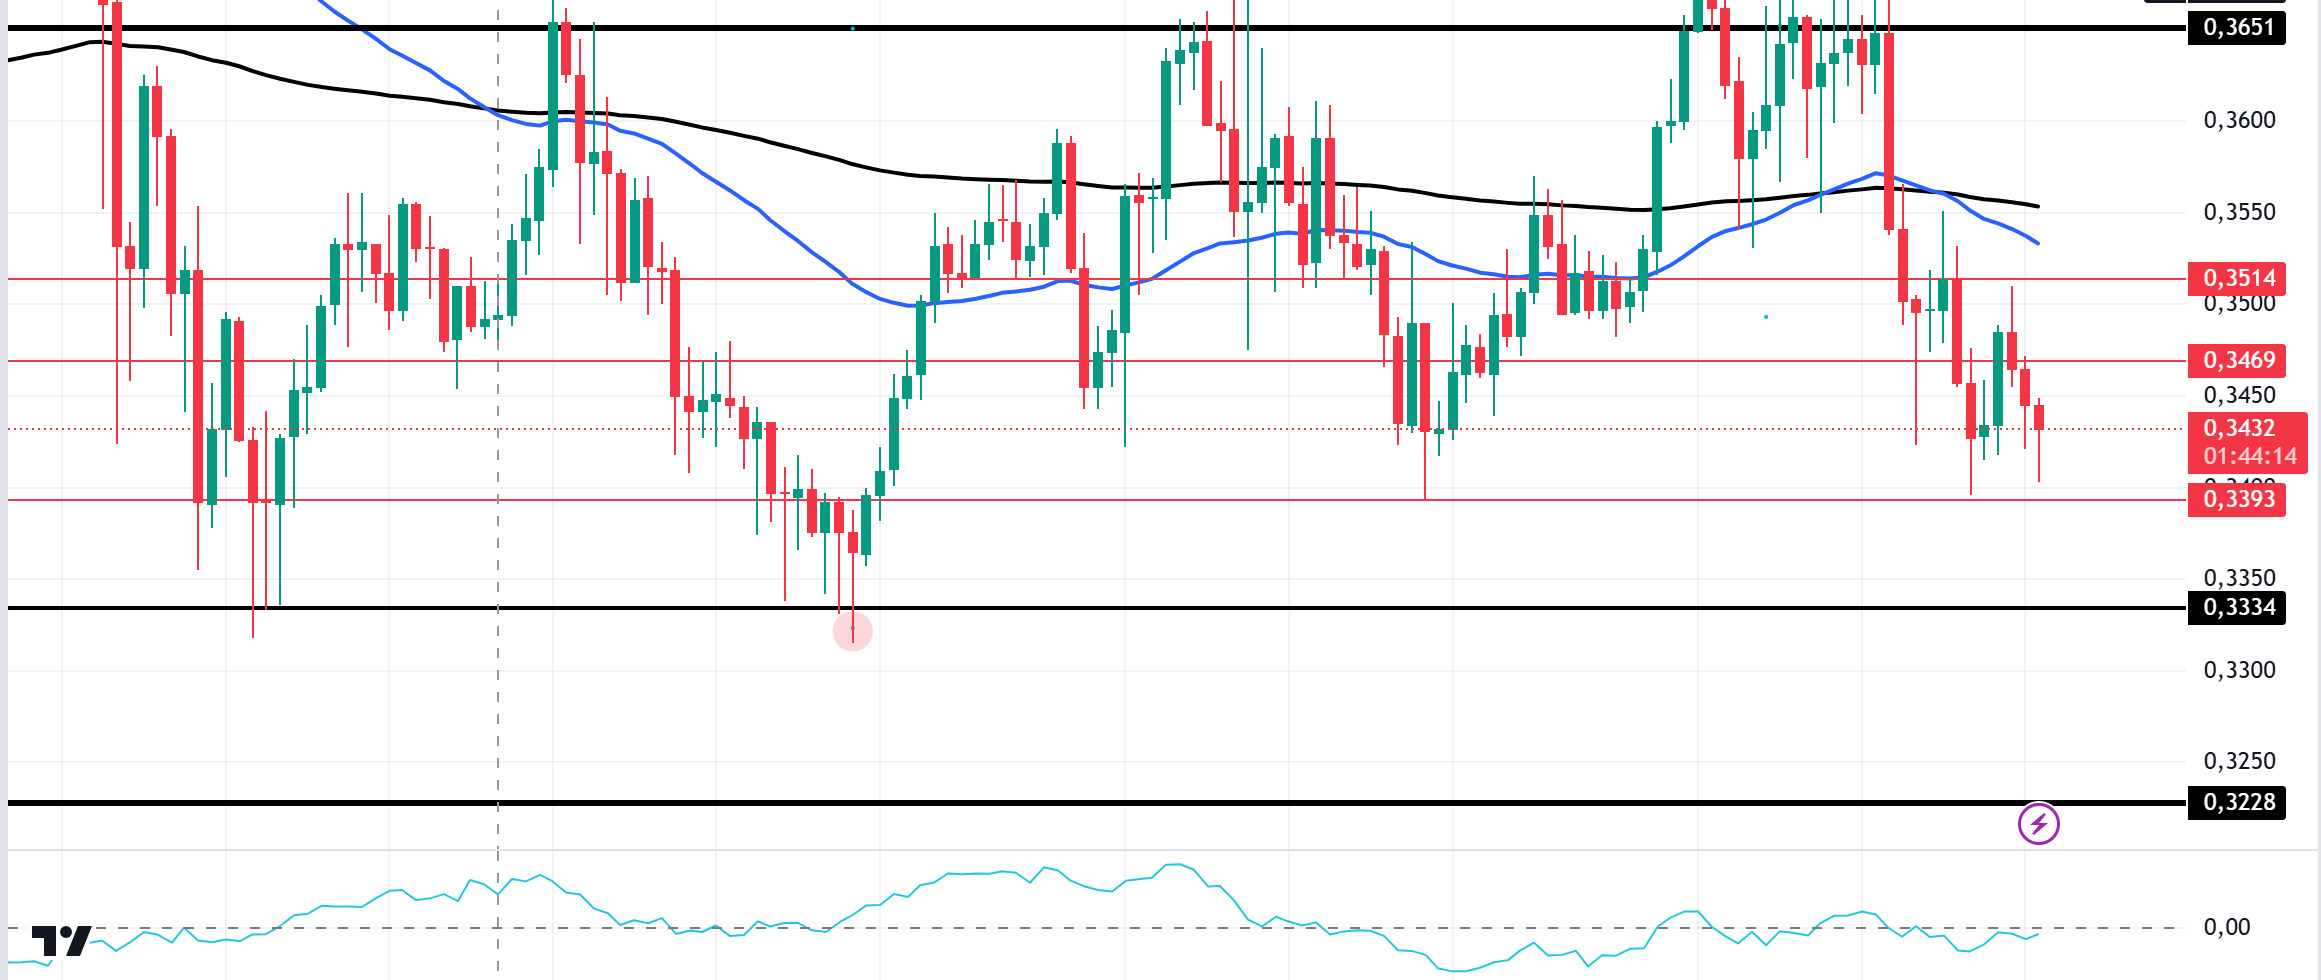
In the Cardano ecosystem, Cardano (ADA) saw a 264% increase en net flows this week, according to IntoTheBlock data. This means that investors are accumulating while ADA consolidates. Another data, Open Interest, fell to a 16-month low, raising fears of a 6.19% price drop. This kept pricing en the area where it has been accumulating since October 1. On the 4-hora chart, the price started pricing below the 50 EMA (Blue Line) and 200 EMA (Black Line). At the same time, the 50 EMA is below the 200 EMA. This suggests that the trend may be bearish. The Chaikin Money Flow (CMF)20 indicator has a negative value. For this reason, we see that there are money outflows. As a matter of fact, ADA, which tested the 0.3651 level for the fourth time, could not break it for this reason. If the decline continues, it may test the support level of 0.3334 once again. It may be appropriate to buy when it reaches this price level.
Supports 0.3393 – 0.3334 – 0.3282
Resistances 0.3469 – 0.3514 – 0.3651
AVAX/USDT
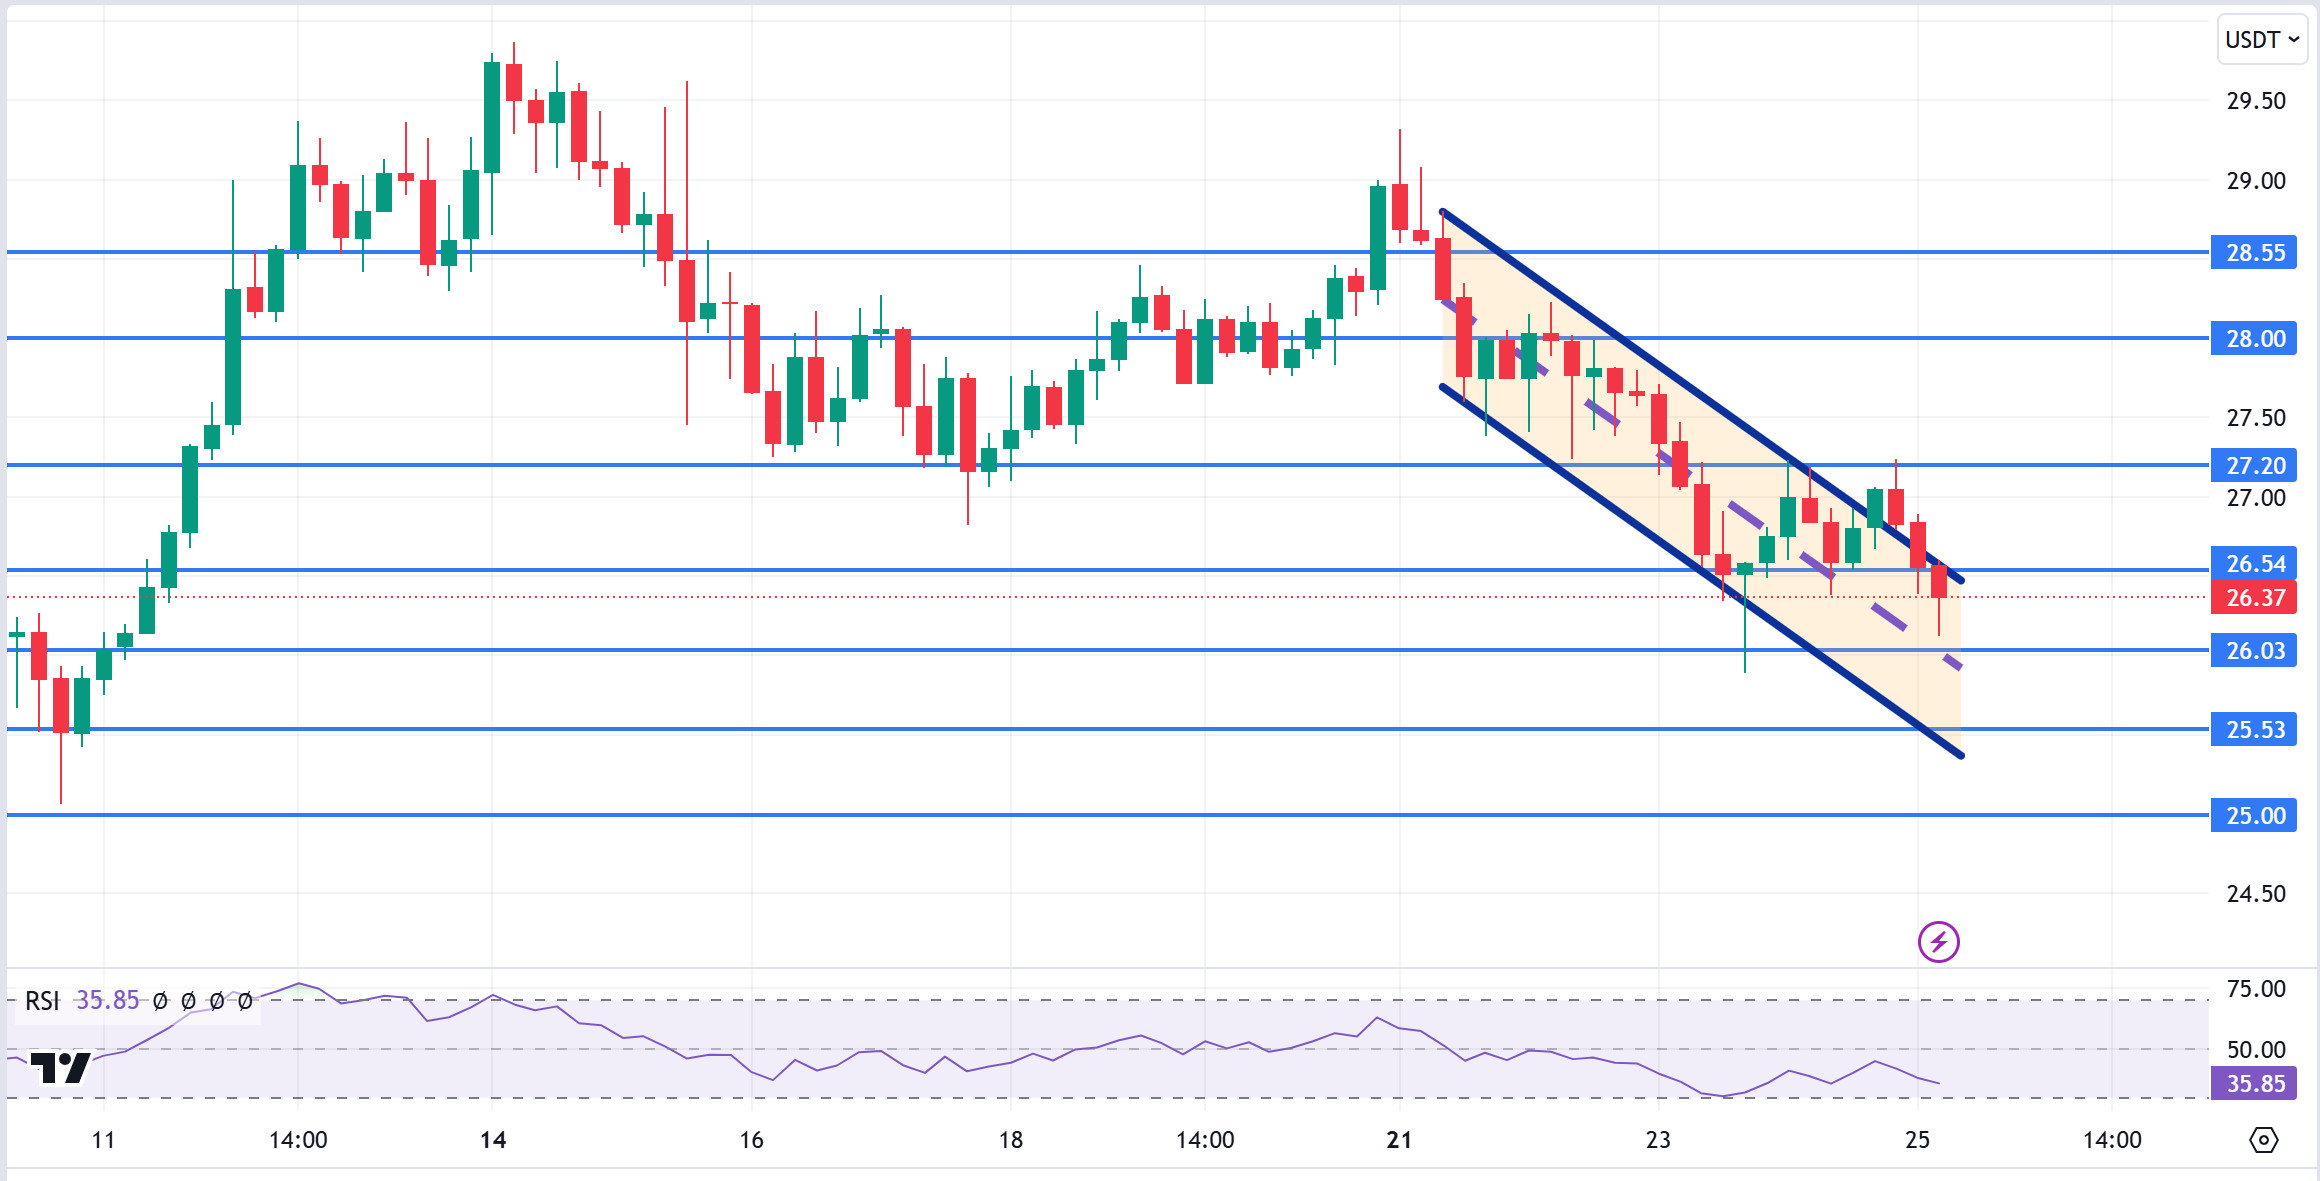
AVAX, which opened yesterday at 26.75, rose slightly during the day and closed the day at 26.83. Today, there is no planned data to be announced especially por the US and expected to affect the market. For this reason, it may be a low-volume day where we may see limited movements. Noticias flows from the Middle East will be important for the market.
AVAX, currently trading at 27.37, is en a bearish channel el the 4-hora chart. The Relative Strength Index value has approached the oversold zone with 35 and can be expected to rise slightly from these levels. In such a case, it may test the 26.54 resistance. With the candle closure above 26.54 resistance, it may want to test the 27.20 resistance por accelerating its rise. On the other hand, sales may increase en case of news of increasing tension en the Middle East. In such a case, it may test 26.03 support. As long as it stays above 25.00 support during the day, the desire to rise may continue. With the break of 25.00 support, sales may increase.
Supports 26.03 – 25.53 – 25.00
Resistances 26.54 – 27.20 – 28.00
TRX/USDT
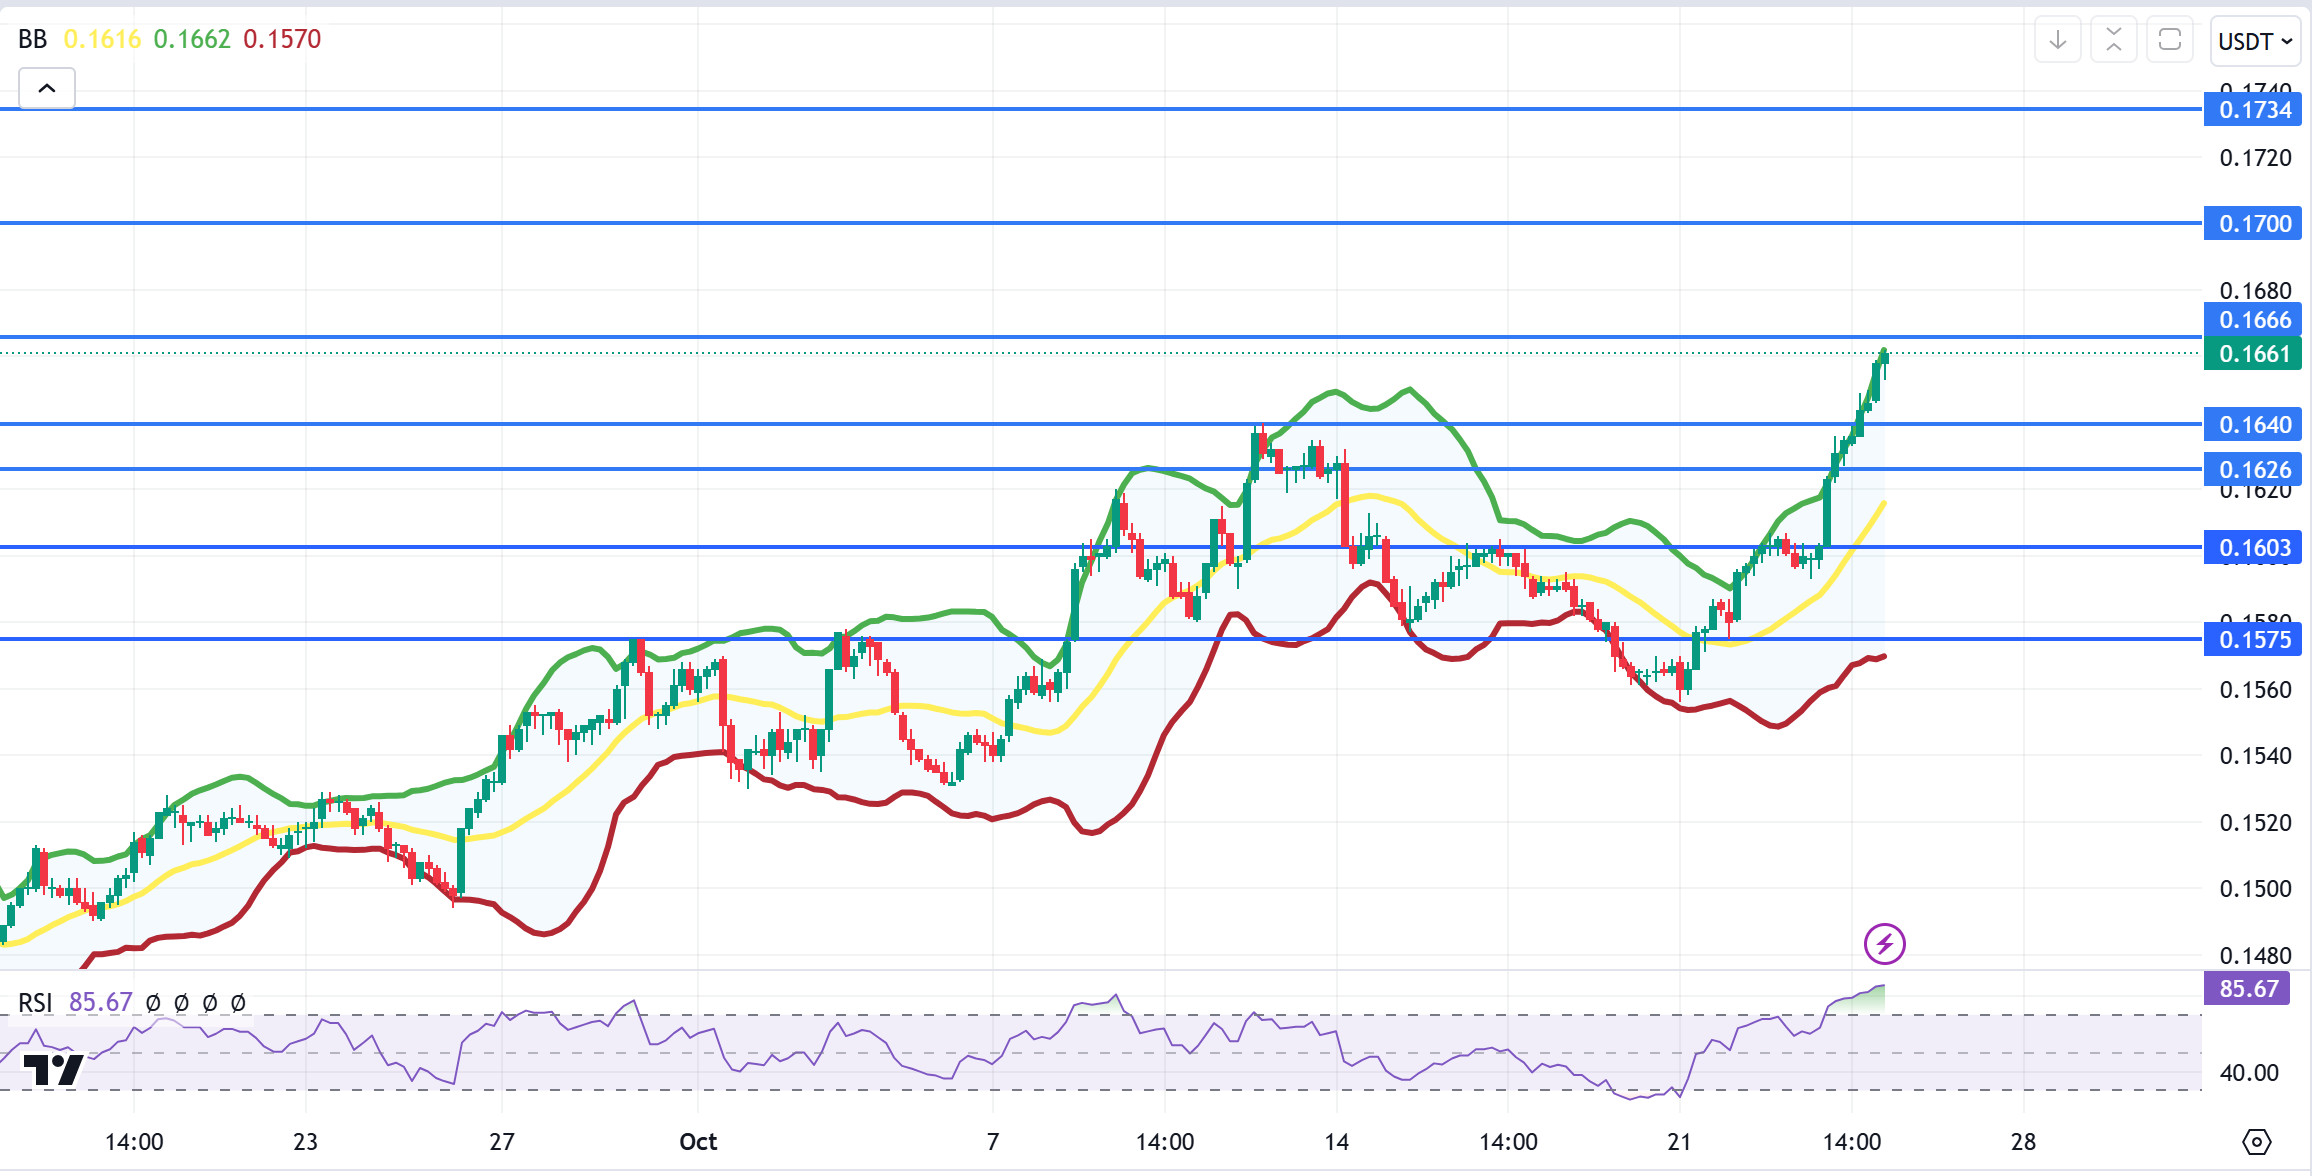
TRX, which started yesterday at 0.1603, increased por about 2.5% during the day and closed the day at 0.1646. There is no scheduled data for the market today. The market will be closely following the news flows regarding the tension en the Middle East.
TRX, currently trading at 0.1661, is located at the Bollinger upper band el the 4-hora chart. The Relative Strength Index value is en the overbought zone with 85 and can be expected to decline slightly from its current level. In such a case, it may move to the Bollinger middle band and test the 0.1640 support. However, it cannot close the candle below 0.1640 support and may test 0.1700 resistance with the buying reaction that will occur if news flow comes that the tension en the Middle East is decreasing. As long as TRX stays above 0.1482 support, the desire to rise may continue. If this support is broken downwards, sales can be expected to increase.
Supports 0.1640 – 0.1626 – 0.1603
Resistances 0.1666 – 0.1700 – 0.1734
DOT/USDT
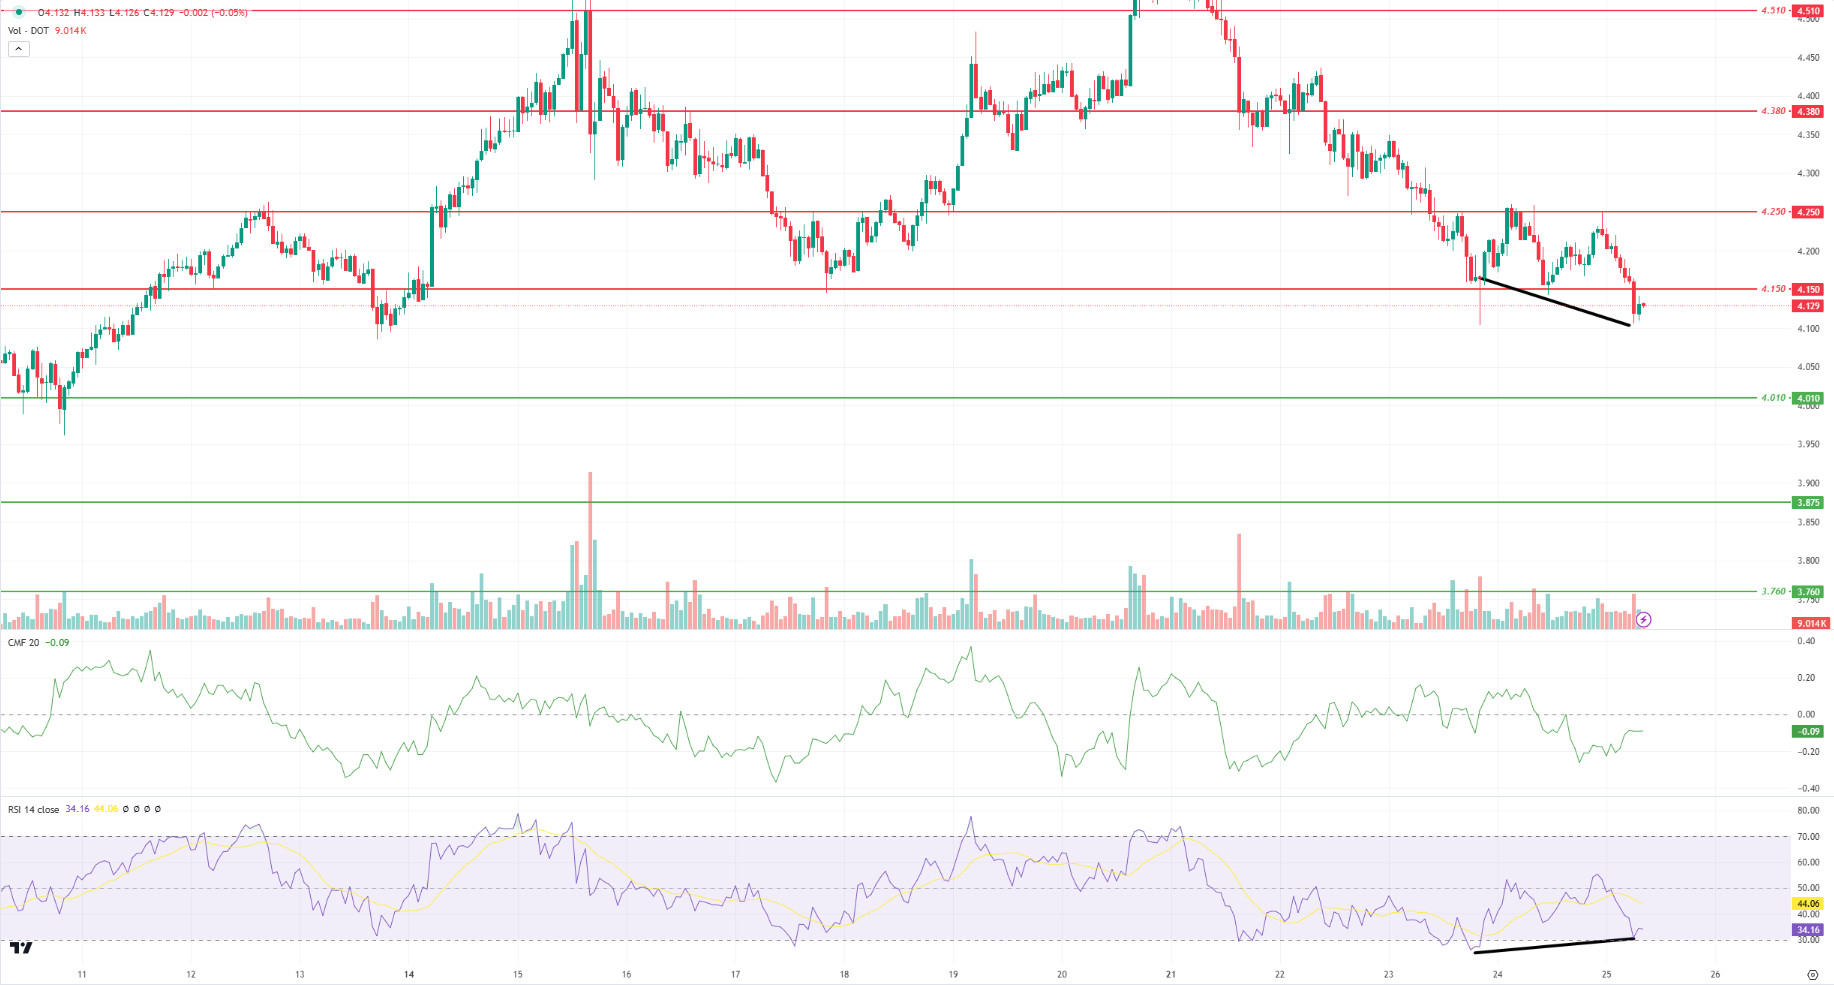
When we examine the Polkadot (DOT) chart, we see that the price lost the support level of 4,150. When we examine the Chaikin Money Flow (CMF) oscillator, we can say that the selling pressure is stronger. If the selling pressure continues, the price may retreat to the 4.010 support band. On the other hand, when we examine the Relative Strenght Index (RSI) oscillator, we see that there is a positive divergence between it and the price. If we evaluate this situation, if the price maintains above the 4.150 level en case of increased buying pressure, it may move towards the next resistance level of 4.250 band.
Supports 4.010 – 3.875 – 3.760
Resistances 4.150 – 4.250 – 4.380
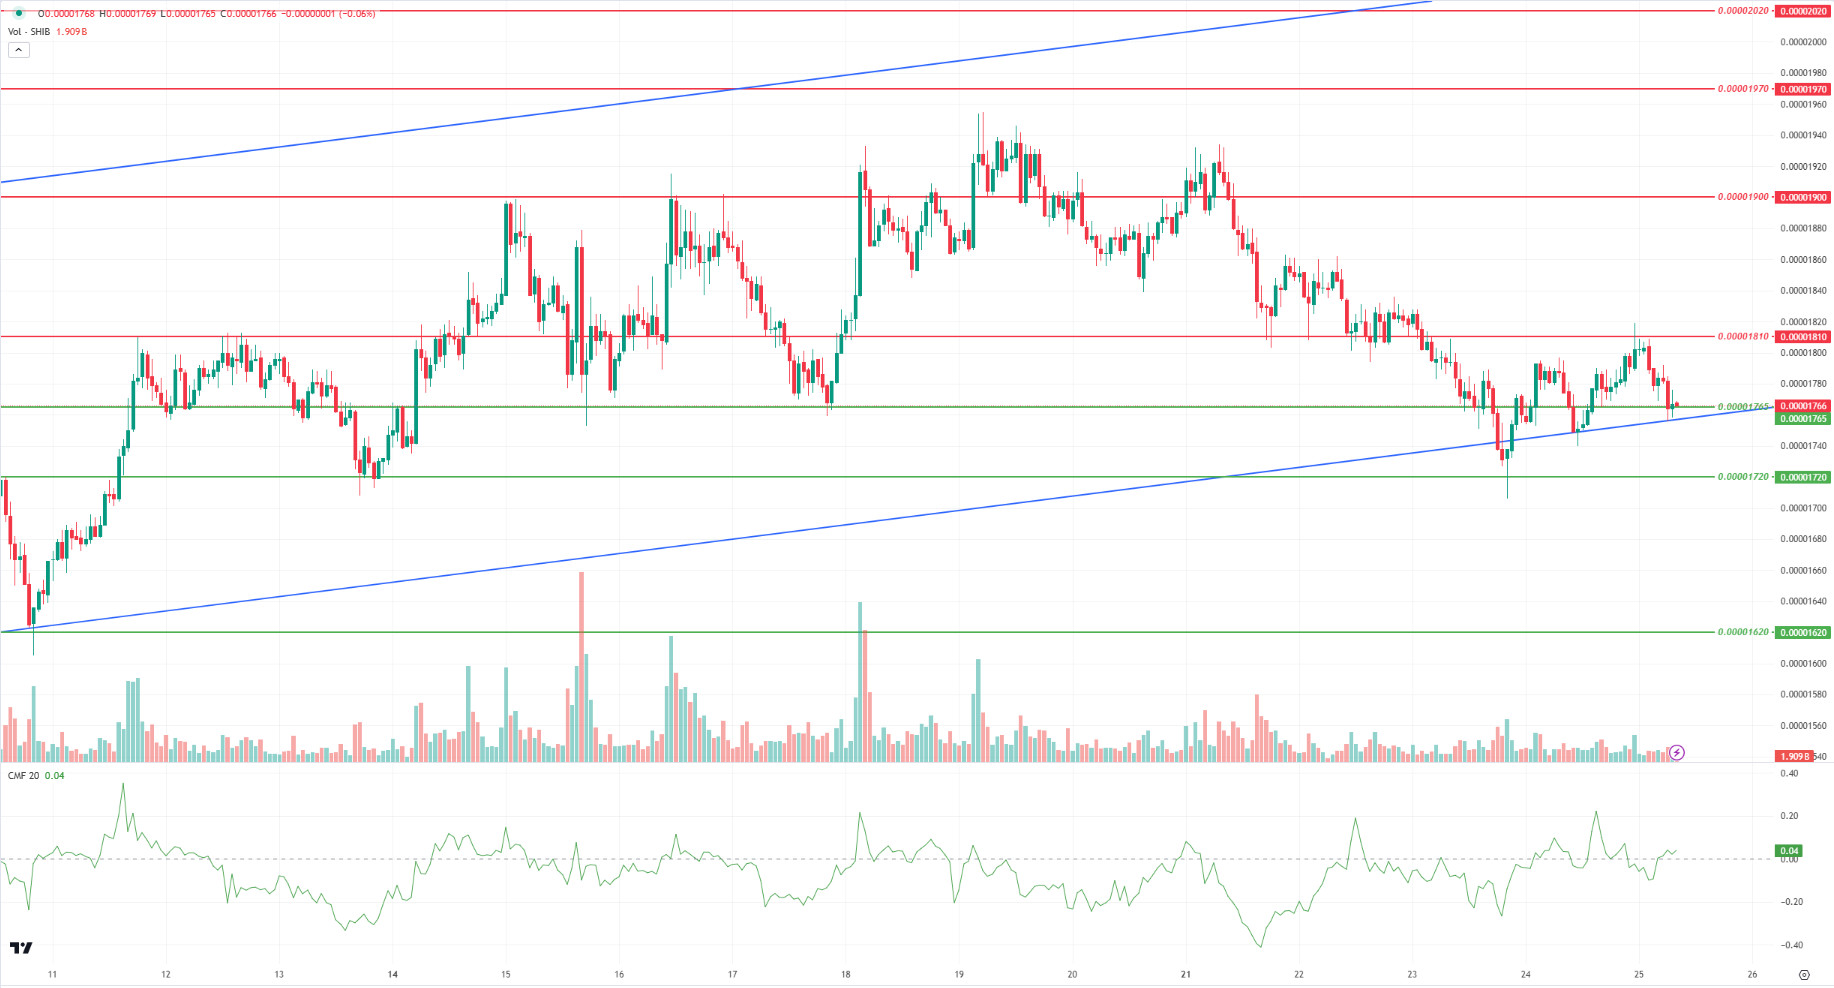
SHIB/USDT
When we examine the Shiba Inu (SHIB) chart, we see that it is at the 0.00001765 support level. When we analyze the Chaikin Money Flow (CMF) oscillator, we can say that the buyer pressure is stronger. In a positive scenario, if the price maintains above the 0.00001765 level, we may see a movement towards the first resistance level of 0.00001810 band. On the other hand, if the lower band of the uptrend breaks, the price may retreat towards 0.00001720 support levels.
Supports 0.00001765 – 0.00001720 – 0.00001620
Resistances 0.00001810 – 0.00001900 – 0.00001970
LEGAL NOTICE
The investment information, comments and recommendations contained herein do not constitute investment advice. Investment advisory services are provided individually por authorized institutions taking into account the risk and return preferences of individuals. The comments and recommendations contained herein are of a general nature. These recommendations may not be suitable for your financial situation and risk and return preferences. Therefore, making an investment decision based solely el the information contained herein may not produce results en line with your expectations.

