
MARKET SUMMARY
Latest Situation en Crypto Assets
*Prepared el 16.09.2024 at 07:00 (UTC)
WHAT’S LEFT BEHIND
Former President Donald Trump Safe After Second Assassination Attempt
Shots were fired near former President Donald Trump’s golf club en Florida, but no one was harmed and a suspect was taken into custody after the incident. The FBI and Secret Service are investigating what is believed to be an assassination attempt, and the suspect is said to have made pro-Ukrainian posts el the X platform.
MicroStrategy Expands Bitcoin Portfolio por $1.1 Billion
MicroStrategy bought 18,300 BTC to expand its Bitcoin portfolio, totaling $1.1 billion. The company raised funds to finance this investment por selling over 8 million shares. With this purchase, MicroStrategy’s total Bitcoin holdings reached 244,800, valued at around $14 billion.
The Whale Who Bought $ 195 Million Bitcoin (BTC) Made His New Move!
As the price of Bitcoin continues to hover just barely above $60,000, some major cryptocurrency whales are making notable trades. According to Onchain data, a major cryptocurrency whale recently moved 119 BTC worth $7.14 million to Binance.
HIGHLIGHTS OF THE DAY
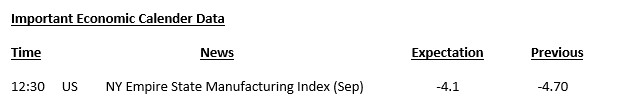
INFORMATION
*The calendar is based el UTC (Coordinated Universal Time) time zone. The economic calendar content el the relevant page is obtained from reliable news and data providers. The news en the economic calendar content, the date and time of the announcement of the news, possible changes en the previous, expectations and announced figures are made por the data provider institutions. Darkex cannot be held responsible for possible changes that may arise from similar situations.
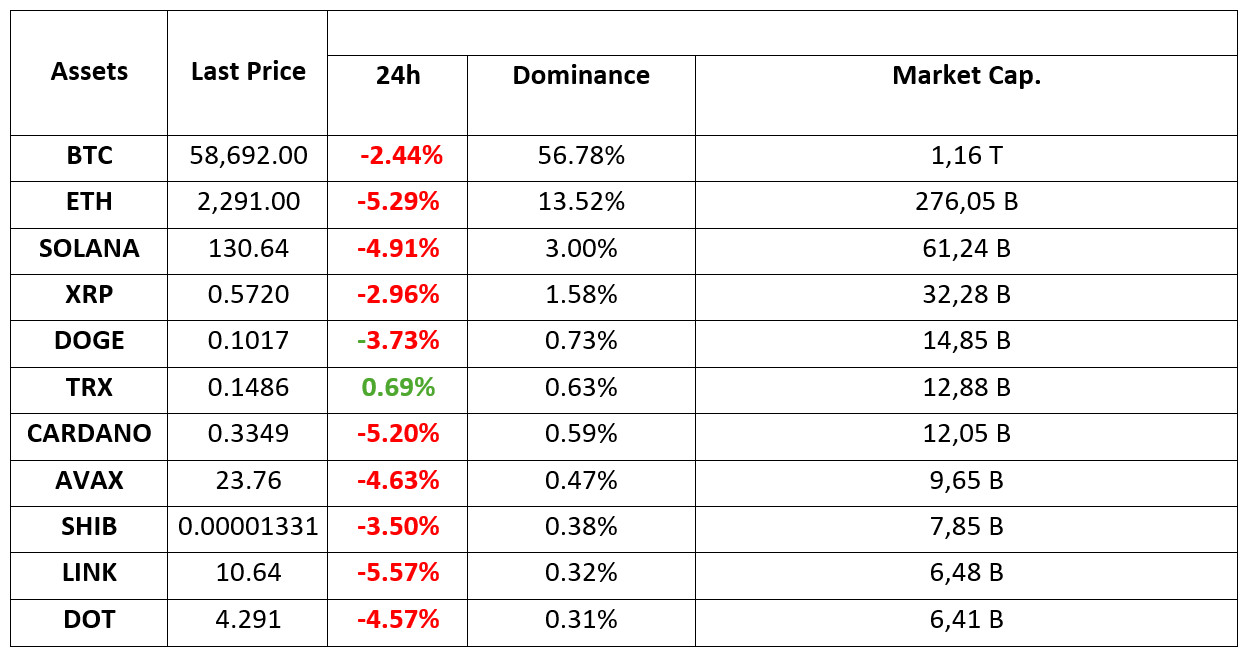
MARKET COMPASS
Global markets are starting a critical week. The focus will be el how much the Federal Open Market Committee (FOMC) will cut interest rates at its two-day meeting, which will conclude el Wednesday evening. Ahead of the meeting, Asian markets were mixed with the stock markets of major economies such as Japan and China closed, while European indices are expected to start the day slightly negative. The outlook for US futures is no different.
According to the CME FedWatch Tool, the expectation that the US Federal Reserve (FED) will cut interest rates por 50 basis points el September 18 seems to have gained weight (for now) with the new week. According to the last calculations el Friday, this was distributed as 50-50%. As the expectation of a larger rate cut came to the fore, the dollar depreciated. However, it is hard to say that this positively reflected el digital assets por running the classic equation. In addition, it should not be ignored that the FED’s first interest rate cut en four years with a big step of 50 basis points may trigger a concern that things are not really going well en the US economy. For now, we can say that the weakness en the dollar has an impact el assets such as gold en traditional markets.
The markets started the new week with FOMC expectations, unsatisfactory macro data from China and a new assassination attempt (seemingly) el US Presidential candidate Trump. This may indicate that investors are trying to avoid taking big risks while still seeing the possibility of a 50 basis point rate cut por the Fed el the table. This imbalance is likely to be corrected at some point por a break en tensions, but it is important to note that this could not only be driven por the rise of crypto assets, but also por the dollar potentially recovering its recent losses.
TECHNICAL ANALYSIS
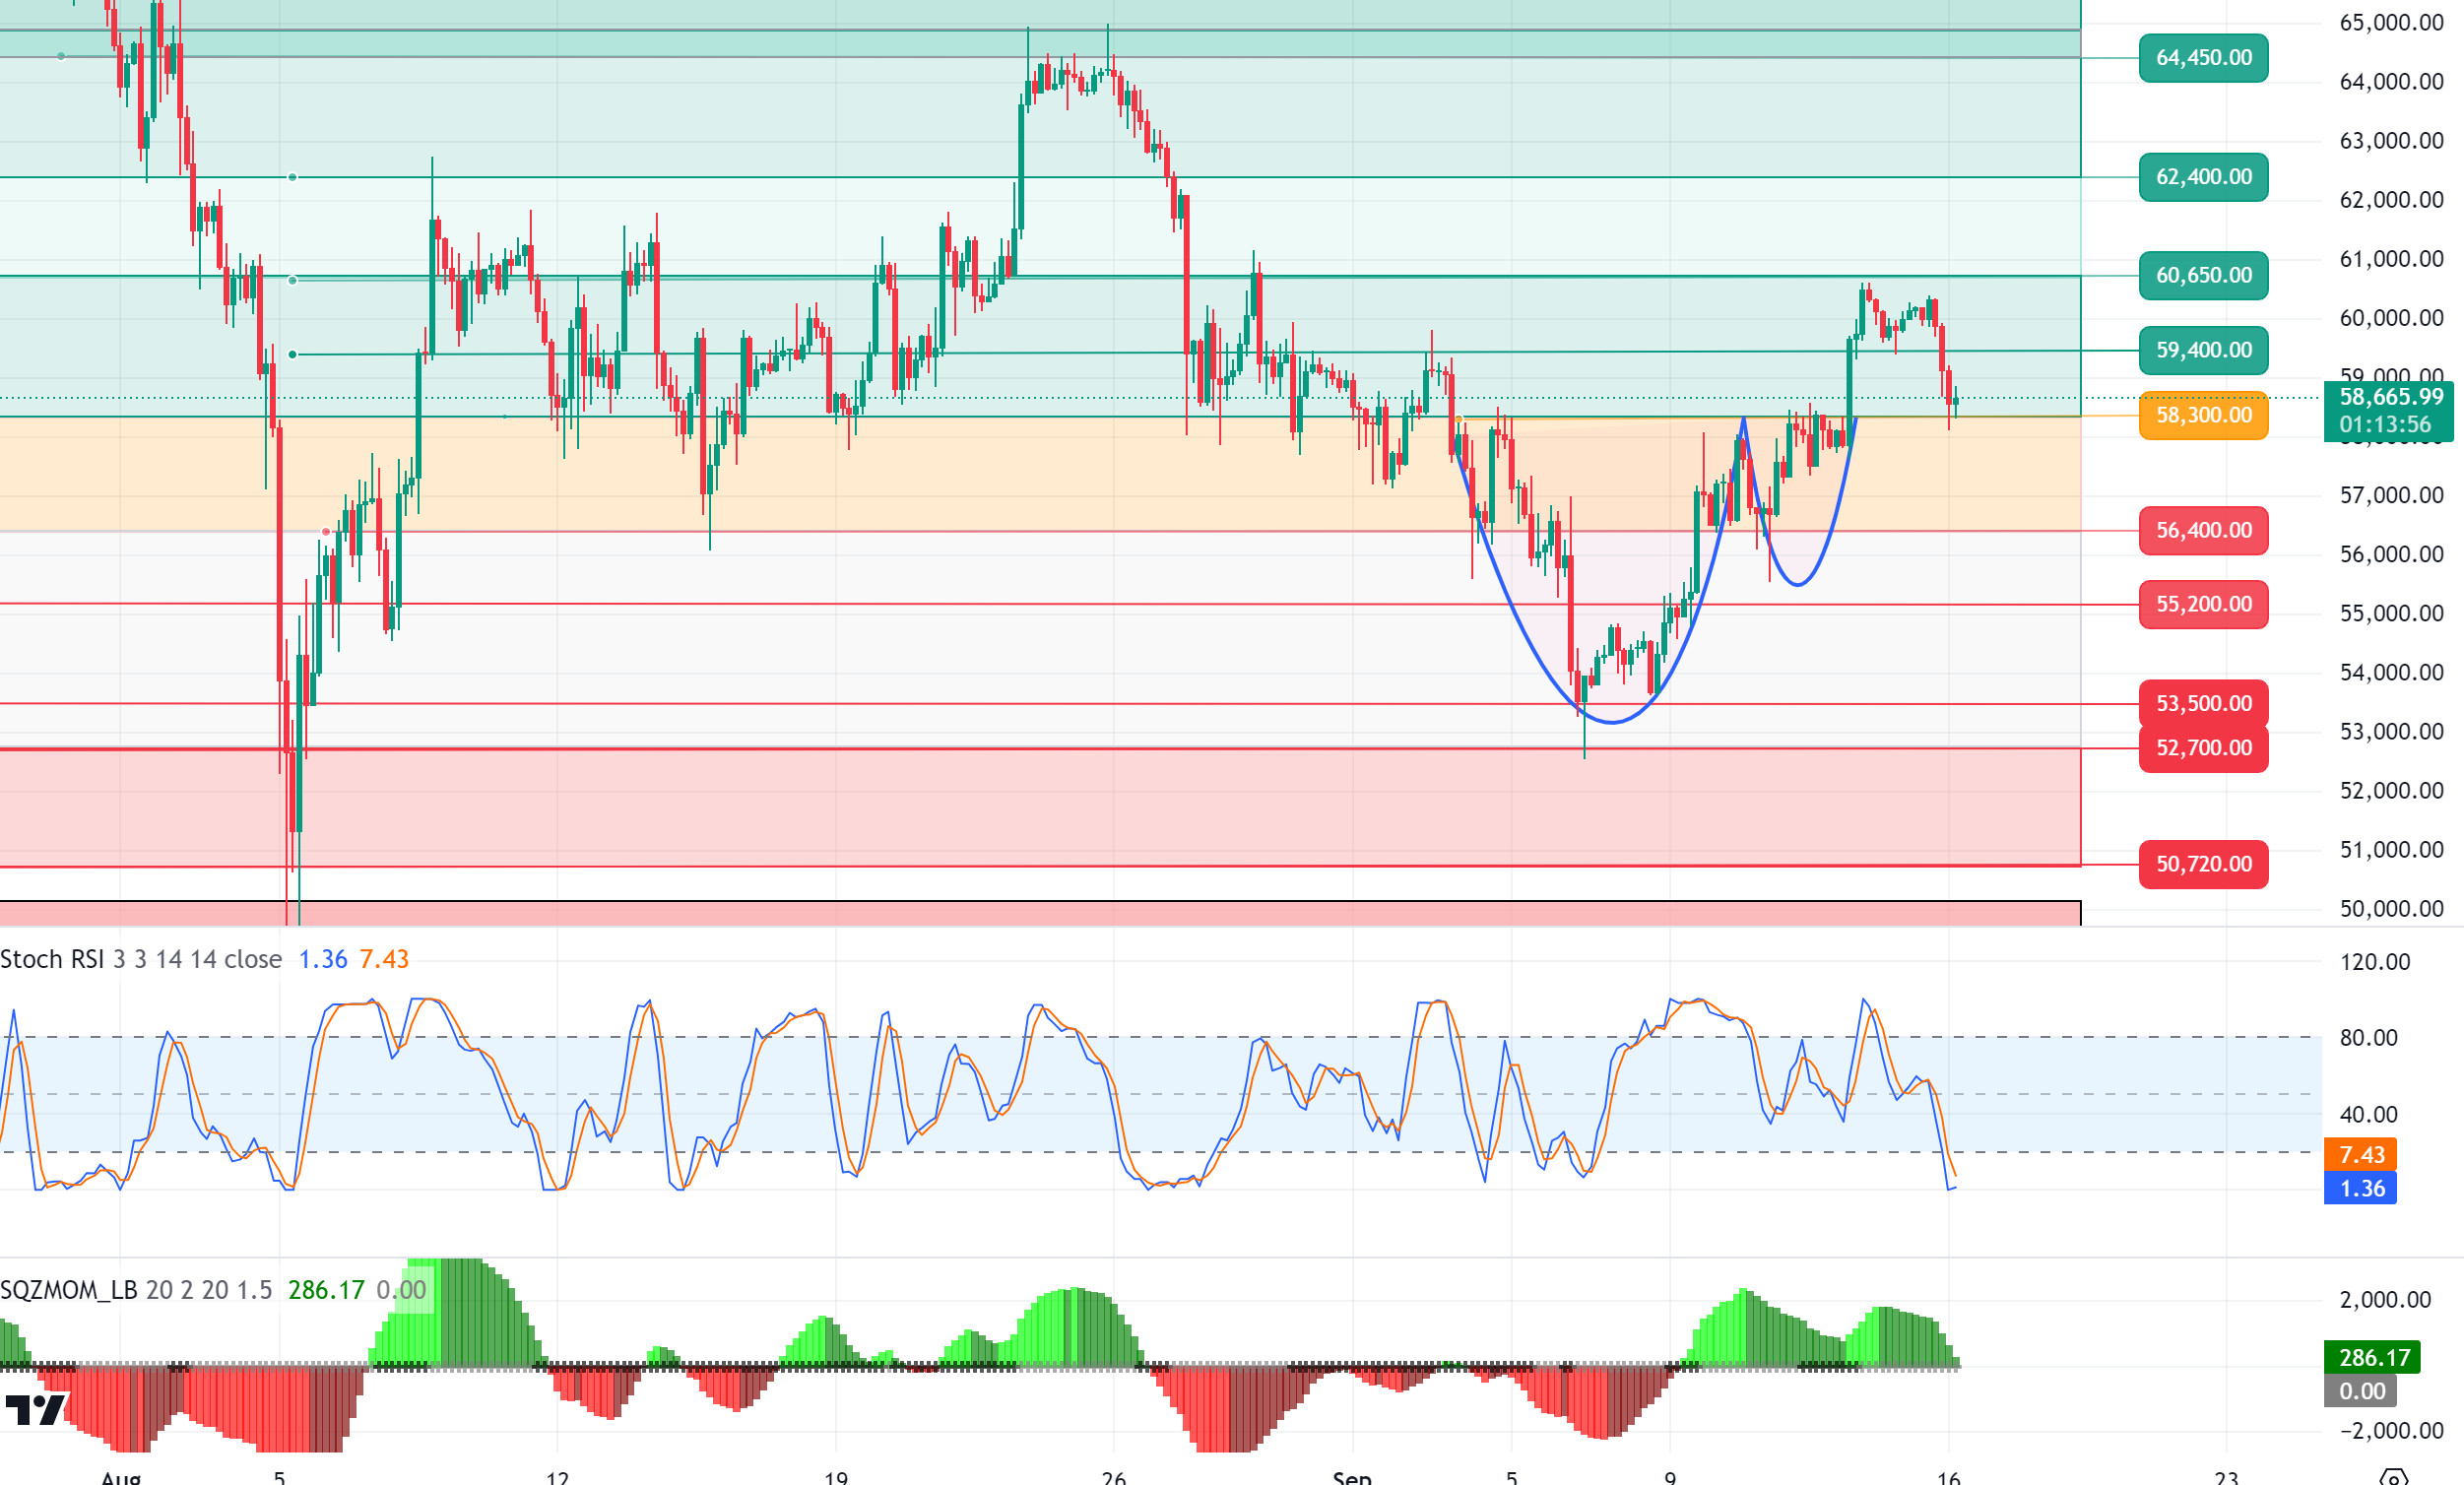
BTC/USDT
As we start the critical week! Bitcoin fell as markets await the FED’s interest rate cut decision. Bitcoin, which displayed a volatile image over the weekend, retreated to 58,300 after the incident at the golf club, which was recorded as a segundo assassination attempt of Presidential candidate Donald Trump last night. The statements to be made por D. Trump, who will appear at the “World Liberty Financial” event at midnight tonight, have become a matter of curiosity. In its 4-hora technical analysis, BTC realized a 7% increase en the last week, rising from 55,000 levels to the psychological resistance level of 60,650 levels. However, this surge was short-lived and the price fell 3% from a level just above 60,000 to the 58,300 support point. BTC, which is currently priced at 58,700 above the support point, we see that it has turned its direction up again with the RSI coming to the oversold zone. With pricing above the support point of 58,300, the 60,650 resistance zone can be targeted again. In the opposite scenario, the decline may deepen with 4-hora closures below the support point, and en this possibility, the next support point, the 56,400 level, may appear.
Supports: 58,300- 57,200 – 56,400
Resistances 59,400 – 60,650 – 62,400
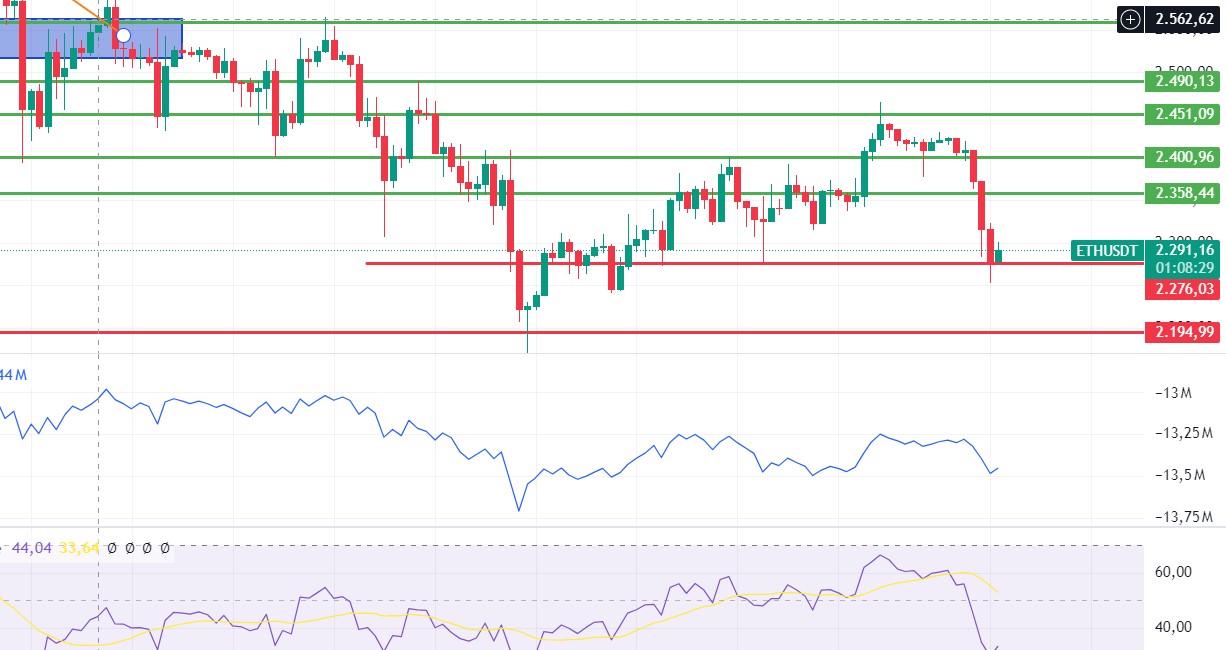
ETH/USDT
The blood loss en Ethereum continues. Although the Ethereums that companies such as Metalpha withdrew to exchanges last week are still not sold, the fear continues. With the inadequacy of spot buy order books, the decline seems to have come jointly from the futures and spot side. On the technical side, the positive mismatch en the OBV draws attention. At the same time, the RSI’s net return from the oversold zone, along with the positive structure en CMF el the hourly timeframe, may bring some upward movement. Exceeding the 2,358 level may bring the price back to the 2,400-2,450 band. The 2,276 level is the most important support point and if it breaks, it may cause a decline to 2,195 levels.
Supports 2,276 – 2,195 – 2,112
Resistances 2,358 – 2,400 – 2,451
LINK/USDT
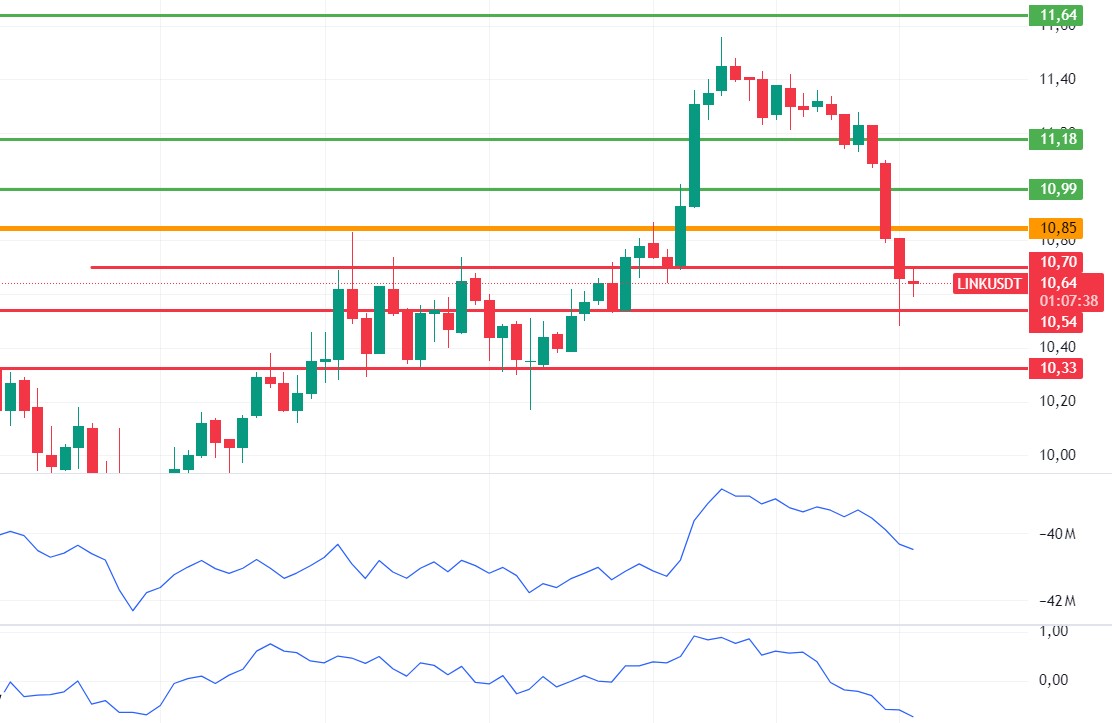
There is a positive OBV mismatch el LINK, very similar to Ethereum. However, it seems to have started a downtrend with the loss of the 10 .70 level. Especially with the decline en momentum, it seems likely to receive inadequate reactions even when the markets become positive. For this reason, unless 10.70 is regained, we may see some further pullbacks en the price. Gaining the 10.70 level can start the positive trend again.
Supports 10.54 – 10.33 – 9.83
Resistances 10.70 – 10.85 – 10.99
SOL/USDT
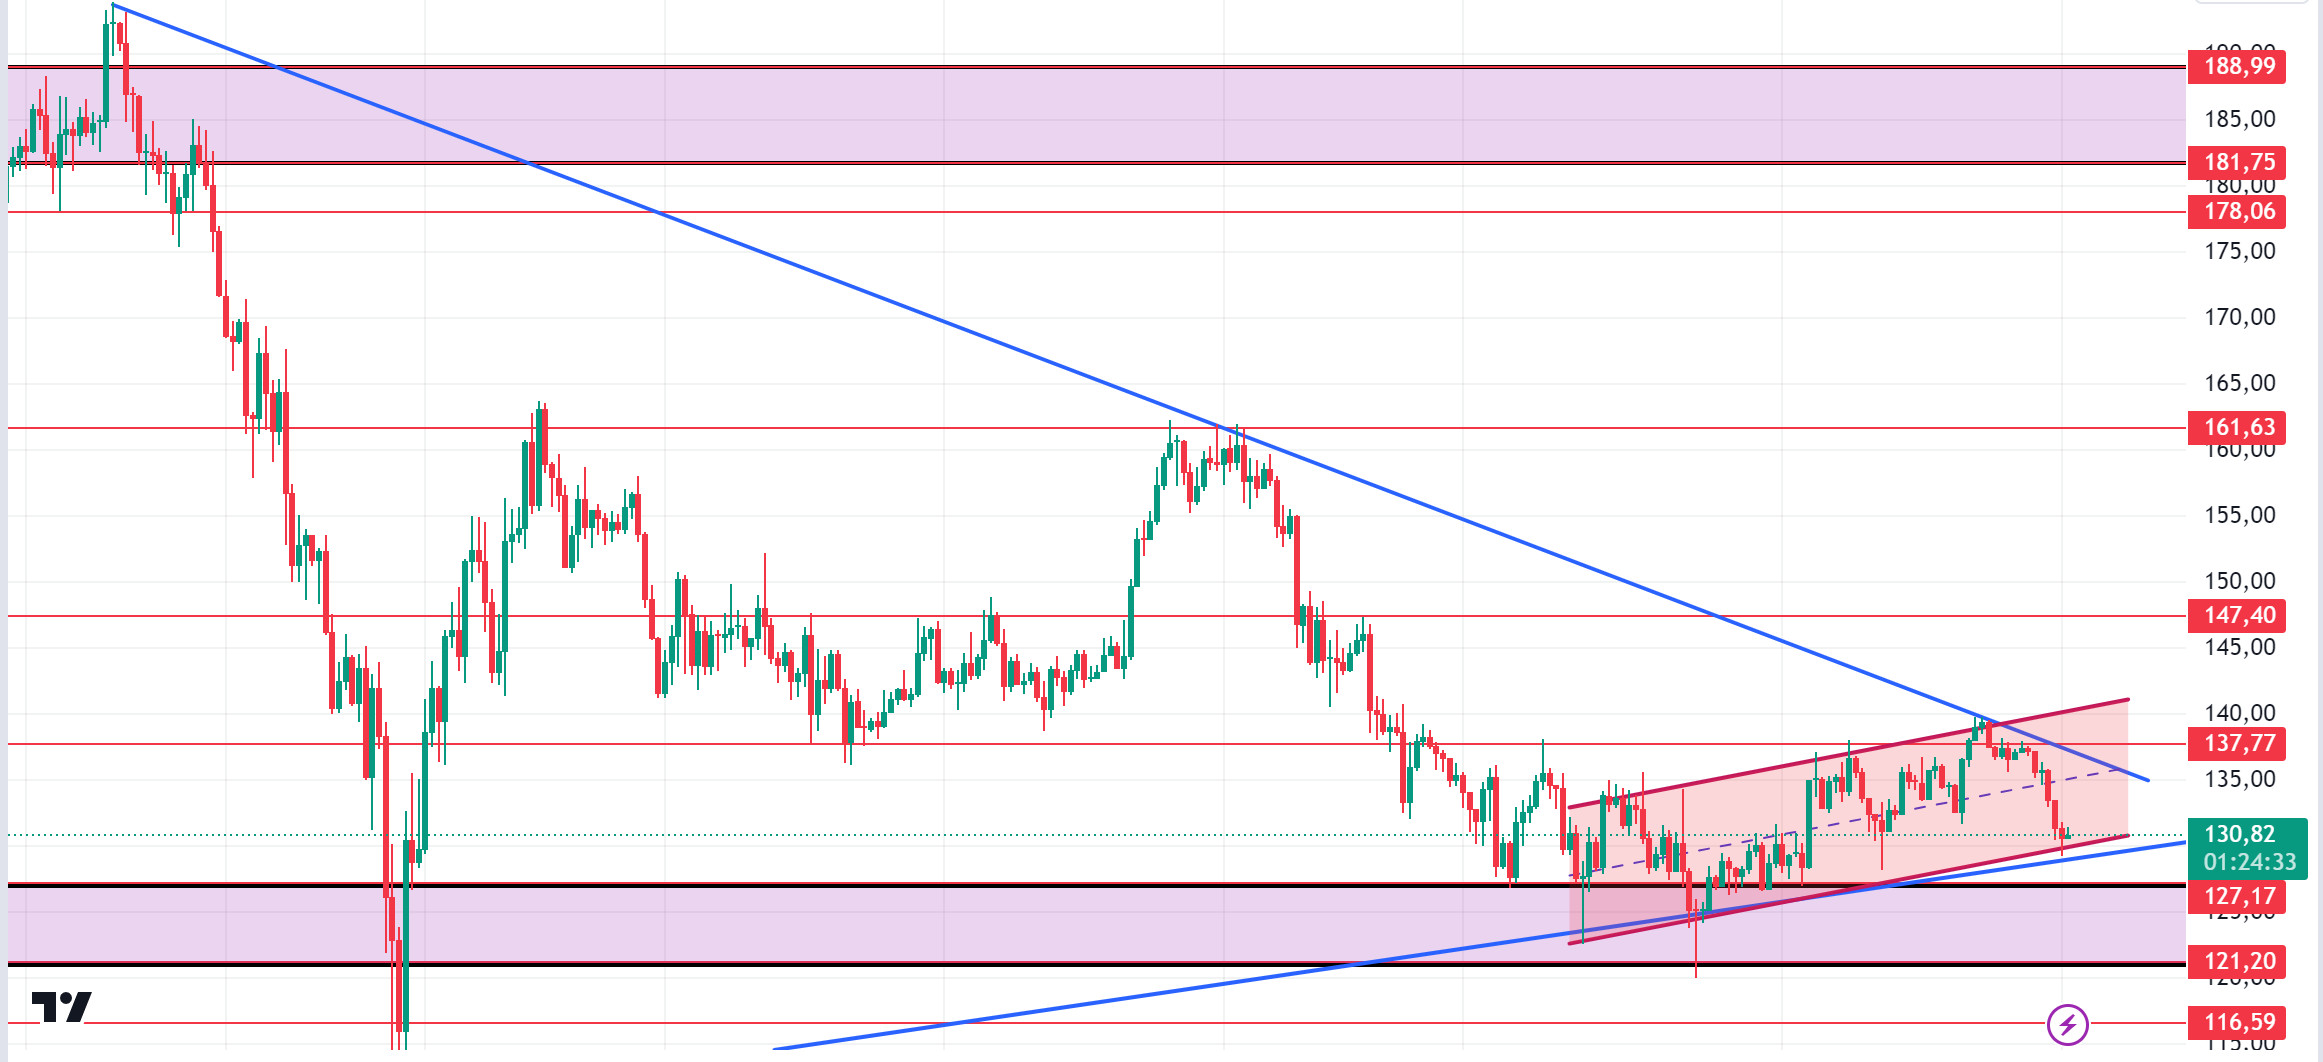
Bitcoin dominance has reached a 3-year high. It rose to 57%, its highest level since April 2021. This caused Solana to fall por 4.83%. According to data from Lookonchain, a whale sold 500 BTC, about $30.07 million, 12 horas before BTC’s price dropped. It still holds $259.6BTC ($15.15 million). Technically, we see a narrowing triangle pattern. At the same time, it is seen that the channel it has formed since September 4 has strength from the support zone. This may prepare the ground for upward movement. If the rises continue due to the increase en volumes, it may test the resistance levels 137.77 – 142.02. If it rises above this level, the rise may continue. In case investors move en the opposite direction due to the macroeconomic news and increased BTC pressure, a potential rise should be followed if it reaches the support levels of 127.17 – 121.20.
Supports 127.17 – 121.20 – 116.59
Resistances 137.77 – 147.40 – 161.63
ADA/USDT
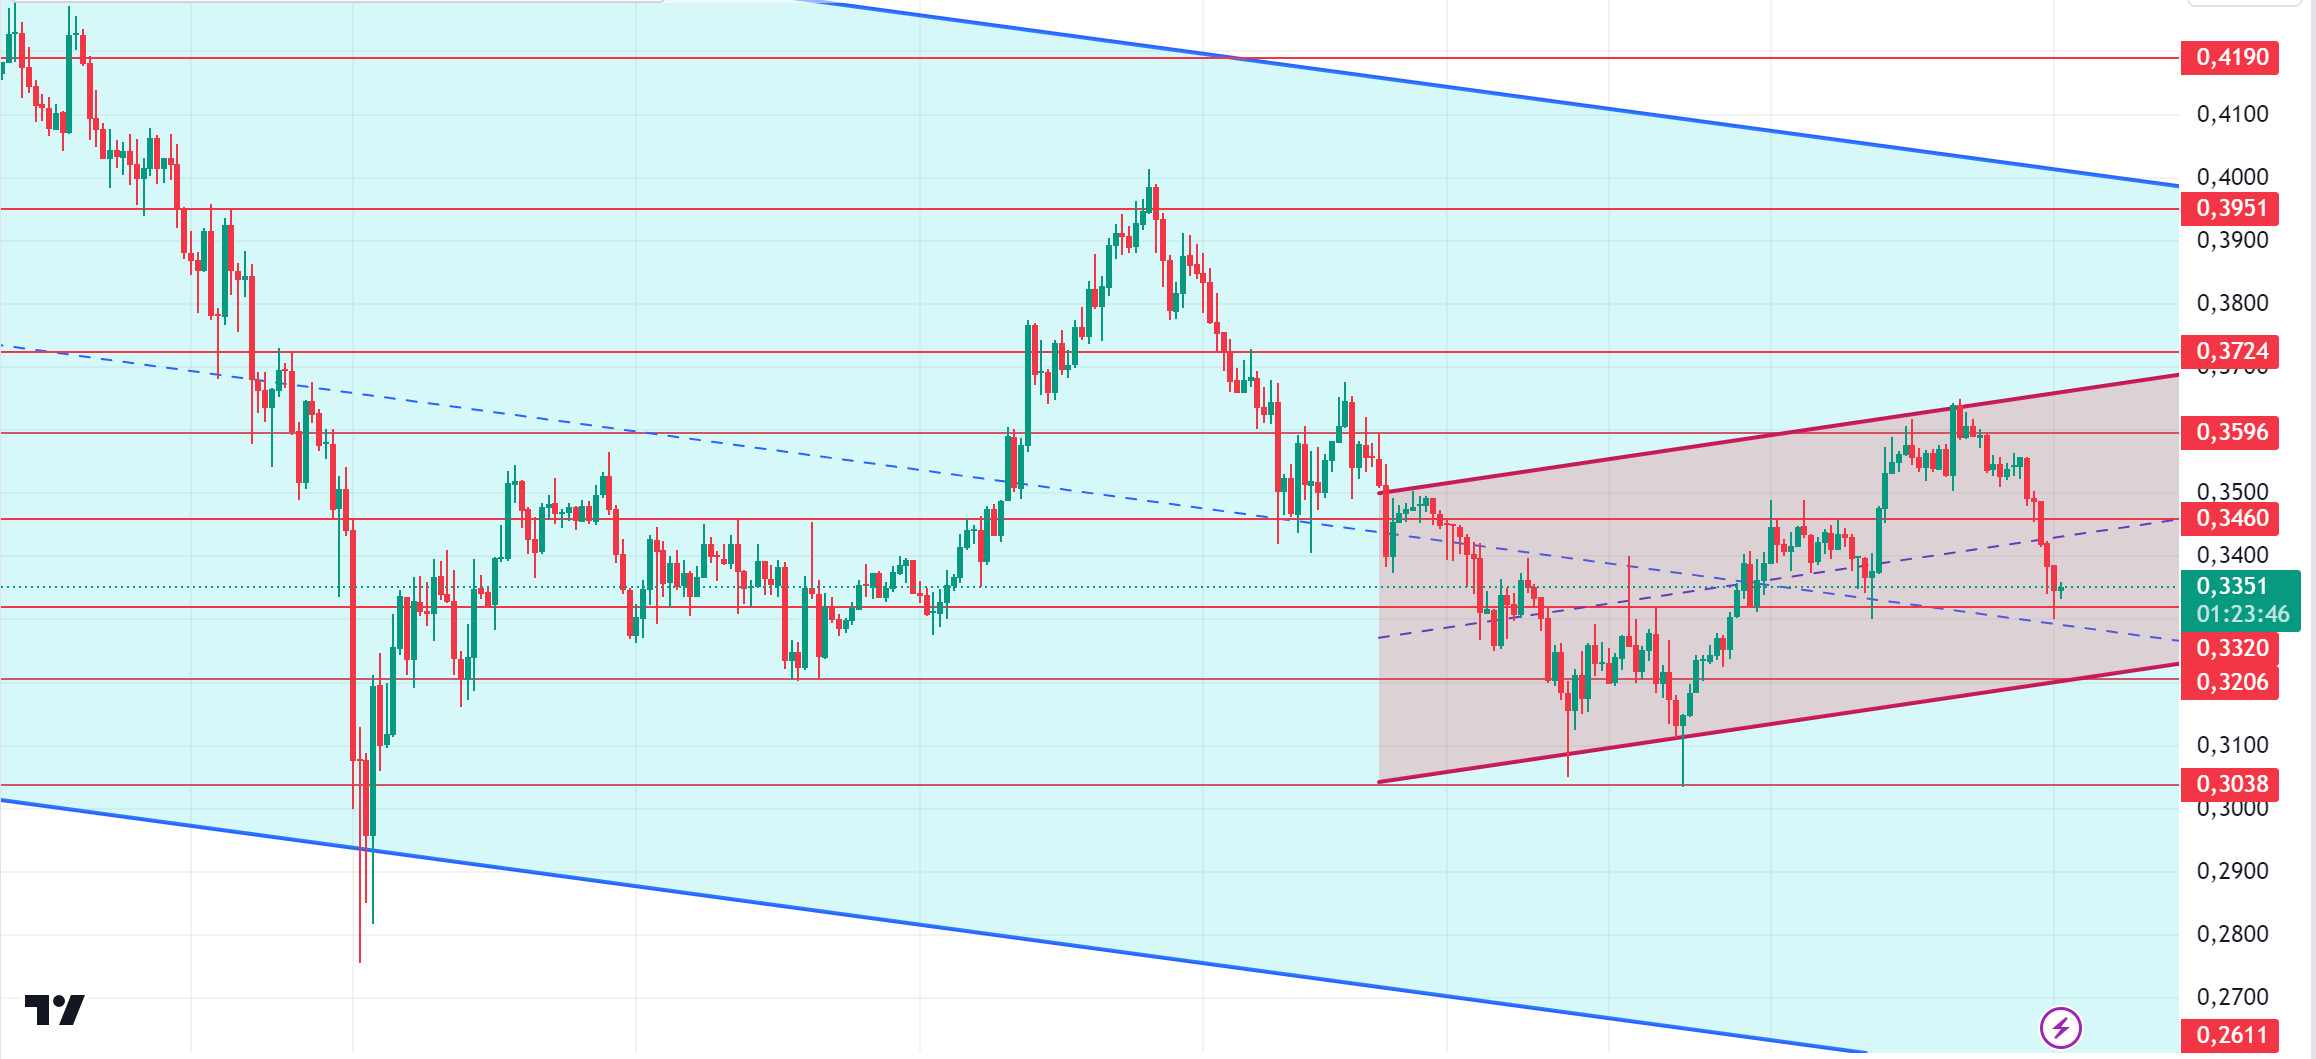
Recent developments, including a significant sale por whale investors, have added uncertainty to the market. Whale investors have sold around 50 million tokens worth over $140 million en recent days. However, bitcoin’s dominance rose to 57%, its highest level since April 2021, causing ADA to fall nearly 7%. According to data from Intotheblock, the number of investors who have held ADA for more than a year continues to grow, increasing confidence en the asset. The 30-day change en ADA holders’ data showed a slight growth of 0.68%, while investors holding for less than 30 days recorded an increase of 3.8%, indicating a renewed interest en short-term positions. Cardano’s price has been making its movements inside the descending channel for the last five months. If ADA manages to hold at 0.3460, it could experience an increase of 15%. Such a move could take ADA to a target of 0.3951. On the other hand, ADA failed to break 0.3596. Despite this, its price is hovering above a critical resistance. 0.3320 is a strong support en case of a pullback due to general market movements. In the event that macroeconomic data raises BTC, 0.3460 – 0.3596 levels can be followed as resistance levels.
Supports 0.3320 – 0.3206 – 0.3038
Resistances 0.3460 – 0.3596 – 0.3724
AVAX/USDT
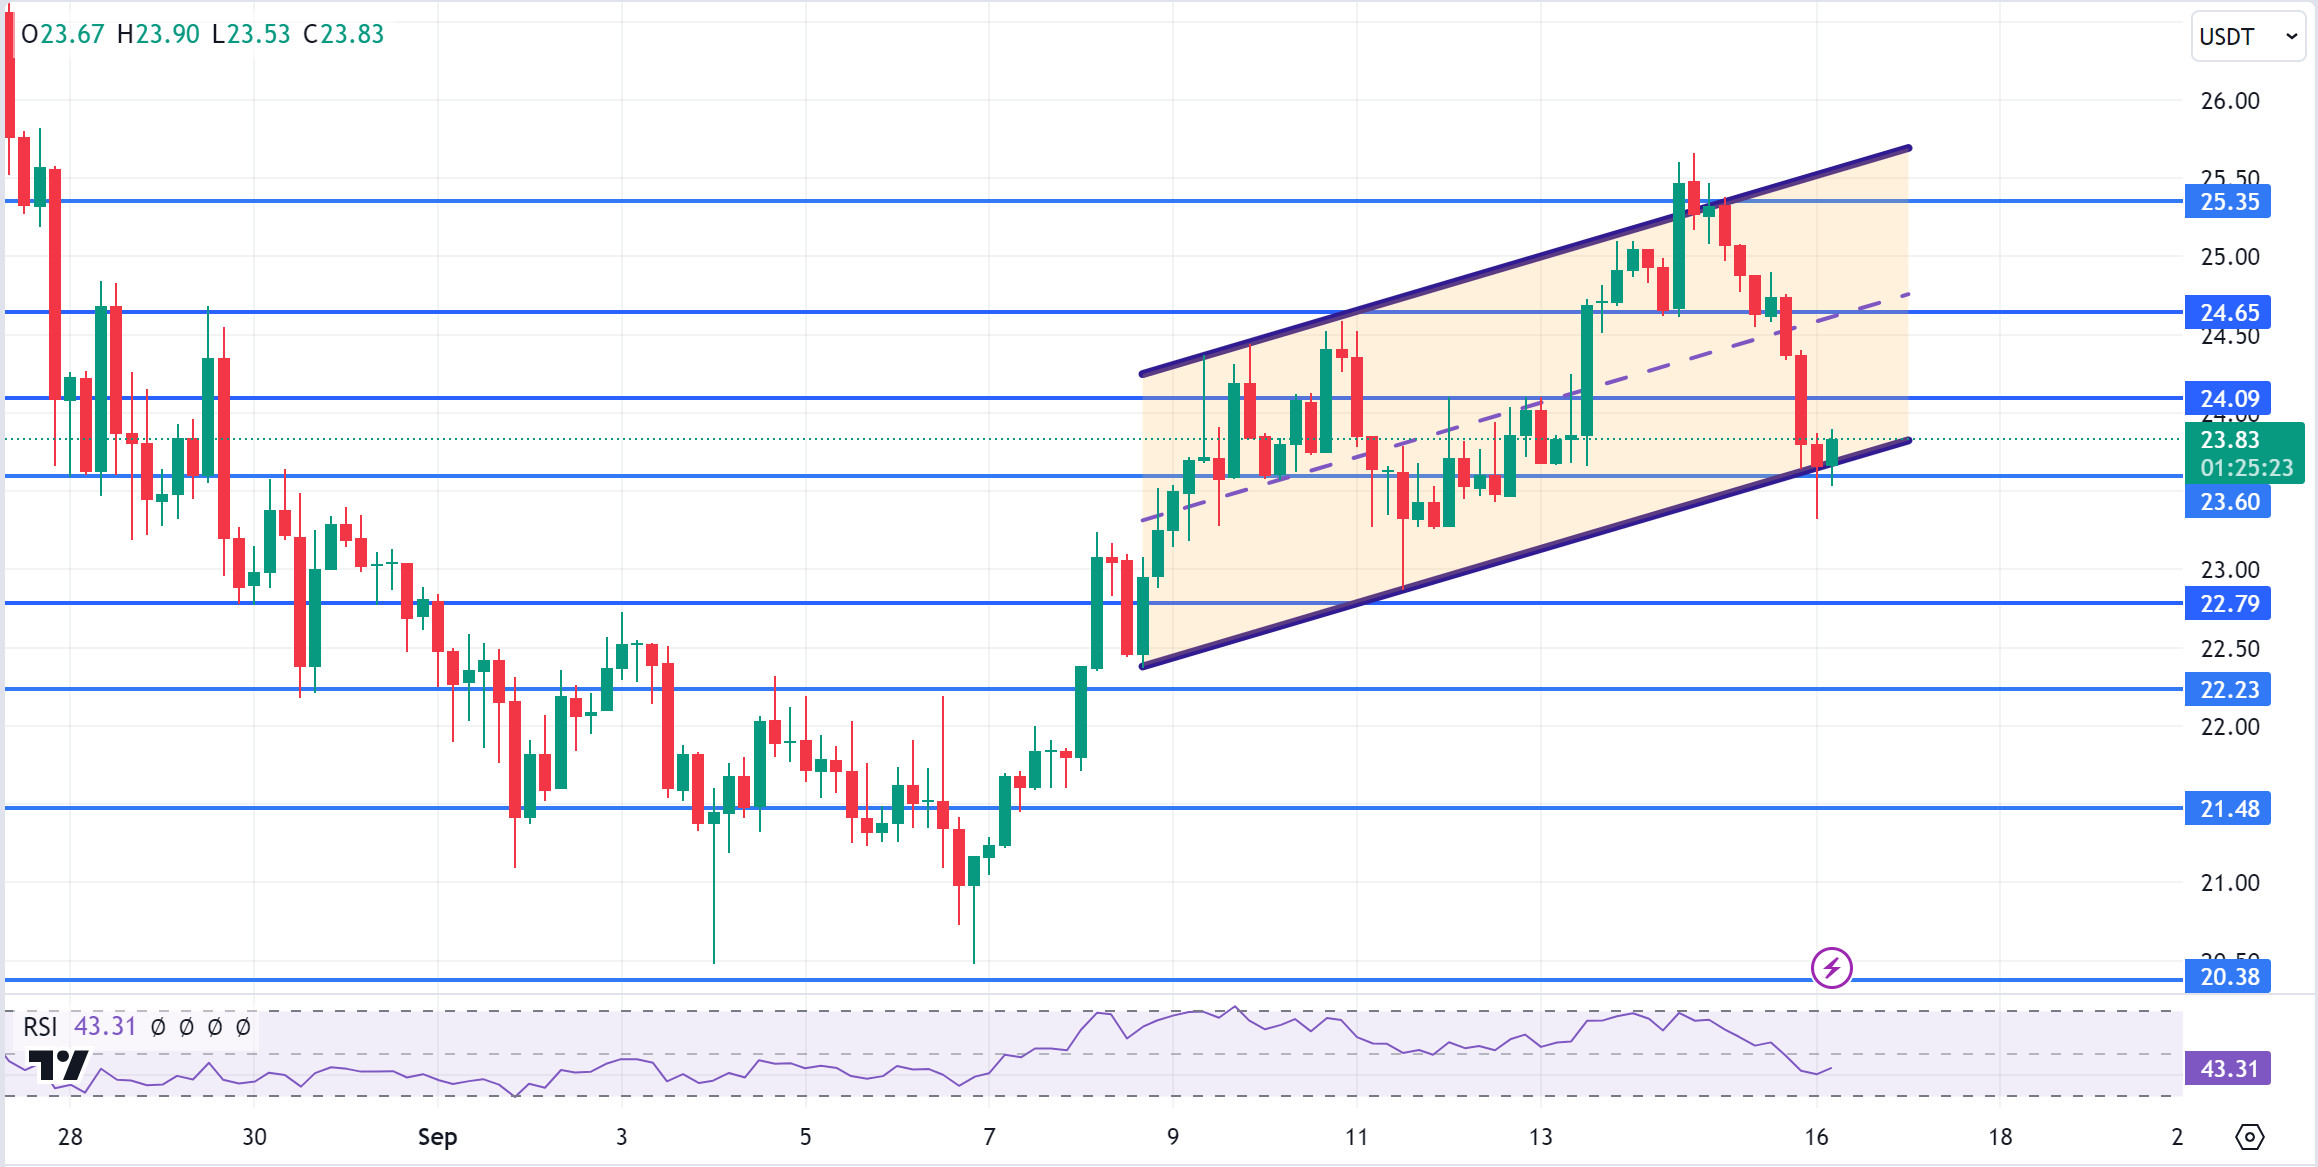
AVAX, which opened yesterday at 25.33, fell por about 6% during the day and closed the day at 23.80. There is no planned data that will affect the markets today. Markets are focused el the FED interest rate decision to be announced this week.
AVAX, currently trading at 23.83, continues its movement within the rising channel. It tried to break the 23.60 support but returned from the lower band of the channel with the buying reaction from here. Some more rise may come from the current level. Thus, it can test the 24.09 and 24.65 resistances por moving to the middle and upper band of the channel. On the 4-hora chart, it may want to test 22.79 and 22.23 supports as a result of the candle closing below 23.60 support. As long as it stays above 20.38 support during the day, the desire to rise may continue. With the break of 20.38 support, selling pressure may increase.
Supports 23.60 – 22.79 – 22.23
Resistances 24.09 – 24.65 – 25.35
TRX/USDT
TRX, which started yesterday at 0.1475, closed the day at 0.1490 with a slight rise. Today, we may see low volume movements, especially since there is no planned data flow coming from the US. Markets are waiting for the FED interest rate decision to be announced el Wednesday.
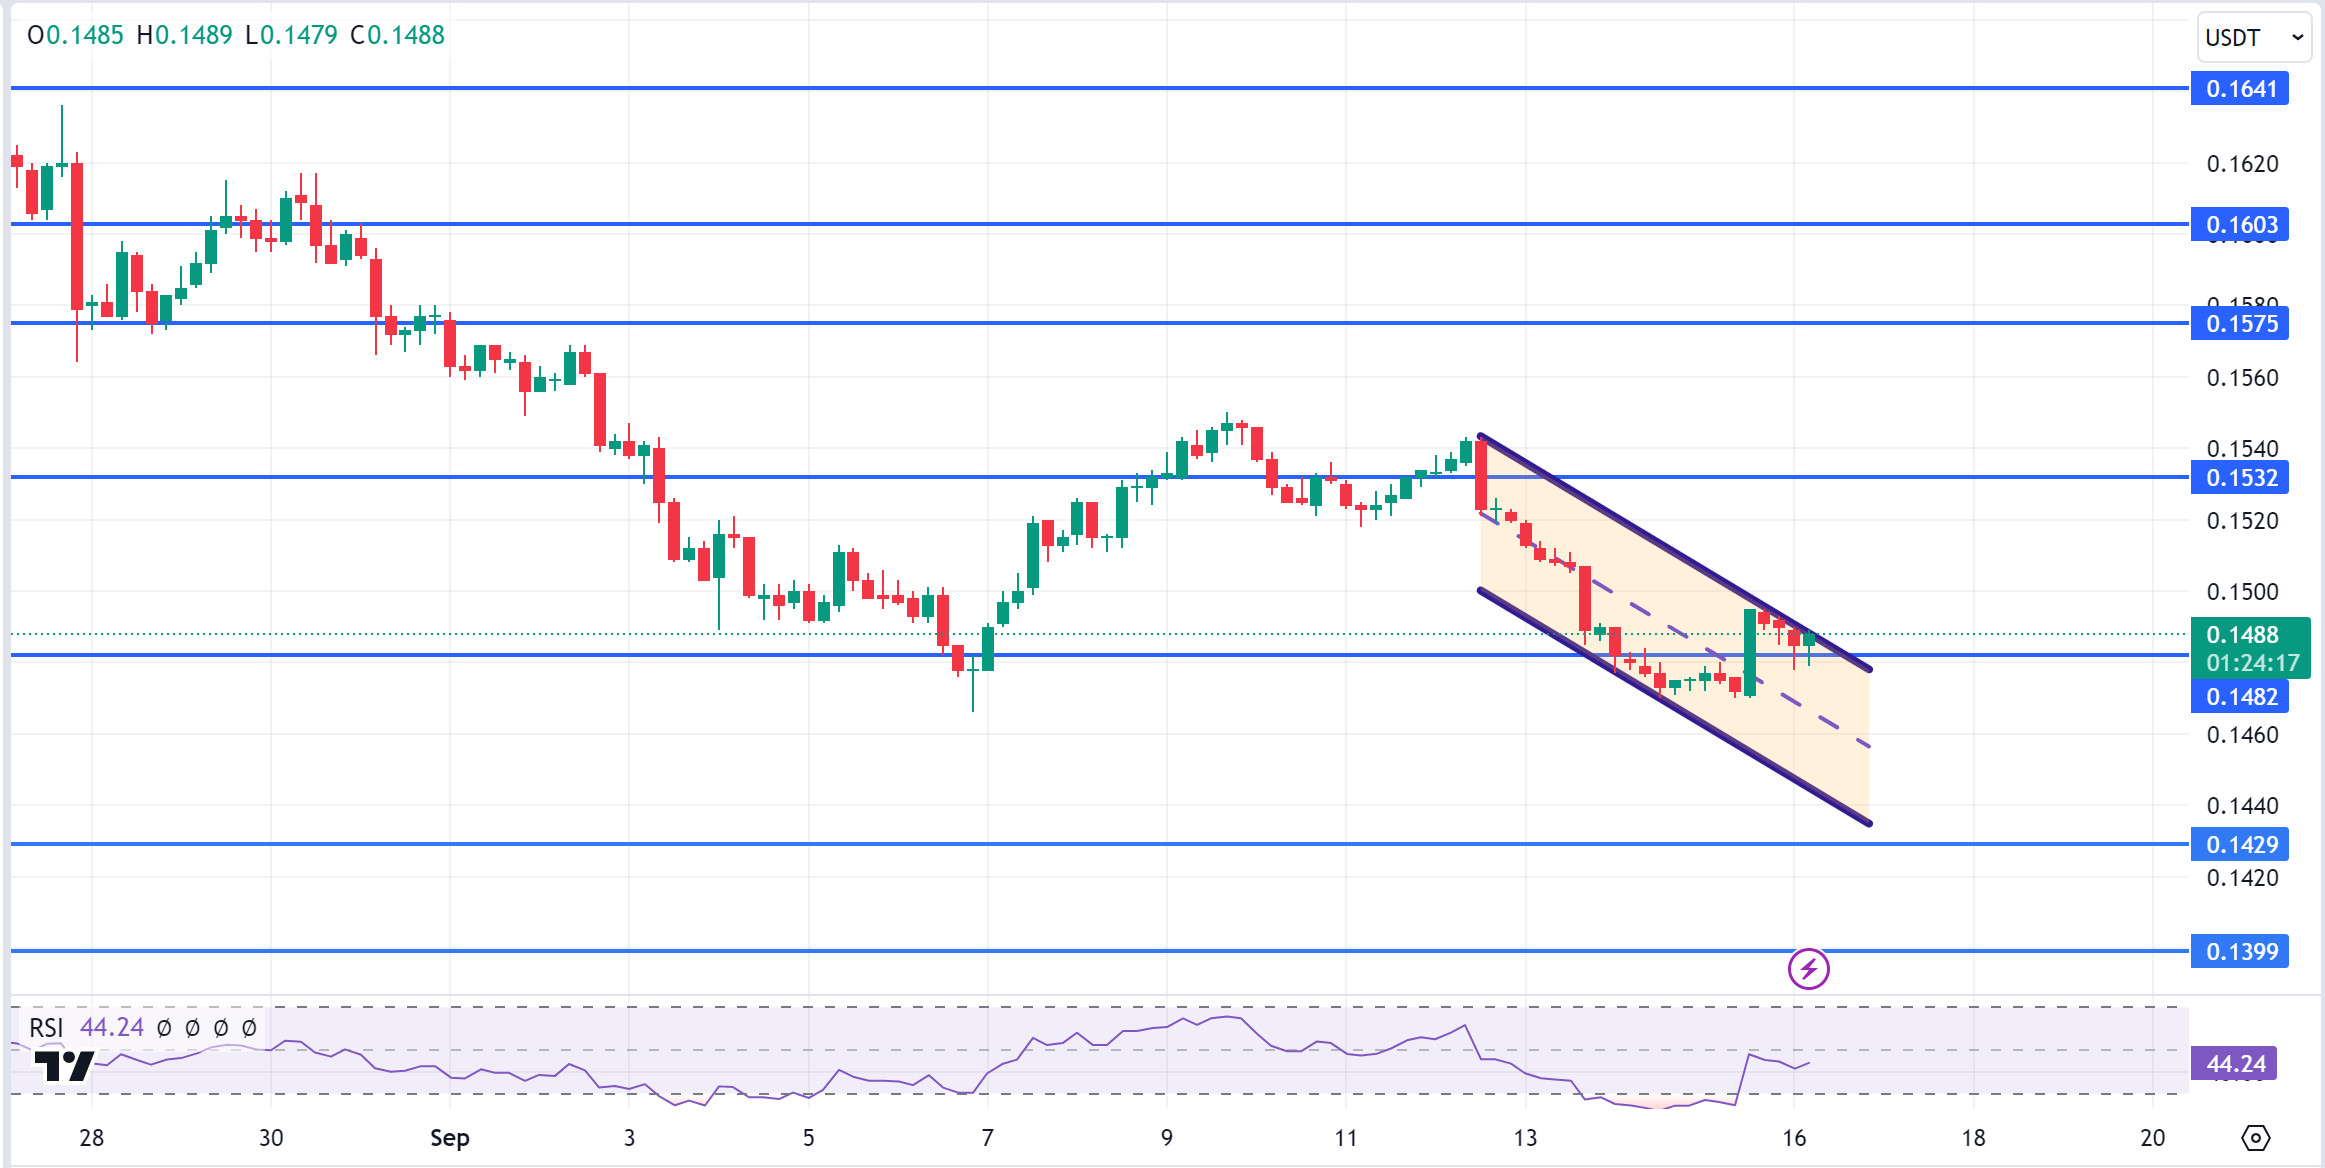
TRX, which is currently trading at 0.1488 and is en the upper band of the falling channel el the 4-hora chart, may move to the lower band of the channel. In such a case, it may want to test 0.1482 support. If it tries to break the upper band of the channel with purchases from the current level, we can get bullish confirmation with the candle closure above 0.1532 resistance. In such a case, it may want to test 0.1575 resistance. TRX may continue to be bullish as long as it stays above 0.1482 support. If this support is broken downwards, sales can be expected to increase.
Supports 0.1482 – 0.1429 – 0.1399
Resistances 0.1532 – 0.1575 – 0.1603
XRP/USDT
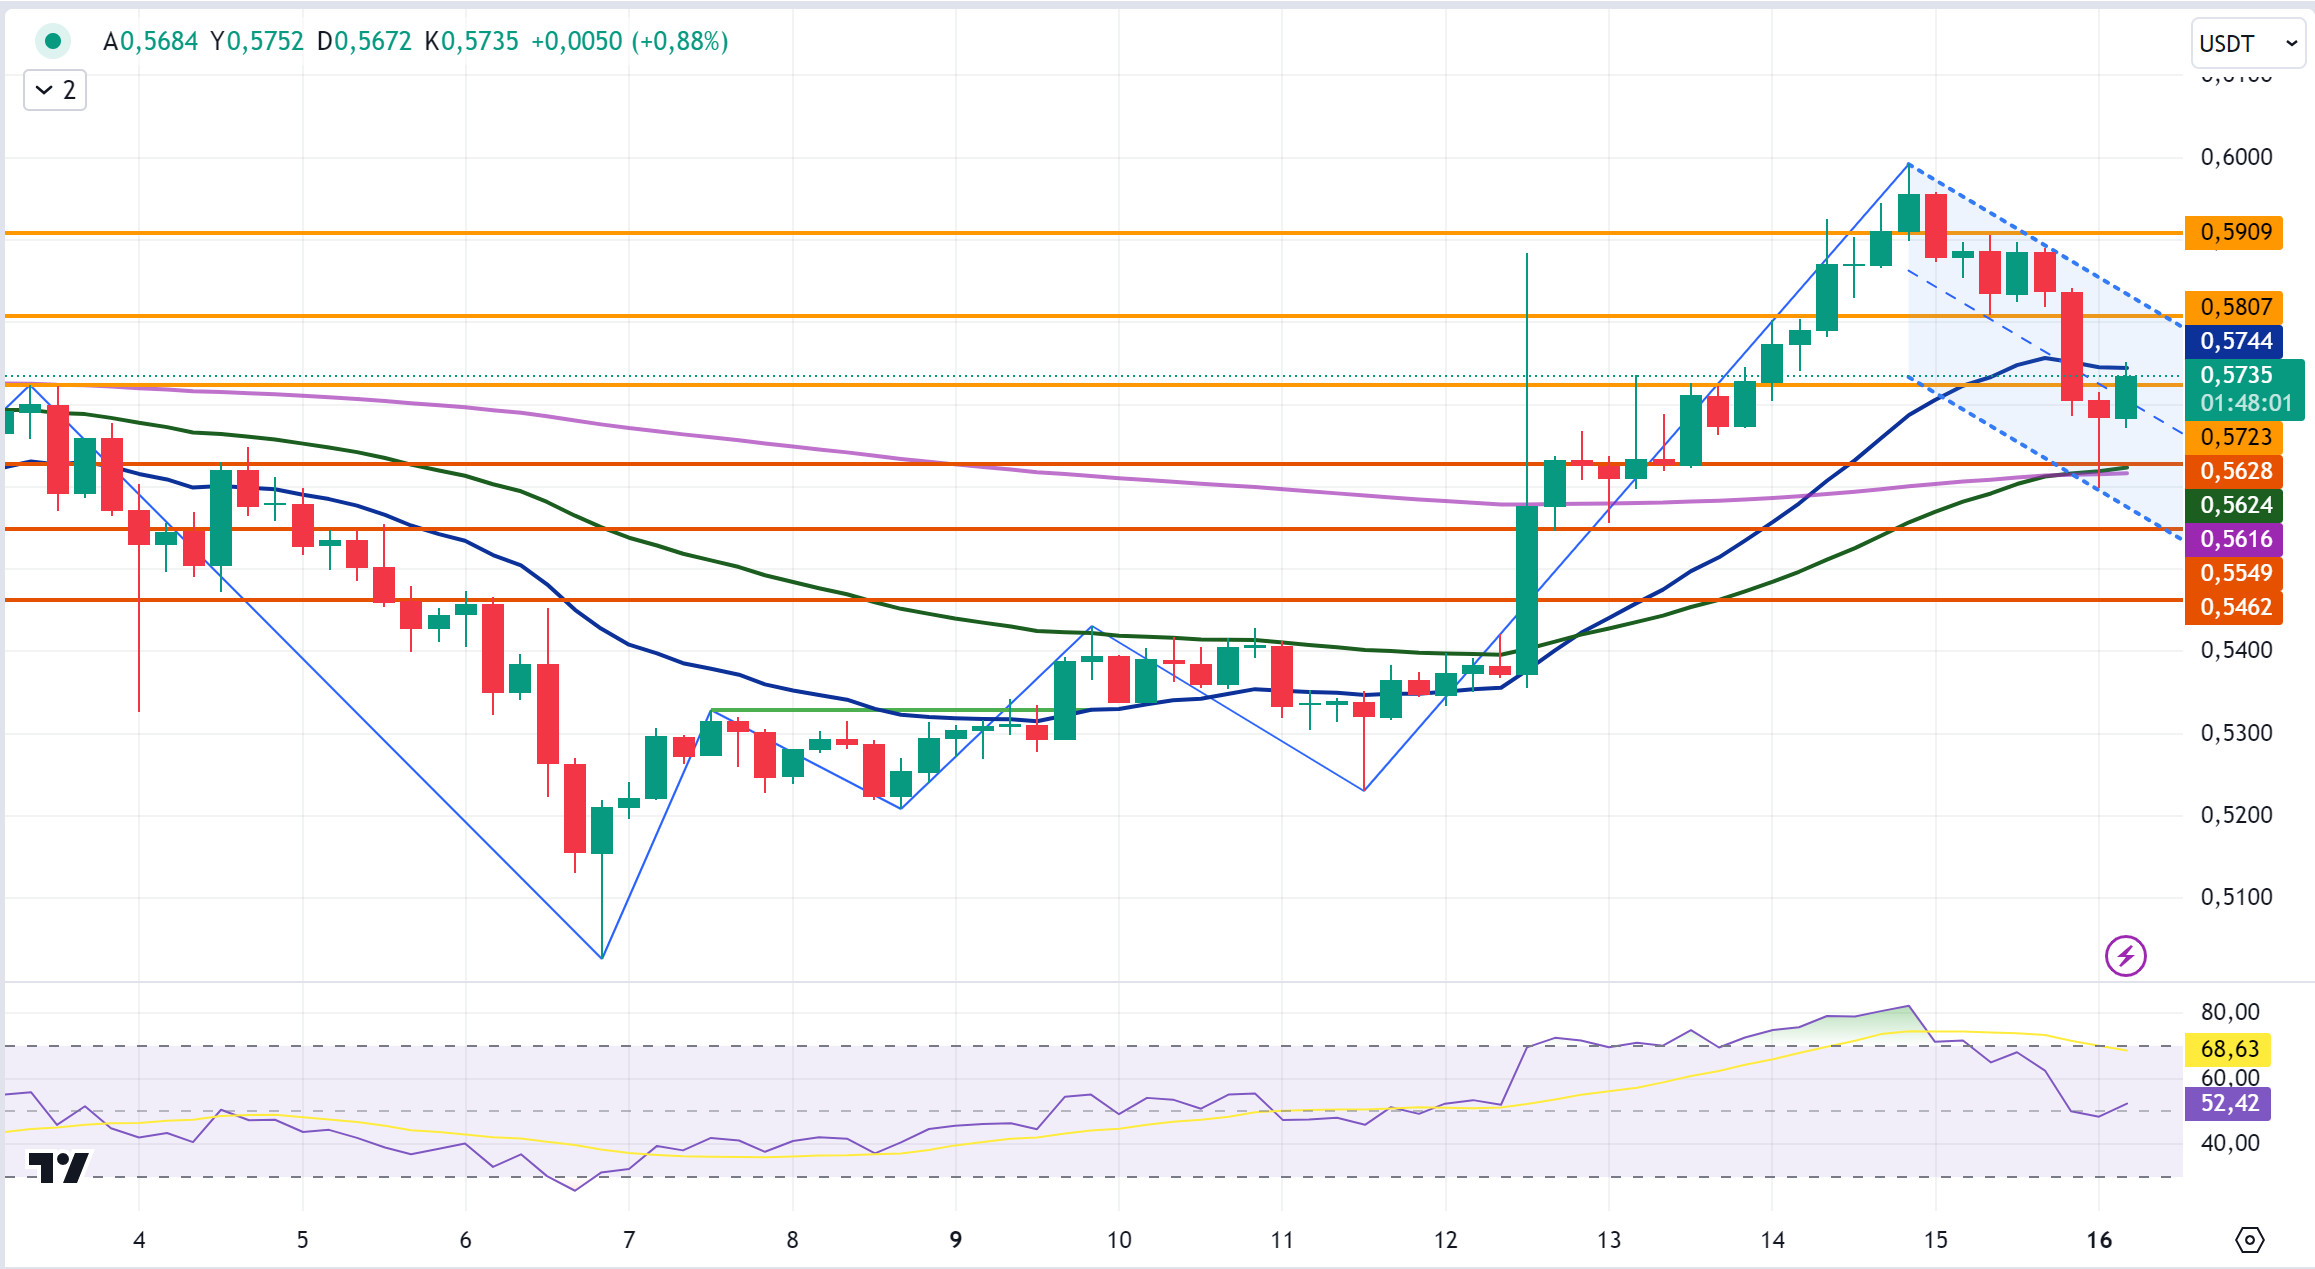
XRP rose as high as 0.60 last week and fell with reaction sales at the RSI 82 overbought level. After the decline, XRP traded within a horizontal band of 0.58-0.59 el the 4-hora analysis yesterday, while it lost 2.25% en the closing candle of the week and closed the week at 0.5703. Today, after starting at 0.5703, it started to rise with the reaction purchases after falling to the EMA50 and EMA200 level el the first candle en the 4-hora analysis. XRP, which fell as low as 0.5593 el the first candle en the 4-hora analysis today, is currently trading at 0.5735 with its rise after the recovery.
In today’s 4-hora analysis, it tested the 0.5723 resistance level at the last candle and tested the EMA20 level en the continuation of the rise and fell with the reaction sales at this level. If the 0.5723 resistance level and the EMA20 level are broken with a bullish break el the last candle, XRP may test the 0.5807-0.5909 resistance levels en the continuation of the rise. In the event that these resistance levels cannot be broken, and a decline occurs, it may test the 0.5628 support level and the EMA50 and EMA200 levels. If these levels are broken with a decline, the decline may deepen and test the 0.5549-0.5462 support levels.
In the 4-hora analysis, the 0.5628 support level is important. If XRP declines, it may rise with reaction purchases from the 0.5628, EMA50 and EMA200 support levels and may offer a long trading opportunity. If it tests and breaks the 0.5628, EMA50 and EMA200 support levels and the decline continues, it may offer a short trading opportunity.
EMA20 (Blue Line) – EMA50 (Green Line) – EMA200 (Purple Line)
Supports 0.5628 – 0.5549 – 0. 5 462
Resistances 0.5723 – 0.5807 – 0.5 909
DOGE/USDT
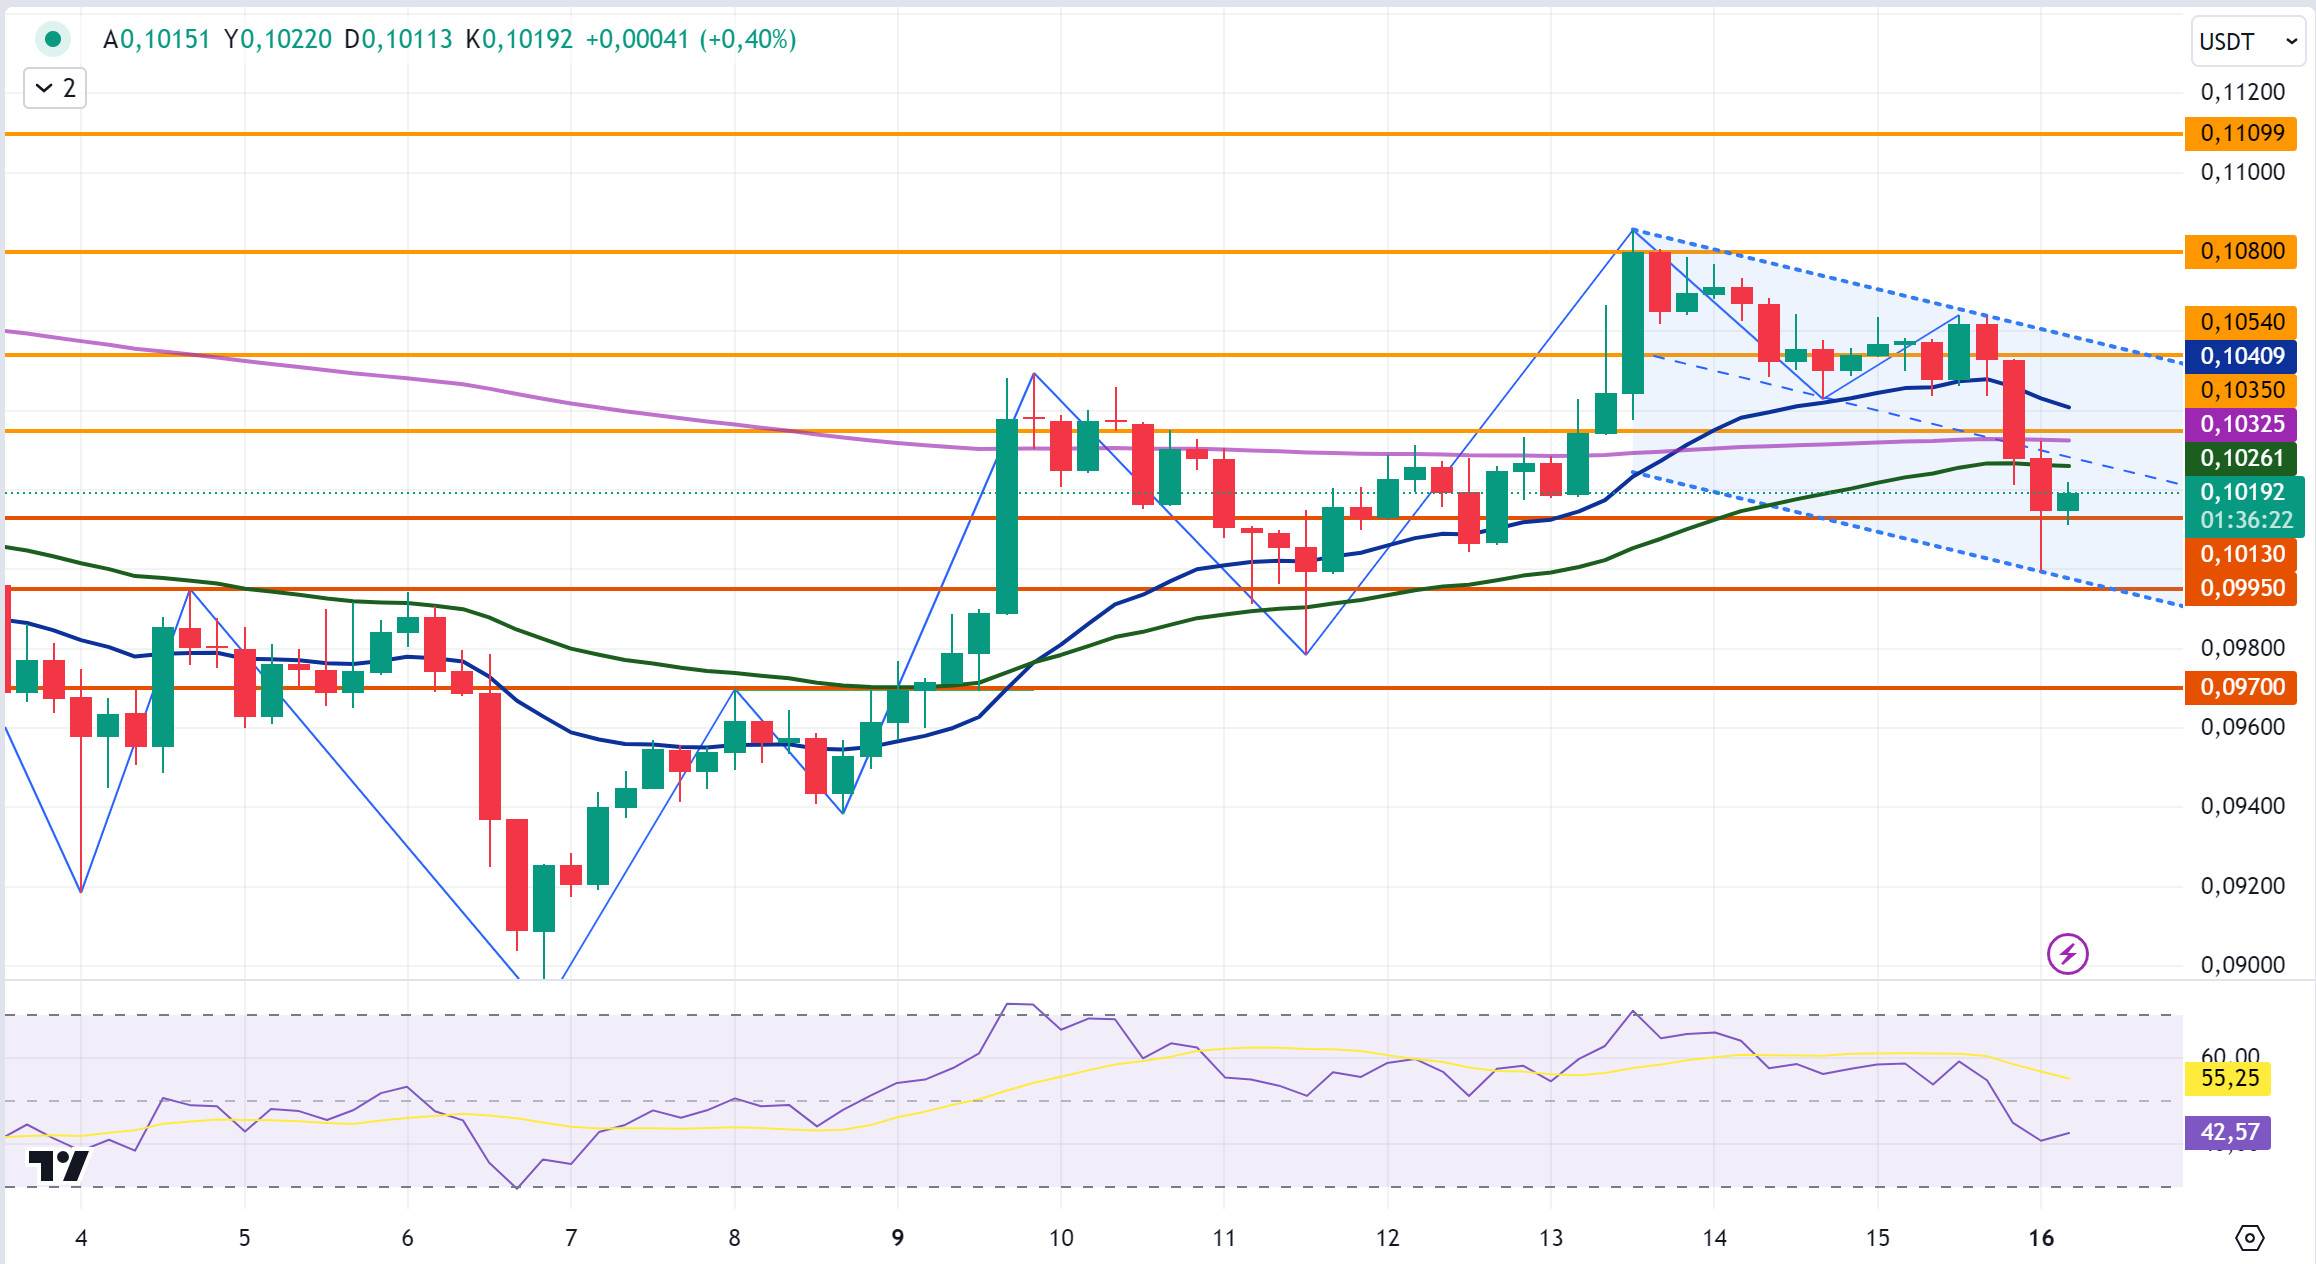
DOGE tested the resistance level of 0.1080 with its rise last week and after failing to break it, it traded within the horizontal band of 0.1040-0.1060 yesterday en the 4-hora analysis, while it closed the week at 0.1027 with a 2.4% depreciation en the closing candle of the week. In the 4-hora analysis, the decline en the closing candle yesterday continued en the opening candle today. DOGE fell as low as 0.0998 el the opening candle and then recovered to close the candle at 0.1014. In the 4-hora analysis, DOGE, which recovered after the sharp decline, is bullish el the last candle and is currently trading at 0.1019.
In the 4-hora analysis, DOGE, which tested and failed to break the 0.1013 support level en the last candle, may test the resistance levels of 0.1035 and EMA200 with its rise and may test the resistance levels of 0.1054-0.1080 with the continuation of the rise after breaking these resistance levels. Otherwise, it may test the 0.0995-0.0970 support levels en the continuation of the decline if it retests and breaks the 0.1013 support level with the rise en the falling channel.
In the 4-hora analysis, DOGE, which is en the falling channel en the falling channel, may decline with the reaction sales that may come from the resistance level of 0.1035 and EMA200 during its rise and may offer a short trading opportunity. If these resistance levels are broken, it may offer a long trading opportunity en the scenario where it continues to rise.
EMA20 (Blue Line) – EMA50 (Green Line) – EMA200 (Purple Line)
Supports 0.1013 – 0.0995 – 0.0970
Resistances 0.1035 – 0.1 054 – 0.1080
DOT/USDT
Polkadot has relaunched its decentralized Ambassador program, allowing the community to elect their Chief Ambassadors through voting. William, one of the newly elected Chief Ambassadors, focuses el fostering organizational adoption and aims to promote the Polkadot ecosystem to different sectors. William’s vision includes strategic steps towards Polkadot’s expansion. On the other hand, the assassination attempt el Trump seems to have negatively affected the cryptocurrency market.
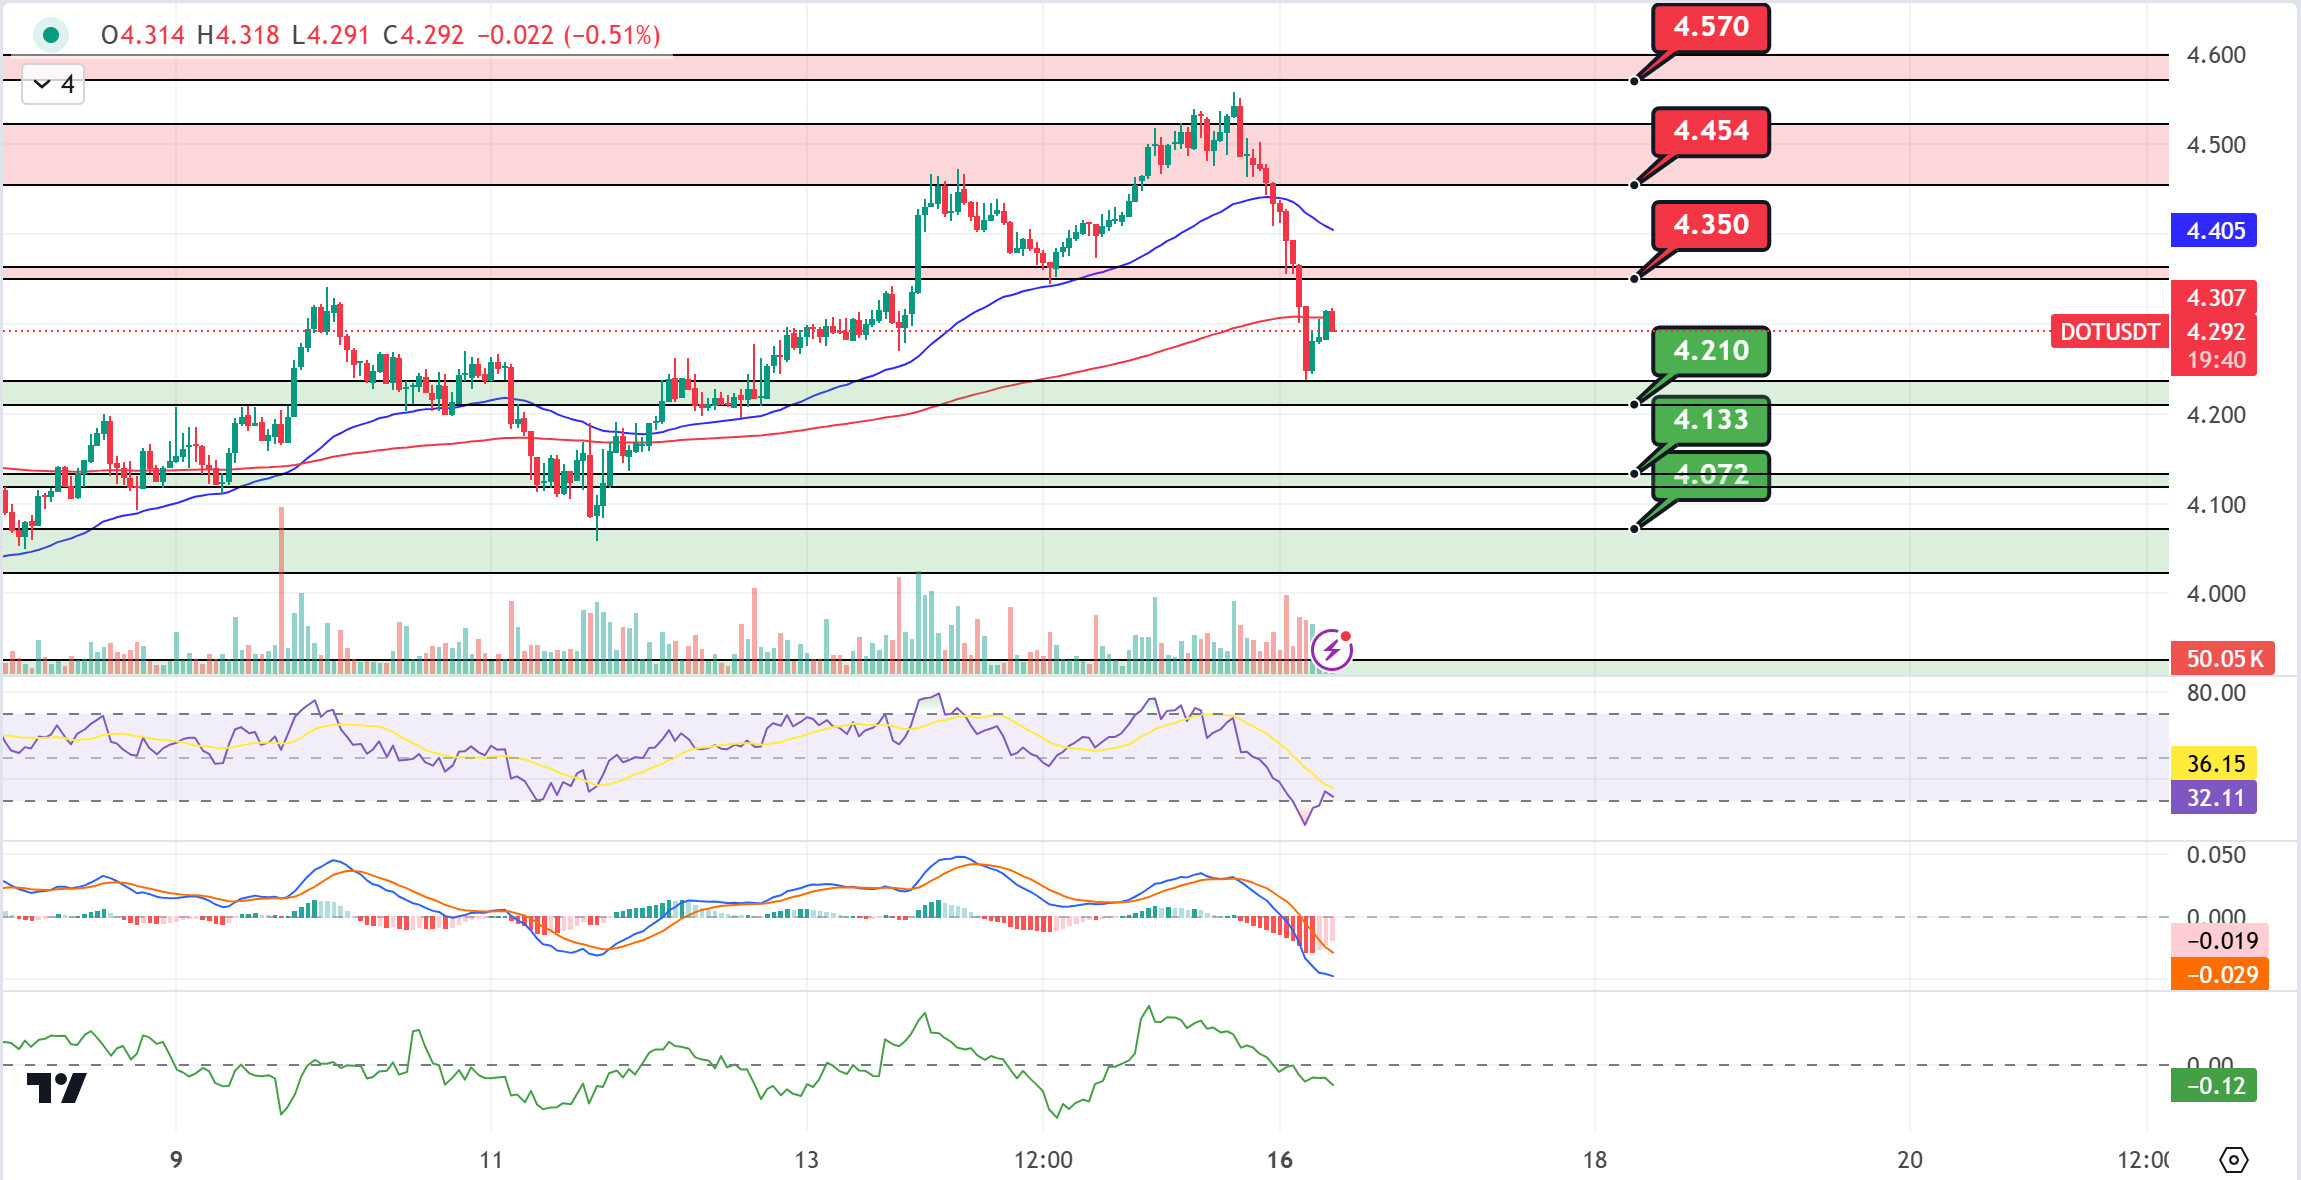
When we examine the Polkadot chart, the price broke the 4.454 resistance after breaking the 4.350 resistance upwards. Rising to 4.570 levels, DOT fell back to 4.210 support with increasing selling pressure. When we examine the MACD, we see that the selling pressure decreased compared to the previous hora. The price may want to test the 4,350 resistance with the reaction from the 4,210 support. In the negative scenario, sellers seem to be more dominant according to the CMF oscillator. A sustained candle close below 4,210 support may lead to a test of the next support level of 4,133.
(Blue line: EMA50, Red line: EMA200)
Supports 4,210 – -4,133 – 4,072
Resistances 4.350 – 4.454 – 4.570
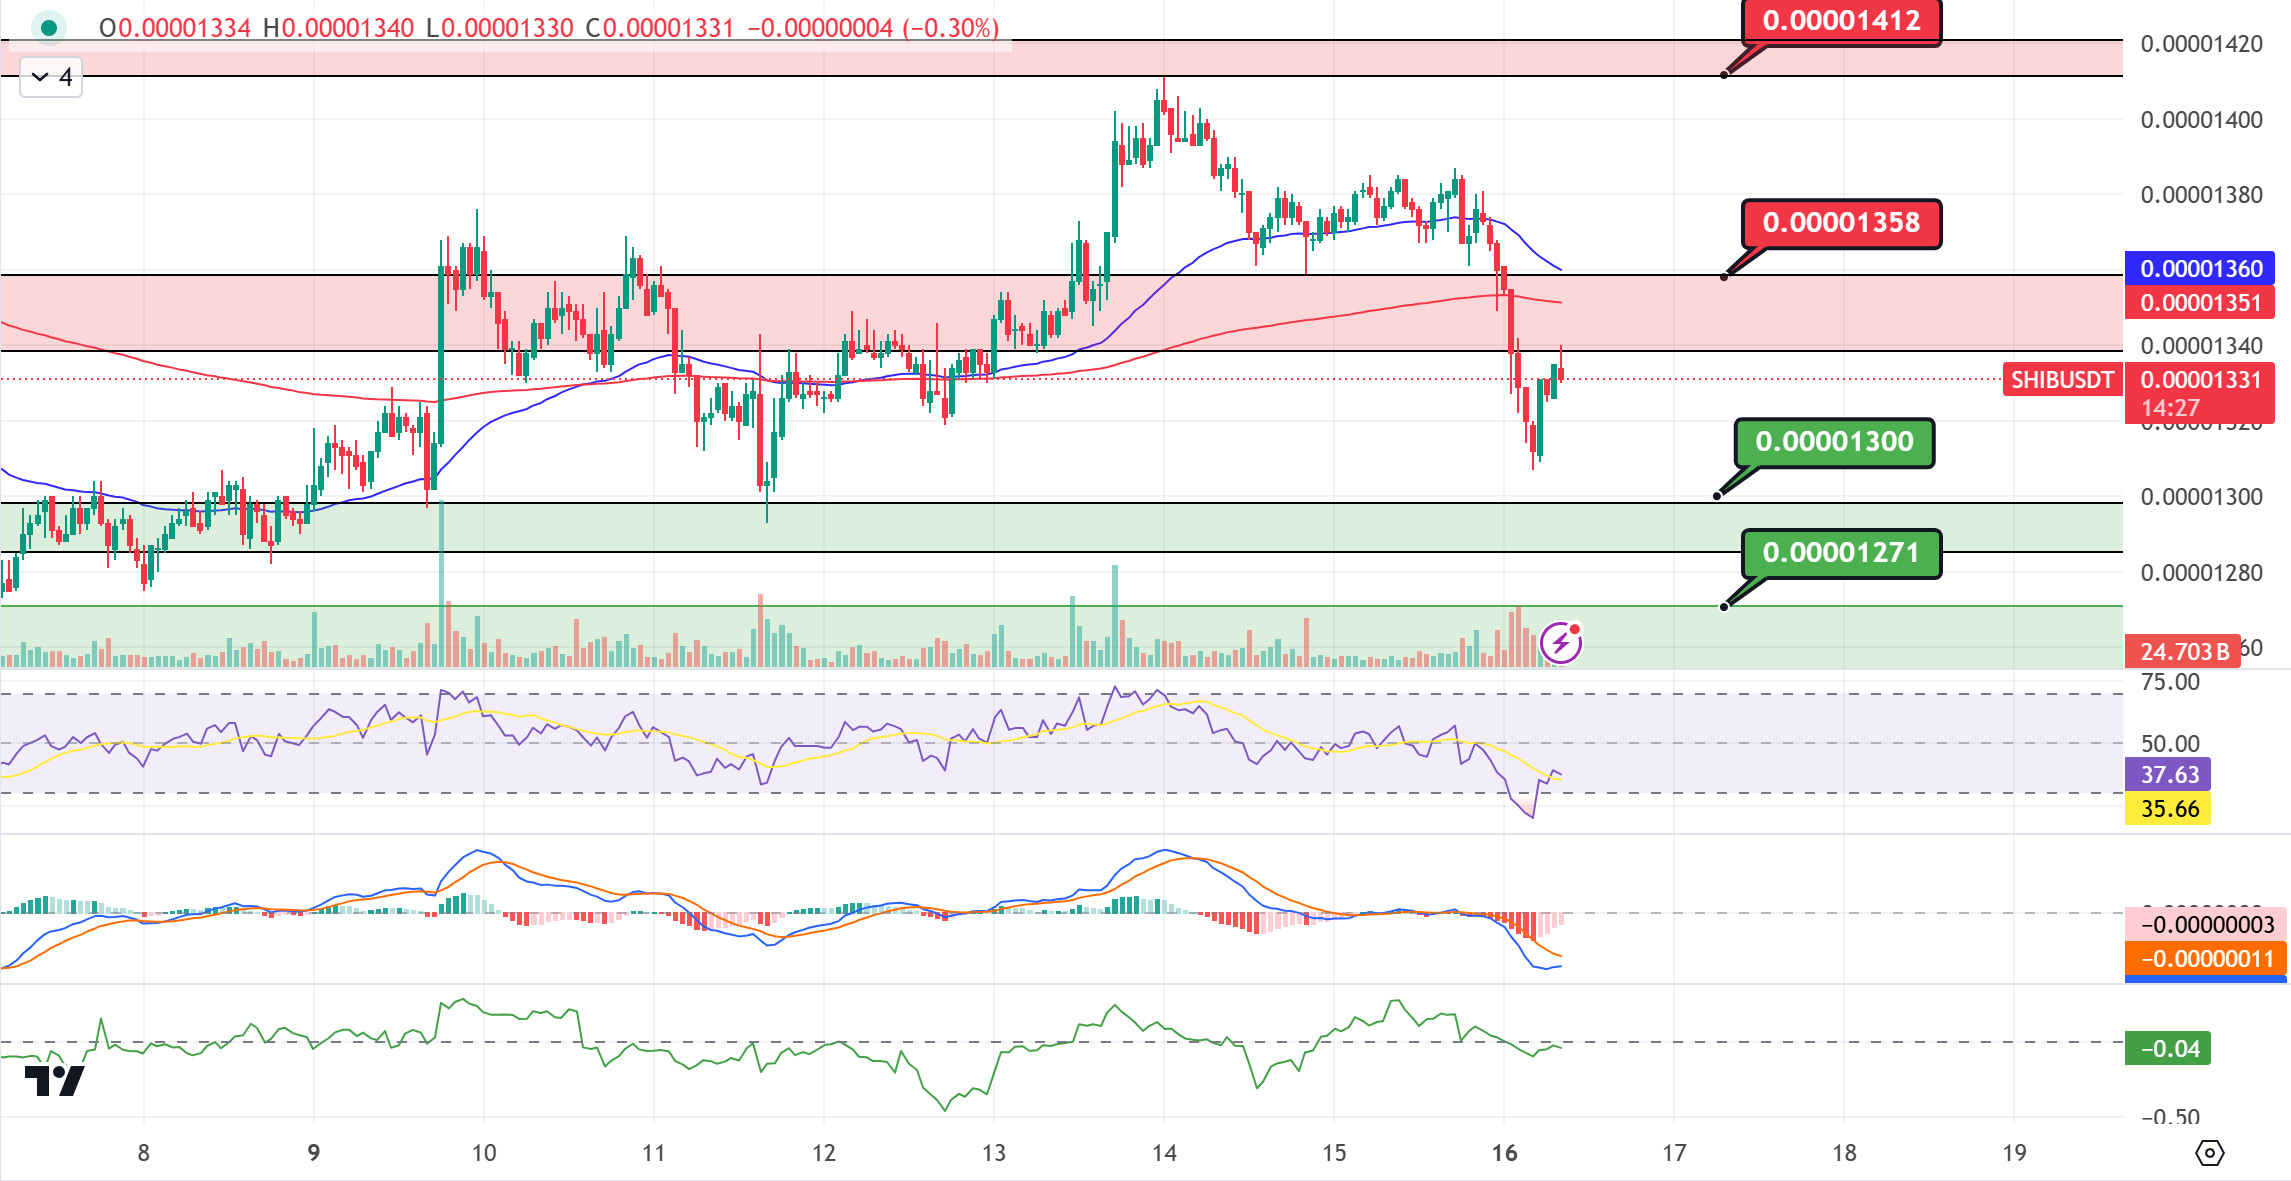
SHIB/USDT
In the last 24 horas, Shiba Inu’s burn rate has increased por 340%. According to the Shibburn wallet tracking service, 11,080,178 SHIBs were burned during this time. This huge increase was driven por the transfer of millions of SHIBs to burn wallets. On the other hand, the daily transaction volume el Shibarium remains low, which affects the rate of SHIB burning. Burning is currently being done automatically.
As for the SHIB chart, the price seems to be unable to break the selling pressure at 0.00001358. In case the price fails to break the selling pressure at 0.00001358, we can expect a pullback towards 0.00001300 support levels. In the positive scenario, if the price maintains above the 0.00001358 level, we may see a movement towards the EMA200 levels. If it is permanent above the EMA200, a rise towards the 0.00001412 level can be expected.
(Blue line: EMA50, Red line: EMA200)
Supports 0.00001300 – 0.00001271 – 0.00001227
Resistances 0.00001358 – 0.00001412 – 0.00001443
LEGAL NOTICE
The investment information, comments and recommendations contained herein do not constitute investment advice. Investment advisory services are provided individually por authorized institutions taking into account the risk and return preferences of individuals. The comments and recommendations contained herein are of a general nature. These recommendations may not be suitable for your financial situation and risk and return preferences. Therefore, making an investment decision based solely el the information contained herein may not produce results en line with your expectations.
