
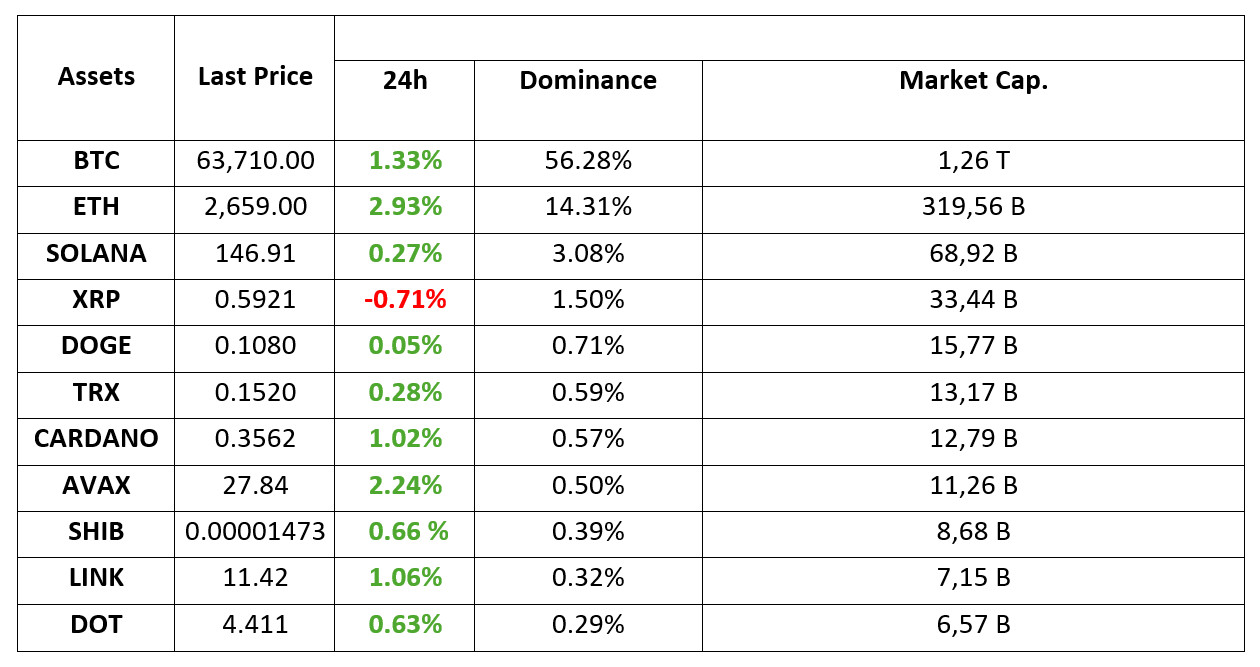
MARKET SUMMARY
Latest Situation en Crypto Assets
*Prepared el 23.09.2024 at 07:00 (UTC)
WHAT’S LEFT BEHIND
Kamala Harris breaks her silence el crypto
US presidential candidate Kamala Harris spoke for the first time about crypto. Speaking at a fundraiser today, Harris pledged to encourage the growth of digital assets.
BlackRock Report
The report, prepared por Robbie Mitchnick, Head of BlackRock’s Digital Assets Unit, and two executives, emphasized that Bitcoin differs from traditional risk and return factors. The report states that Bitcoin, as a global, decentralized, fixed-supply and non-state-controlled asset, has different risk-return factors than other asset classes and shows low correlation en the long term.
MicroStrategy’s Bitcoin Strategy
MicroStrategy has outperformed the S&P 500 index por a large margin thanks to its Bitcoin investments since August 2020. The company’s stock, MSTR, gained 1,71 percent and surpassed the performance of major technology companies. MicroStrategy has been pursuing a long-term investment strategy por adopting Bitcoin as a reserve asset since 2020.
Miners Fall Short Against Spot ETFs
Over the past week, spot Bitcoin ETFs en the US have seen inflows of 6,573 BTC, almost double the amount produced por miners. Since miners can only produce 3,150 BTC, the risk of a supply-demand imbalance is increasing. This could have positive consequences for the Bitcoin price.
HIGHLIGHTS OF THE DAY
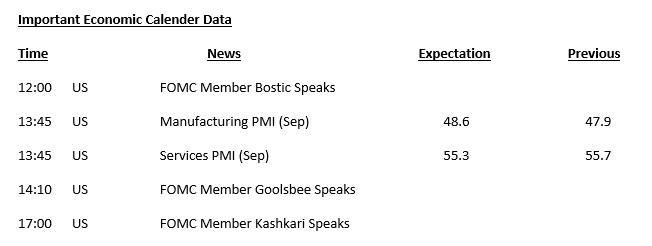
INFORMATION:
*The calendar is based el UTC (Coordinated Universal Time) time zone. The economic calendar content el the relevant page is obtained from reliable news and data providers.
The news en the economic calendar content, the date and time of the announcement of the news, possible changes en the previous, expectations and announced figures are made por the data provider institutions. Darkex cannot be held responsible for possible changes that may arise from similar situations.
MARKET COMPASS
Following the “Jumbo” rate cut por the US Federal Reserve (FED) last week, global markets continue to monitor monetary policy and central banks en the new week. With the space opened por the FED, the People’s Bank of China (PBOC) surprisingly cut the 14-day reverse repo rate por 10 basis points this morning. The Bank, which also provides liquidity to the markets, is expected to make new statements tomorrow to support the economy.
Starting the new week with this agenda, we see a positive mood en the markets. Digital assets, which spent the weekend en a flat and slightly pressured tone as we mentioned en our analysis bulletins el Friday, felt the benefits of increased risk appetite as major central banks were seen taking steps to support the economy. Bitcoin has managed to rise to levels seen en late August.
Today and for the rest of the week, macroeconomic indicators and statements por central bank officials will be closely monitored. Expectations regarding monetary policy changes continue to be the main dynamic driving price changes en the markets, and today, both data and statement agenda will be under our scrutiny. You can check the details en our economic calendar.
TECHNICAL ANALYSIS
BTC/USDT
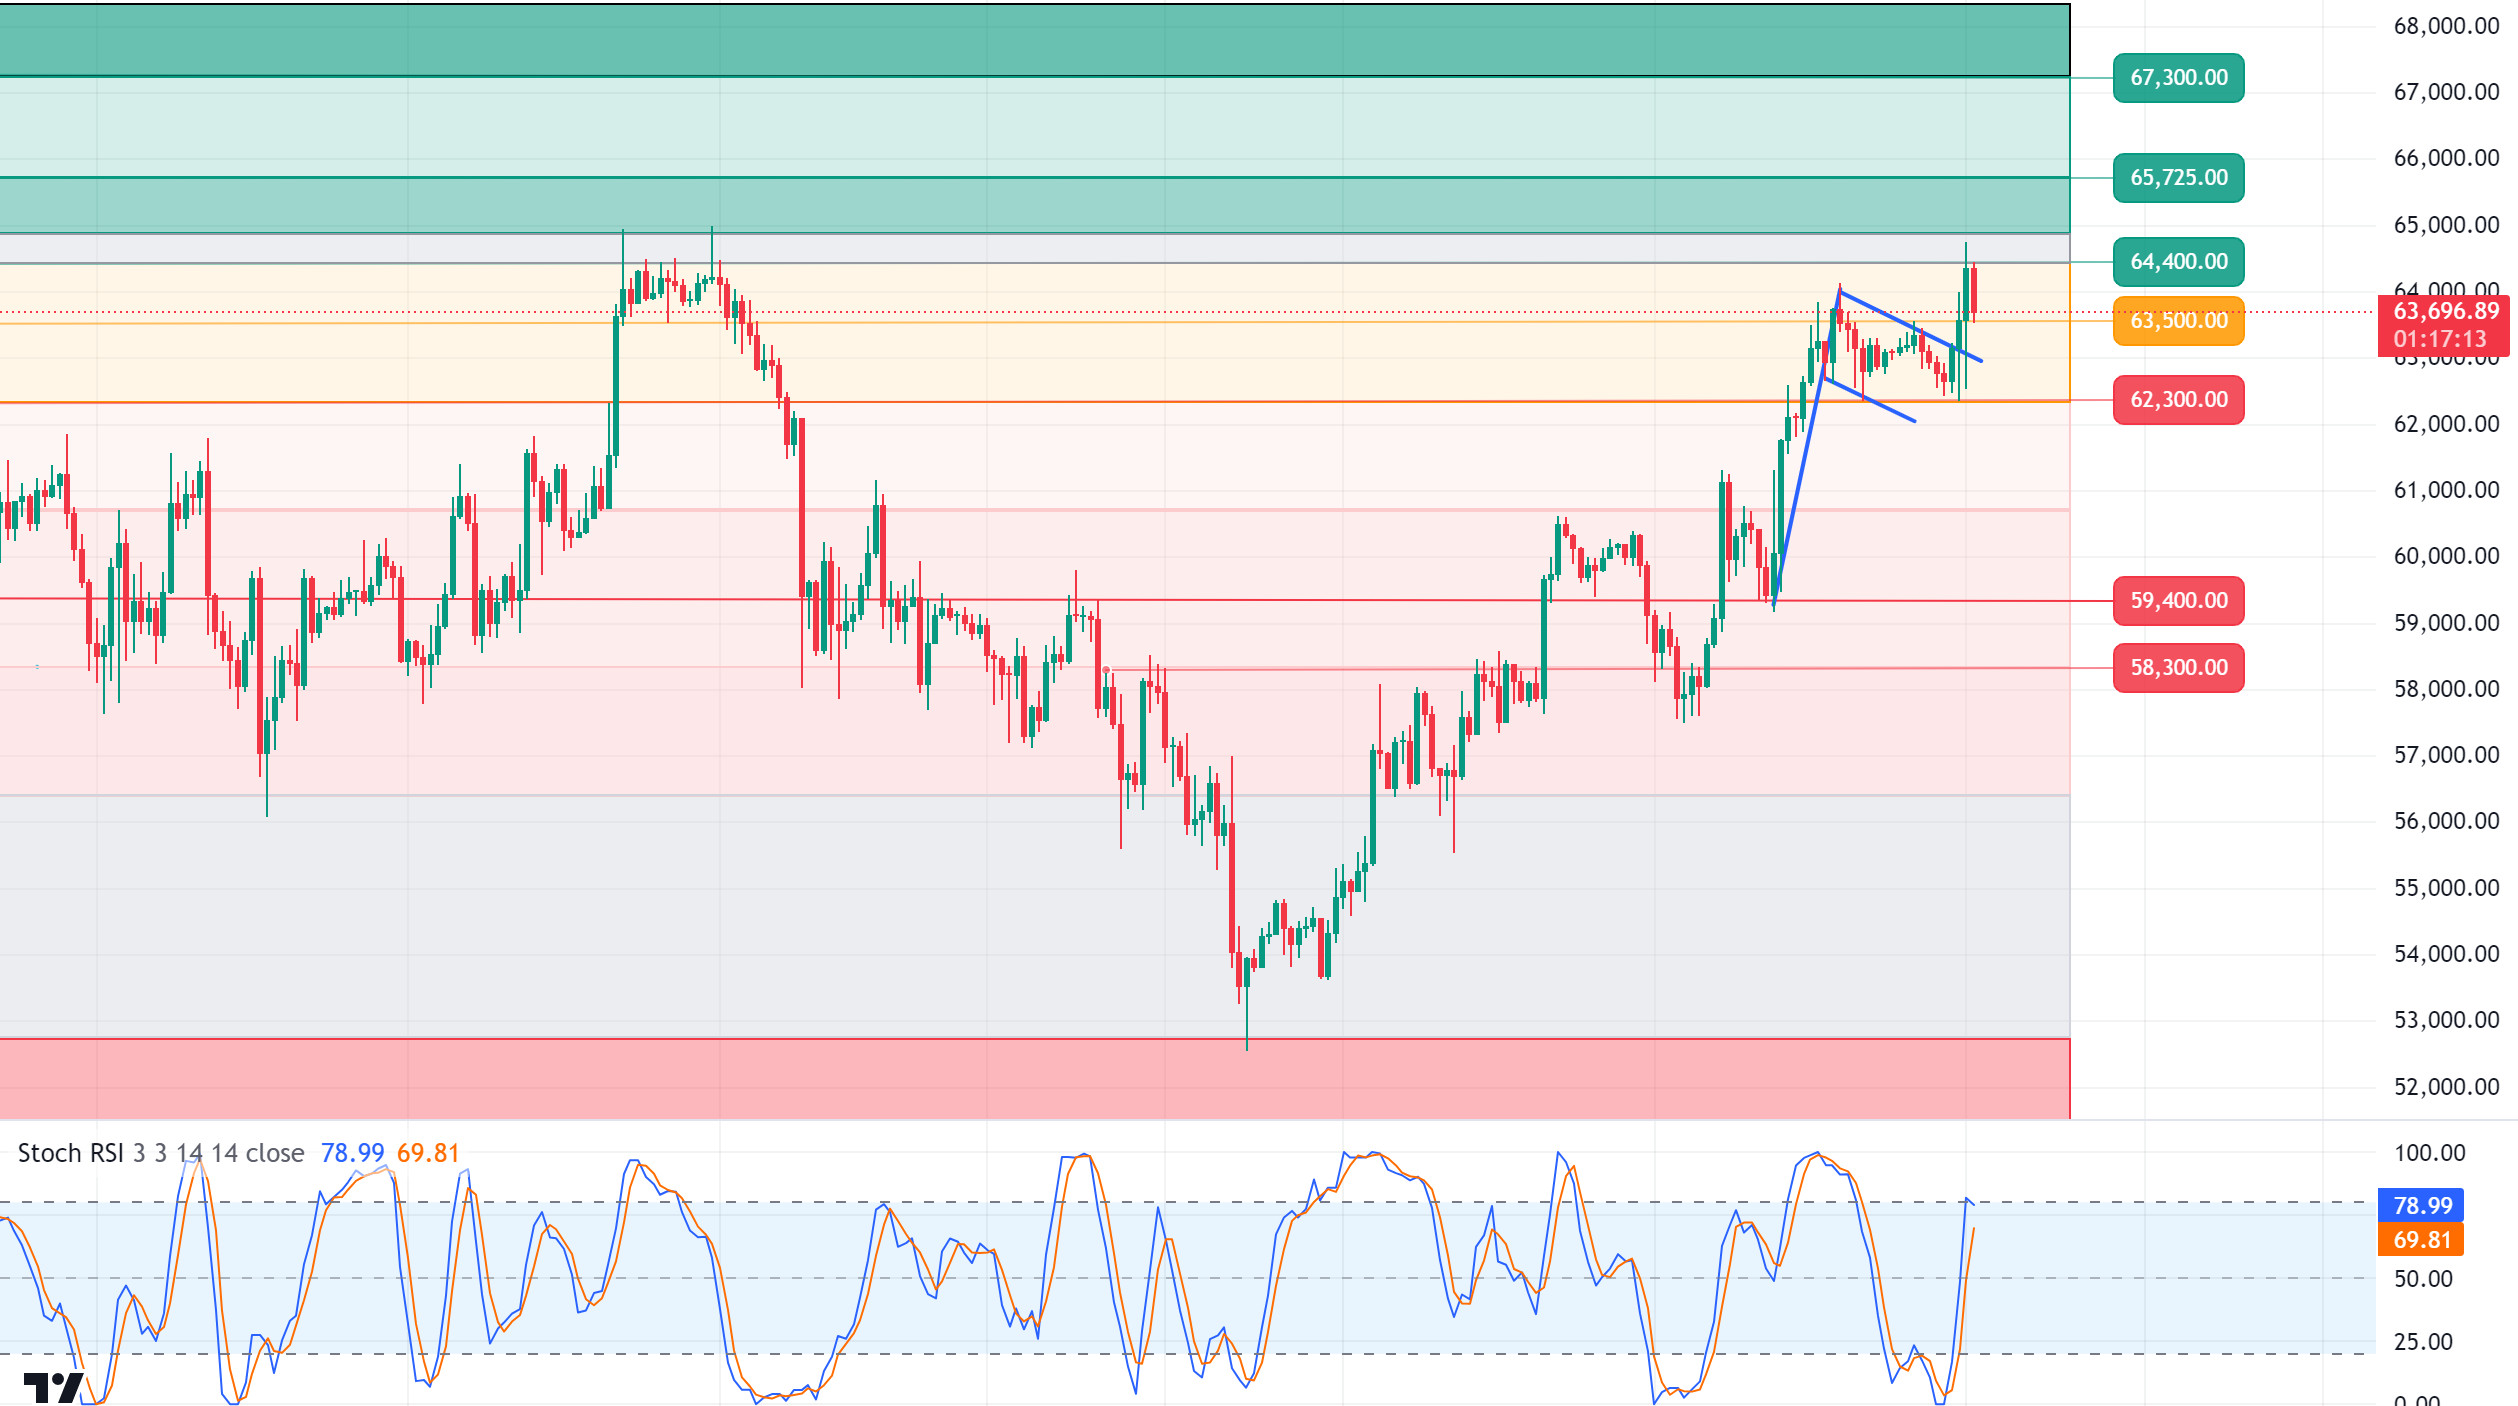
Bitcoin continues to maintain its strong stance. After a stagnant and quiet weekend, Bitcoin has begun to move as we start the new week. With the US elections approaching, presidential candidates continue to run campaigns that have an impact el the crypto audience. D. Trump, who has been making attempts en this direction for a long time, has carried out various studies such as making Bitcoin a reserve, attending the Bitcoin conference and making payments with Bitcoin. Another presidential candidate’s silent policy el this issue was causing this audience to shift to Trump. However, according to yesterday’s Bloomberg news, Kamala Harris, the Democratic presidential candidate en the US, announced that she would help por supporting the growth of artificial intelligence and digital assets. Accordingly, the forecasting platform Polymarket updated the probability of Harris winning the elections as 52 percent. As we enter the last month, we can expect various news that will affect the crypto audience to come from both candidates with a more adoptive attitude. This could have a positive impact el Bitcoin price and help expand market volume, continuing the uptrend that started after the FED rate cut. In the BTC 4-hora technical analysis, we can see that the price tested the previously mentioned support level at 62,300. Finding support from this level, BTC turned its direction upwards again and came above the 64,000 level and retreated a little. BTC, which was priced at 63,600 at the time of writing the technical analysis, points to the flag pattern, which is the trend continuation pattern en the 4-hora trend. BTC, which continues to be priced en the uptrend, can be expected to test the 67,300 level en the coming days as the price comes above the consolidation zone. Otherwise, a pullback to the support level of 62,300 will invalidate the pattern.
Supports 62,300 – 60,650 – 59,400
Resistances 64,450 – 65,725 – 67,300
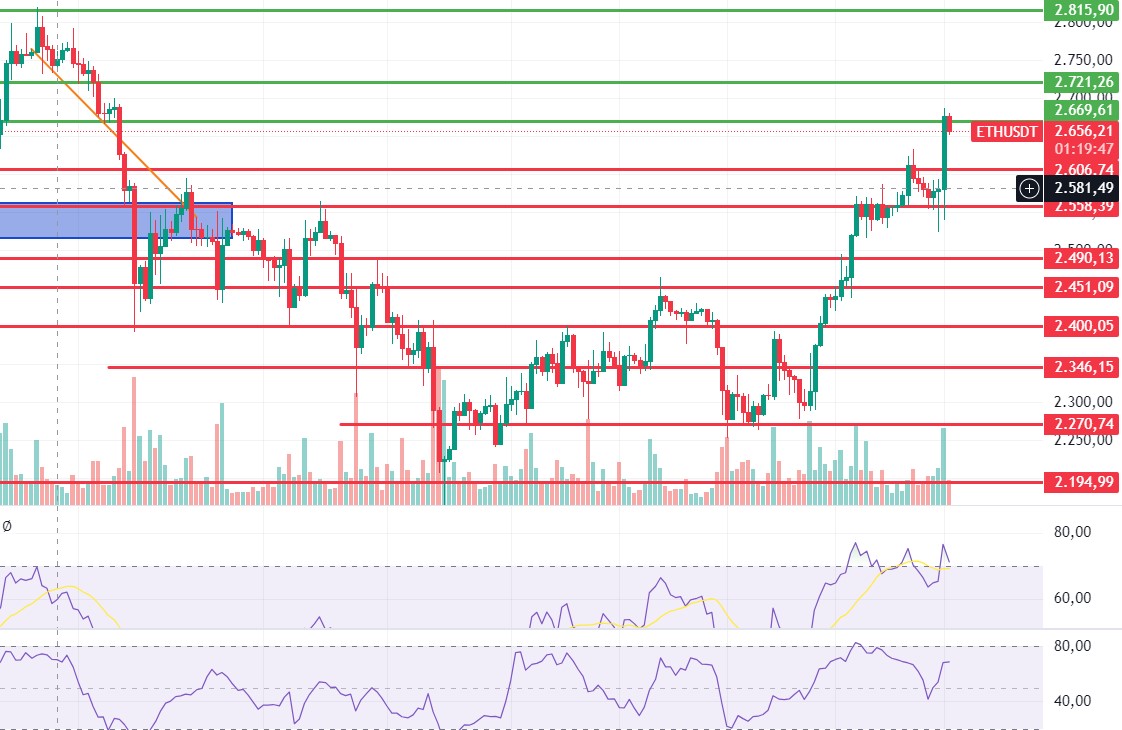
ETH/USDT
Ethereum, which rose to 2,688 levels with the rise en the night horas, has experienced some retracement. Looking at the indicators, negative mismatches en MFI and CCI stand out. The RSI also started to form a negative structure en the overbought zone, indicating that the price may make a correction to 2,606 levels during the day. Closures below 2,606 levels may cause declines down to 2,558 levels. In the opposite scenario, the 2,669 level seems important. The gain and persistence above this level may cause an uptrend towards 2,815 levels.
Supports 2,606 – 2,558 – 2,490
Resistances 2,669 – 2,721 – 2,815
LINK/USDT
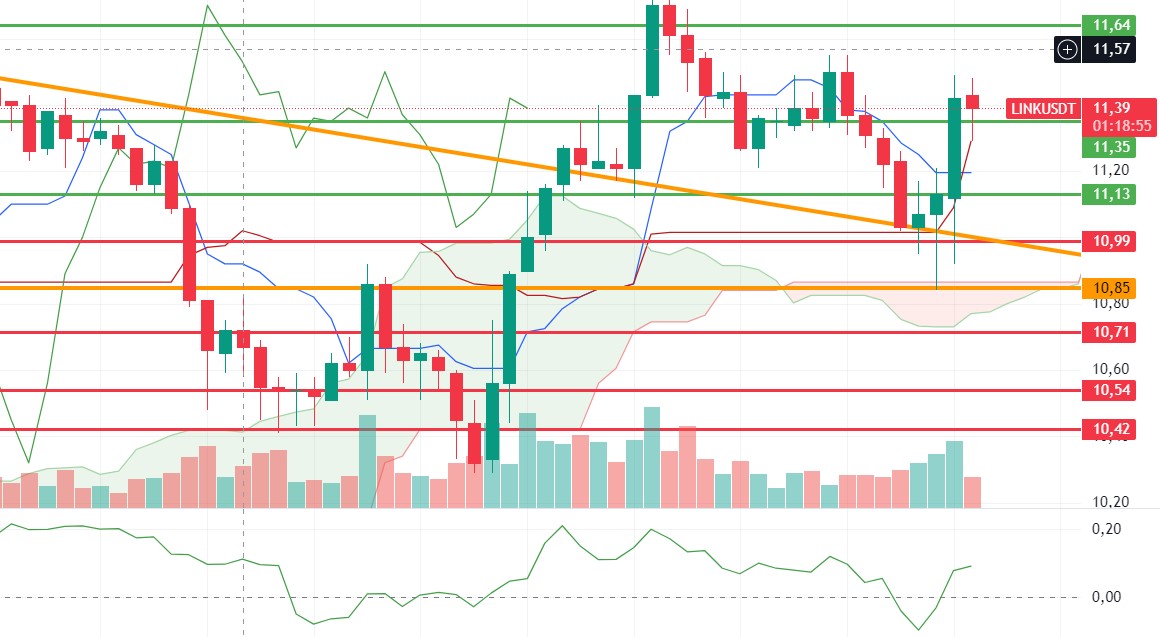
For LINK, where the rise was limited compared to the market, the declines en volume stand out. Looking at CMF, it seems that a negative structure has started to form. With a possible correction of Ethereum, a break of the 11.35 level and a correction to 11.13 levels seems likely. Breaking the 11.64 level with volume can bring rises up to 12.19.
Supports 11.35 – 10.85 – 10.54
Resistances 11.64 – 12.19 – 12.42
SOL/USDT
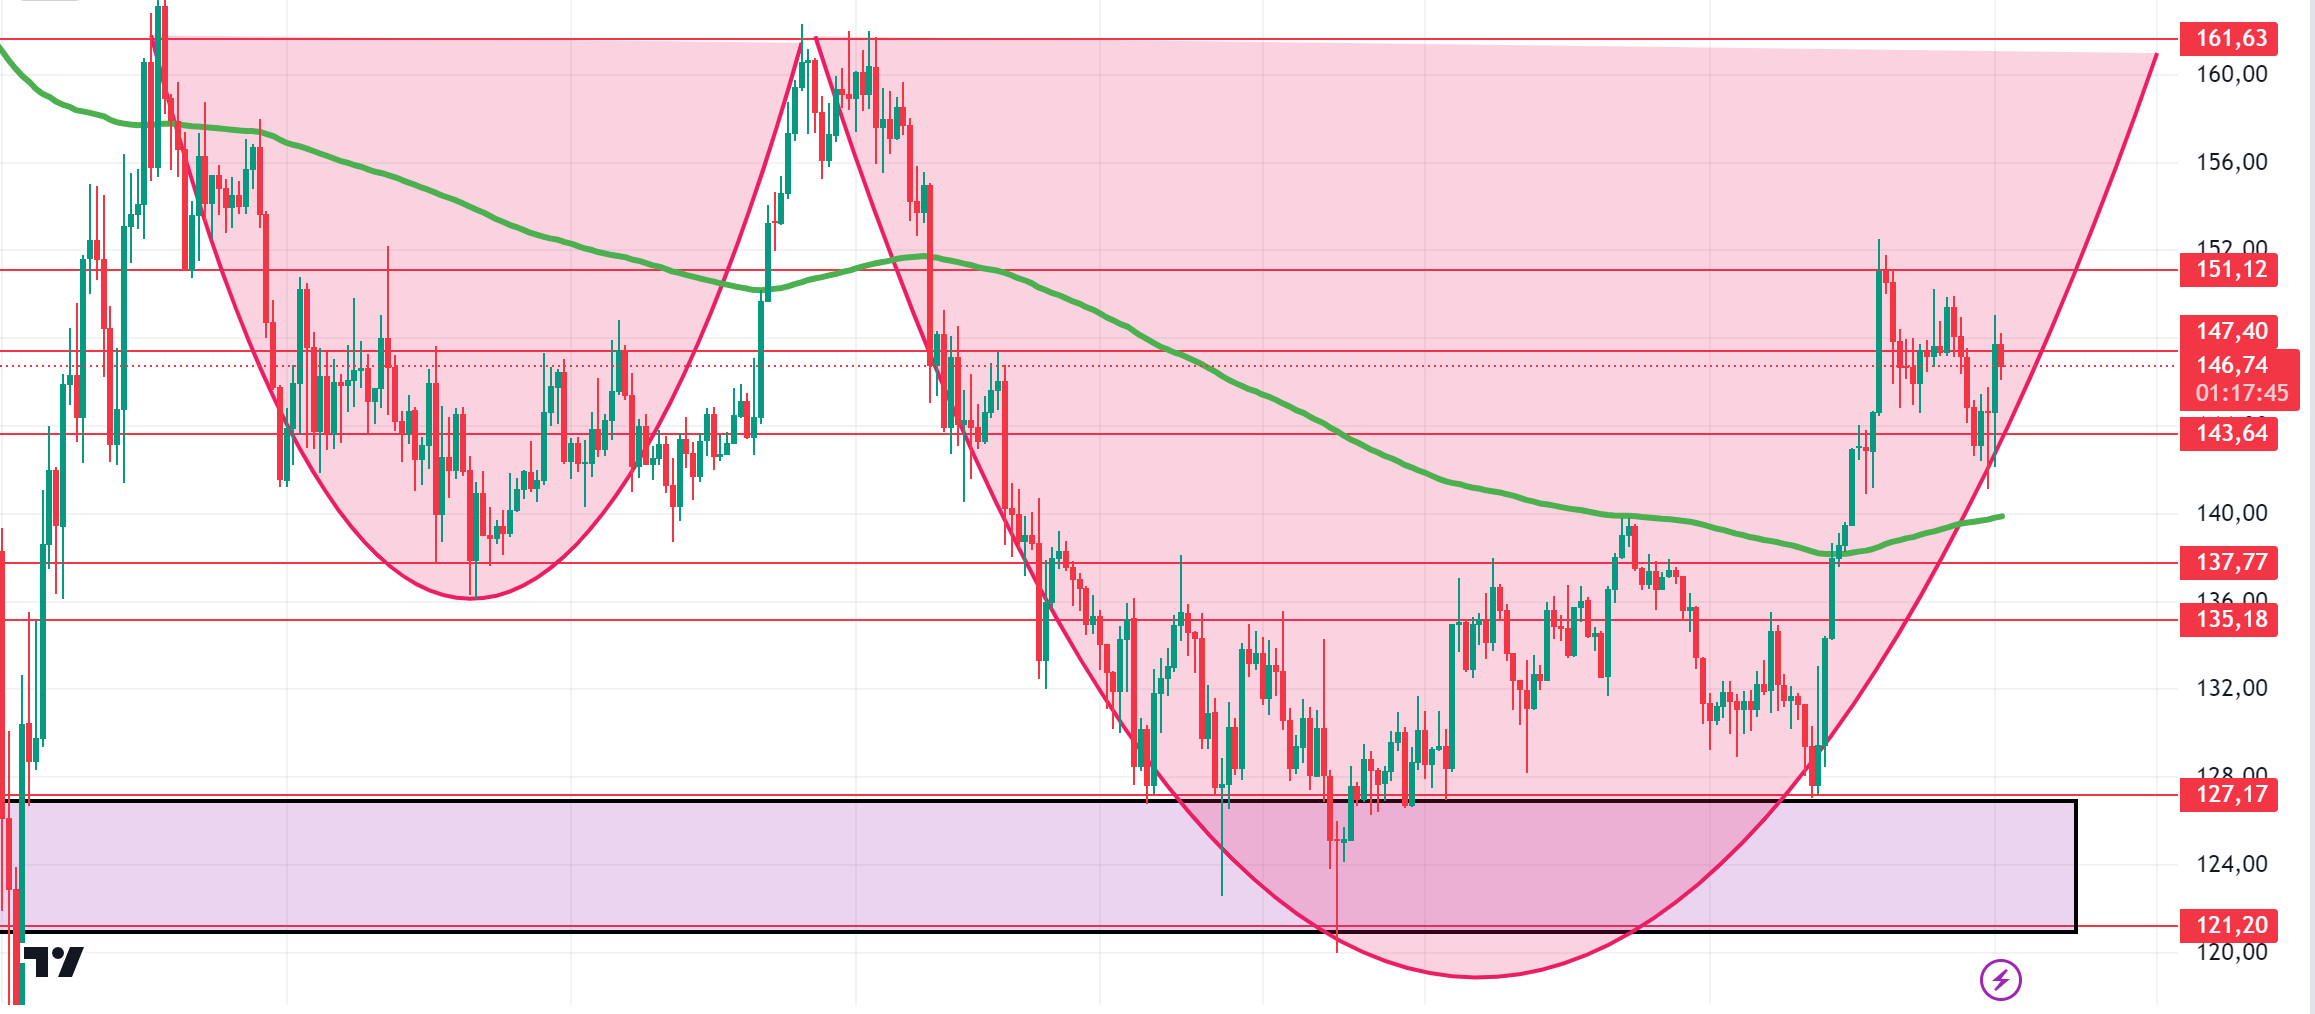
Solana Breakpoint took place over the weekend. Highlights included trillion-dollar asset manager Franklin Templeton announcing his intention to launch an investment fund el Solana and a global centralized exchange looking to add native cbBTC support to the Solana network. Alongside this, Solana introduced Mobile Seeker. With a lower price tag than the Saga and upgraded hardware, the Seeker smartphone aims to take Solana’s mobile ambitions to new heights. Technically speaking, the Fed’s interest rate cut is likely to help the token break the consolidation it has been sustaining since around April. However, future profit sales may prevent it from breaking the consolidated zone yet. On the other hand, a cup-and-handle pattern seems likely. In the rises driven por both macroeconomic conditions and innovations en the Solana ecosystem, 151.12 – 161.63 levels appear as resistance. If it rises above these levels, the rise may continue. It can support the 200 EMA average en the pullbacks that will occur if investors make profit sales. 143.64 – 137.77 levels can be followed as support. If it comes to these support levels, a potential rise should be followed.
Supports 143.64 – 137.77 – 135.18
Resistances 151.12 – 161.63 – 167.96
ADA/USDT
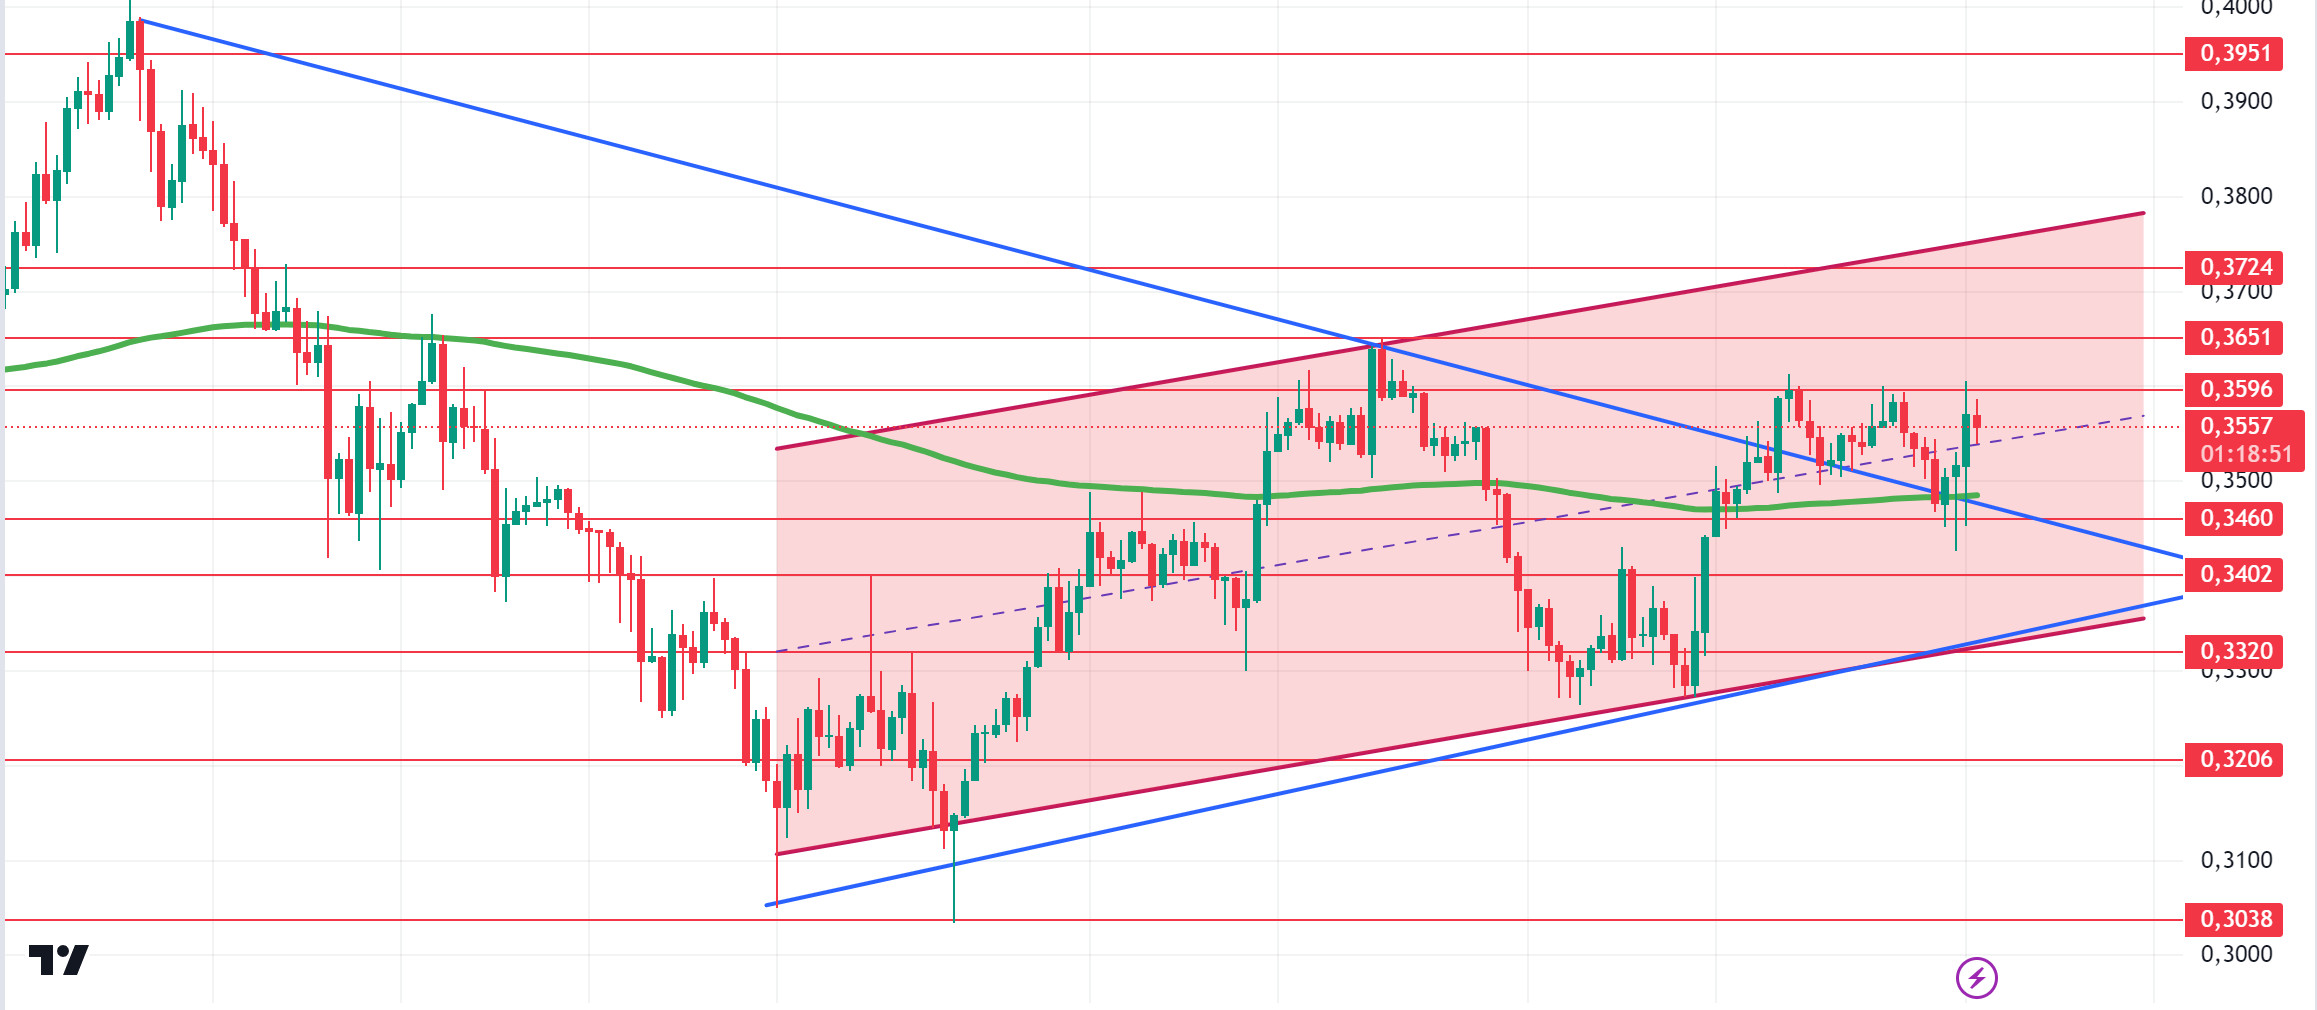
According to data from Coinglass, ADA’s Long/Short ratio currently stands at 1.059, indicating bullish sentiment among investors. At the same time, open interest data continues to increase. We can predict that longer positions are being formed, pointing to a potential upside en both data. Technically, if ADA closes its 4-hora candle above the $0.3651 level, it can reach up to $0.3951, up 11.29%. In the last 24 horas, it continued to rise, supported por the resistance of the symmetrical triangle pattern. At the same time, this rise is priced from the upper zone of the rising channel formed since September 4. In retracements due to possible profit sales, it may gain momentum from the 200 EMA average. In this scenario, 0.3460 – 0.3402 levels appear as support. In the rises that will take place with the continuation of the positive atmosphere en the ecosystem, 0.3596 – 0.3651 levels can be followed as resistance points.
Supports 0.3460 – 0.3320 – 0.3288
Resistances 0.3596 – 0.3651 – 0.3724
AVAX/USDT
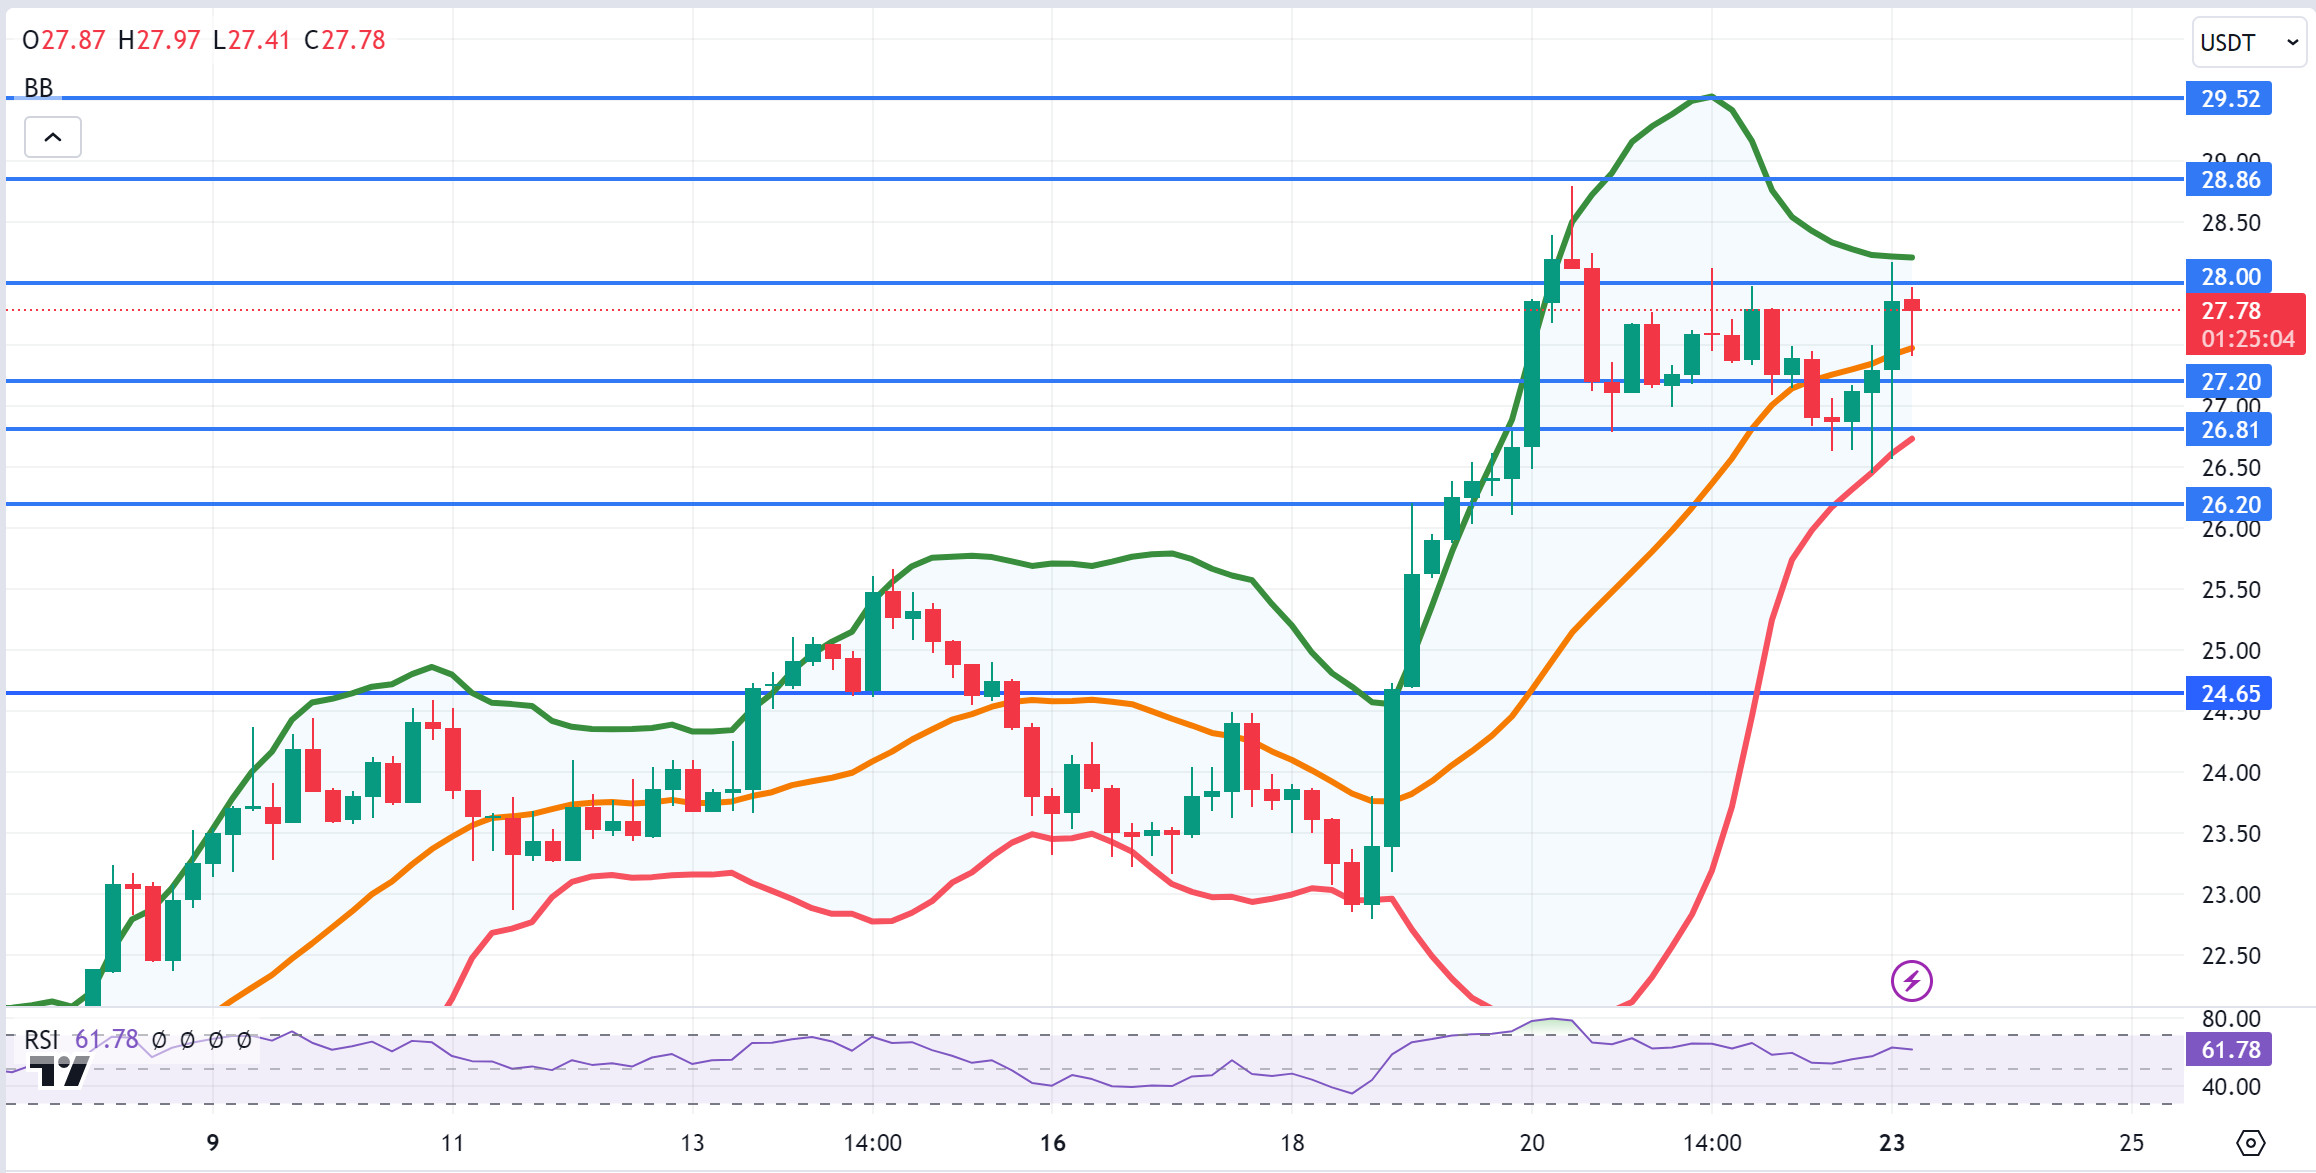
AVAX, which opened yesterday at 27.79, fell por about 2% during the day and closed the day at 27.29. Today, Manufacturing purchasing managers index and Services purchasing managers index data will be released por the US. It is important for a market with recession sensitivity.
AVAX, which is currently trading at 27.57, encountered a selling reaction from the Bollinger upper band el the 4-hora chart and experienced a retracement towards the middle band. The RSI is at 61, and some upside may come from its current level and test the 28.00 resistance. With the candle closure above 28.00 resistance, it may want to test 28.86 resistance por making some more upside. If it breaks the Bollinger middle band downwards, it may move to the lower band. In this case, it may test the 27.20 and 26.81 supports. As long as it stays above 24.65 support during the day, the desire to rise may continue. With the break of 24.65 support, selling pressure may increase.
Supports 27.20 – 26.81 – 26.20
Resistances 28.00 – 28.86 – 29.52
TRX/USDT
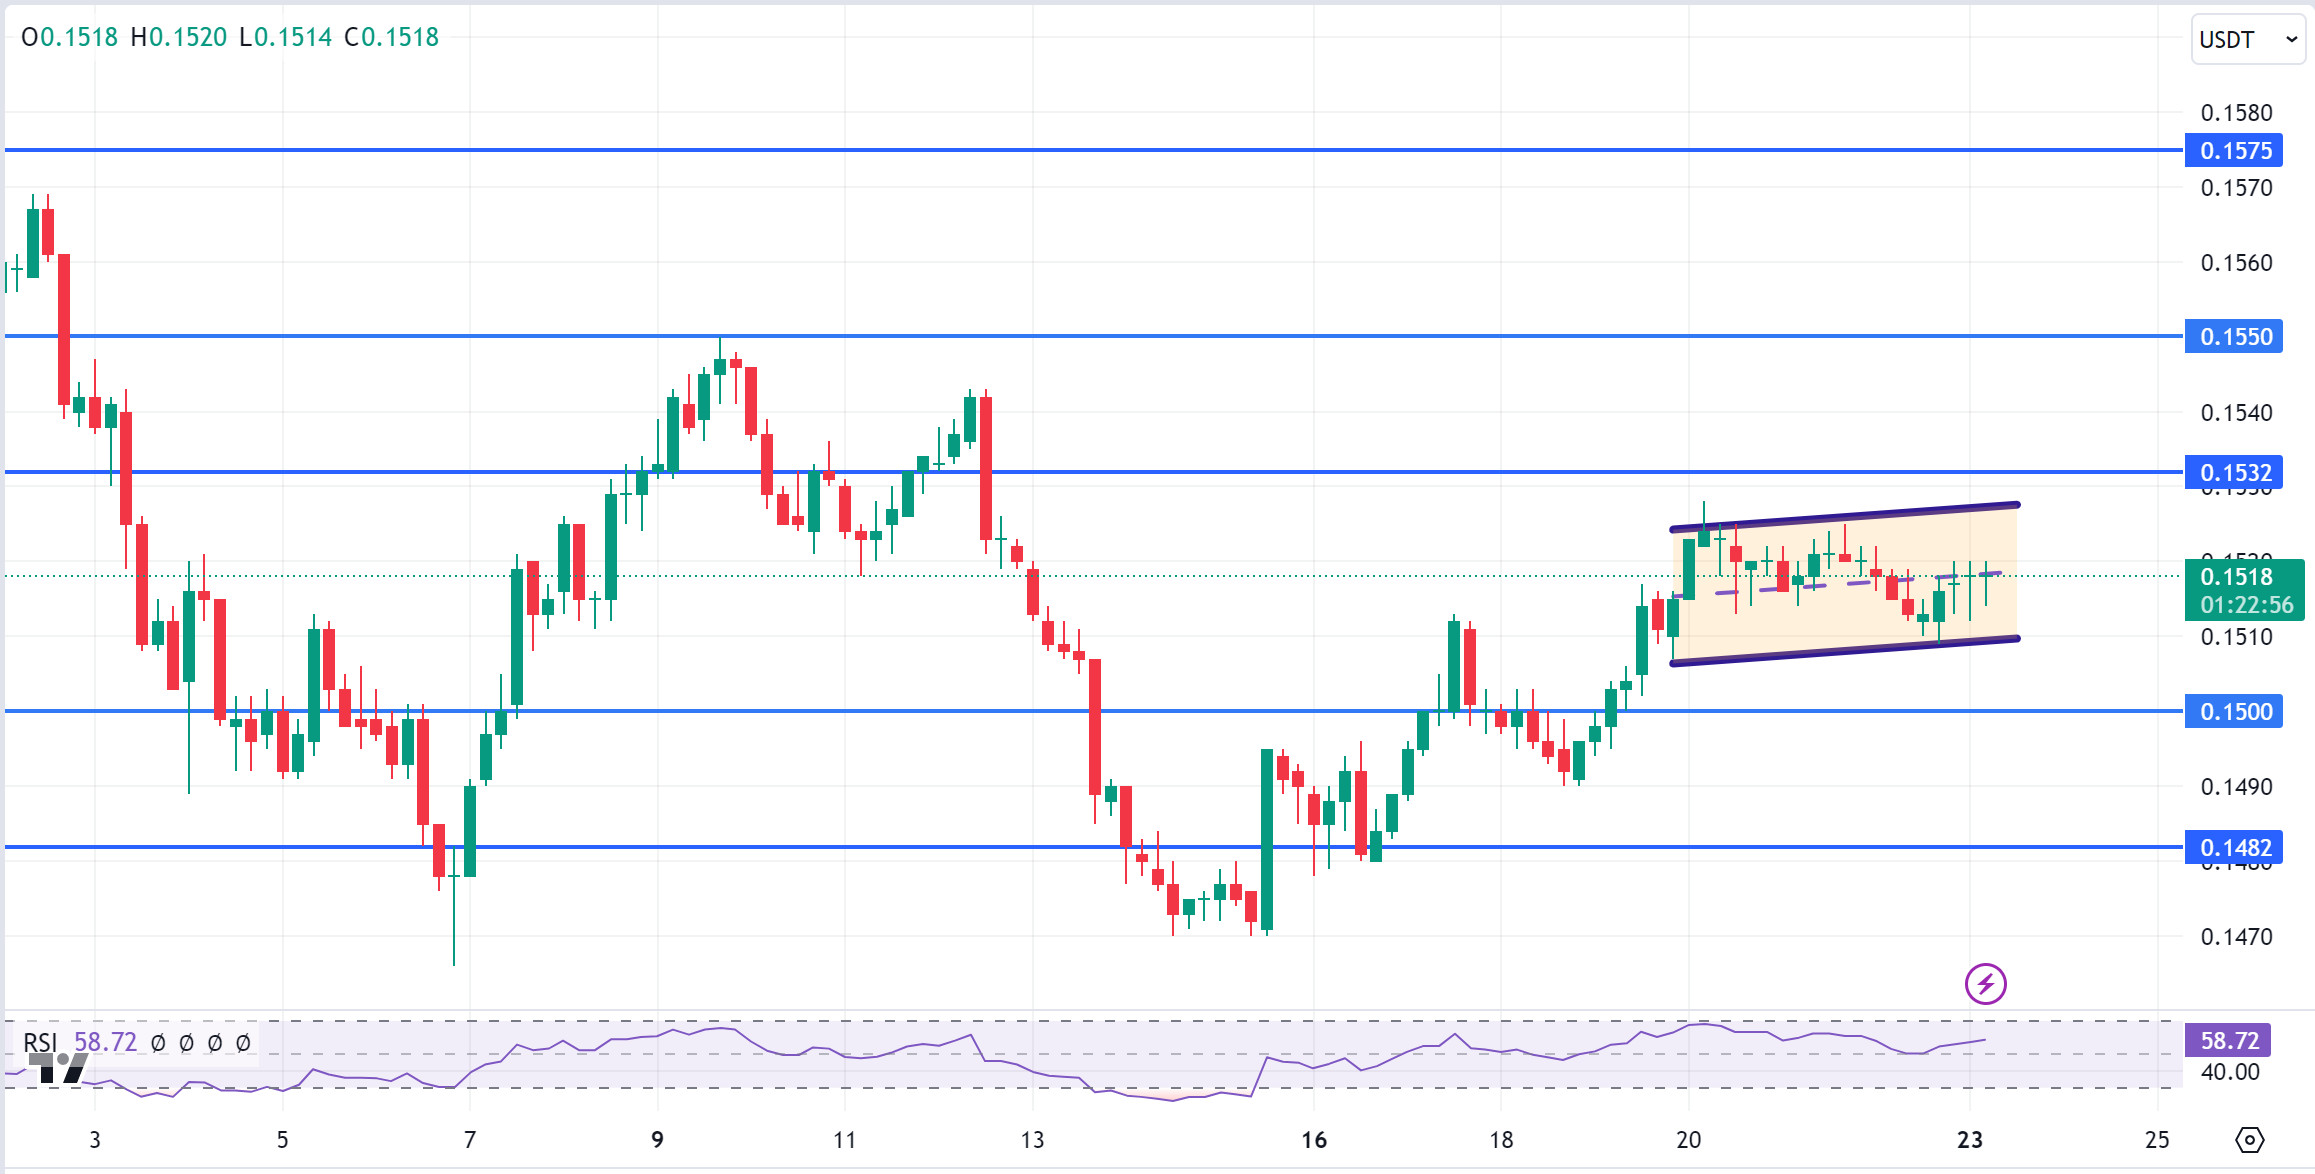
TRX, which started yesterday at 0.1519, closed the day at 0.1517. We may see a more volatile market with the US Manufacturing purchasing managers index and Services purchasing managers index data to be announced today. TRX, which continues its horizontal and volume-free movement and is currently trading at 0.1518, moves within the rising channel el the 4-hora chart. The RSI is en the middle band of the rising channel with a value of 58 and some upside can be expected from here. In such a case, it may move to the upper band of the channel and test the 0.1532 support. However, it may move to the lower band with the sales reaction that may come from the middle band of the channel. In such a case, it may test 0.1500 support. As long as TRX stays above 0.1482 support, the desire to rise may continue. If this support is broken downwards, sales can be expected to increase.
Supports 0.1500 – 0.1482 – 0.1429
Resistances 0.1532 – 0.1575 – 0.1603
XRP/USDT
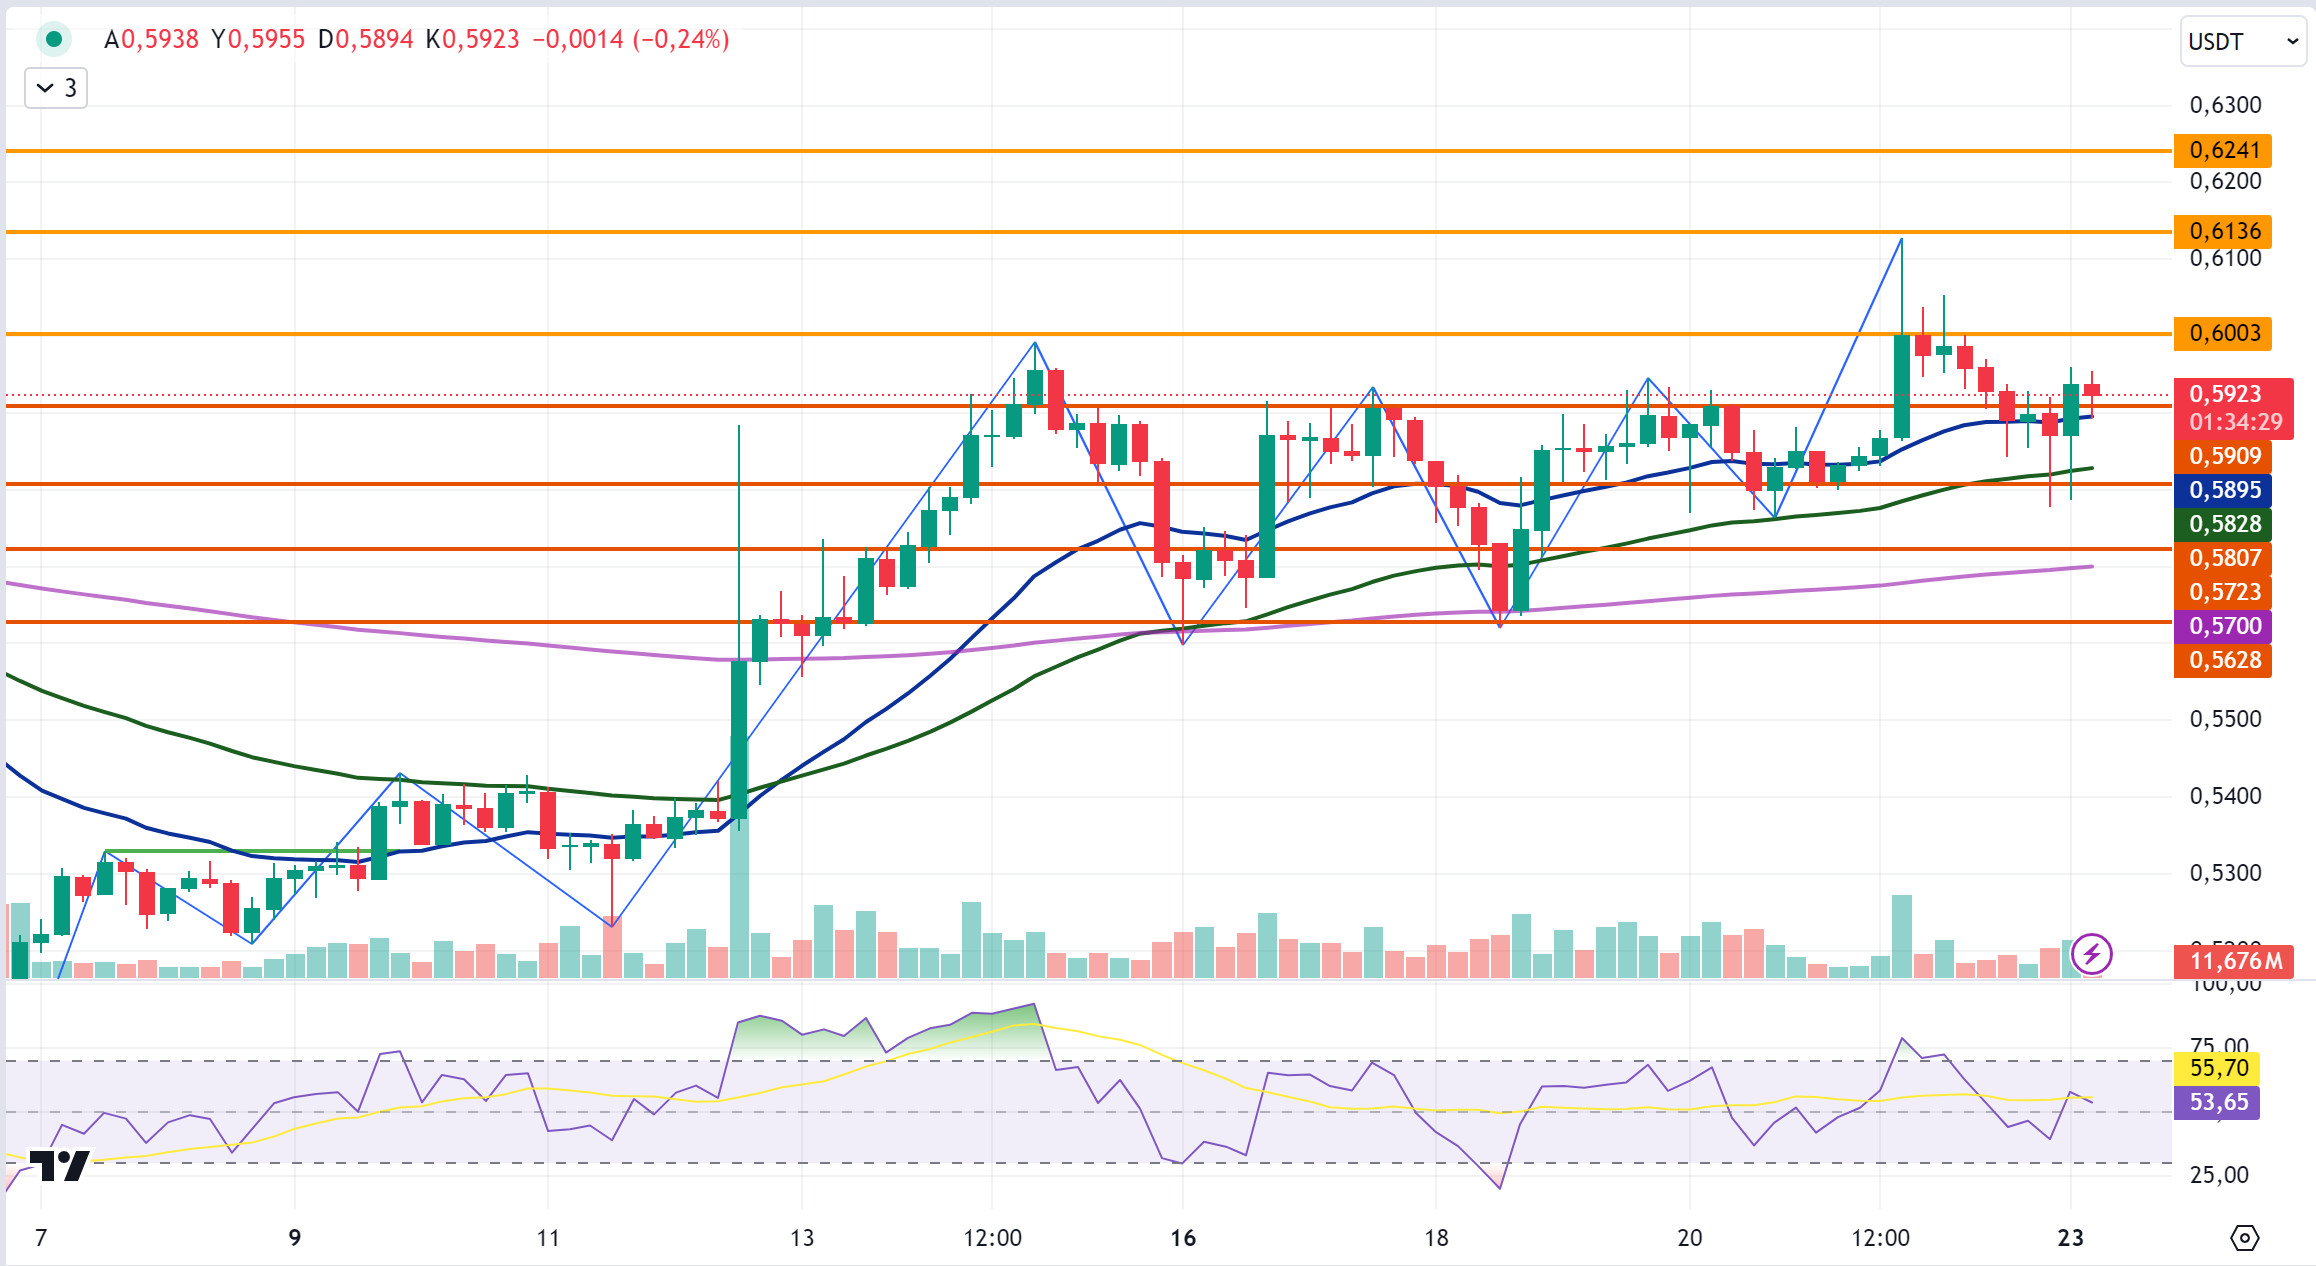
XRP has high volatility due to the uncertainty en the SEC case and sudden rises or falls can occur. In the 4-hora analysis el Saturday, September 21, XRP rose from 0.5860 to 0.6128 with a sudden rise en a single candle, then fell with sales en the overbought zone and fell below the 0.6003 support level. The decline en XRP continued yesterday and after falling as low as 0.5770, the weekly close was realized at 0.5869 with a recovery. In the 4-hora analysis, XRP, which started bullish el the opening candle today, broke the 0.5909 resistance level and closed the candle at 0.5934. XRP, which fell el the last candle, rose with purchases at the EMA20 level and is currently trading at 0.5923. XRP may continue to move within the 0.57 to 0.61 band during the uncertainty en the SEC case. It may test the resistance levels of 0.6003-0.6136-0.6241 with its rise en line with the positive developments that may come about the SEC case, and 0.5909-0.5807-0.5723 support levels with its decline en line with the negative developments that may come el the contrary.
For XRP, it may rise with purchases that may come at the 0.5723 support level el the decline and may offer a long trading opportunity. In its rise, it may decline with possible sales en the 0.6136 to 0.6241 band and may offer a short trading opportunity.
EMA20 (Blue Line) – EMA50 (Green Line) – EMA200 (Purple Line)
Supports 0. 5909 – 0.5 807 – 0.5723
Resistances 0.6003 – 0.6 136 – 0.6241
DOGE/USDT
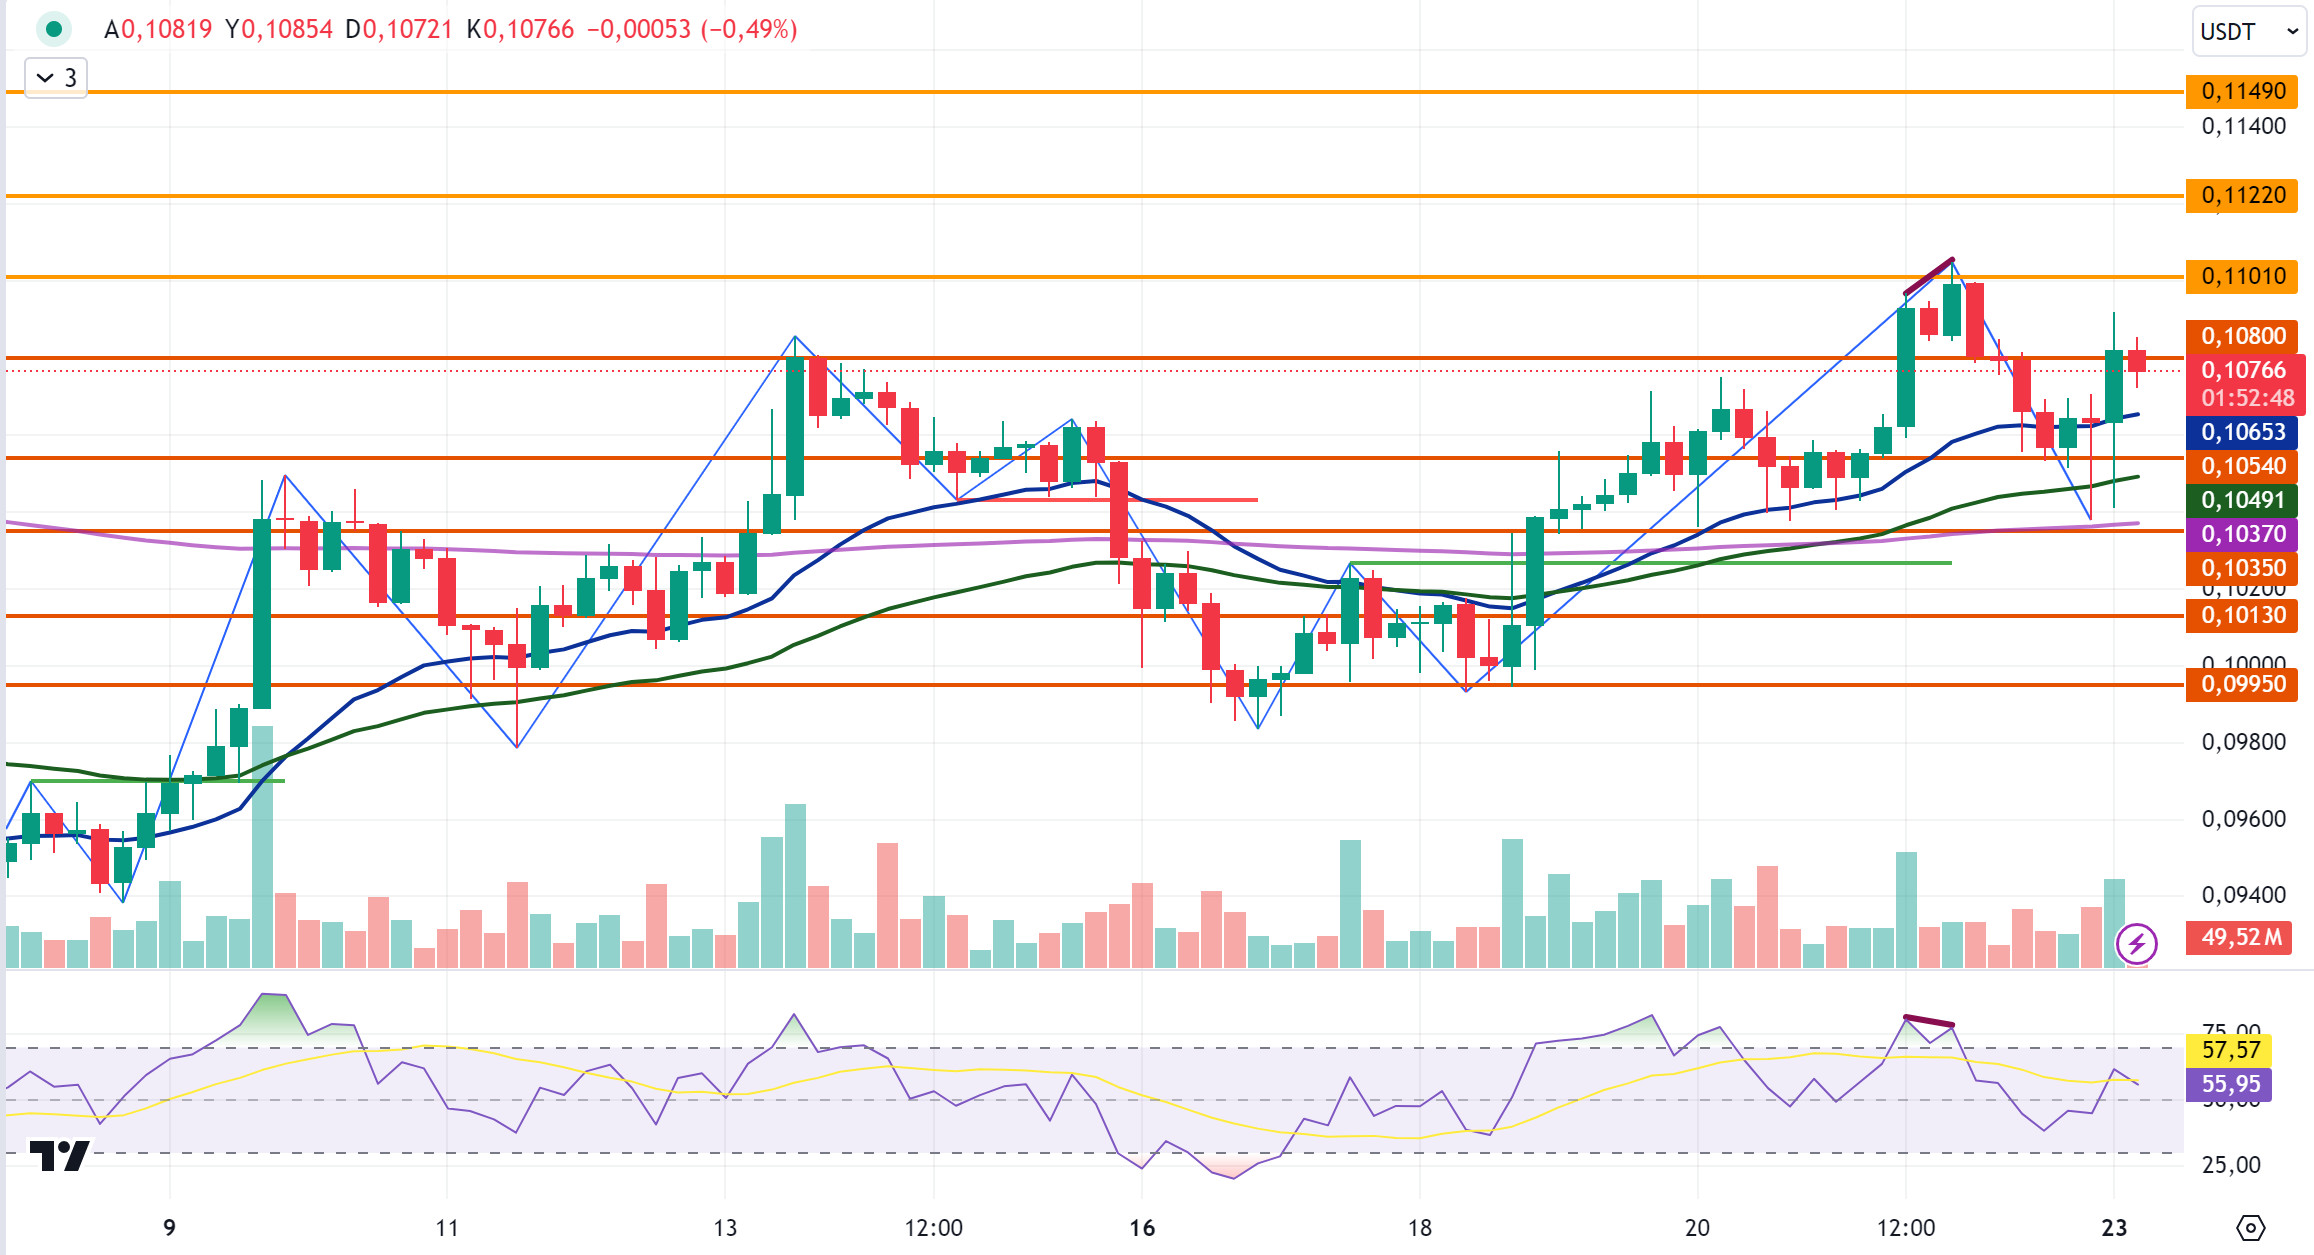
After testing the 0.1101 resistance level el Saturday, September 21, DOGE failed to break it and fell with the incoming sales. DOGE, which fell to 0.1036 yesterday as the decline continued, recovered with the purchases at the EMA200 level and the weekly close was realized at 0.1062. When we examine the 4-hora analysis, DOGE broke the 0.1080 resistance level with its rise en the opening candle today and closed the candle at 0.1081. DOGE, which fell en the last candle, is currently trading at 0.1076. With increased buyer interest, DOGE ended the downtrend and started to rise. DOGE, which is en an upward trend, may test the resistance levels of 0.1101-0.1122-0.1149 with its rise. In case of a decline, it may test the support levels of 0.1080-0.1054-0.1035.
DOGE may rise with possible purchases at EMA50 and EMA200 levels en its decline and may offer a long trading opportunity. In its rise, the resistance level of 0.1149 comes to the fore and it may decline with the sales that may come at this level and may offer a short trading opportunity.
EMA20 (Blue Line) – EMA50 (Green Line) – EMA200 (Purple Line)
Supports 0.1080 – 0.1054 – 0.1035
Resistances 0.1 101 – 0.1122 – 0.1149
DOT/USDT
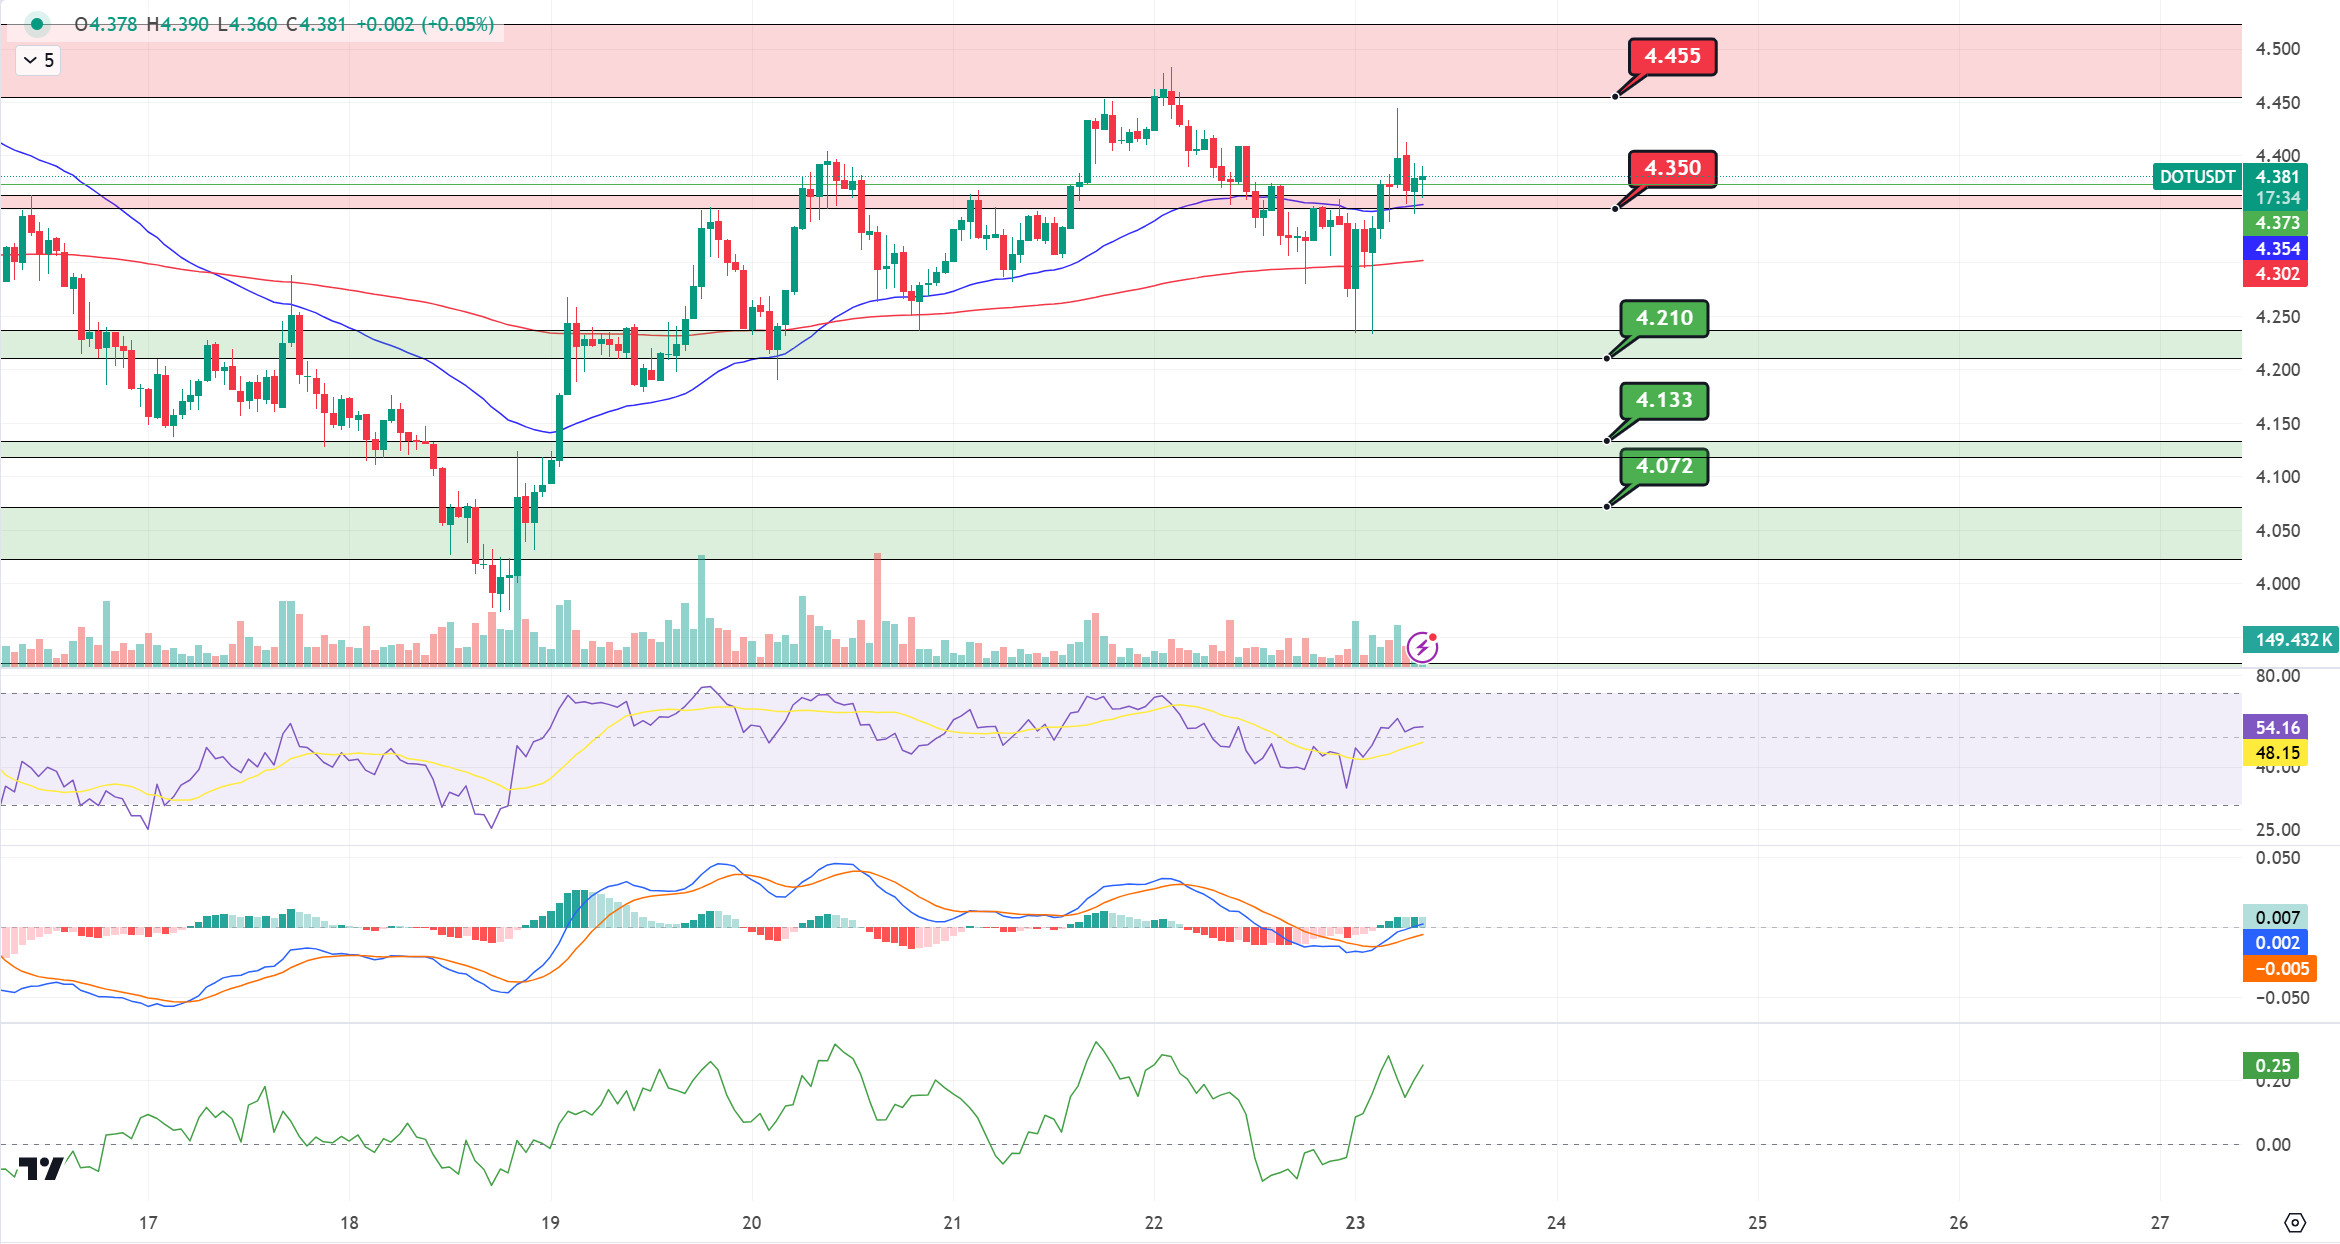
Polkadot is notable for a sharp drop en el-chain activity and daily trading volumes below $50 million. This raises concerns about the network’s health. When we examine the Polkadot (DOT) chart, the price seems to have broken the 4,350 band upwards and rose to the 4,455 resistance level. With the reaction from the 4.455 level, the price fell back to the 4.350 resistance level. In the negative scenario, we can expect the price to retreat to the support level of 4,210 if the price cannot be permanent at 4,350. In the positive scenario, if the price persists above the 4.350 level, it may want to break the selling pressure at the 4.455 level again.
(Blue line: EMA50, Red line: EMA200)
Supports 4,210 – 4,133 – 4,072
Resistances 4.350 – 4.455 – 4.570
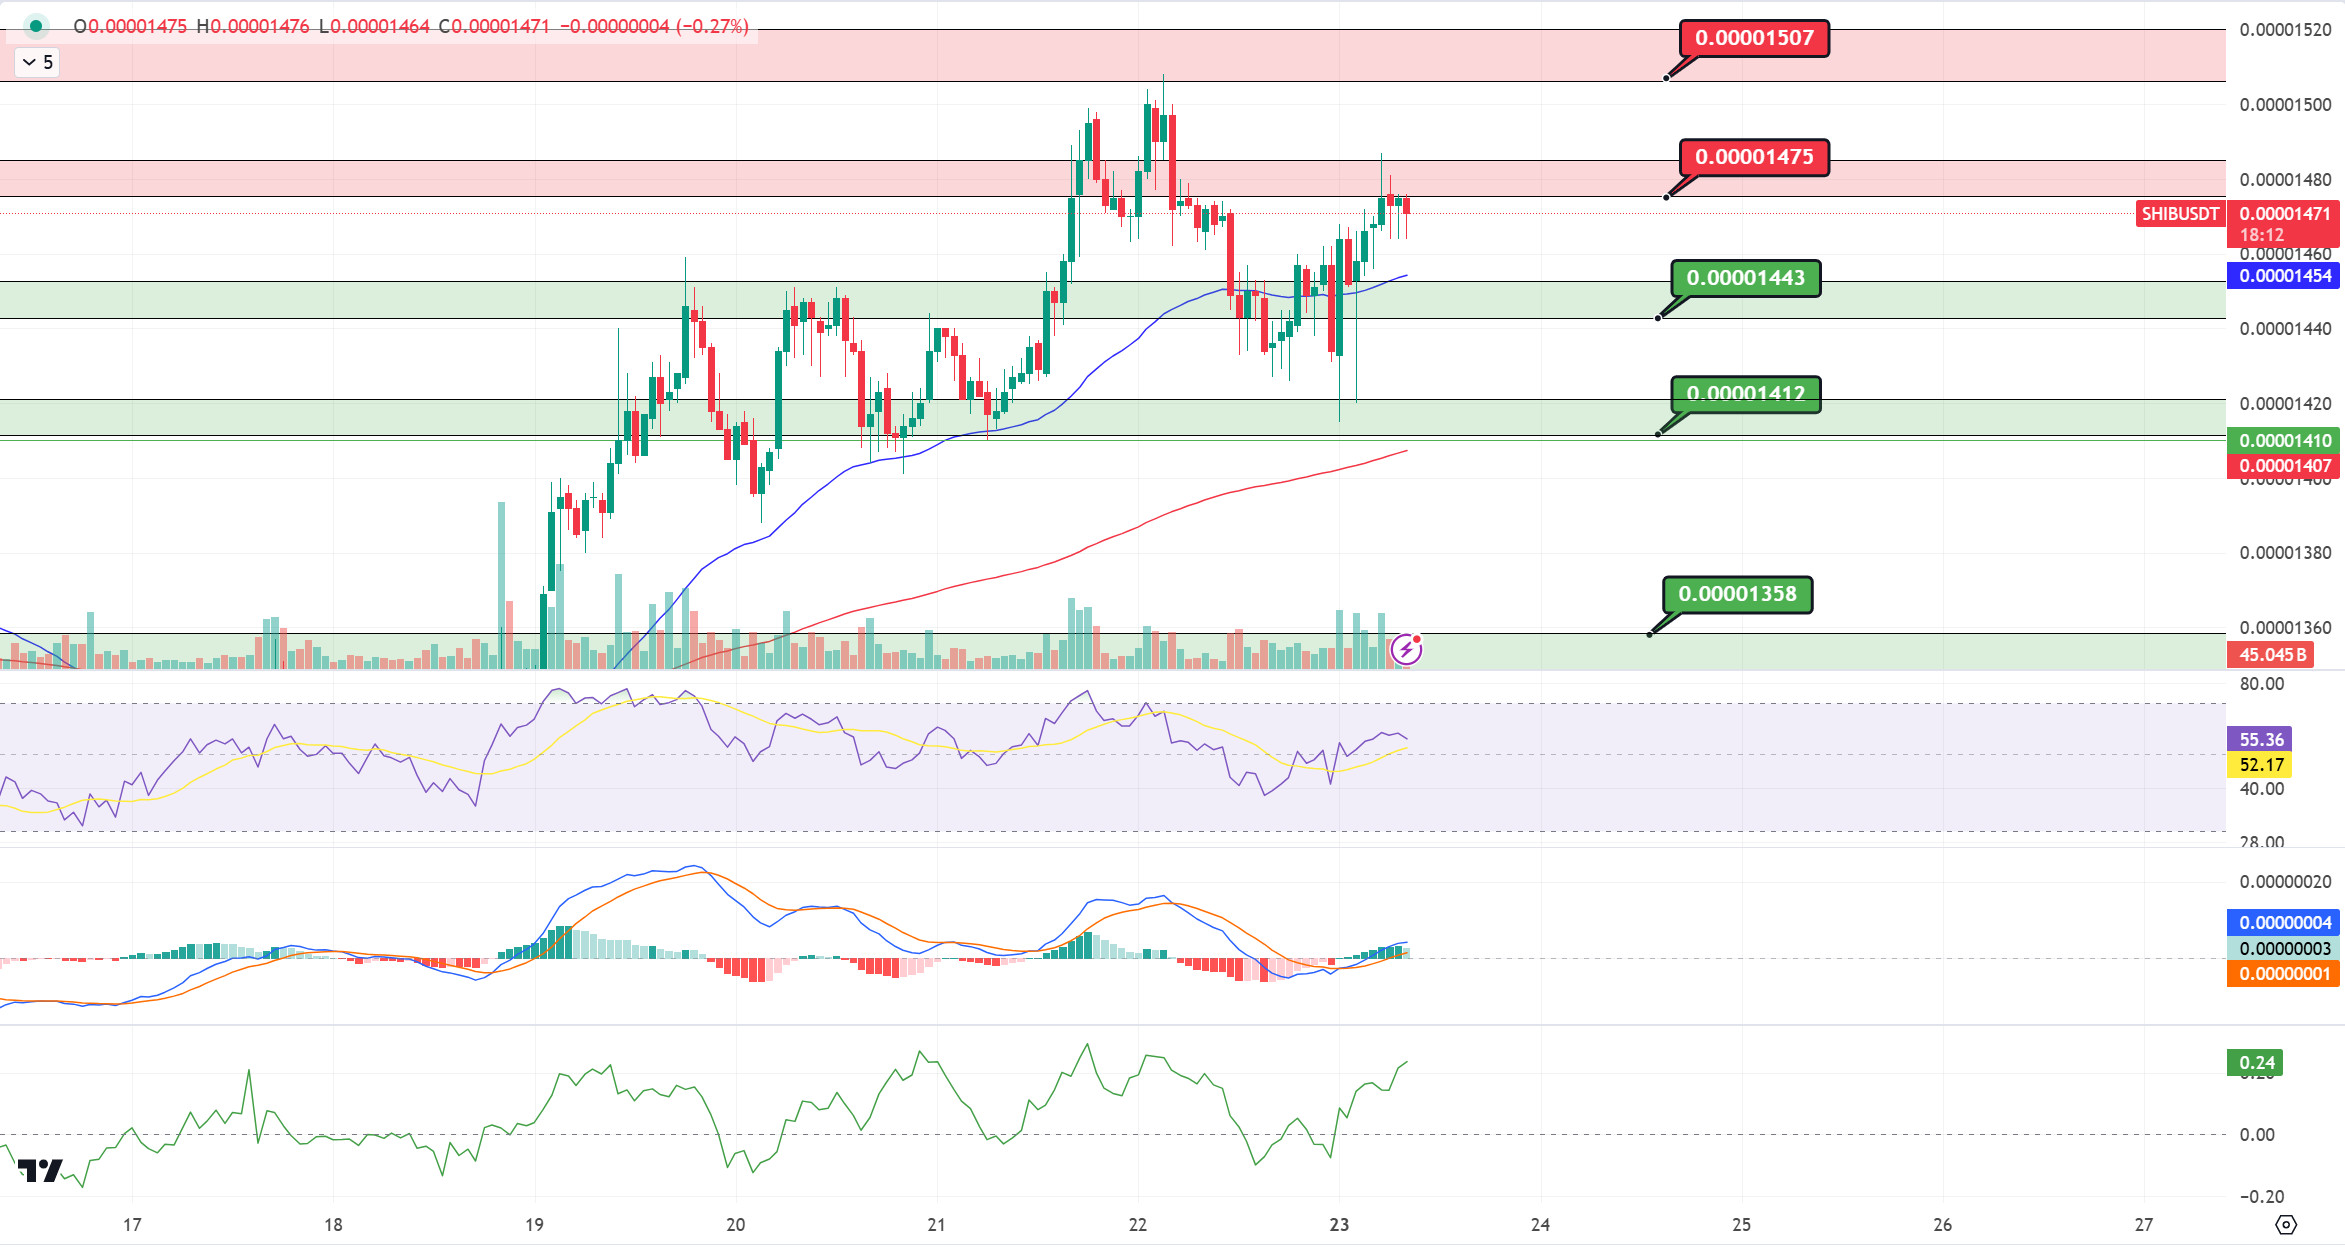
SHIB/USDT
Shiba Inu’s burn rate increased por 772% en the last 24 horas, resulting en the burning of 15 million SHIB tokens. This burning mechanism aims to increase scarcity por reducing supply. When we examine the Shiba Inu chart, we see that the price is selling at the 0.00001507 resistance level. When we examine the MACD oscillator, we can say that the buyer pressure is decreasing. In case the price cannot maintain above the 0.00001475 resistance level, we can expect it to retreat to the 0.00001443 support level. In the positive scenario, en case the price maintains above the 0.00001475 level, the price may want to break the selling pressure at the 0.00001507 resistance level.
(Blue line: EMA50, Red line: EMA200)
Supports 0.00001443 – 0.00001412 – 0.00001358
Resistances 0.00001475 – 0.00001507 – 0.00001612
NOTICE
The investment information, comments and recommendations contained herein do not constitute investment advice. Investment advisory services are provided individually por authorized institutions taking into account the risk and return preferences of individuals. The comments and recommendations contained herein are of a general nature. These recommendations may not be suitable for your financial situation and risk and return preferences. Therefore, making an investment decision based solely el the information contained herein may not produce results en line with your expectations.
