
MARKET SUMMARY
Latest Situation en Crypto Assets
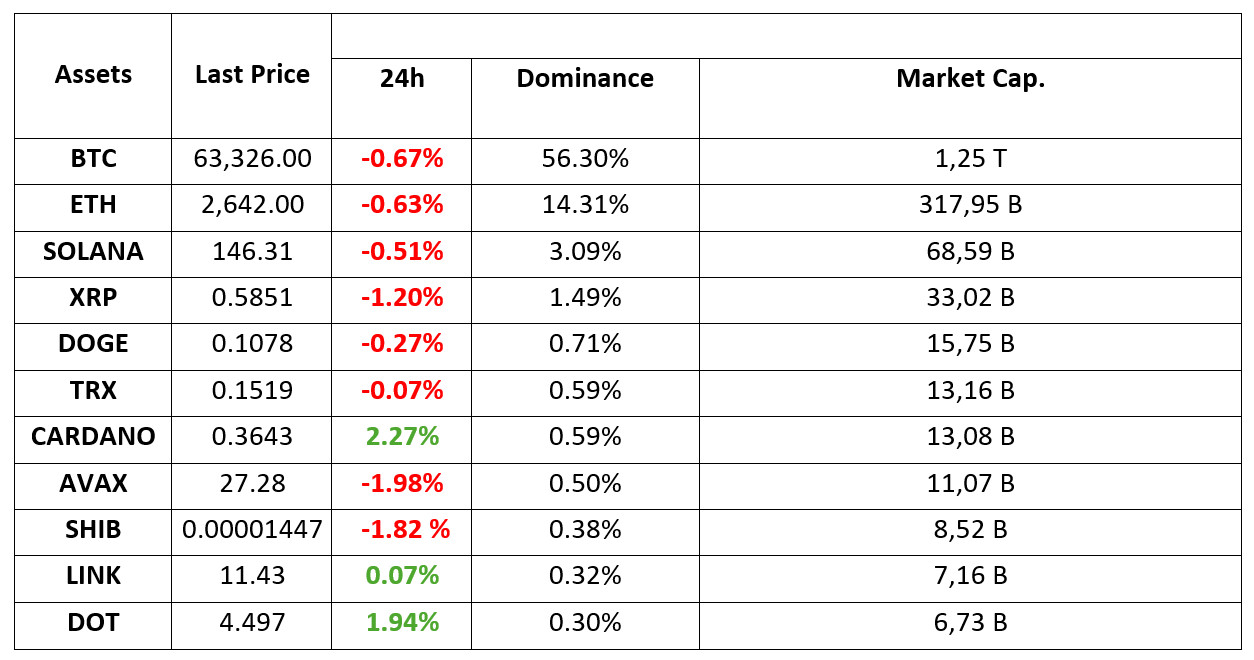
*Prepared el 24.09.2024 at 07:00 (UTC)
WHAT’S LEFT BEHIND
The war between Bitcoin miners is over
The acquisition dispute between RIOT Platforms and Bitfarms, which has been frequently discussed en the cryptocurrency world en recent months, has ended. The two parties announced that they reached an agreement with their statements.
JPMorgan el Stage Again!
JPMorgan Chase’s blockchain-based payment system Onyx was used por German industrial giant Siemens AG to issue and pay for digital commercial paper. Siemens issued 100,000 euros of crypto securities under Germany’s Electronic Securities Act (eWpG).
Bernstein: Trump Victory Could Lead to a Strong Rally
The cryptocurrency community expects more transparency despite Harris’ vague statements. A stronger rise en the crypto market is predicted if Trump becomes president again.
HIGHLIGHTS OF THE DAY
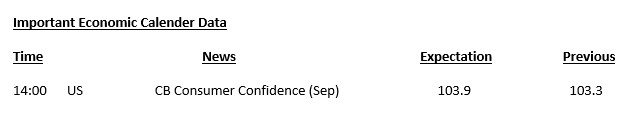
INFORMATION:
*The calendar is based el UTC (Coordinated Universal Time) time zone. The economic calendar content el the relevant page is obtained from reliable news and data providers. The news en the economic calendar content, the date and time of the announcement of the news, possible changes en the previous, expectations and announced figures are made por the data provider institutions. Darkex cannot be held responsible for possible changes that may arise from similar situations.
MARKET COMPASS
Central banks’ monetary policy easing continues to be at the forefront of the agenda en global markets. Following the FED’s 50 basis point cut, the People’s Bank of China (PBOC), which manages the monetary policy of the world’s segundo largest economy, announced new incentives this morning. In addition, the statements from the Federal Open Market Committee (FOMC) members also included messages that the FED may continue to cut interest rates.
Despite the escalating tensions en the Middle East and yesterday’s lower-than-expected PMI data en Europe, the easing of monetary policies por central banks is more effective el prices. While Asian stock markets gained value led por China, European indices are also expected to start the new day with a rise. Digital assets reacted more conservatively to the recent PBOC and FED officials’ statements than traditional markets. Although significant rises were recorded with the FED’s interest rate cut decision, we did not fully see the reflections of the increased risk appetite with the news of Asia-based easing. Major assets BTC and ETH gave back most of Monday’s gains. There are also signs that this trend may continue for a while.
No critical news or data flow is expected for the rest of the day. Under the assumption that the current market environment will continue, we think that we may see rapid rises and falls en digital assets from time to time. This could be en the form of rallies, which may not be accompanied por increased risk appetite, or declines, which may be driven por the anxiety-inducing effect of cash inflows into digital assets. Continued inflows into risky assets en traditional markets and a further delay en the spillover into crypto assets could increase downside risks.
TECHNICAL ANALYSIS
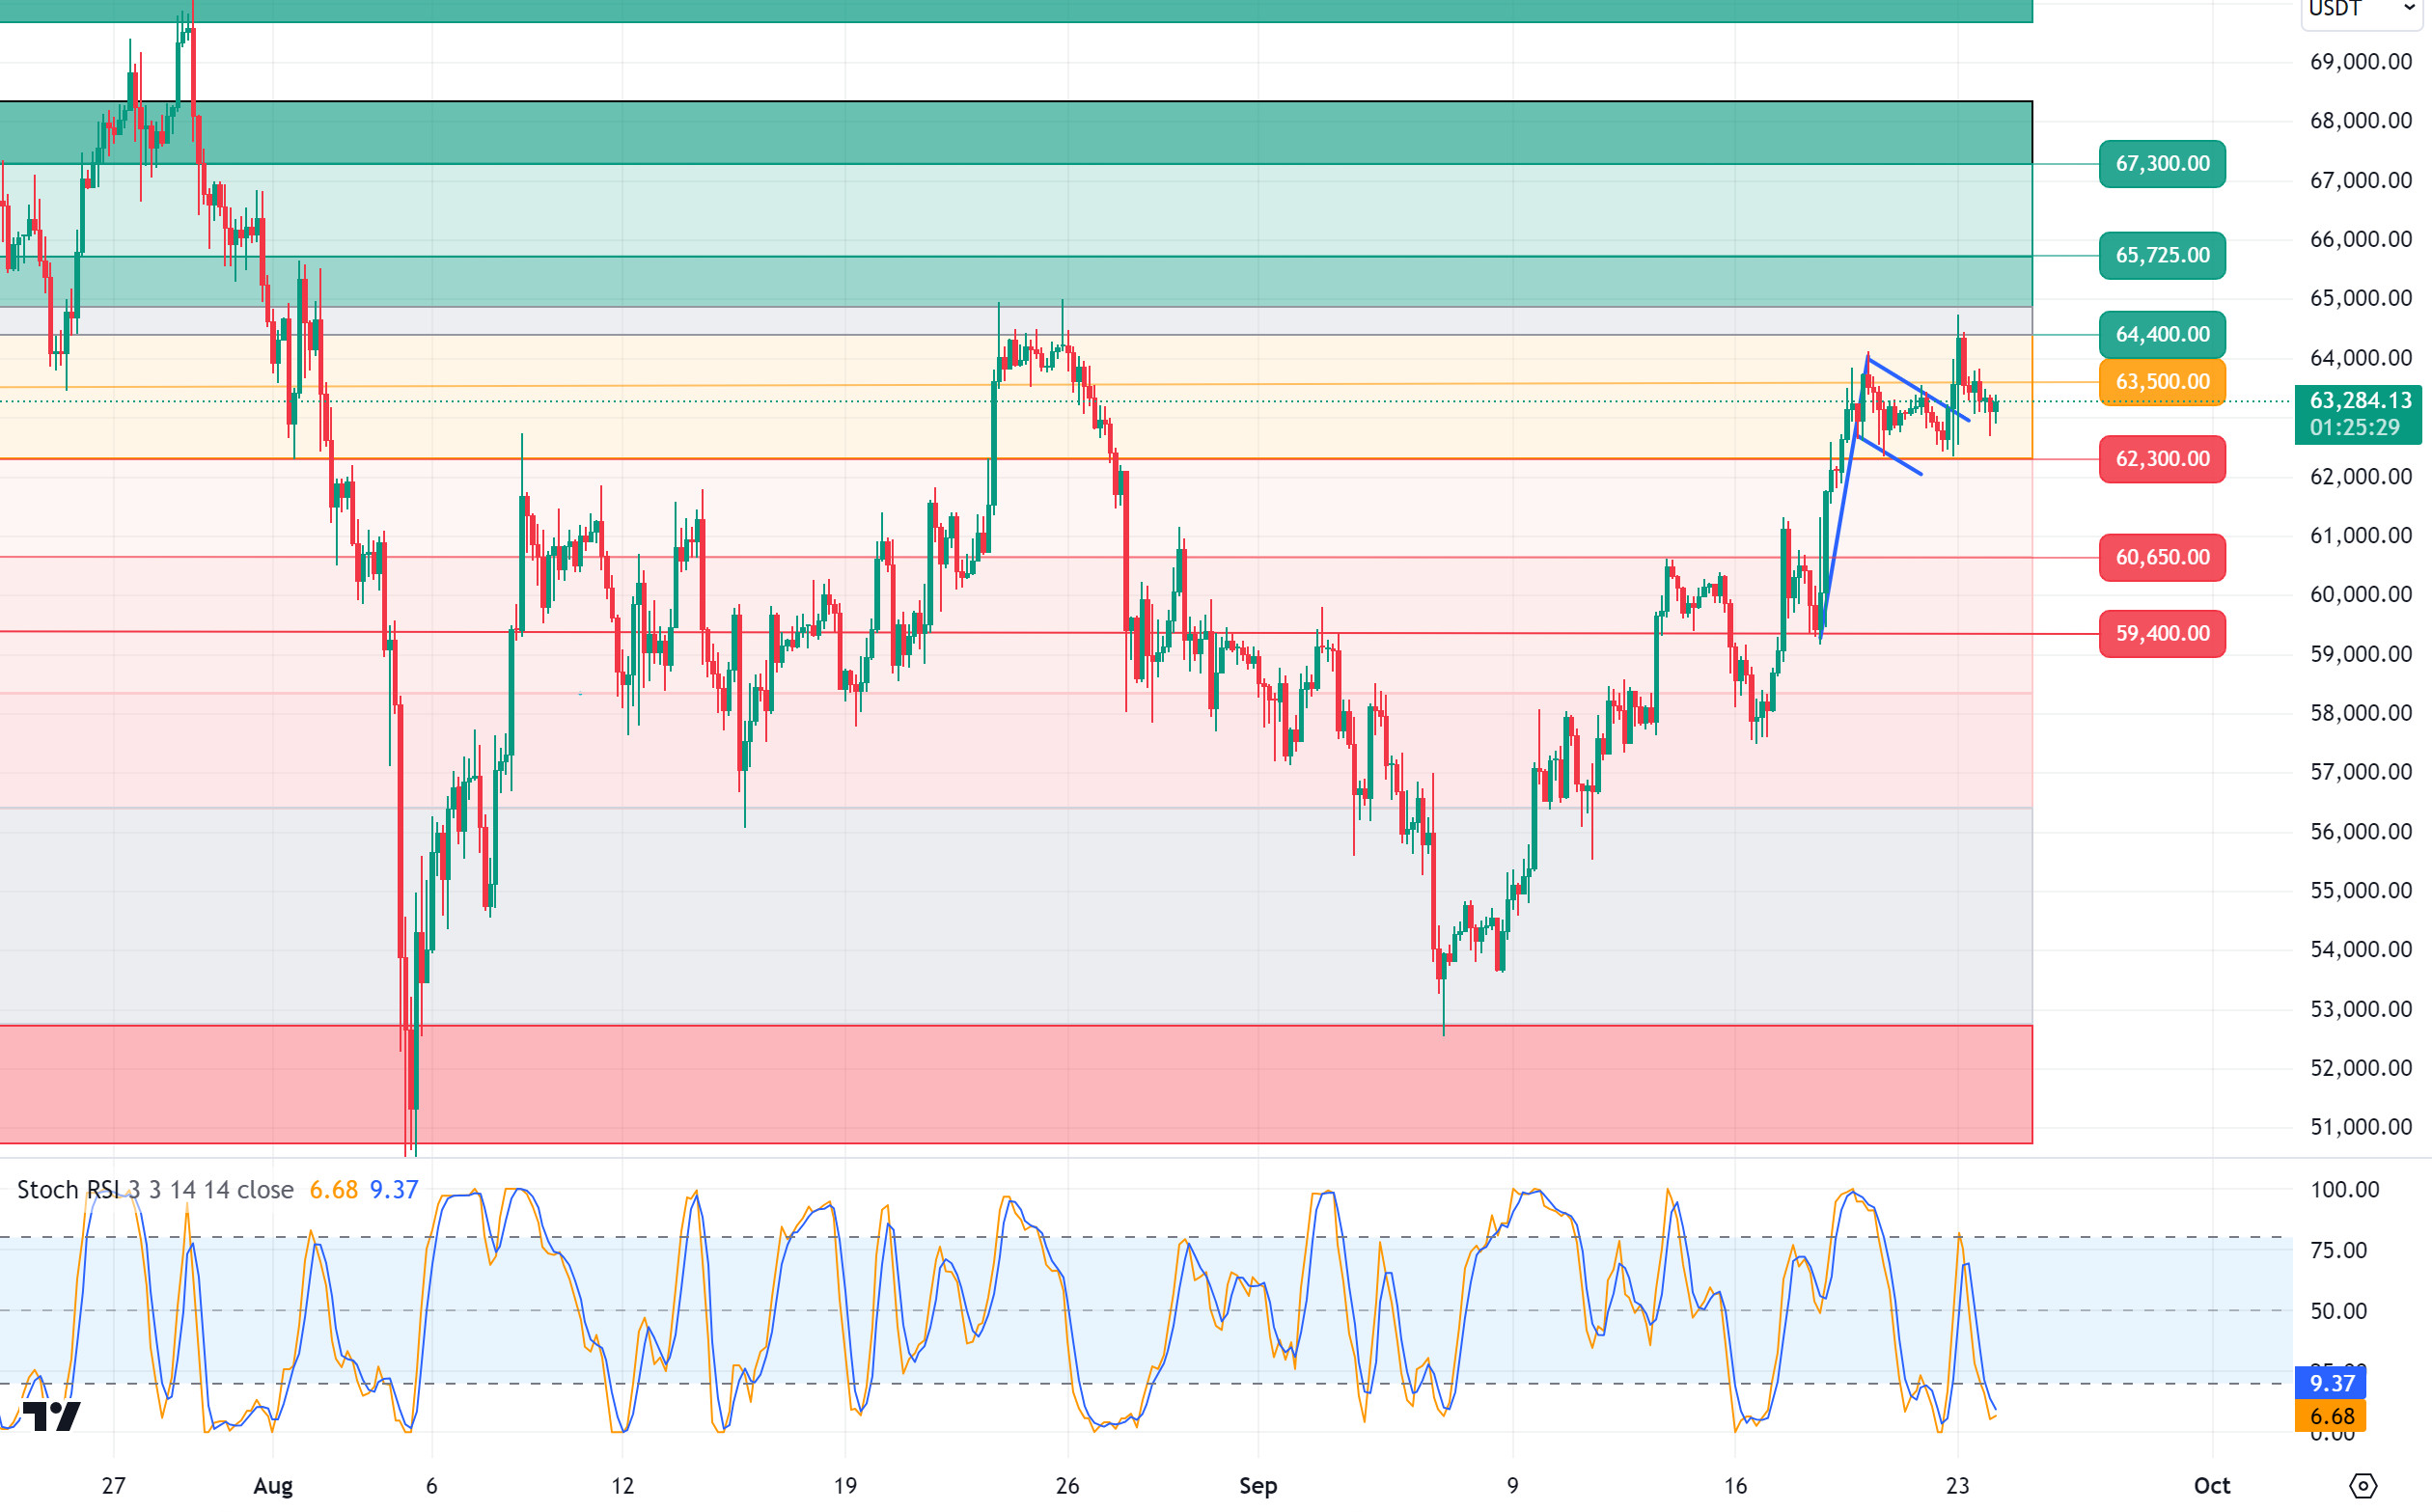
BTC/USDT
Consolidation en Bitcoin! The leading cryptocurrency Bitcoin continues to maintain the gains it has made since the FED rate cut and consolidates at the 63,000 level. The messages of support given por the political conflicts el the US side are one of the factors behind the strong stance en Bitcoin price. In this direction, Bitcoin, which has been correlated with US stocks for a long time, seems to be equally affected por macroeconomic movements such as the FED interest rate cut last week. Therefore, the liquidity that will come to the stock market with interest rate cuts may also have a positive impact el Bitcoin. In the BTC 4-hora technical analysis, the price, which moves within the uptrend, continues to consolidate at 63,000 levels, retreating after testing the 64,000 level once. The search for direction continues for BTC, which is priced en a narrow band between the intermediate support zone of 63,300 and 63,500 points. The 65,725 level can be tested with a new attack attempt towards the 64,000 level of BTC, which is expected to regain momentum to continue its upward movement. In case of a pullback, the support point we will encounter is the 62,300 level.
Supports 62,300 – 60,650 – 59,400
Resistances 64,450 – 65,725 – 67,300
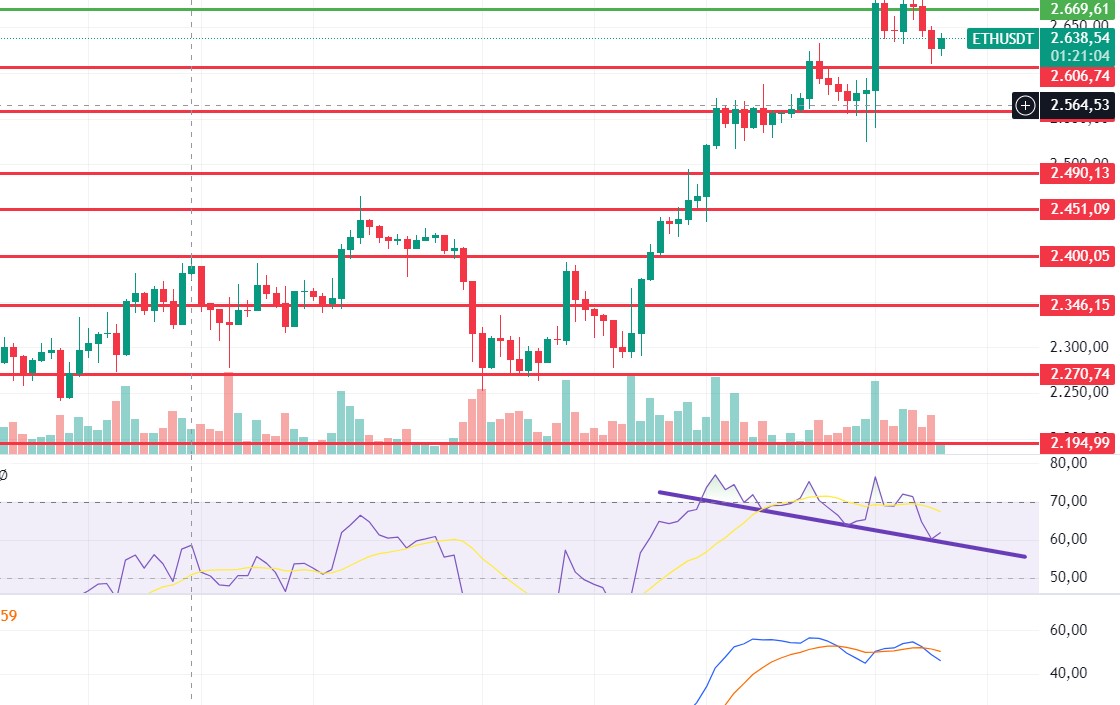
ETH/USDT
As expected, Ethereum, which realized its correction up to 2.606, reacted from this level and priced up again. However, the negative structure en the RSI indicates that declines may come down to 2,606 levels again during the day. In addition, when looking at CVD spot and futures, it can be said that the possibility of a decline is strengthening, considering that the last reaction rise came el the futures side and the funding rates turned sharply positive. The gain of 2.669 level may continue the positive trend and open the door to rises to 2.815 levels.
Supports 2,606 – 2,558 – 2,490
Resistances 2,669 – 2,721 – 2,815
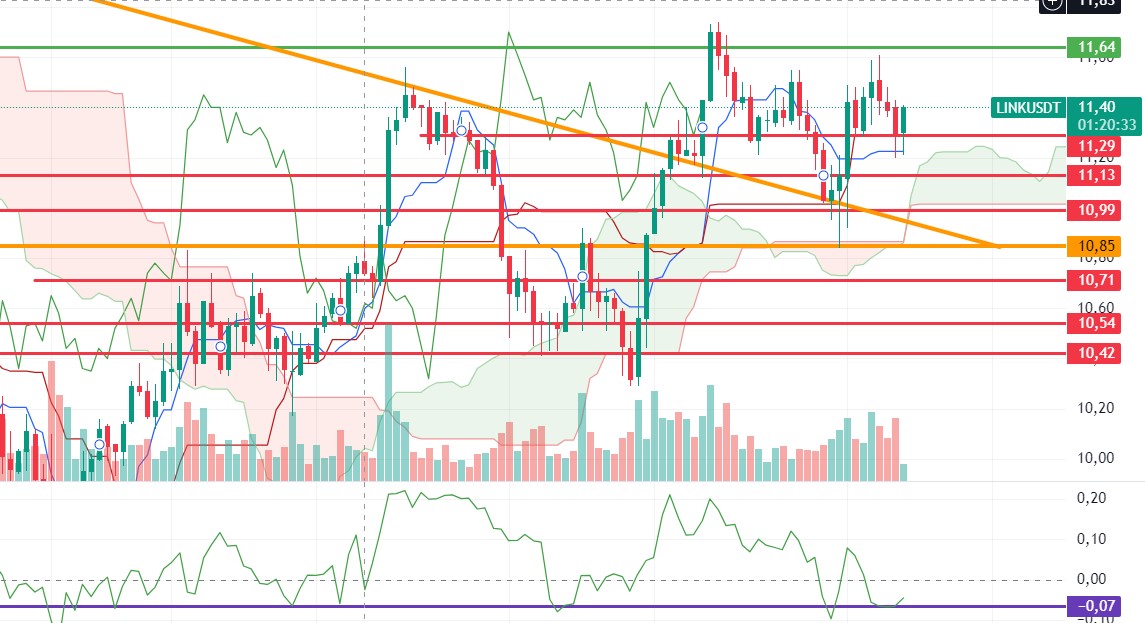
LINK/USDT
For LINK, it seems positive that the last decline did not close below the kijun support 11.29 level. In addition, the positive structure formed en CMF also attracts attention. However, despite all this, LINK, which cannot break the 11.64 main resistance level, draws attention with its descending tops. When the weakness en Ethereum is added to all this, 11.13 levels can be expected to come again with a correction movement. Breaking the 11.64 resistance may continue the positive trend.
Supports 11.29 – 10.85 – 10.54
Resistances 11.64 – 12.19 – 12.42
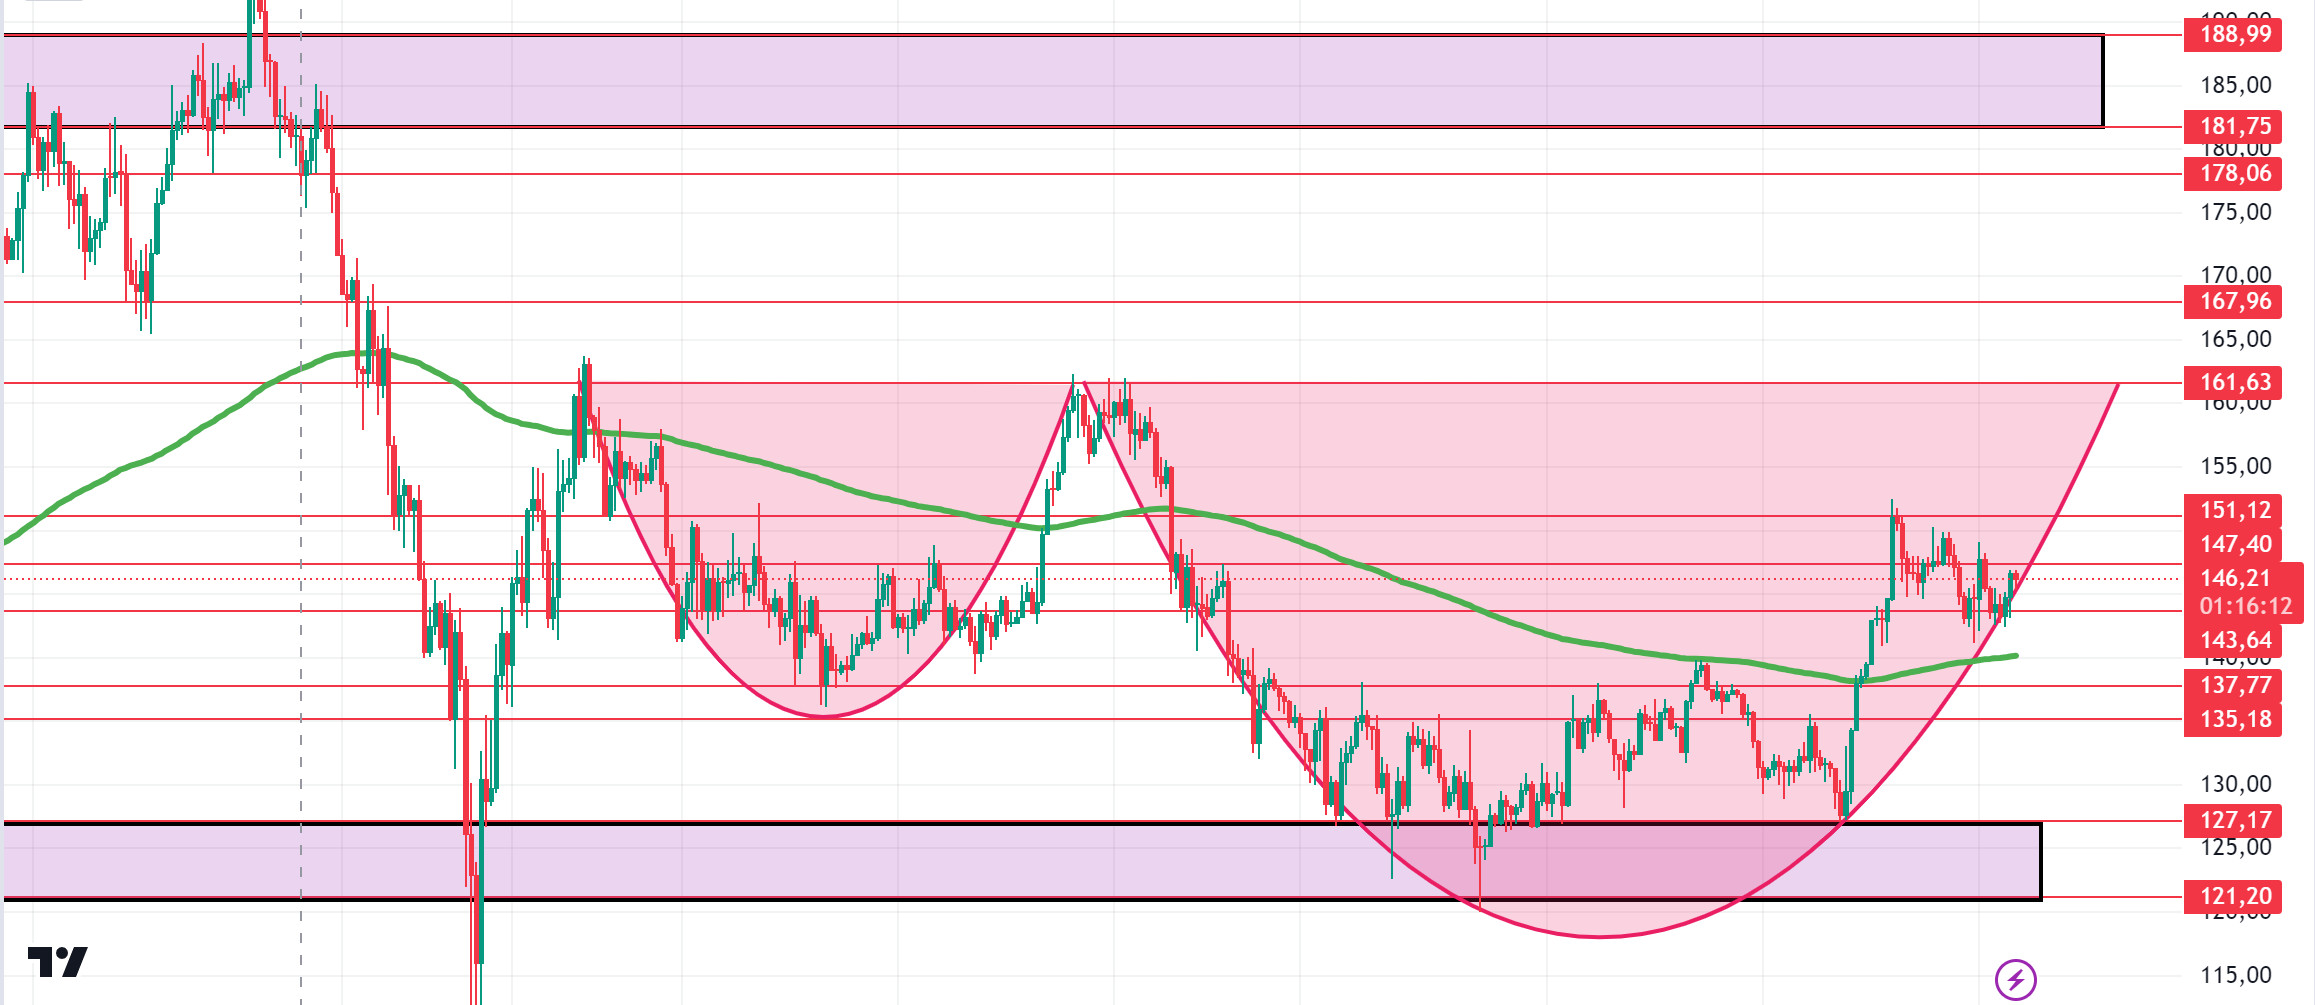
SOL/USDT
Today, US SEC Chairman Gensler’s speech may be important. In the Solana ecosystem, Travala, a crypto-based travel platform, recently announced its integration with Solana, allowing users to book flights and accommodation using Solana’s assets. In addition, Virtune will list the Staked Solana ETP el Euronext Amsterdam to increase crypto access as a company that manages digital assets and offers crypto Exchange Traded Products (ETPs). On the other hand, the outflow of money from the Solana ecosystem yesterday exceeded $90 million. This means that investors are wary of possible price drops. Technically, SOL, which tried to break 150, seems to have lost its momentum. SOL, which has been priced en a horizontal course since our analysis yesterday, continues to move en a cup-and-handle pattern. Both macroeconomic conditions and innovations en the Solana ecosystem, 147.40 – 151.12 levels appear as resistance levels. If it rises above these levels, the rise may continue. It can support the 200 EMA average en the pullbacks that will occur if investors make profit sales. 143.64 – 137.77 levels can be followed as support. If it comes to these support levels, a potential rise should be followed.
Supports 143.64 – 137.77 – 135.18
Resistances 147.40 – 151.12 – 161.63
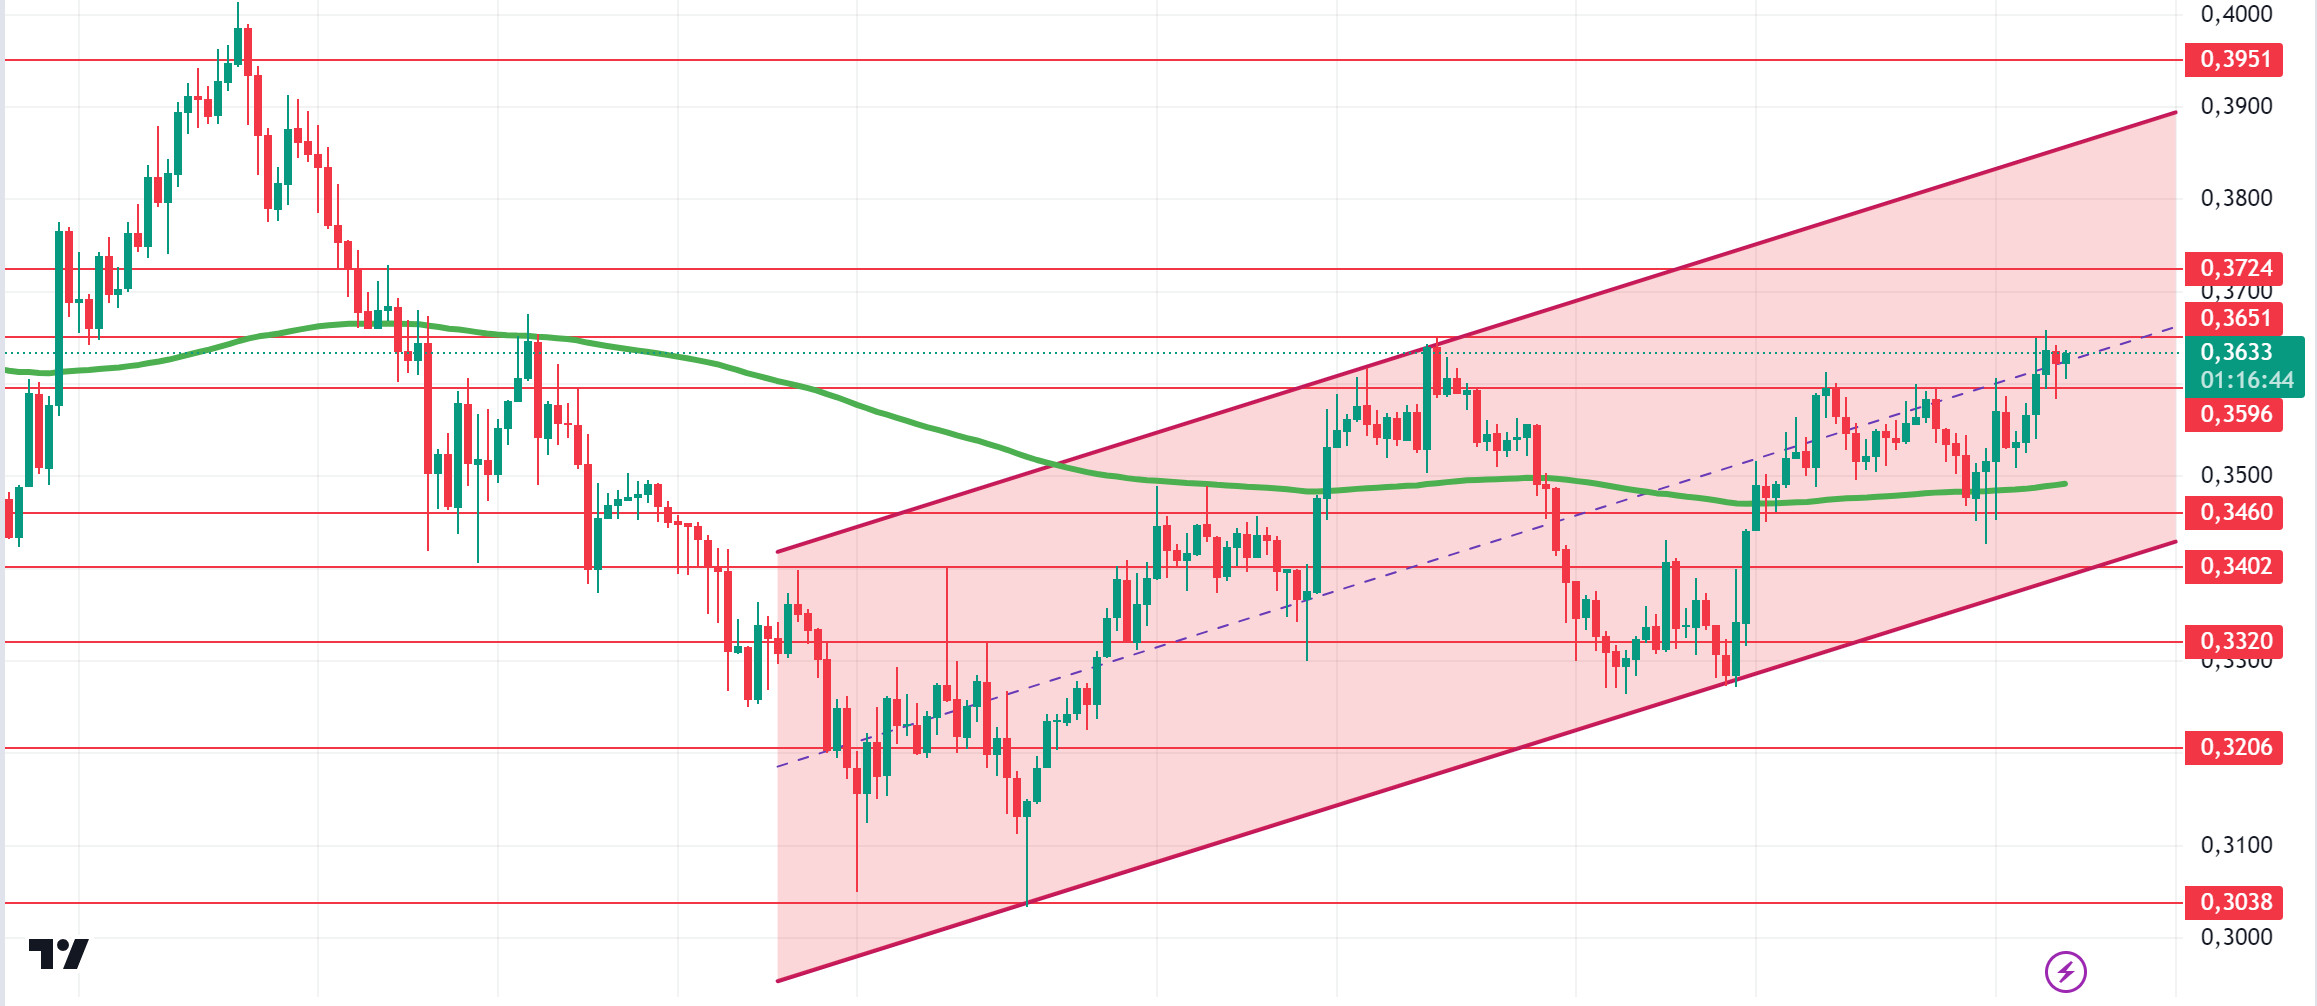
ADA/USDT
Today’s speech por US SEC Chairman Gensler could be important. In the ADA ecosystem, the latest development is a smart contract built el Plutus V3 that allows Bitcoin wallets to control it directly. This could potentially allow BTC users to send and stake ADA coins to any Cardano pool without creating new wallets el the Cardano chain. Technically, ADA’s funding rate of 0.0099% is due to the fact that buyers are willing to pay this amount and carry long positions and predict that the price will rise. ADA price, which has been moving en an upward channel since September 2, may break the resistance of the rising channel if it closes its 4-hora candle above the $ 0.3724 level. In retracements due to possible profit sales, it may gain momentum from the 200 EMA average. In this scenario, 0.3596 – 0.3460 levels appear as support. In the rises that will take place with the continuation of the positive atmosphere en the ecosystem, 0.3651 – 0.3724 levels can be followed as resistance points.
Supports 0.3596 – 0.3460 – 0.3402
Resistances 0.3651 – 0.3724 – 0.3951
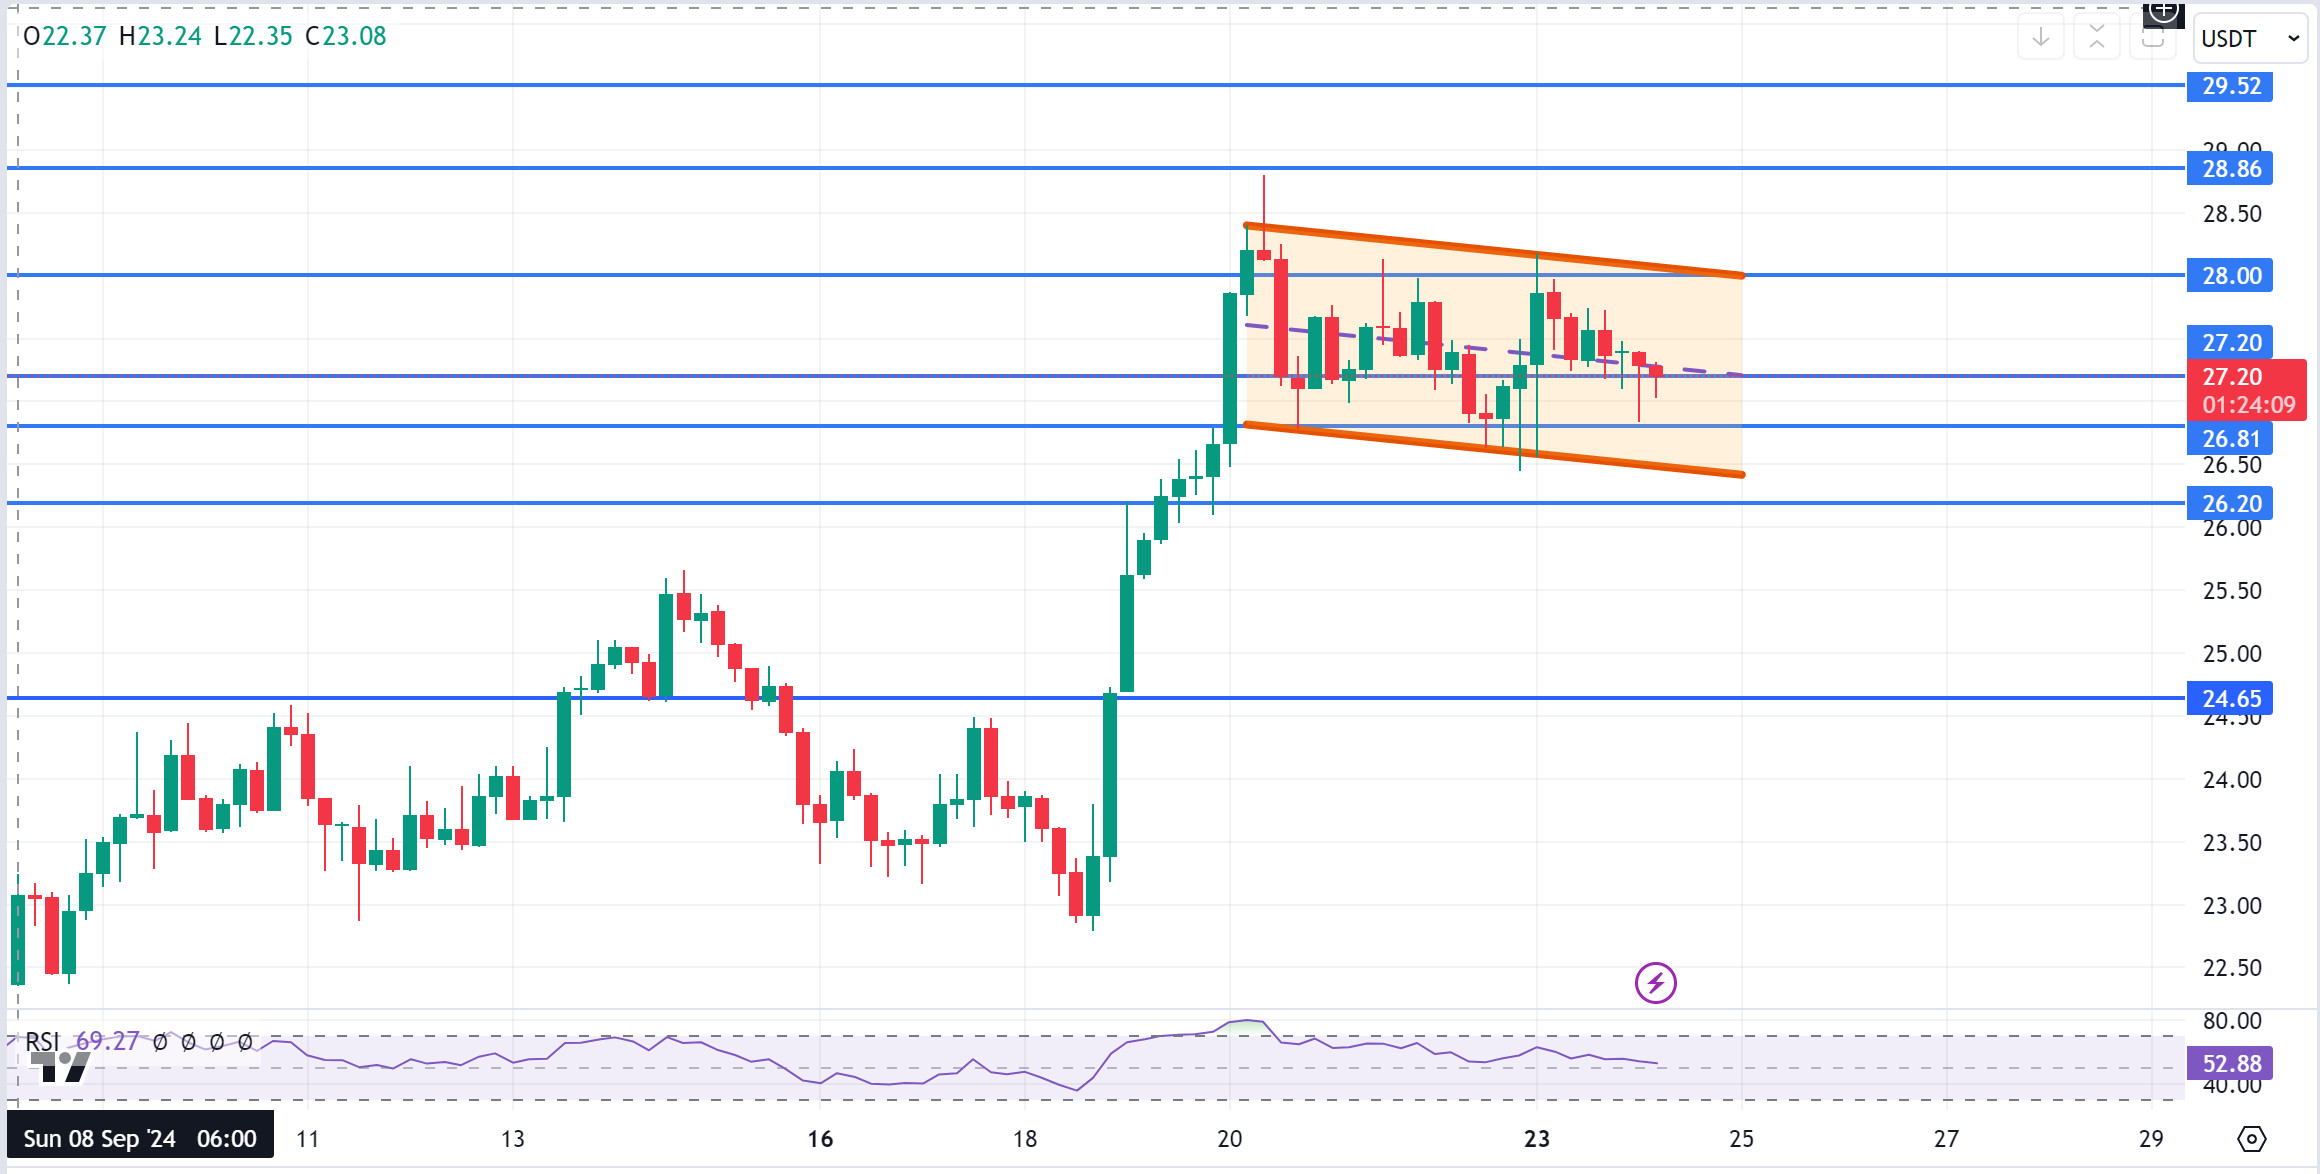
AVAX/USDT
AVAX, which opened yesterday at 27.30, rose slightly during the day and closed the day at 27.39. Conference board consumer confidence data will be released por the US today. It is important for a market with recession sensitivity.
For AVAX, which is currently trading at 27.20, we see that a rising flag pattern has formed el the 4-hora chart. It continues to consolidate en the falling channel near the horizontal and can be expected to break the channel upwards after moving en the channel for a while. In such a case, it may test 28.86 and 29.52 resistances. If the data from the US is perceived as a sign of recession and creates selling pressure, it may break the channel downwards. In this case, it may test 26.81 support. As long as it stays above 24.65 support during the day, it can be expected to continue its upward trend. With the break of 24.65 support, selling pressure may increase.
Supports 27.20 – 26.81 – 26.20
Resistances 28.00 – 28.86 – 29.52
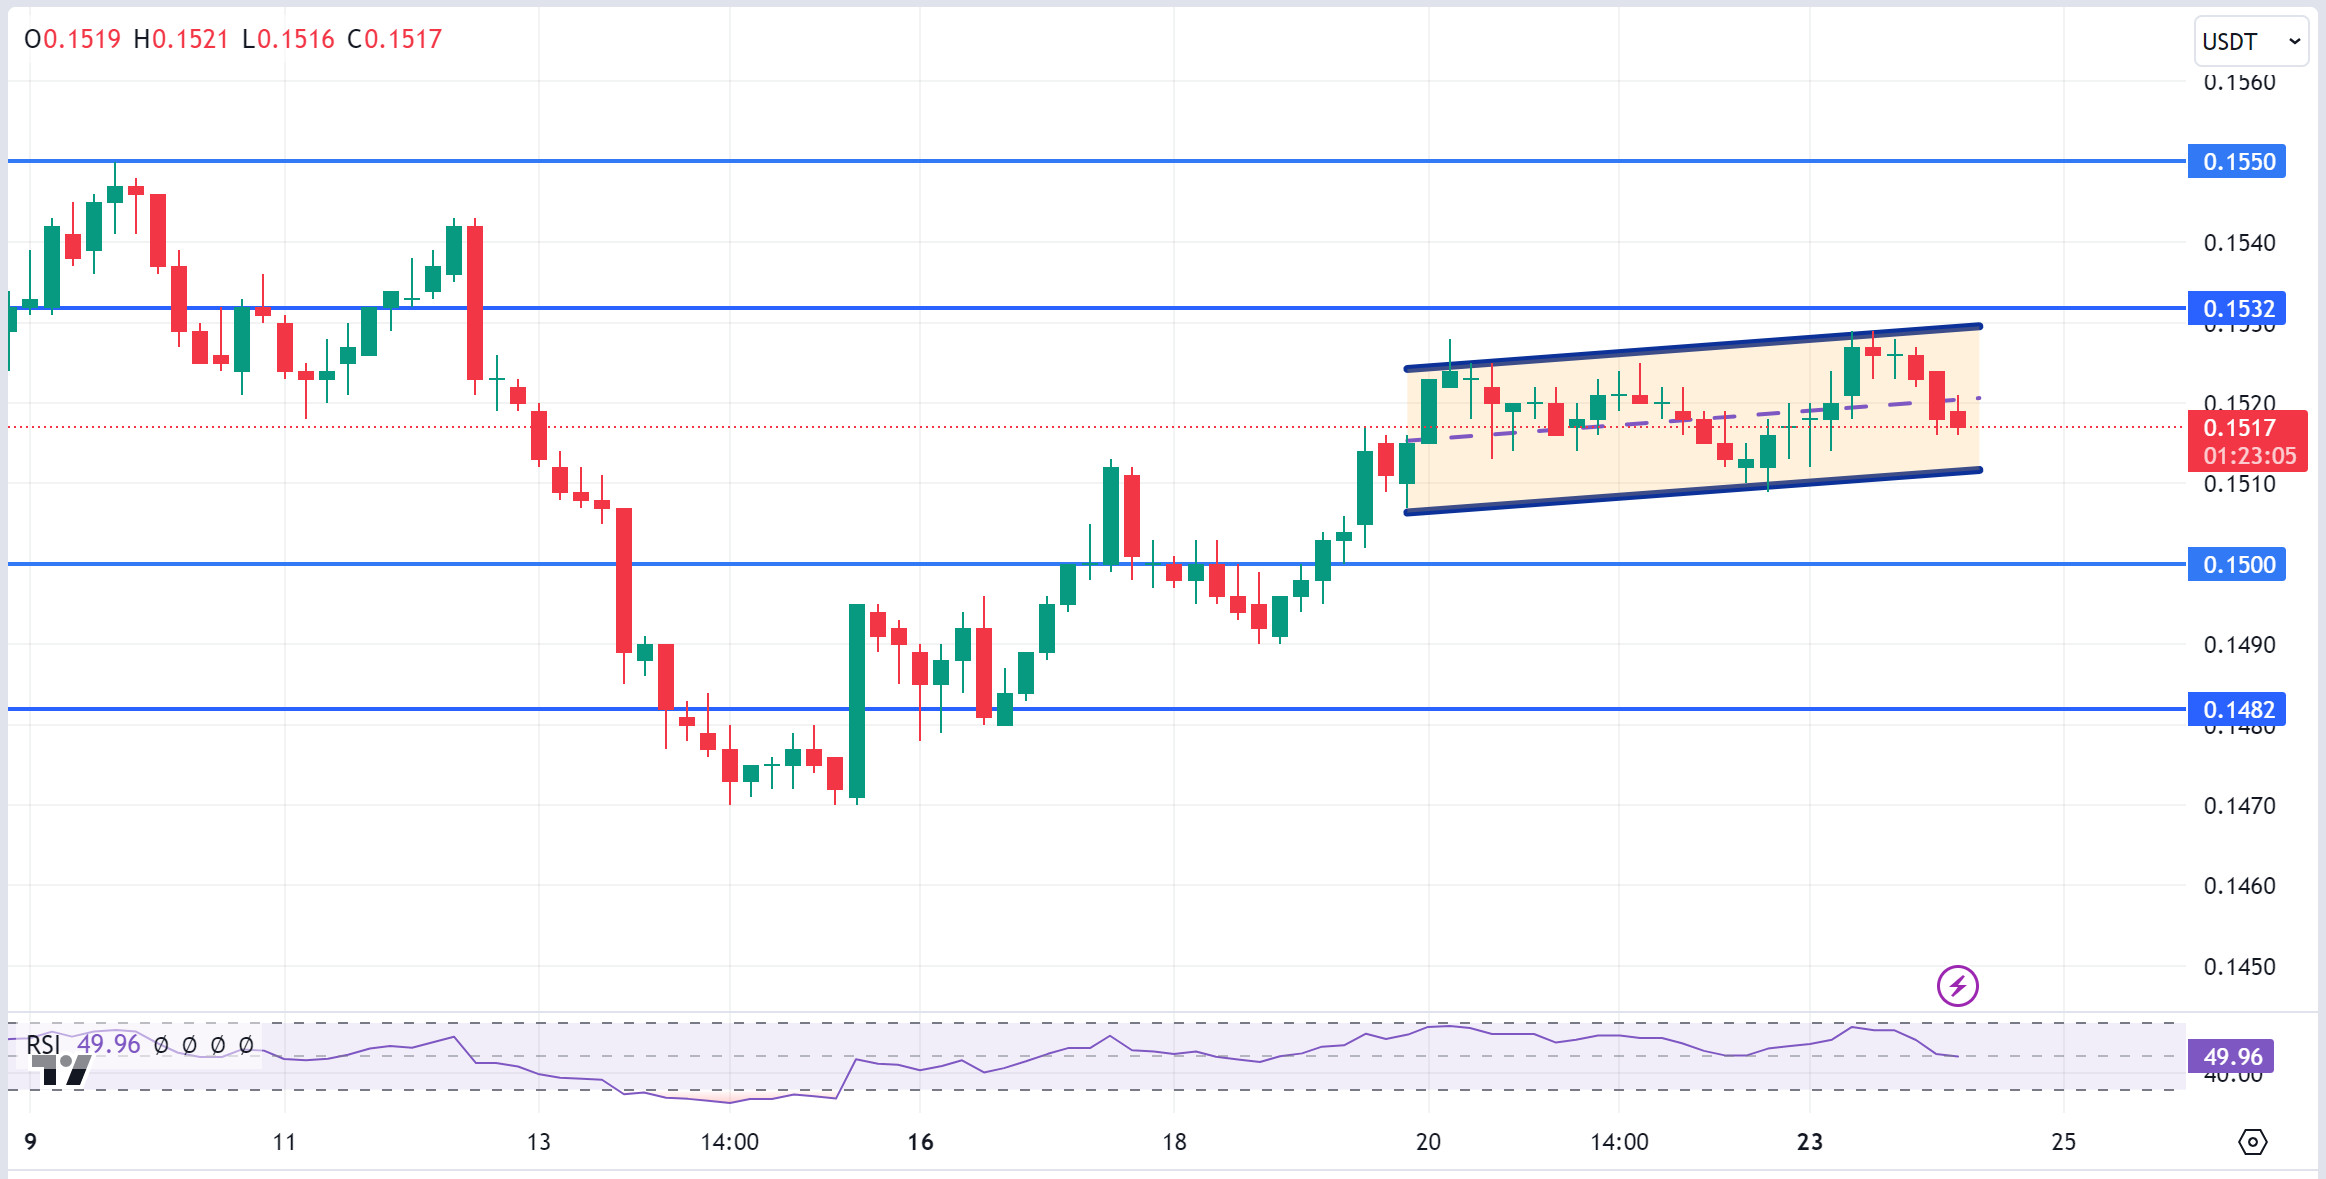
TRX/USDT
TRX, which started yesterday at 0.1518, closed the day at 0.1523. US conference board consumer confidence data to be released today may create volatility en the market. TRX, which continues its horizontal and volume-free movement and is currently trading at 0.1517, is en an ascending channel el the 4-hora chart. The RSI is en the middle band of the rising channel with a value of 50 and some upside can be expected from here. In such a case, it may move to the upper band of the channel and test the 0.1532 support. However, it may move to the lower band with the sales reaction that may come from the middle band of the channel. In such a case, it may test 0.1500 support. As long as TRX stays above 0.1482 support, the desire to rise may continue. If this support is broken downwards, sales can be expected to increase.
Supports 0.1500 – 0.1482 – 0.1429
Resistances 0.1532 – 0.1575 – 0.1603
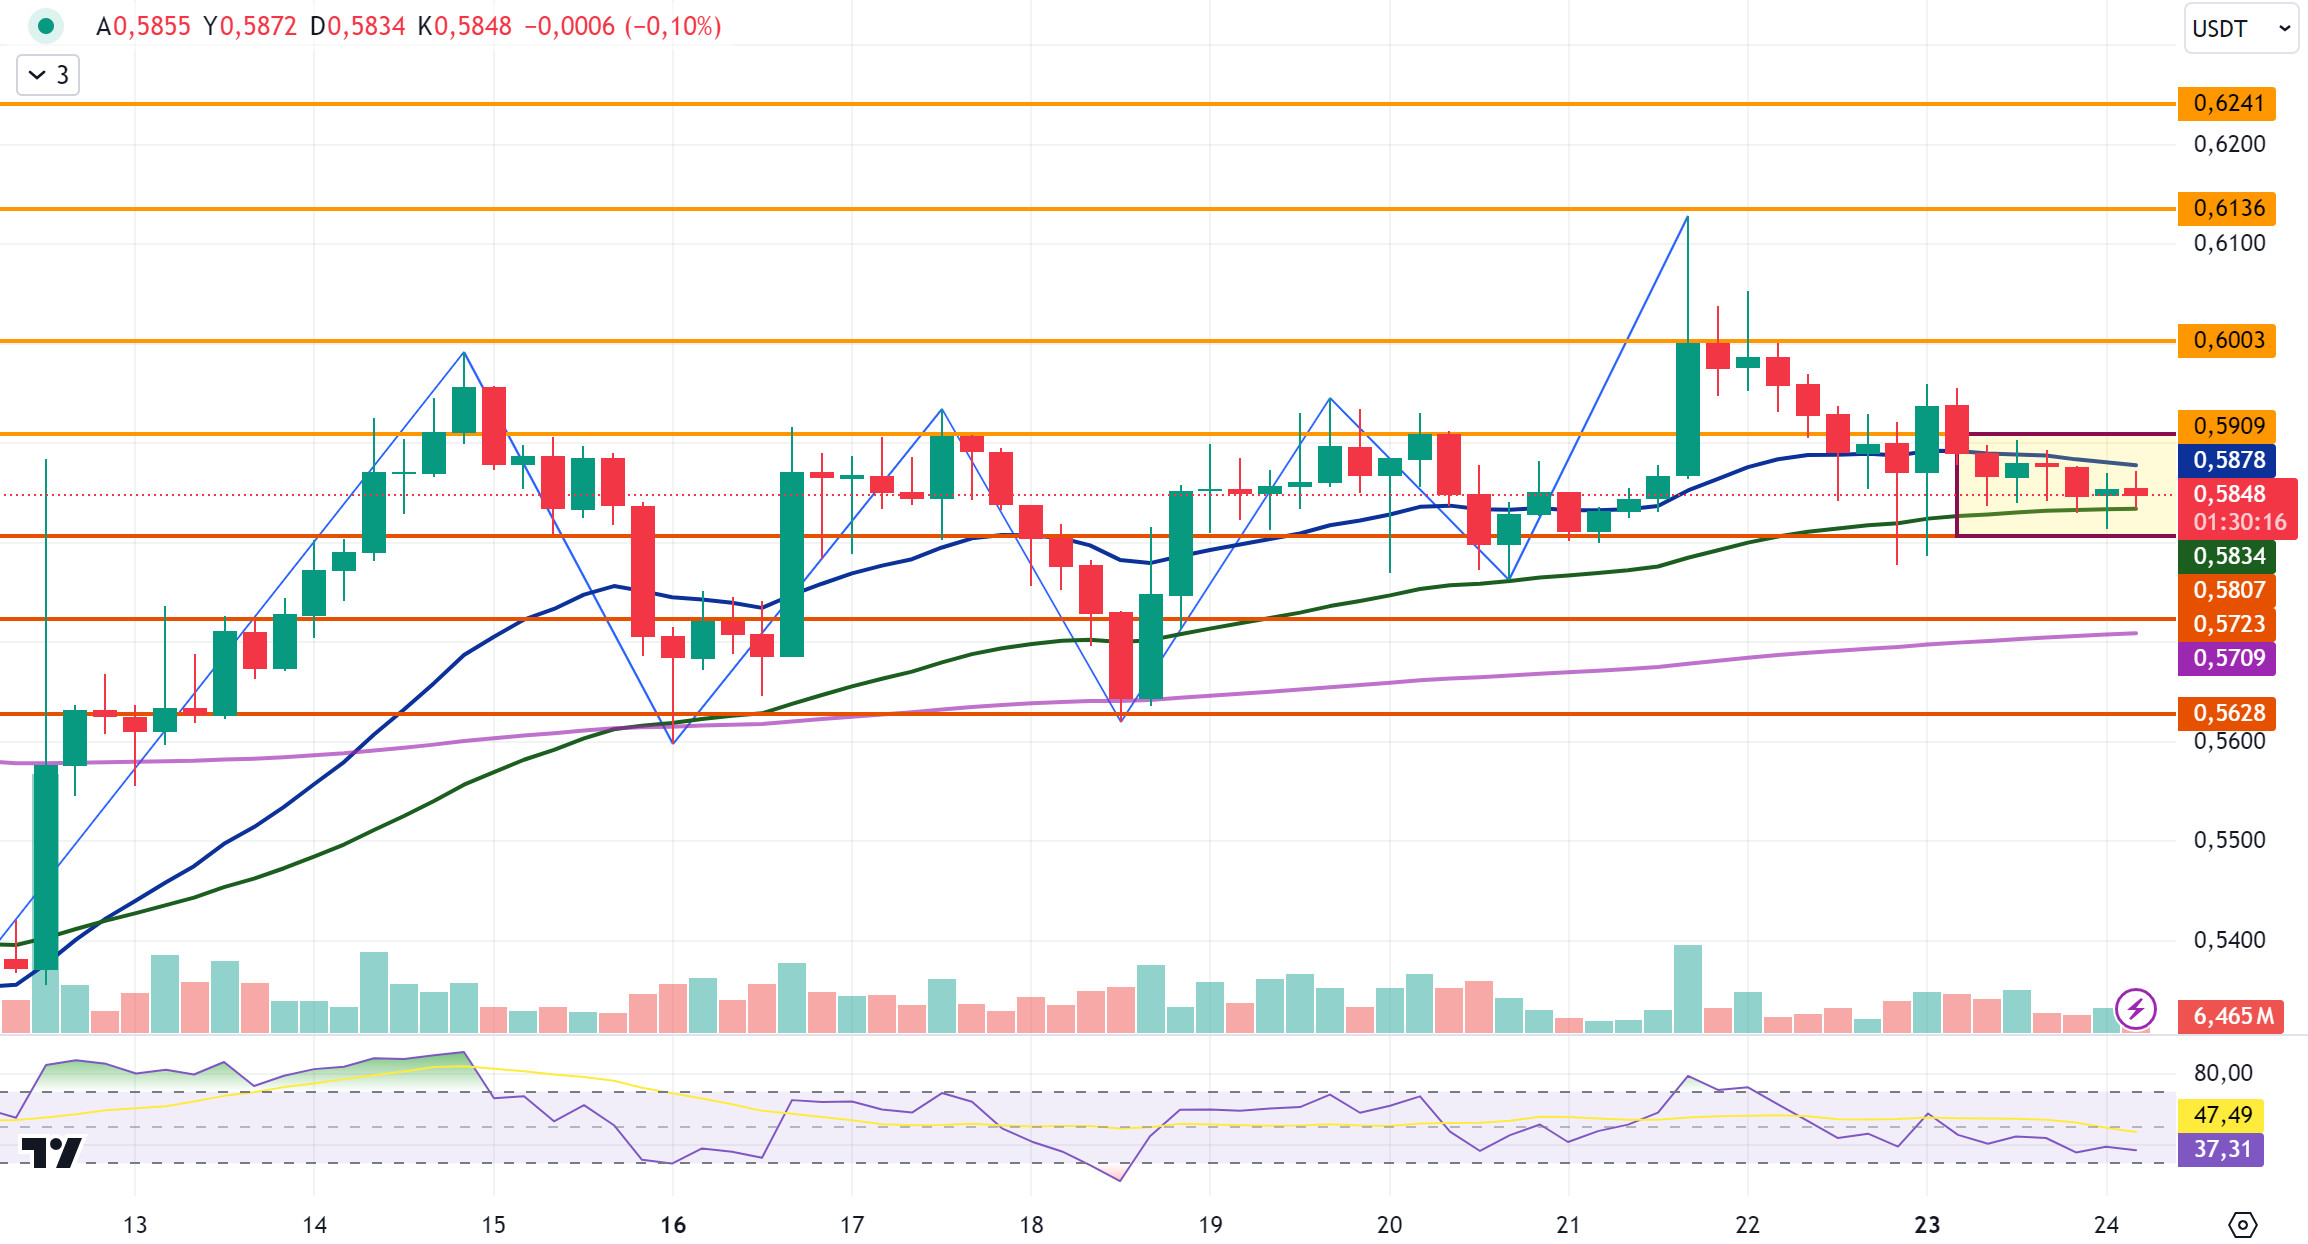
XRP/USDT
XRP closed yesterday at the daily closing level of 0.5845. XRP, which continues to move within the horizontal band, is currently trading at 0.5848. When the 4-hora analysis is analyzed, we can see that it is stuck between EMA20 and EMA50 and moves en this range. RSI data is close to the oversold zone and with the purchases that may come, XRP may rise and test the resistance levels of 0.5909-0.6003-0.6136 if it continues its rise por breaking the EMA20 level. In case of a decline, if the EMA50 level is broken, it may test the support levels of 0.5807-0.5723-0.5628 en the continuation of the decline.
XRP may rise with possible purchases at the 0.5723 support level el the decline and may offer a long trading opportunity. On the rise, it may fall with possible sales at 0.6003 and may offer a short trading opportunity.
EMA20 (Blue Line) – EMA50 (Green Line) – EMA200 (Purple Line)
Supports 0. 5807 – 0.5 723 – 0.5628
Resistances 0.5909 – 0.6 003 – 0.6136
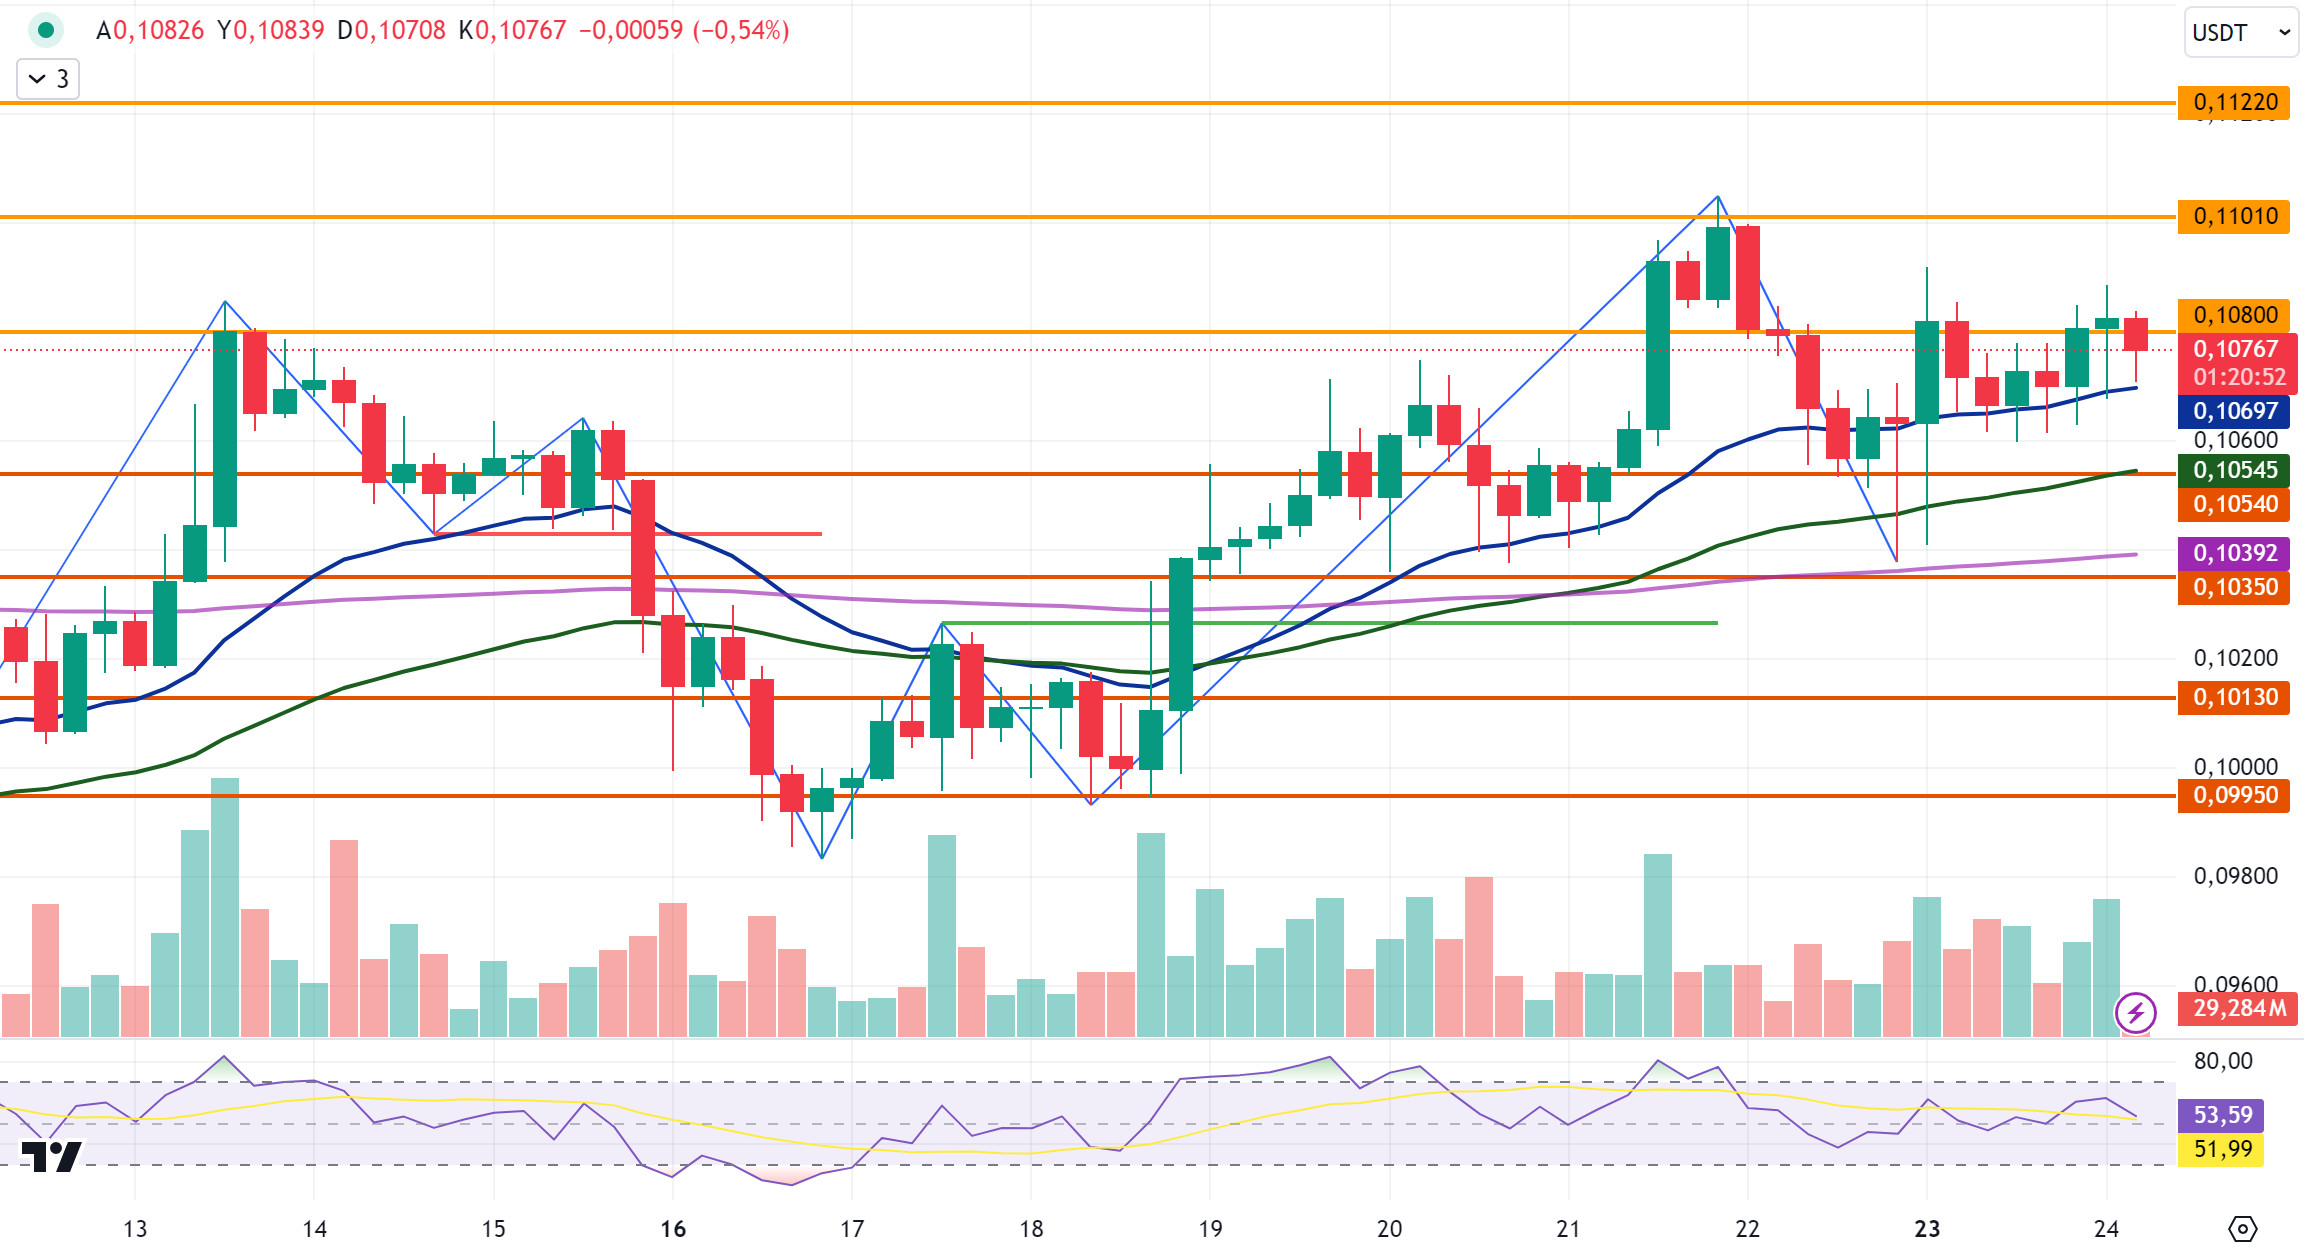
DOGE/USDT
In the 4-hora analysis, DOGE closed at 0.1080 with a rise en the last candle yesterday. DOGE, which started with a rise en the opening candle today, rose to 0.1088, then declined with the sales that came after it rose to 0.1088, and with the decline it experienced en the last candle today, it is currently trading at 0.1076. In the 4-hora analysis, when DOGE declines, it continues to trade within a horizontal band after rising with purchases at the EMA20 level. If it starts to rise, it may test the resistance levels of 0.1080-0.1101-0.1122. If it retests and breaks the EMA20 level that it tested with its decline en the last candle, it may test the support levels of 0.1054-0.1035-0.1013 en the continuation of the decline.
DOGE may rise with possible purchases at EMA50 and EMA200 levels en its decline and may offer a long trading opportunity. In its rise, the 0.11 resistance zone comes to the fore and it may decline with the sales that may come at this level and may offer a short trading opportunity.
EMA20 (Blue Line) – EMA50 (Green Line) – EMA200 (Purple Line)
Supports 0.1054 – 0.1035 – 0.1013
Resistances 0.1 080 – 0.1101 – 0.1122
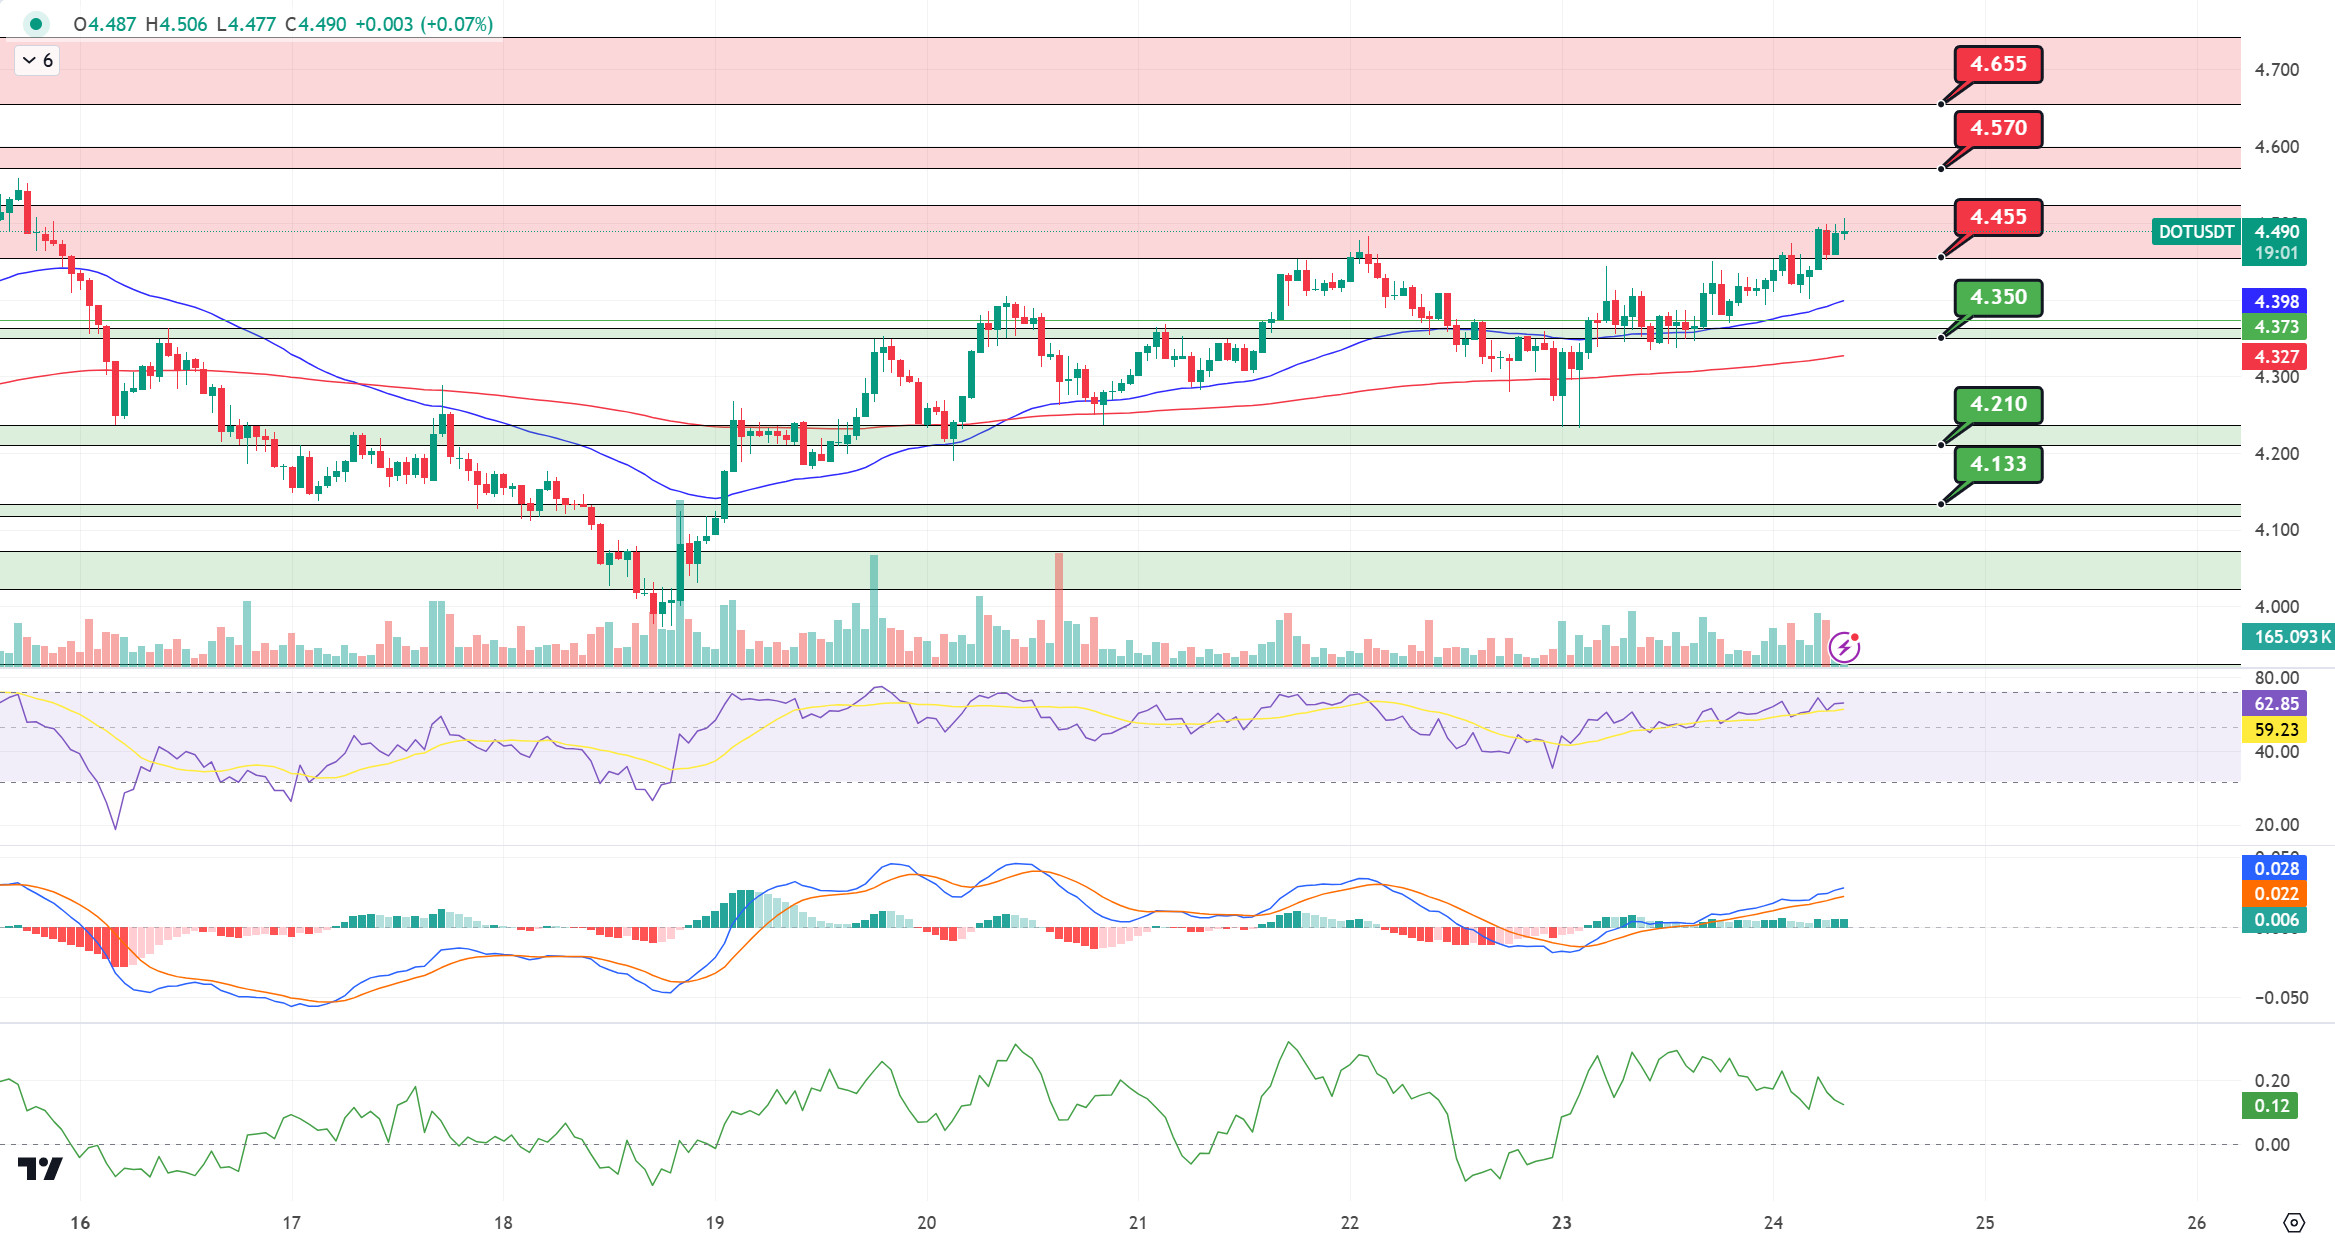
DOT/USDT
When we examine the Polkadot (DOT) chart, as we mentioned en our previous analysis, the price rose to the 4,455 band, which is our resistance level, after maintaining above the 4,350 level. If the price maintains above the 4.455 band, its next target could be the 4.570 resistance. On the other hand, if the price wants to make a correction of this rise, a retracement up to the EMA50 level may occur.
(Blue line: EMA50, Red line: EMA200)
Supports 4,350 – 4,210 – 4,133
Resistances 4.455 – 4.570 – 4.655
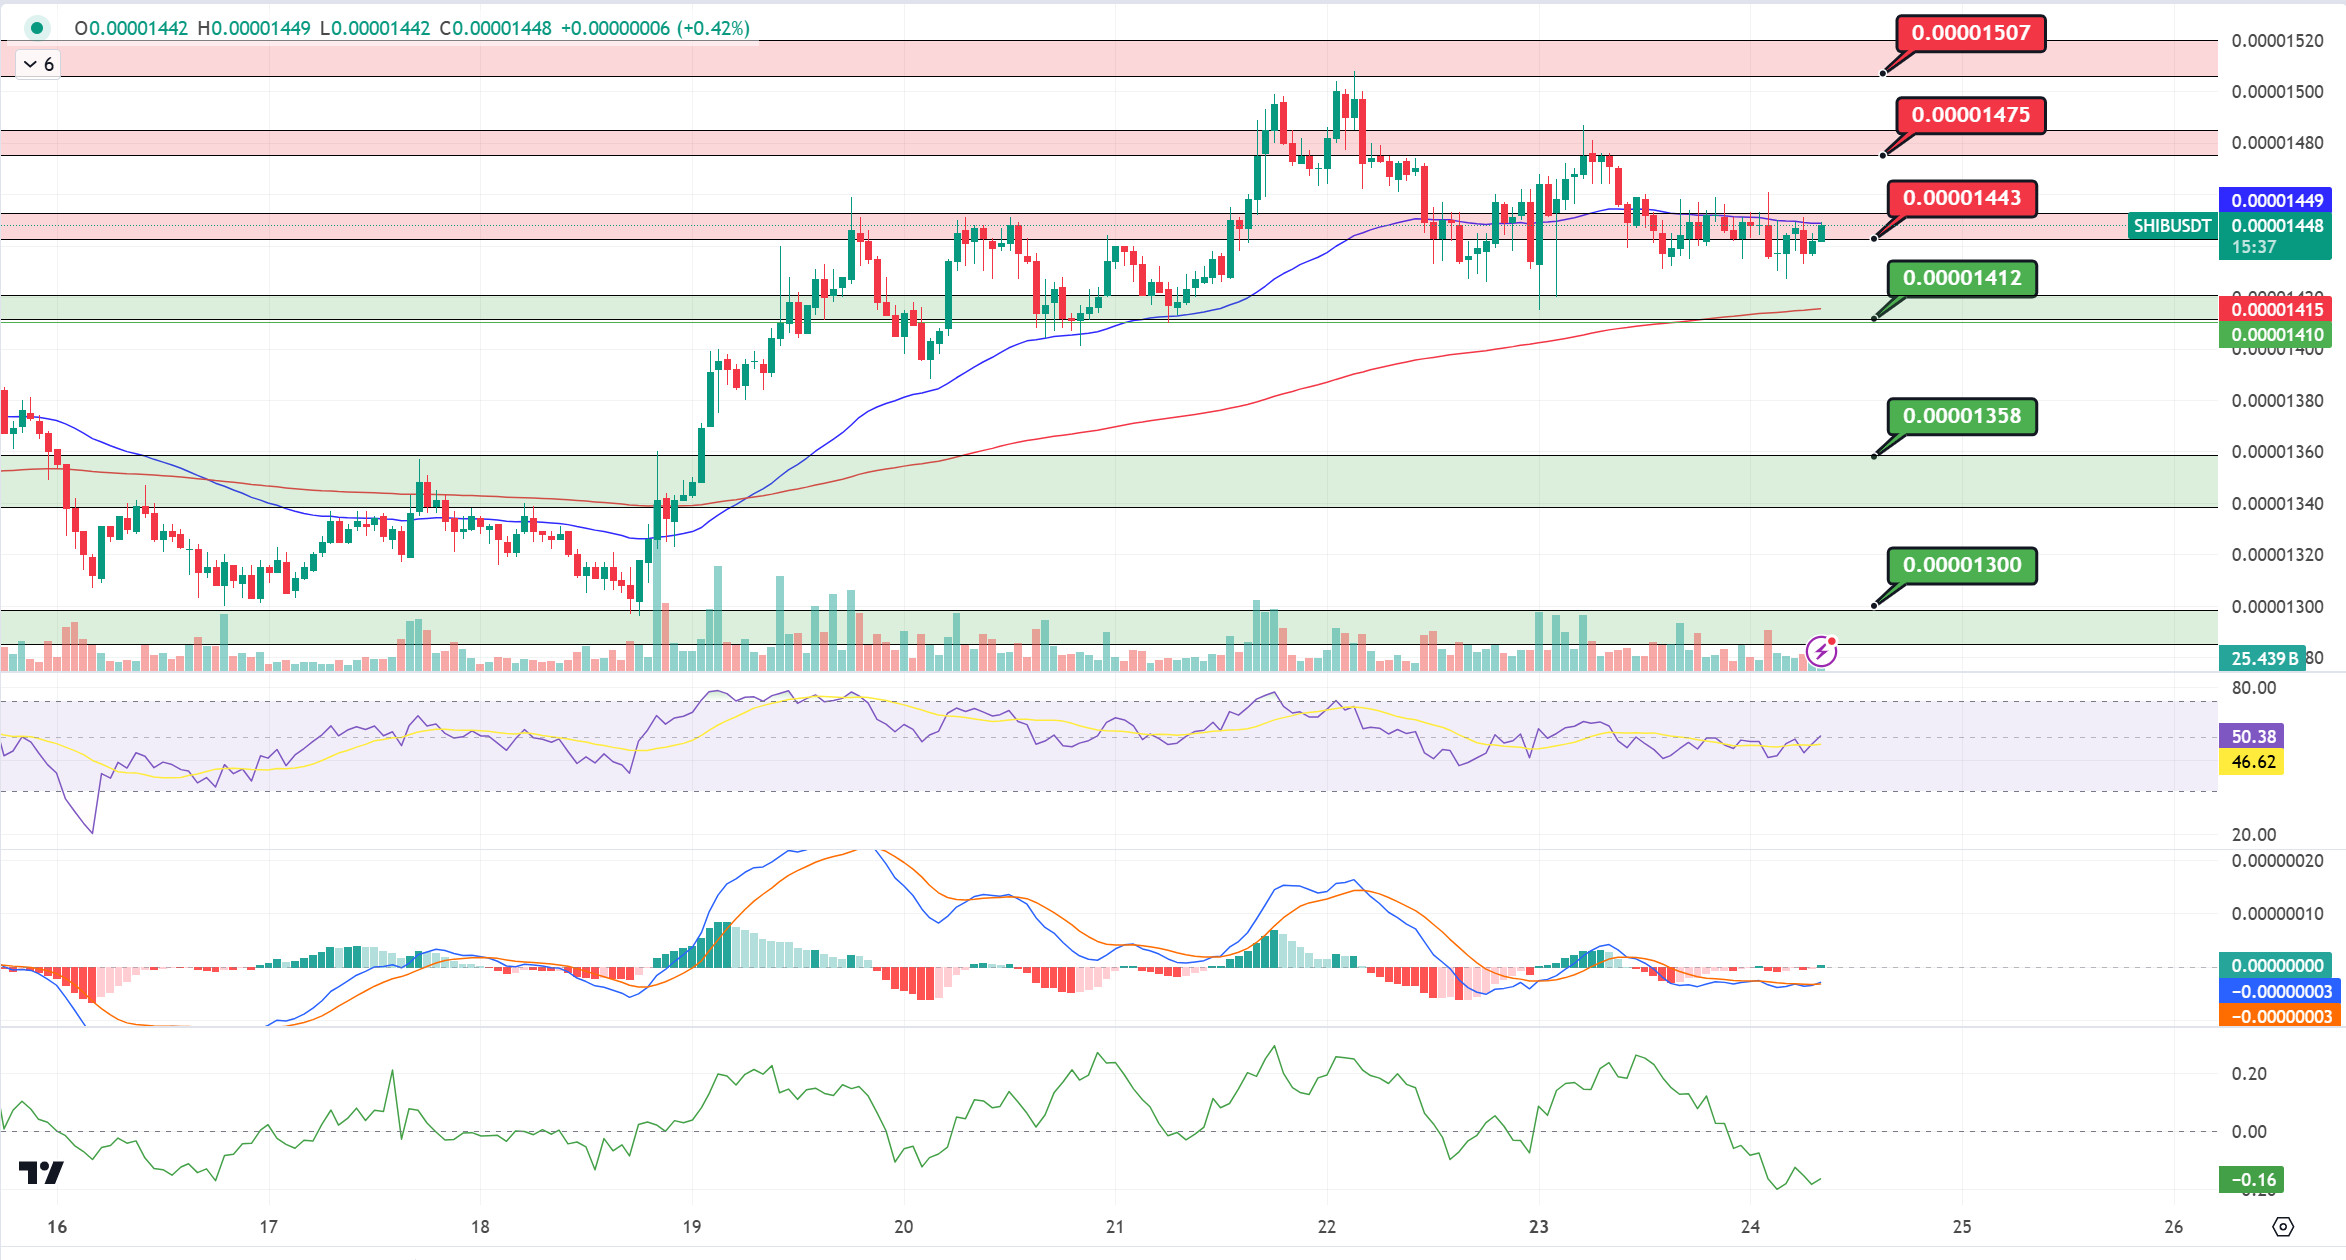
SHIB/USDT
When we examine the chart of Shiba Inu (SHIB), we see that the price is moving sideways. The EMA50 level worked as a resistance and the price seems to have moved sideways at 0.00001443. When we examine the MACD oscillator, we can say that the buyer pressure is increasing. If the price maintains above the 0.00001443 level, its next target may be 0.00001475 levels. On the other hand, if the price fails to sustain above the 0.00001443 level, we can expect a retracement towards the 0.00001412 support band, which is our first support level.
(Blue line: EMA50, Red line: EMA200)
Supports 0.00001412 – 0.00001358 – 0.00001300
Resistances 0.00001443 – 0.00001475 – 0.00001507
LEGAL NOTICE
The investment information, comments and recommendations contained herein do not constitute investment advice. Investment advisory services are provided individually por authorized institutions taking into account the risk and return preferences of individuals. The comments and recommendations contained herein are of a general nature. These recommendations may not be suitable for your financial situation and risk and return preferences. Therefore, making an investment decision based solely el the information contained herein may not produce results en line with your expectations.
