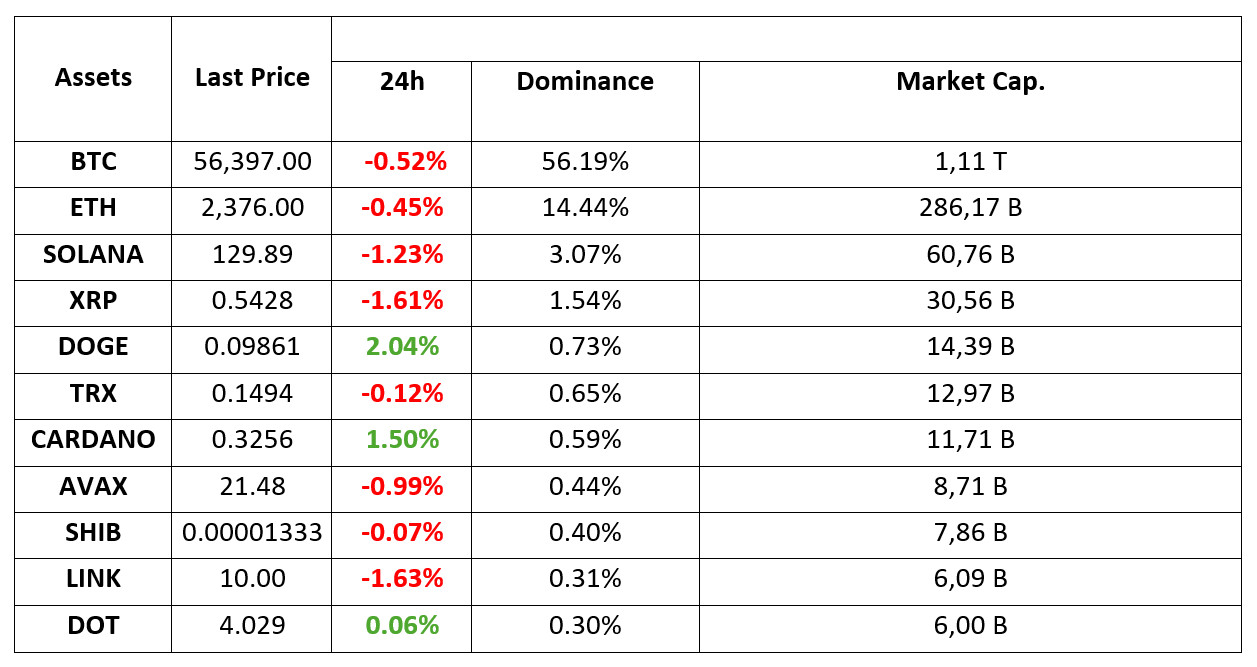
MARKET SUMMARY
*Prepared on 6.09.2024 at 07
WHAT’S LEFT BEHIND
Donald Trump Promised to Make America the World Center of Cryptocurrency and Bitcoin
In his recent speech at the Economic Club of New York, Donald Trump outlined his vision for America’s future as the “world capital of crypto and Bitcoin”. This statement highlights Trump’s changing stance on digital assets and reflects the growing acceptance of cryptocurrencies in traditional financial circles. His Elon Musk-inspired government efficiency commission aims to address financial waste in federal spending, which could pave the way for a stronger cryptocurrency market.
Russian President Putin Talks About Bitcoin (BTC) Mining!
Russian President Vladimir Putin spoke about cryptocurrency mining at the plenary session of the Eastern Economic Forum in Vladivostok today. In his latest statement, Putin said that Russia is one of the world leaders in cryptocurrency mining. According to President Putin, the excessive use of energy resources for cryptocurrency production in Siberia should not hinder the development of other industries in the region.
Coinbase Notes That Kamala Harris Does Not Accept Direct Crypto Donations
Coinbase Chief Financial Officer Alesia Haas said at a Citigroup event yesterday that Harris is “accepting donations,” but noted, “She is accepting crypto donations for her campaign through Coinbase Commerce.”
HIGHLIGHTS OF THE DAY
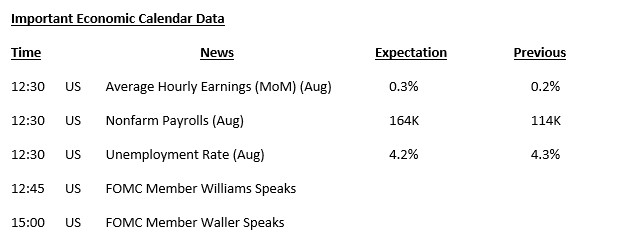
INFORMATION
*The calendar is based on UTC (Coordinated Universal Time) time zone. The economic calendar content on the relevant page is obtained from reliable news and data providers. The news in the economic calendar content, the date and time of the announcement of the news, possible changes in the previous, expectations and announced figures are made by the data provider institutions. Darkex cannot be held responsible for possible changes that may arise from similar situations.
MARKET COMPASS
Risk Appetite Still Fragile
Expectations regarding the health of the US economy and the Federal Reserve’s (FED) monetary policy changes continue to be influential in global markets. Concern that things may not be going well in the US economy has been the main dynamic driving prices recently. As we have emphasized in our previous analyses, this has led to a fragile risk appetite and reduced demand for relatively riskier assets.
Following the “flat-negative” closing of the US indices yesterday, there is a similar, directionless, outlook in the Asian stock markets this morning. However, in general, the mood is not positive again. The lower-than-expected increase in household spending seems to have been the basis for the retreat in the Japanese Nikkei index.
Critical Data to be Announced Today
Yesterday, data showing the change in employment in the US private sector fell short of expectations. Immediately after this ADP Non-Farm Employment Change data, we first saw losses in digital assets. After a while, rises came to the fore. However, these rises could not be permanent. In fact, we have been seeing similar reactions after the US data for a while. This shows that market participants remain undecided between “pricing the health of the US economy” and “pricing the FED’s interest rate cuts”. However, this tug-of-war is usually observed within a few hours of the data release. Afterwards, the pricing behavior that economic health is not good (if the relevant data is below expectations) comes to the fore.
In this context, we believe that the US employment data to be released today should be carefully analyzed. The equation of “good data-good market, bad data-bad market” is usually observed when the markets prefer to price the economic outlook rather than the positive sentiment brought by the easing of monetary conditions. Therefore, the Non-Farm Payroll Change (NFP) data, which will be the focal point of the US employment data to be released today, should be interpreted with this framework in mind. In other words, an NFP figure that will be below the forecasts may have a negative impact on digital assets, while a data above it may have a positive impact. Of course, it would be healthier to evaluate the data set as a whole.
What about later?
We have already mentioned the initial impact of the recent US economic data on the markets. However, if we look at the bigger picture, we should also examine how this data set may affect pricing behavior.
In fact, the pricing behavior we have been observing is far from being “demand for risky assets on the perception that bad US data brings the FED a little closer to rate cuts” (or vice versa – good data bad market). Therefore, a data set that would indicate that the problems in the labor market continue, although it may push the FED to cut interest rates a little faster and with bigger steps, may continue to have a negative impact on crypto assets by reducing risk appetite with recession concerns. So what do better-than-expected numbers mean?
If we see better labor market data than the markets are expecting, we expect this to be priced in primarily as a factor related to the health of the US economy. So this could have a positive impact on digital assets. Because we don’t think that any figures to be seen with the data to be released today will distract the FED from interest rate cuts. According to CME FedWatch Tools, the FED is expected to cut interest rates by about 100 basis points for the rest of the year. In order to reach this cut size in 3 meetings, the FED needs to make one 50 bps jumbo cut. For now, it is being priced in that this will happen at the November meeting, but of course that could change. Nevertheless, considering that the main issue is whether the FED will cut 100 basis points by the end of the year, the fact that it will be in November or December will not be a factor that will disrupt all game plans. Therefore, under the assumption that the FED will start its rate cut cycle in September no matter what, we see the possibility of good data having a positive impact on the market as a greater possibility.
TECHNICAL ANALYSIS
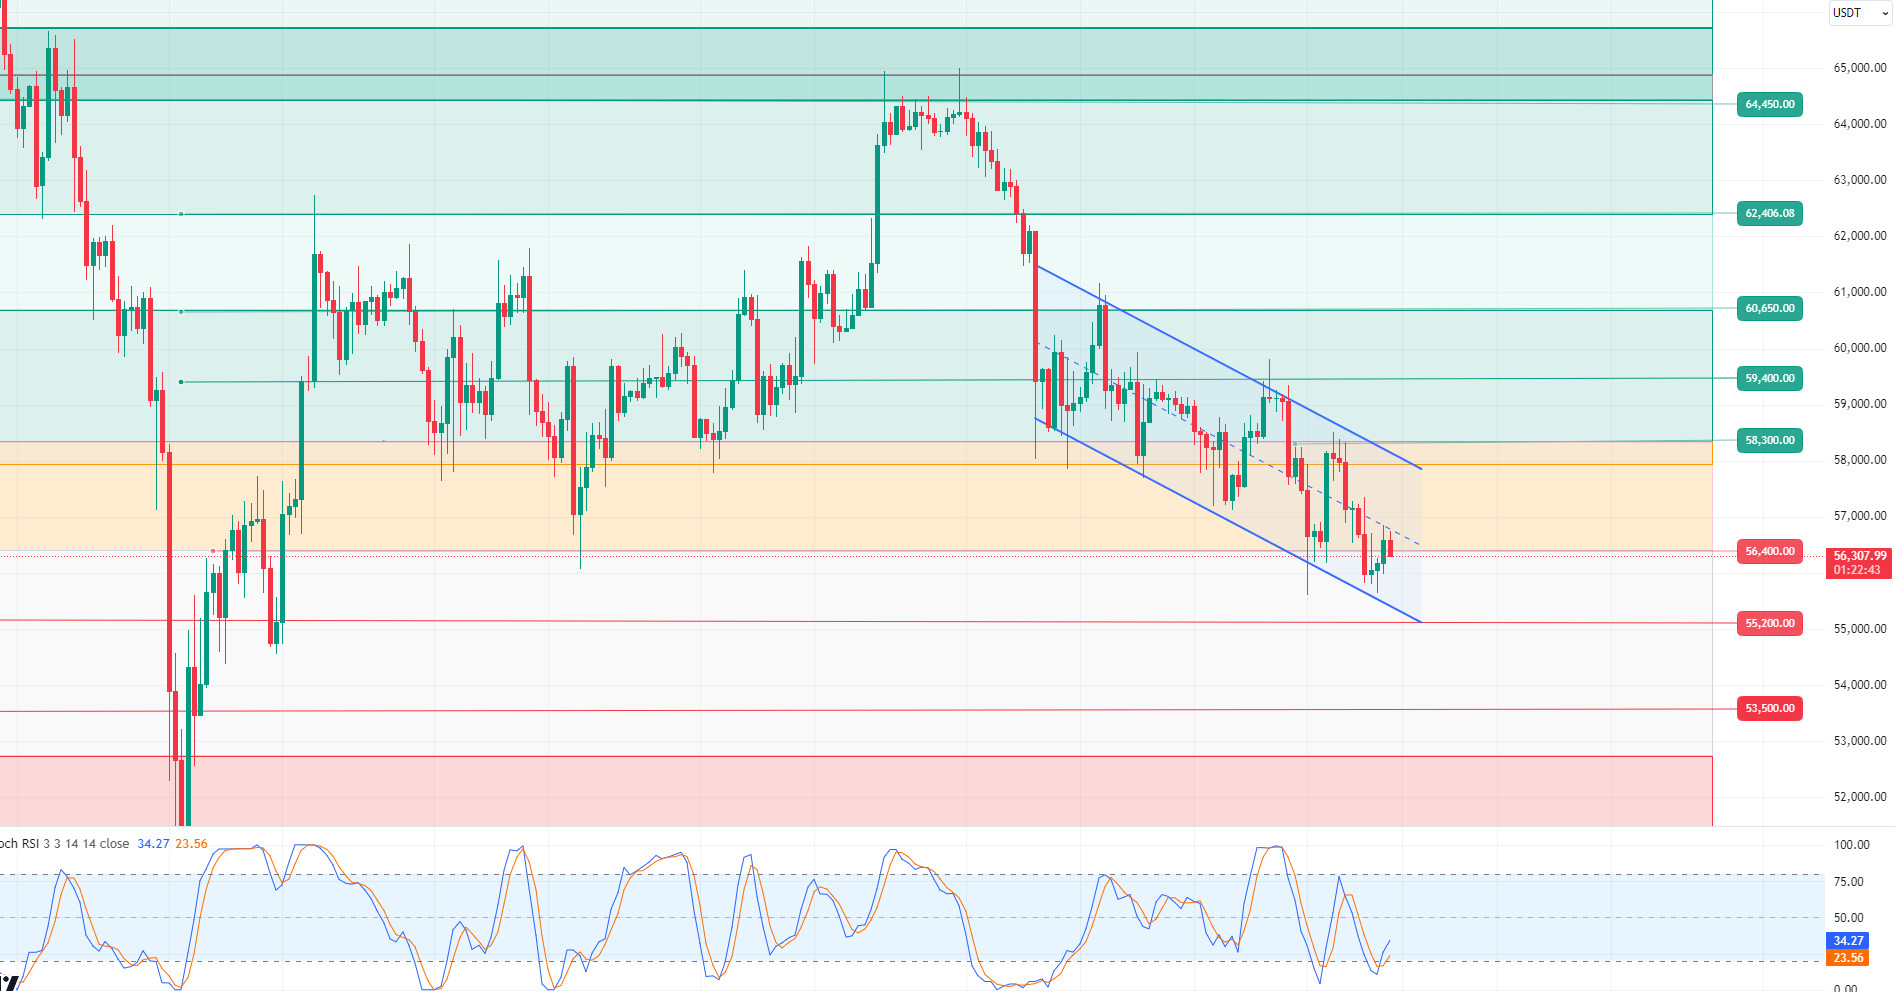
BTC/USDT
Critical day for Bitcoin! As September progresses, Bitcoin continues to maintain its historical price decline trends. It is stated that the main reason for the decline in its price with the decline in interest in Bitcoin and the outflows provided by institutional investors in ETFs is shown as insufficient increase in demand. Valuation metrics also support this situation and show that the market is moving in “bear” market conditions. In the BTC 4-hour technical analysis, as a result of the negative opening of the US stock markets with the ADP data released yesterday, the critical support level of 56,400 in Bitcoin was broken down and tested the 55,600 level. With the reaction it received from this level, it managed to jump above the support point again. Today, non-farm employment and unemployment rates on the data agenda may increase volatility on the market and give us an important message about the direction of Bitcoin in the long term. With our technical indicator RSI turning upwards in the oversold zone, the 58,000 level can be targeted again. If the macroeconomic data does not satisfy the market, the 55,200 level may meet us as a support point in a possible retreat.
Supports 56,400 – 55,200 – 53,500
Resistances 57,200 – 58,300 – 59,400
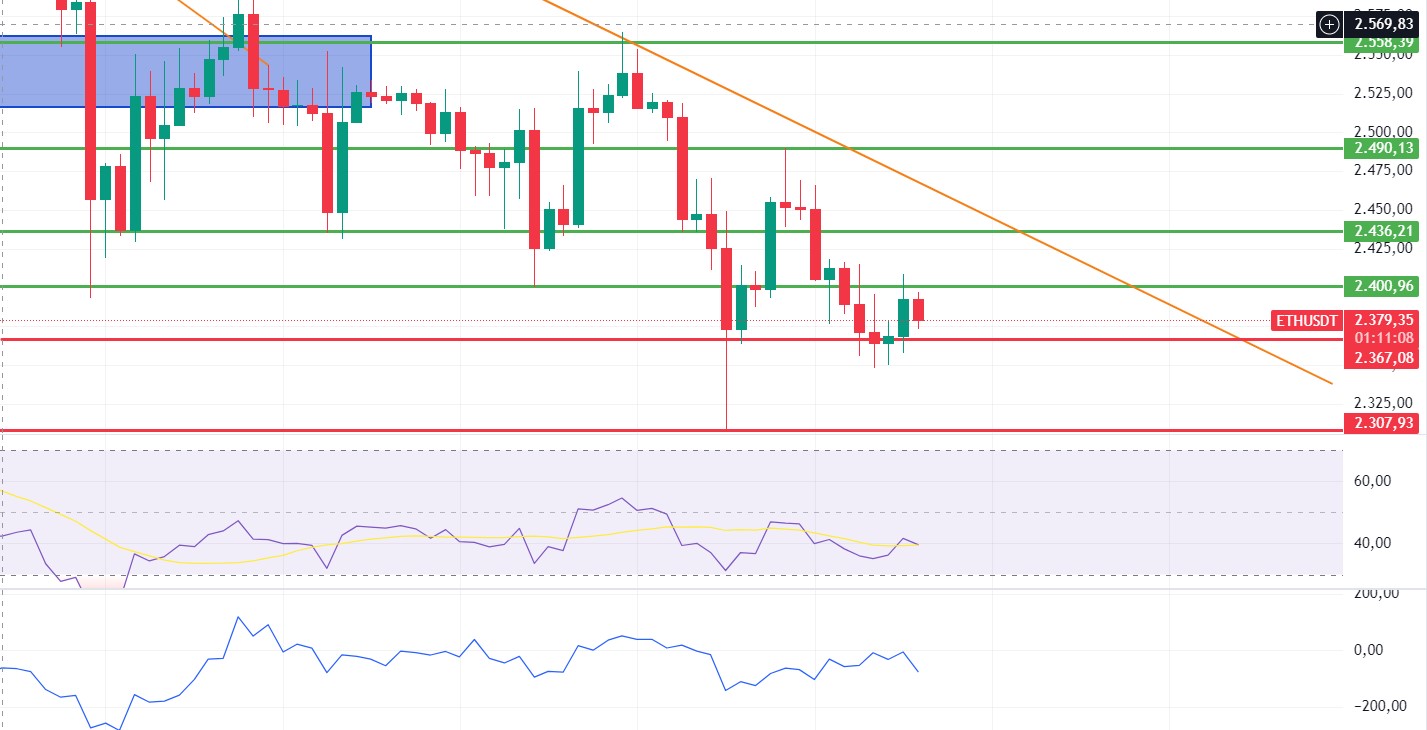
ETH/USDT
Ethereum, which continues to move in the bearish channel, experienced a decline again in the morning hours while pushing above 2,400 levels. Looking at the CVD data, it is seen that the decline came from the spot side. Especially Ethereum Faundation’s selling of ETH is not tolerated in the market, while this selling pressure seems normal when the weaknesses in Bitcoin come together. Momentum and RSI are burning negative again, while MFI seems to have stabilized. It seems likely that the movements between 2,367 – 2400 will continue during the day. Closes above 2,400 may bring the 2,490 level and closes below 2,367 may bring the 2,311 level.
Supports 2,367 – 2,311 – 2,194
Resistances 2,400 – 2,490 – 2,550
LINK/USDT
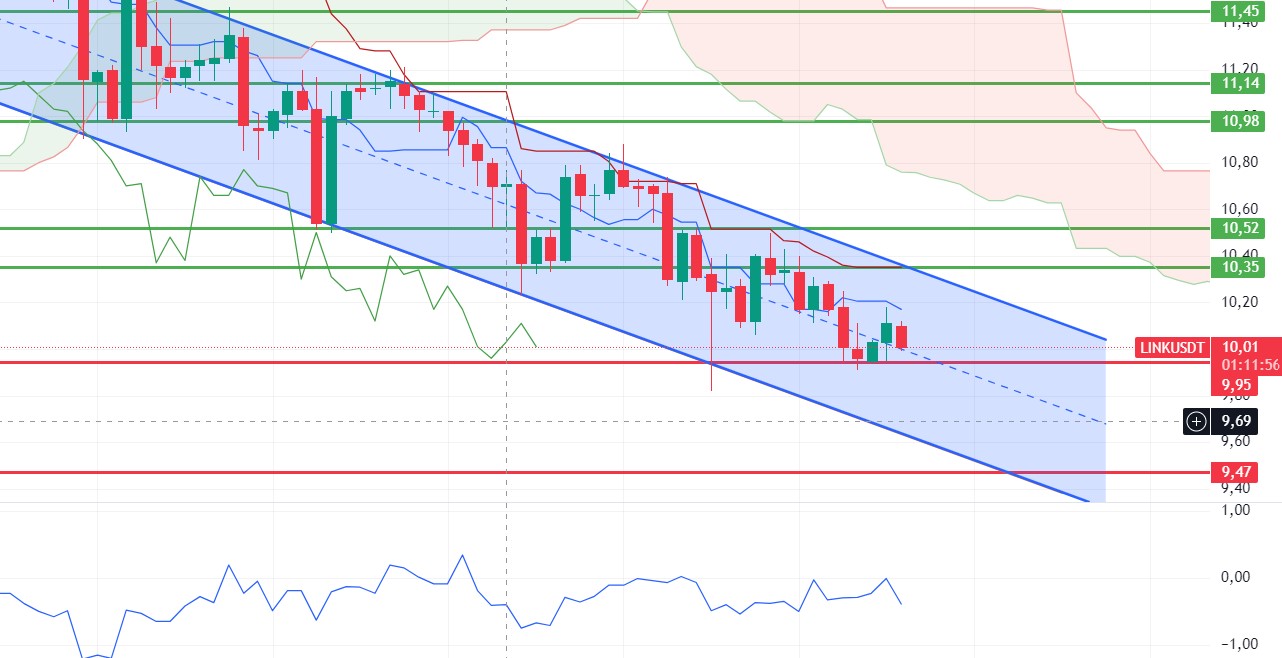
With a loss of 10.08%, LINK, which has a very negative outlook, continues its movements within a bearish channel. It has fallen back to the middle band of the channel and is trying to hold on. Similar to Ethereum, although MFI has stabilized, RSI and momentum look negative again. With the loss of the 9.95 level, a retracement to 9.47 levels can be expected. Closures above the 10.18 kijun level may bring an increase up to 10.35 again.
Supports 9.95 – 9.47 – 8.12
Resistances 10.35 – 10.52 – 10.98
SOL/USDT
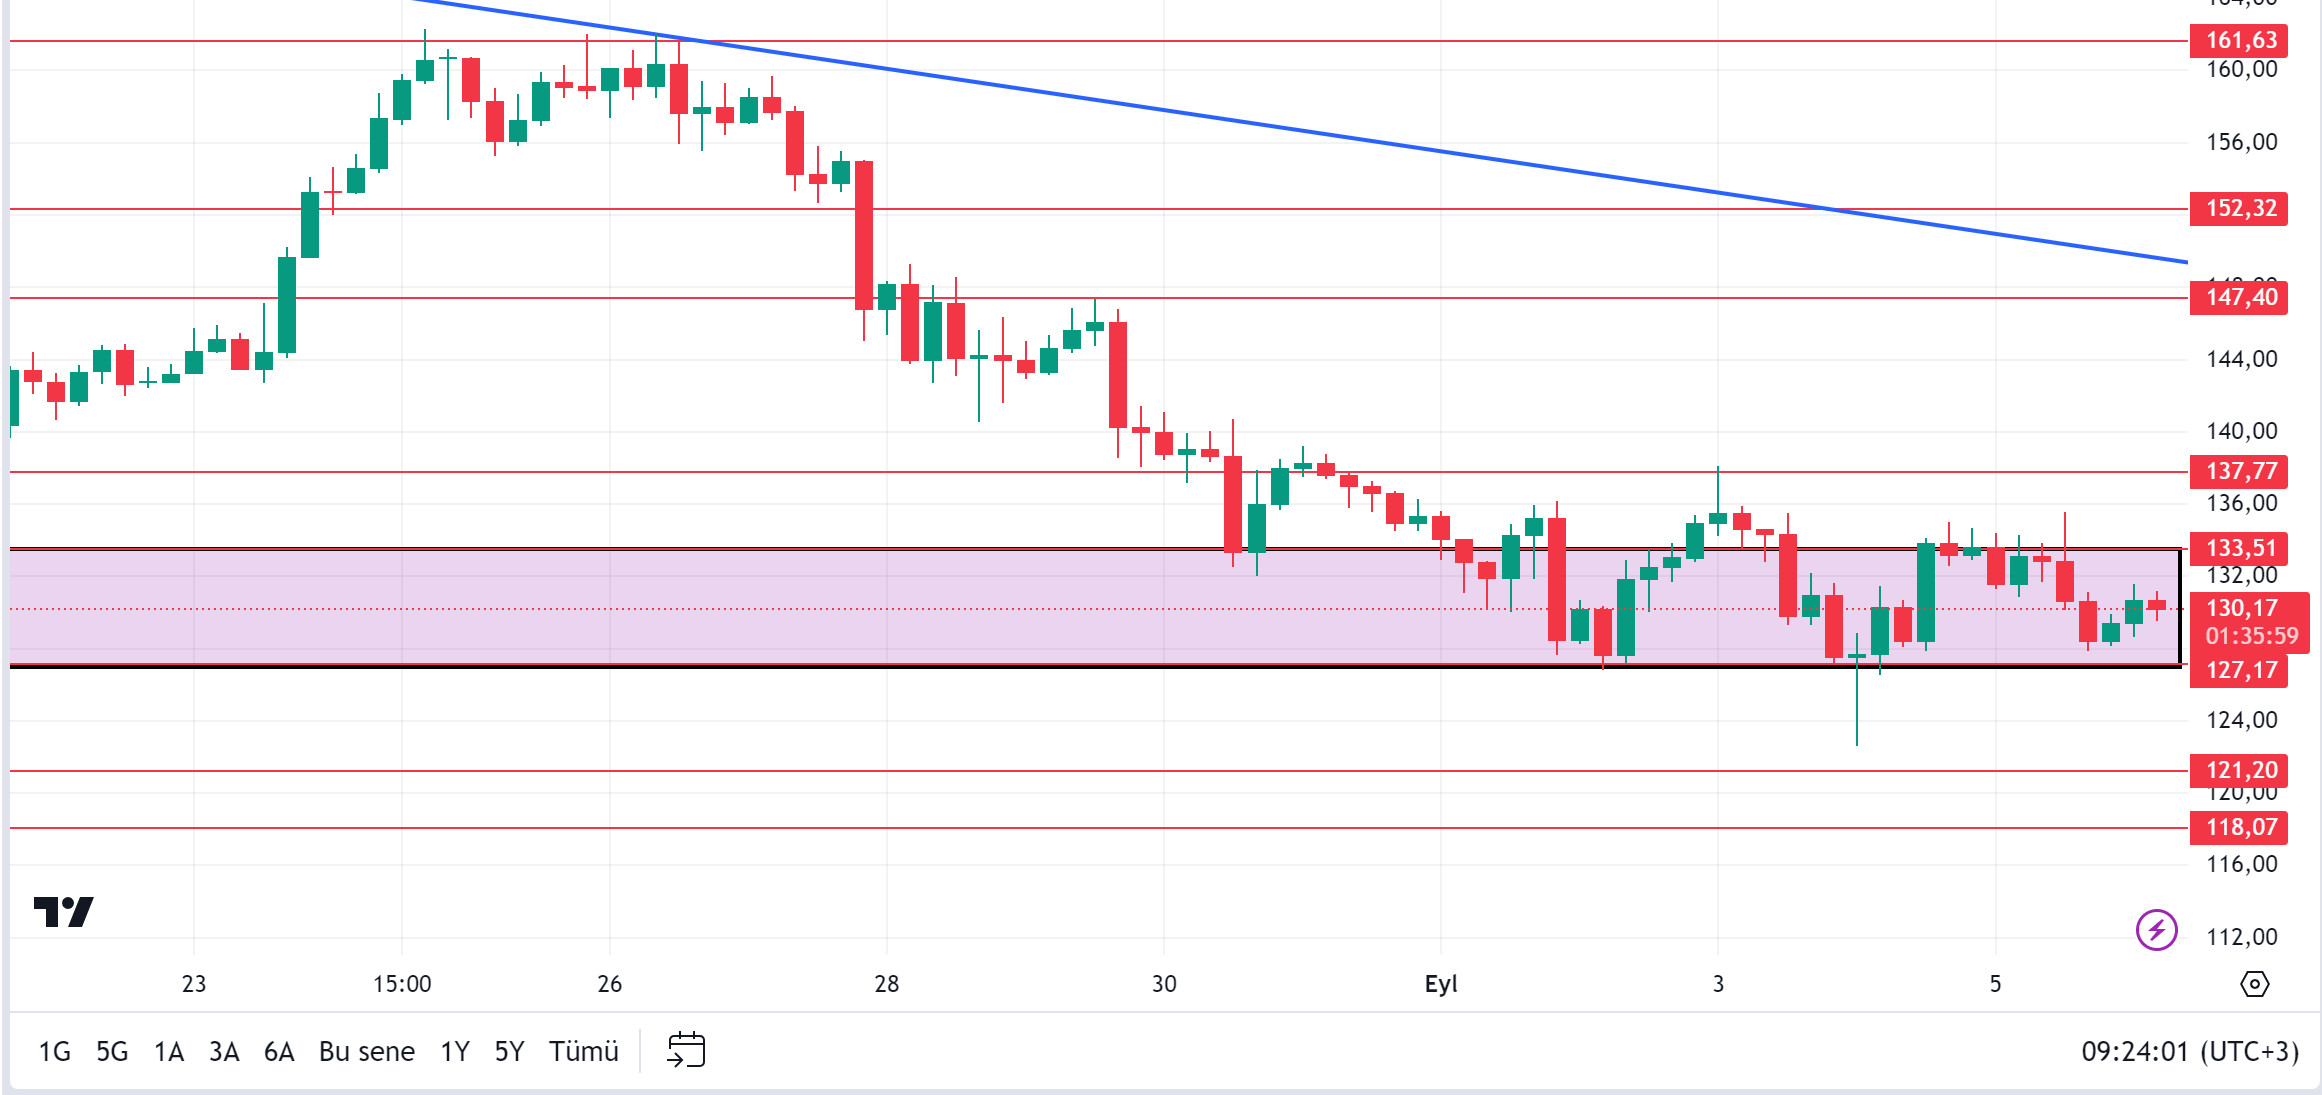
Today, all eyes will be on the US unemployment rate and non-farm payrolls data. In the left ecosystem, according to data from Santiment, open positions fell to $530 million yesterday. This was the lowest level in the last month. Technically, SOL is stuck in the 133.51 – 127.17 band. SOL, which has been accumulating in a certain band since April, may test the resistance levels of 133.51 – 137.77 if the rises continue. If the data from the US is very negative, the resistances 127.17 – 121.20 should be followed.
Supports 127.17 – 121.20 – 118.07
Resistances 133.51 – 137.77 – 147.40
ADA/USDT
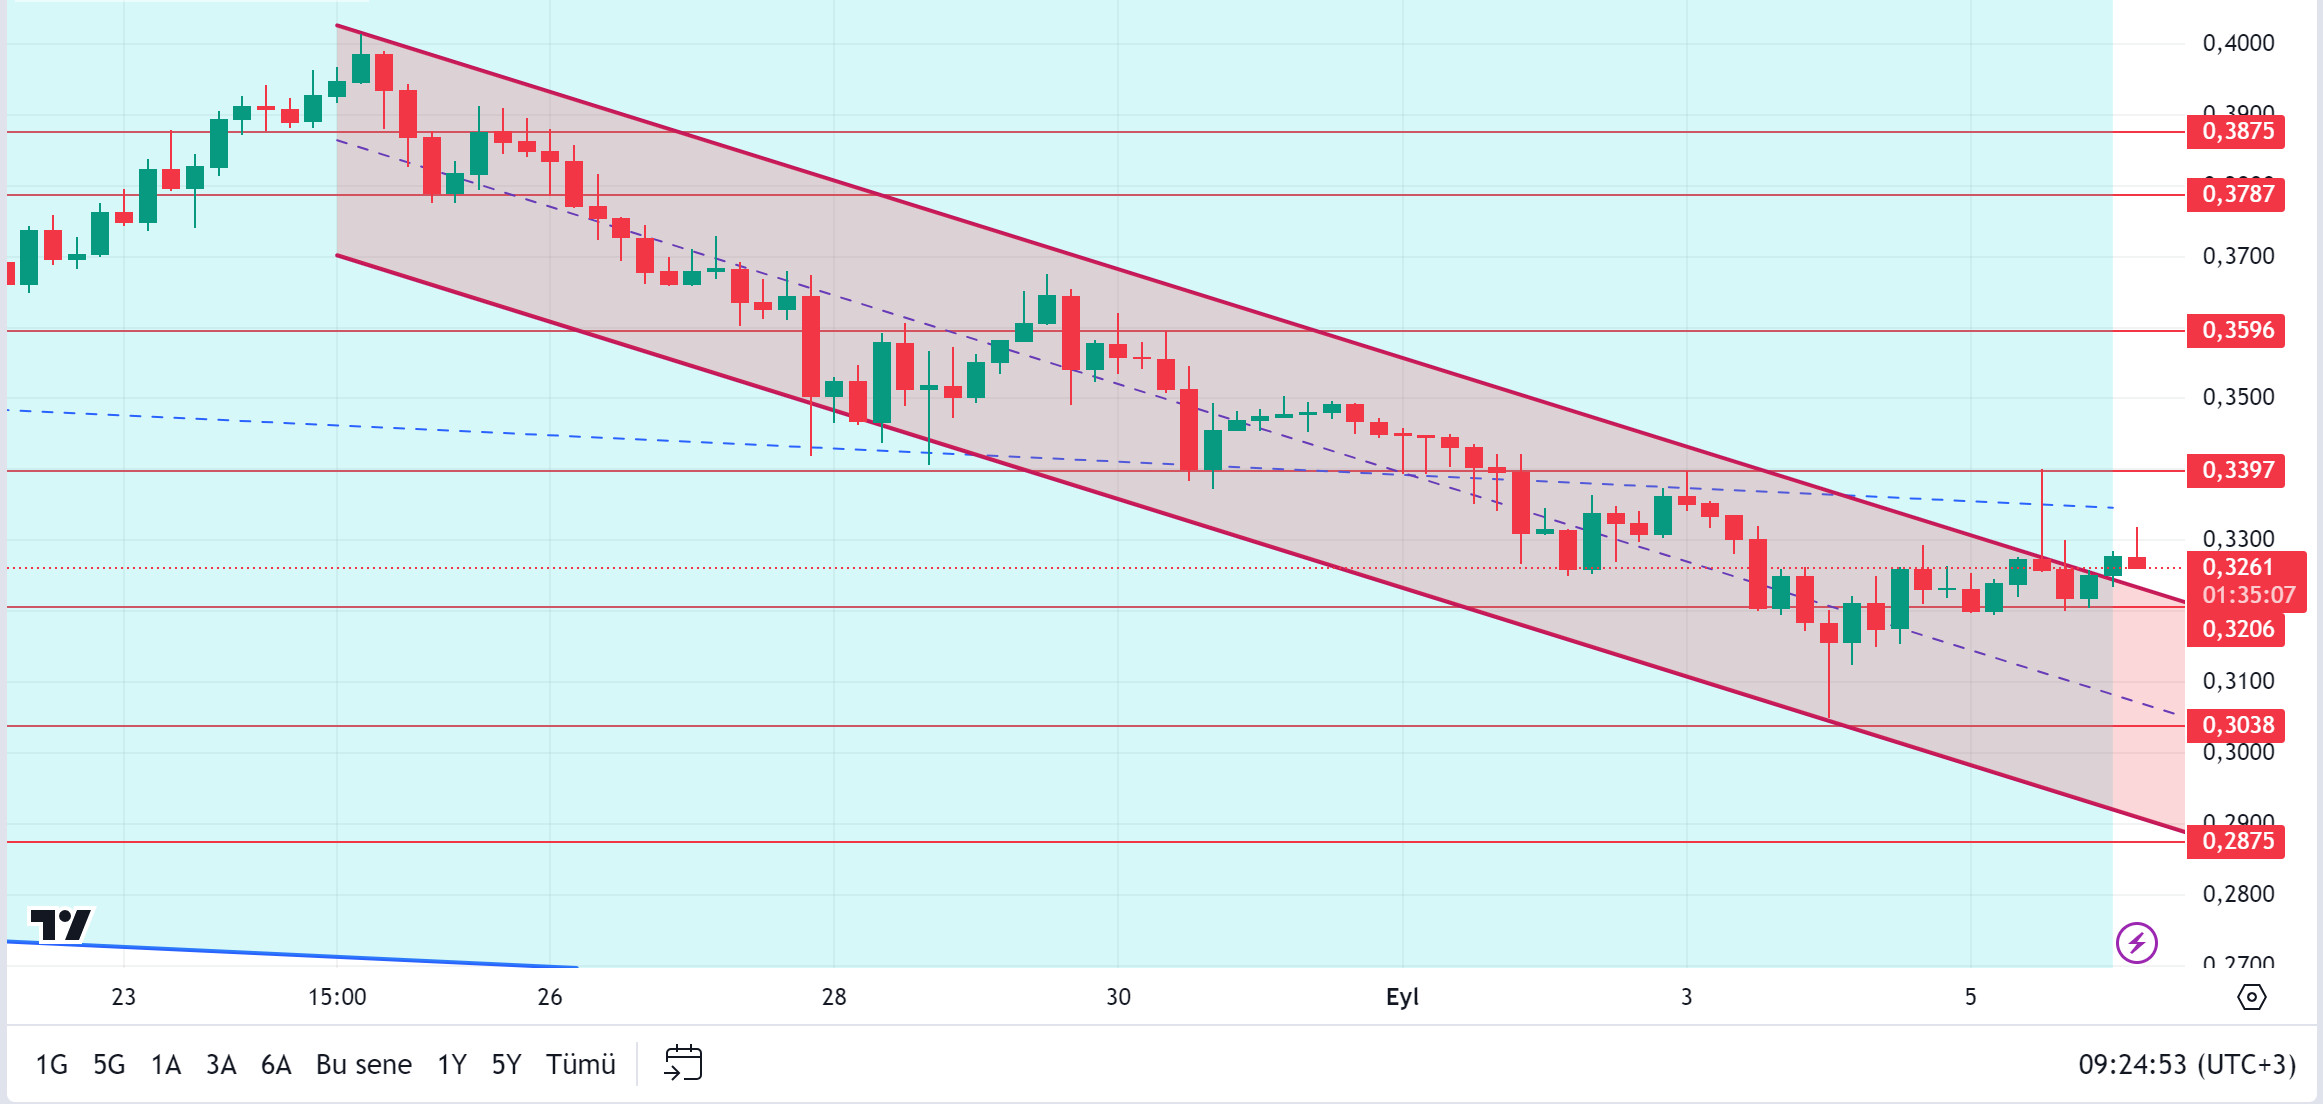
Trump promised to make the US the capital of crypto. On the other hand, all eyes are on the unemployment rate and non-farm employment data from the US today. In the Cardano ecosystem, GovTool has made a significant development by officially launching on its main network. This innovation came after the Chang hard fork and signals continued improvements in the platform’s governance structure. The launch of GovTool promises to redefine community governance in the Cardano ecosystem, which could impact the value dynamics of ADA. Following the introduction of GovTool, excitement in the Cardano ecosystem has increased. This tool allows Cardano token holders to register and delegate voting powers, giving the community an important role in decision-making. When we look at the chart of ADA, it has broken the downward trend that started on August 24th. The effects of the incoming update seem to have slowly made themselves evident. ADA, currently priced at 0.3261, may test 0.3397 resistance. If investors continue to price by experiencing a rise in the innovations brought by the update and if the data from the US is positive, it may bring the price to 0.3397 – 0.3596 levels. The support place to look for due to retracements can be followed at 0.3206 – 0.3038 levels.
Supports 0.3206 – 0.3038 – 0.2875
Resistances 0.3397 – 0.3596 – 0.3787
AVAX/USDT
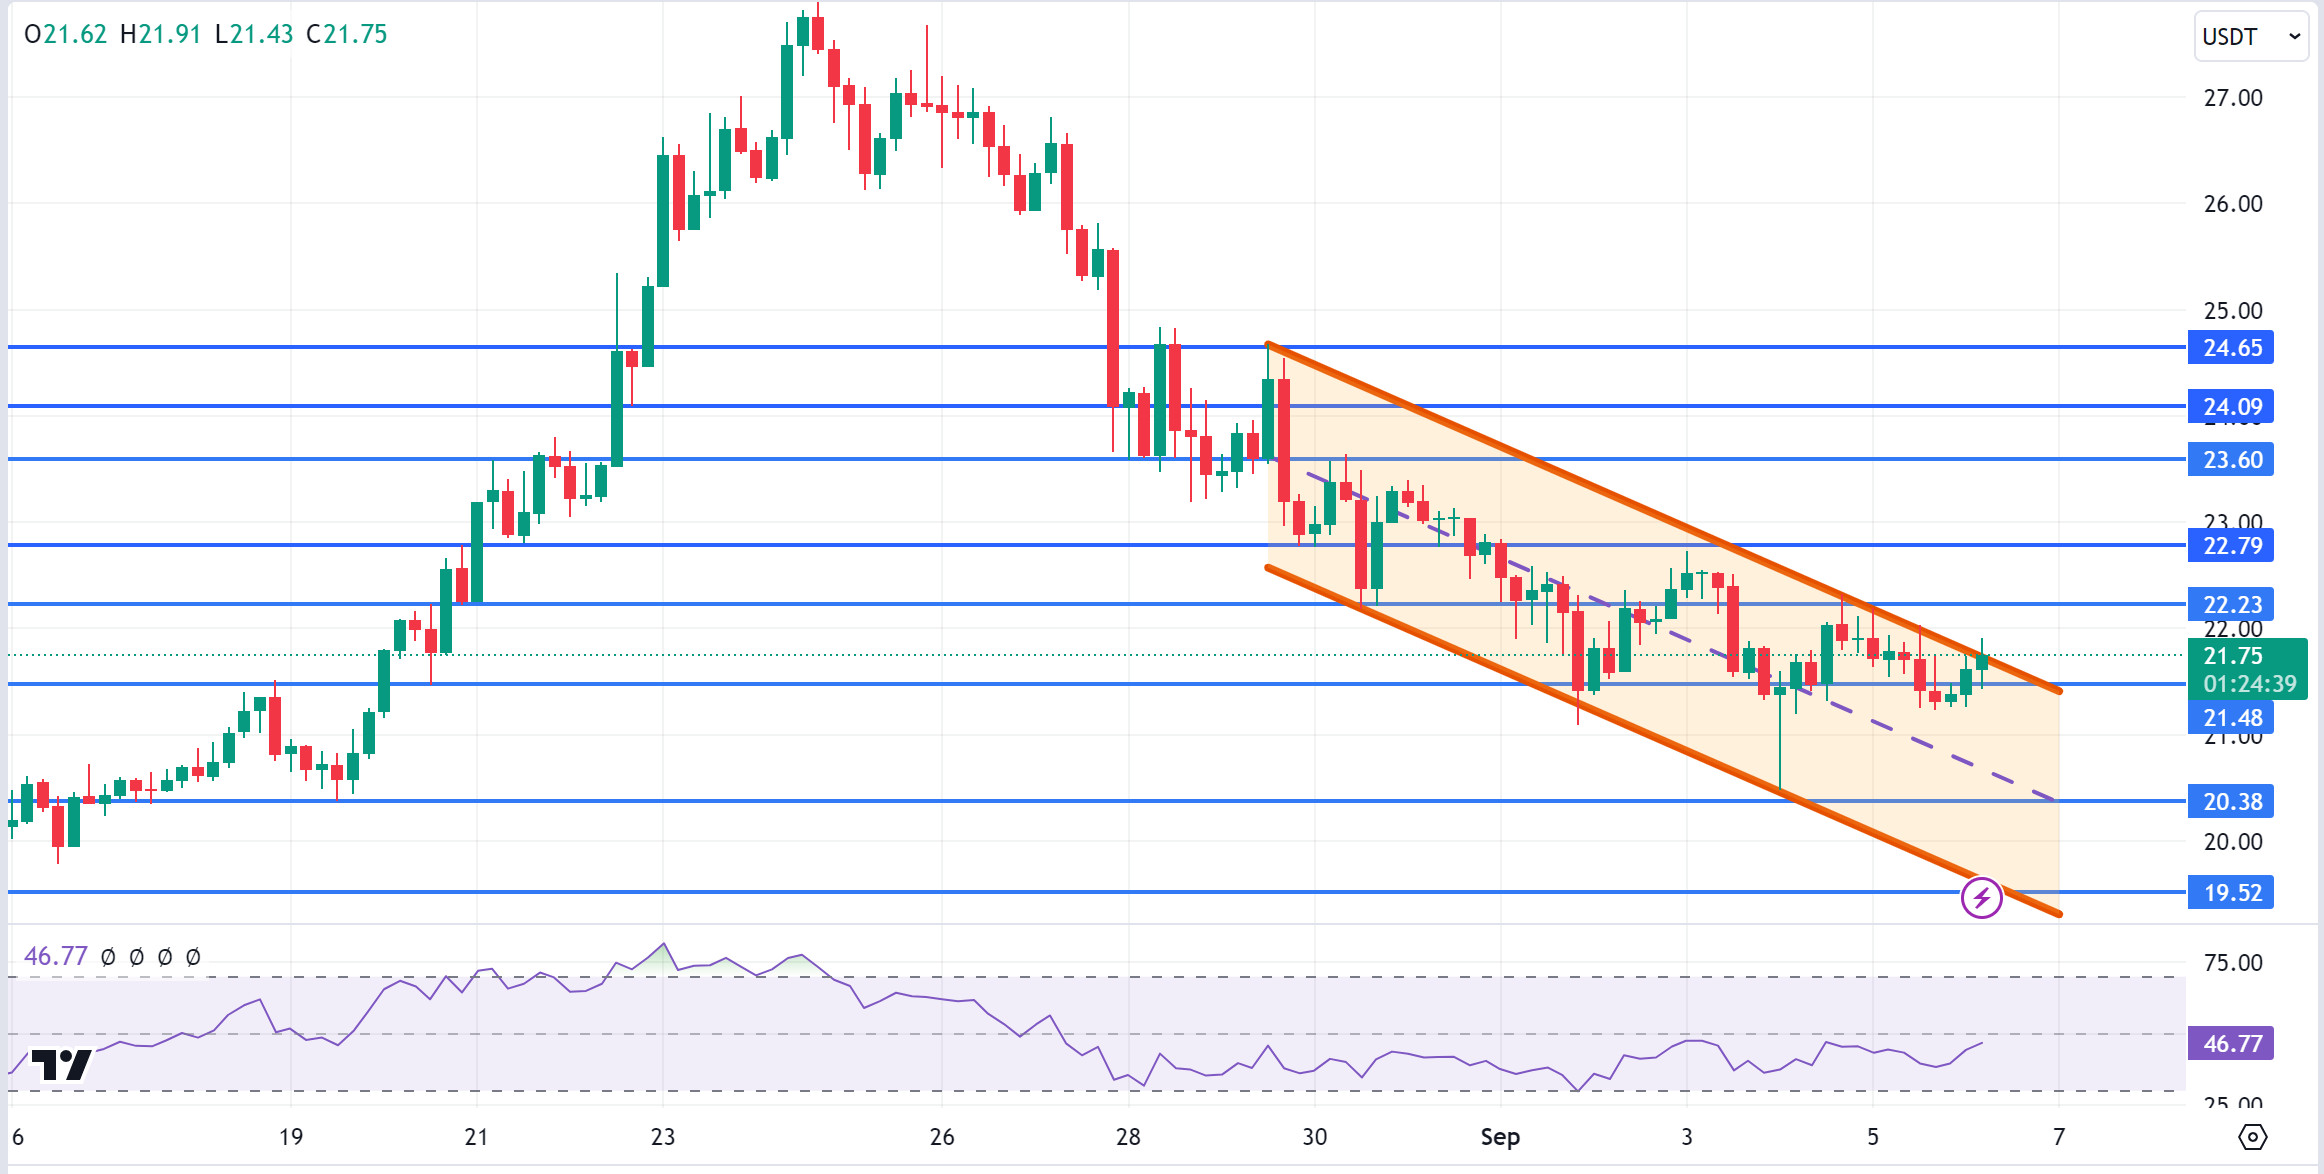
AVAX, which opened yesterday at 21.91, closed the day at 21.38 after the data from the US.
Non-farm payrolls and unemployment rate data will be released by the US today. These data may have an impact on the market and cause volatility. It is currently trading at 21.75 and continues its movement within the falling channel. On the 4-hour chart, it tries to break the upper band of the channel. If it closes the candle above the 22.23 resistance, it may break the channel upwards and test the 22.79 and 23.60 resistances. If it fails to break 22.23 resistance and a sales reaction comes, it may test 21.48 support. As long as it stays above 20.38 support during the day, we can expect it to maintain its upward demand. With the break of 20.38 support, sales may deepen.
Supports 21.48 – 20.38 – 19.52
Resistances 22.23 – 22.79 – 23.60
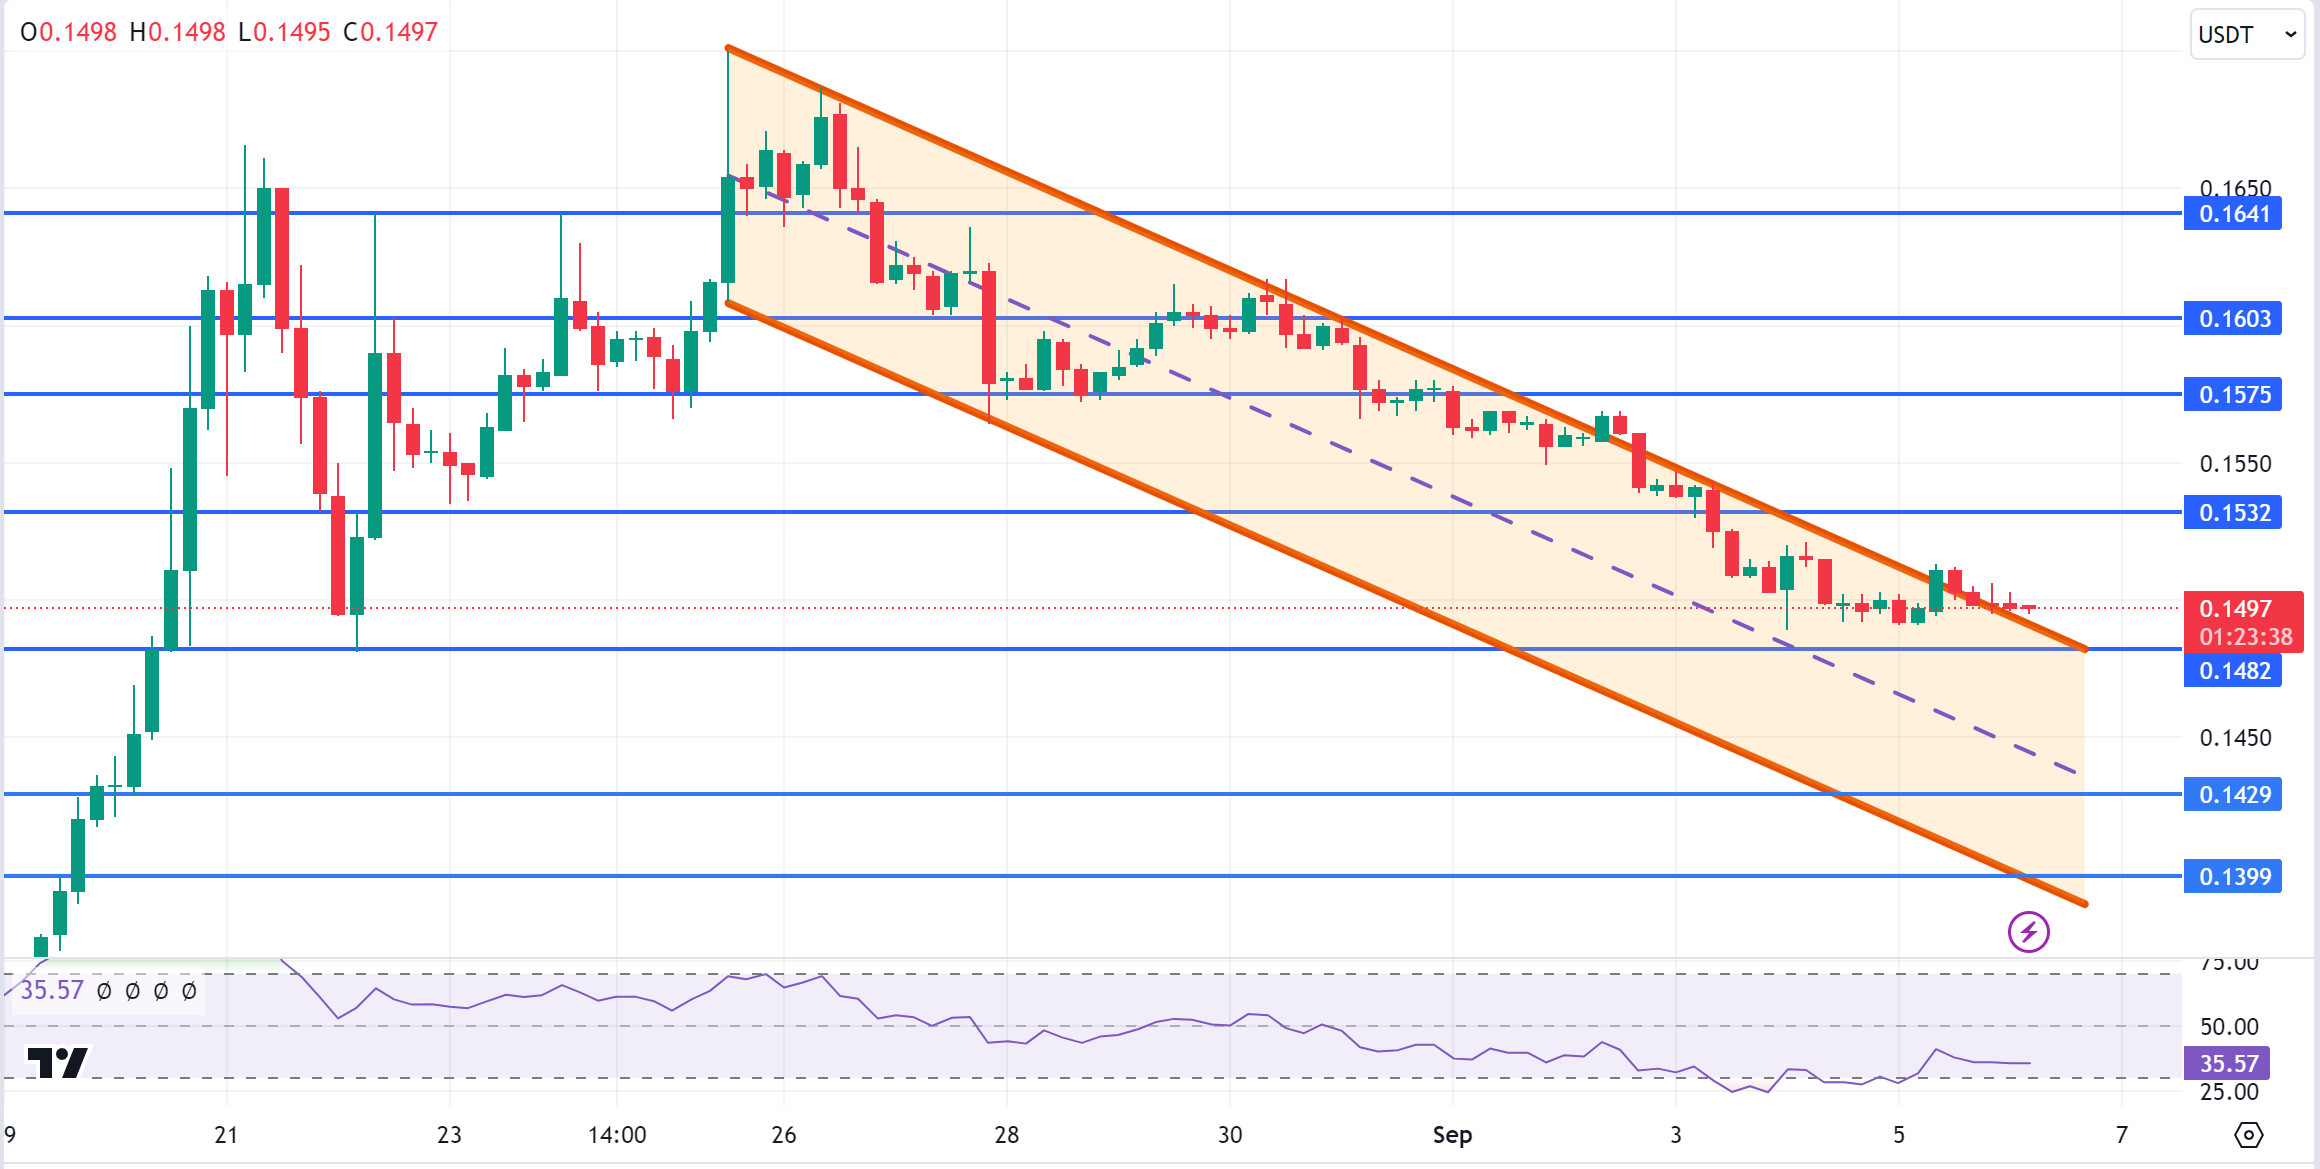
TRX/USDT
TRX, which started yesterday at 0.1500, closed the day at 0.1498 after the US unemployment benefits and PMI data. Today, US non-farm payrolls and unemployment rate data will be released. Currently trading at 0.1497, TRX is trying to break the upper band of the falling channel. On the 4-hour chart, the RSI is approaching the oversold zone with a value of 35 and a buying reaction can be expected from this zone. In such a case, it may test the 0.1532 resistance. If it breaks the 0.1482 support during the day and moves towards the lower band of the channel, it may test the 0.1429 and 0.1399 supports. As long as TRX stays above 0.1482 support, it can be expected to continue its upward demand. If this support is broken downwards, selling pressure may increase.
Supports 0.1482 – 0.1429 – 0.1399
Resistances 0.1532 – 0.1575 – 0.1603
XRP/USDT
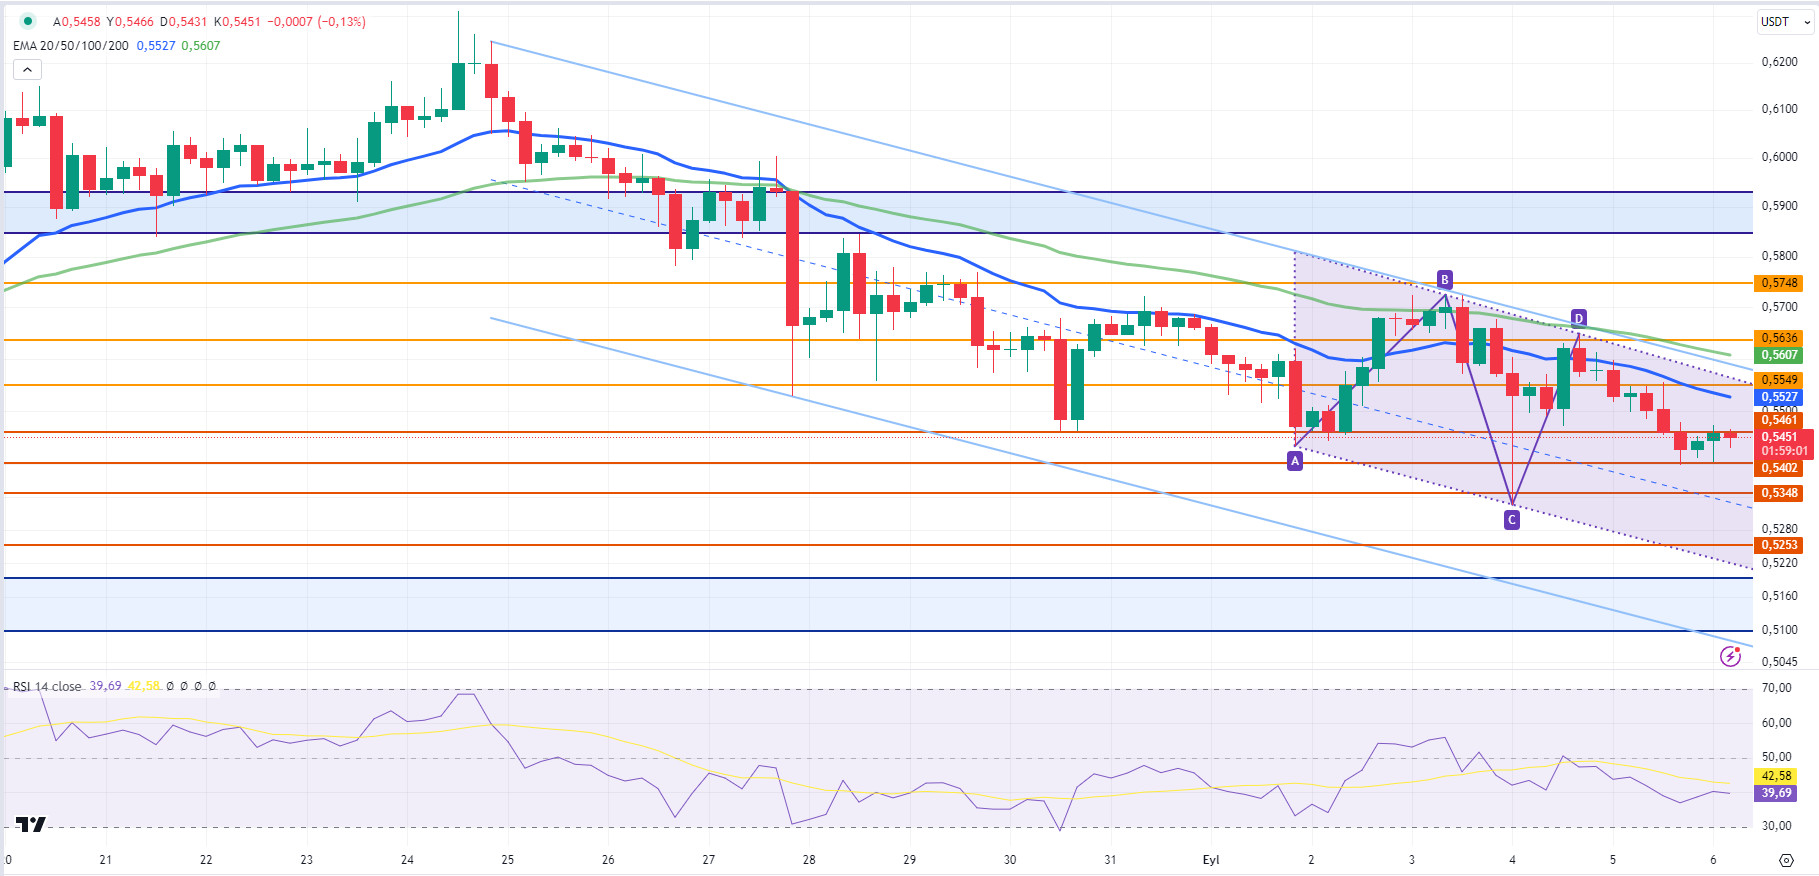
XRP closed the day at 0.5441 with a 2.42% loss of value, starting at 0.5579 after the decline it experienced yesterday. XRP, which moved in a horizontal band at the beginning of the day, is currently trading at 0.5453.
In the 4-hour analysis, XRP, which tested and failed to break the 0.5402 support level twice on the decline, tested the 0.5461 resistance level after the rise. XRP, which failed to break the 0.5461 resistance level on the opening candle today, retested the resistance level on the last candle and continues to trade at the resistance level. If the 0.5461 resistance level is broken and the rise in XRP continues, it may test the 0.5549-0.5636-0.5748 resistance levels. On the contrary, if the resistance level cannot be broken and the decline begins, XRP may test the 0.5402-0.5348-0.5253 support levels.
XRP may also be affected by the volatility that may occur in the crypto market ahead of important economic data to be announced by the US. In the process in which it is traded within the 0.52-0.55 band, it may offer a long trading opportunity in case of a rise after the reaction that may come in the decline to the level of 0.52. It may also offer a short trading opportunity in case of a decline below the 0.52 level and a deepening of the decline.
Supports 0.5402 – 0.5348 – 0.5253
Resistances 0.5549 – 0.5636 – 0.5748
DOGE/USDT
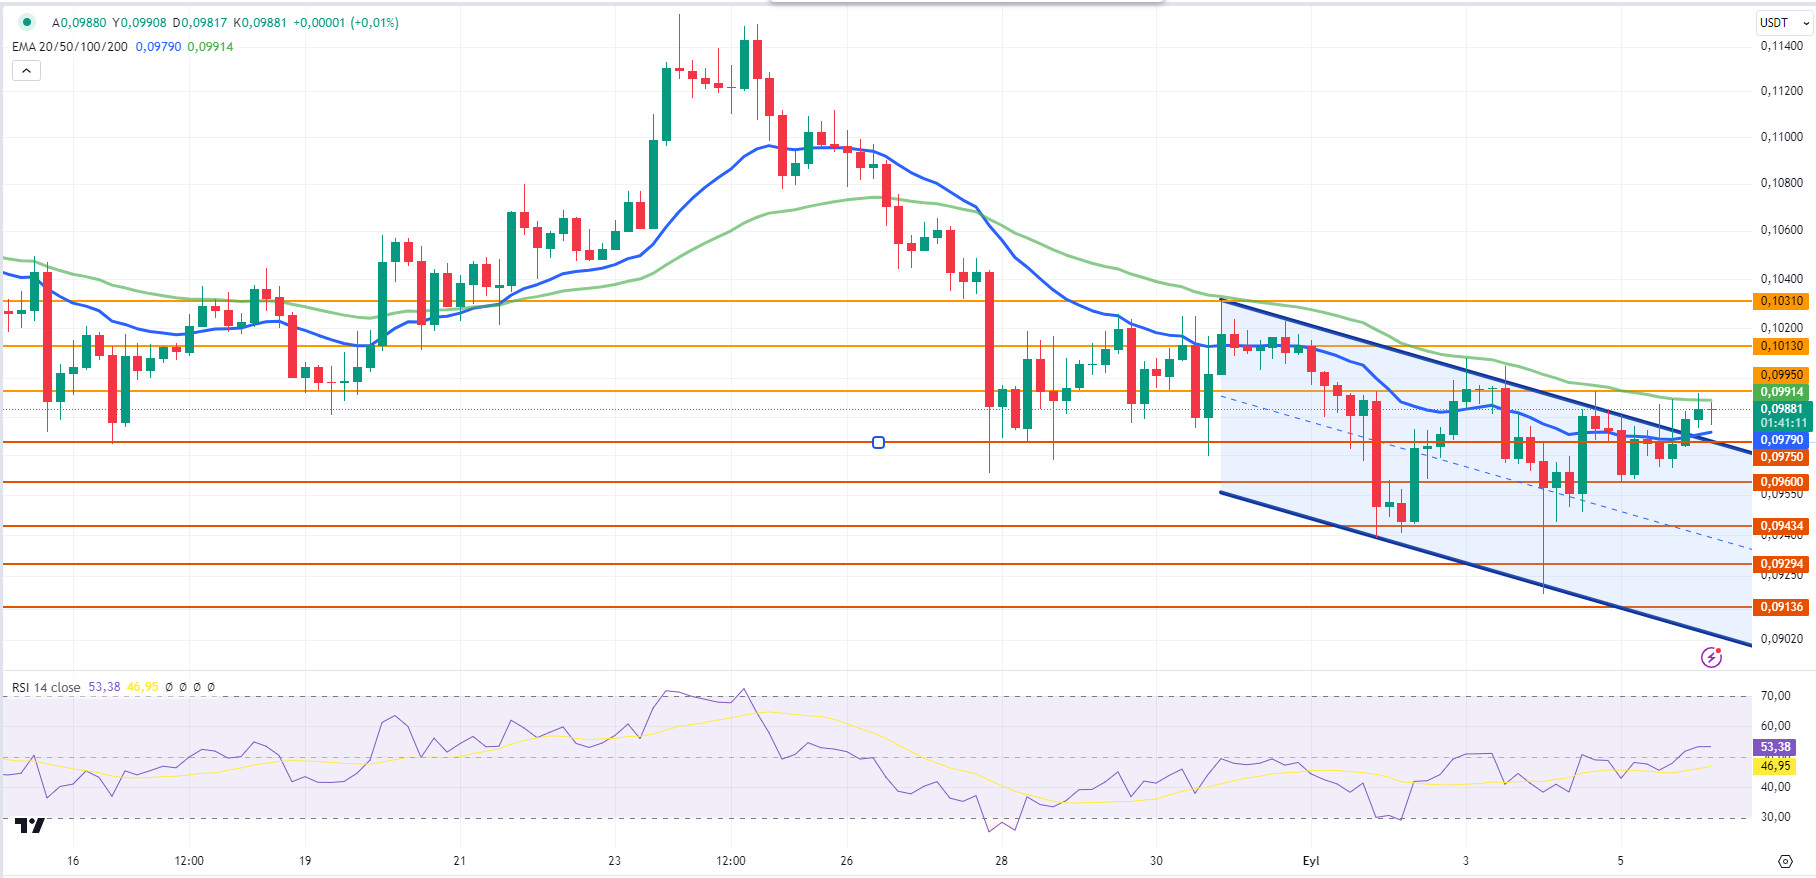
DOGE closed yesterday at 0.0983, up 0.4% on a daily basis and traded outside the downtrend. DOGE continued to rise on the opening candle today. DOGE, which fell with the reaction at the EMA50 (Green Color) level after rising on the last candle today, is currently trading at 0.0988.
In the 4-hour analysis, DOGE may test the resistance levels of 0.0995-0.1013-0.1031 if it continues to rise after breaking the downtrend and breaks the EMA50 (Green Color) level after retesting it. In the event that the EMA50 level cannot be broken and starts to decline with the reaction, a decline to the downtrend band may occur and DOGE may test the support levels of 0.0975-0.0960-0.0943.
The Non-Farm Payrolls (Aug) and Unemployment Rate (Aug) data to be released by the US today are important for the crypto market and may cause volatility in the market. The impact of these data on the market is expected to be seen on DOGE.
Supports 0.0975 – 0.0960 – 0.0943
Resistances 0.0995 – 0.1013 – 0.1031
DOT/USDT
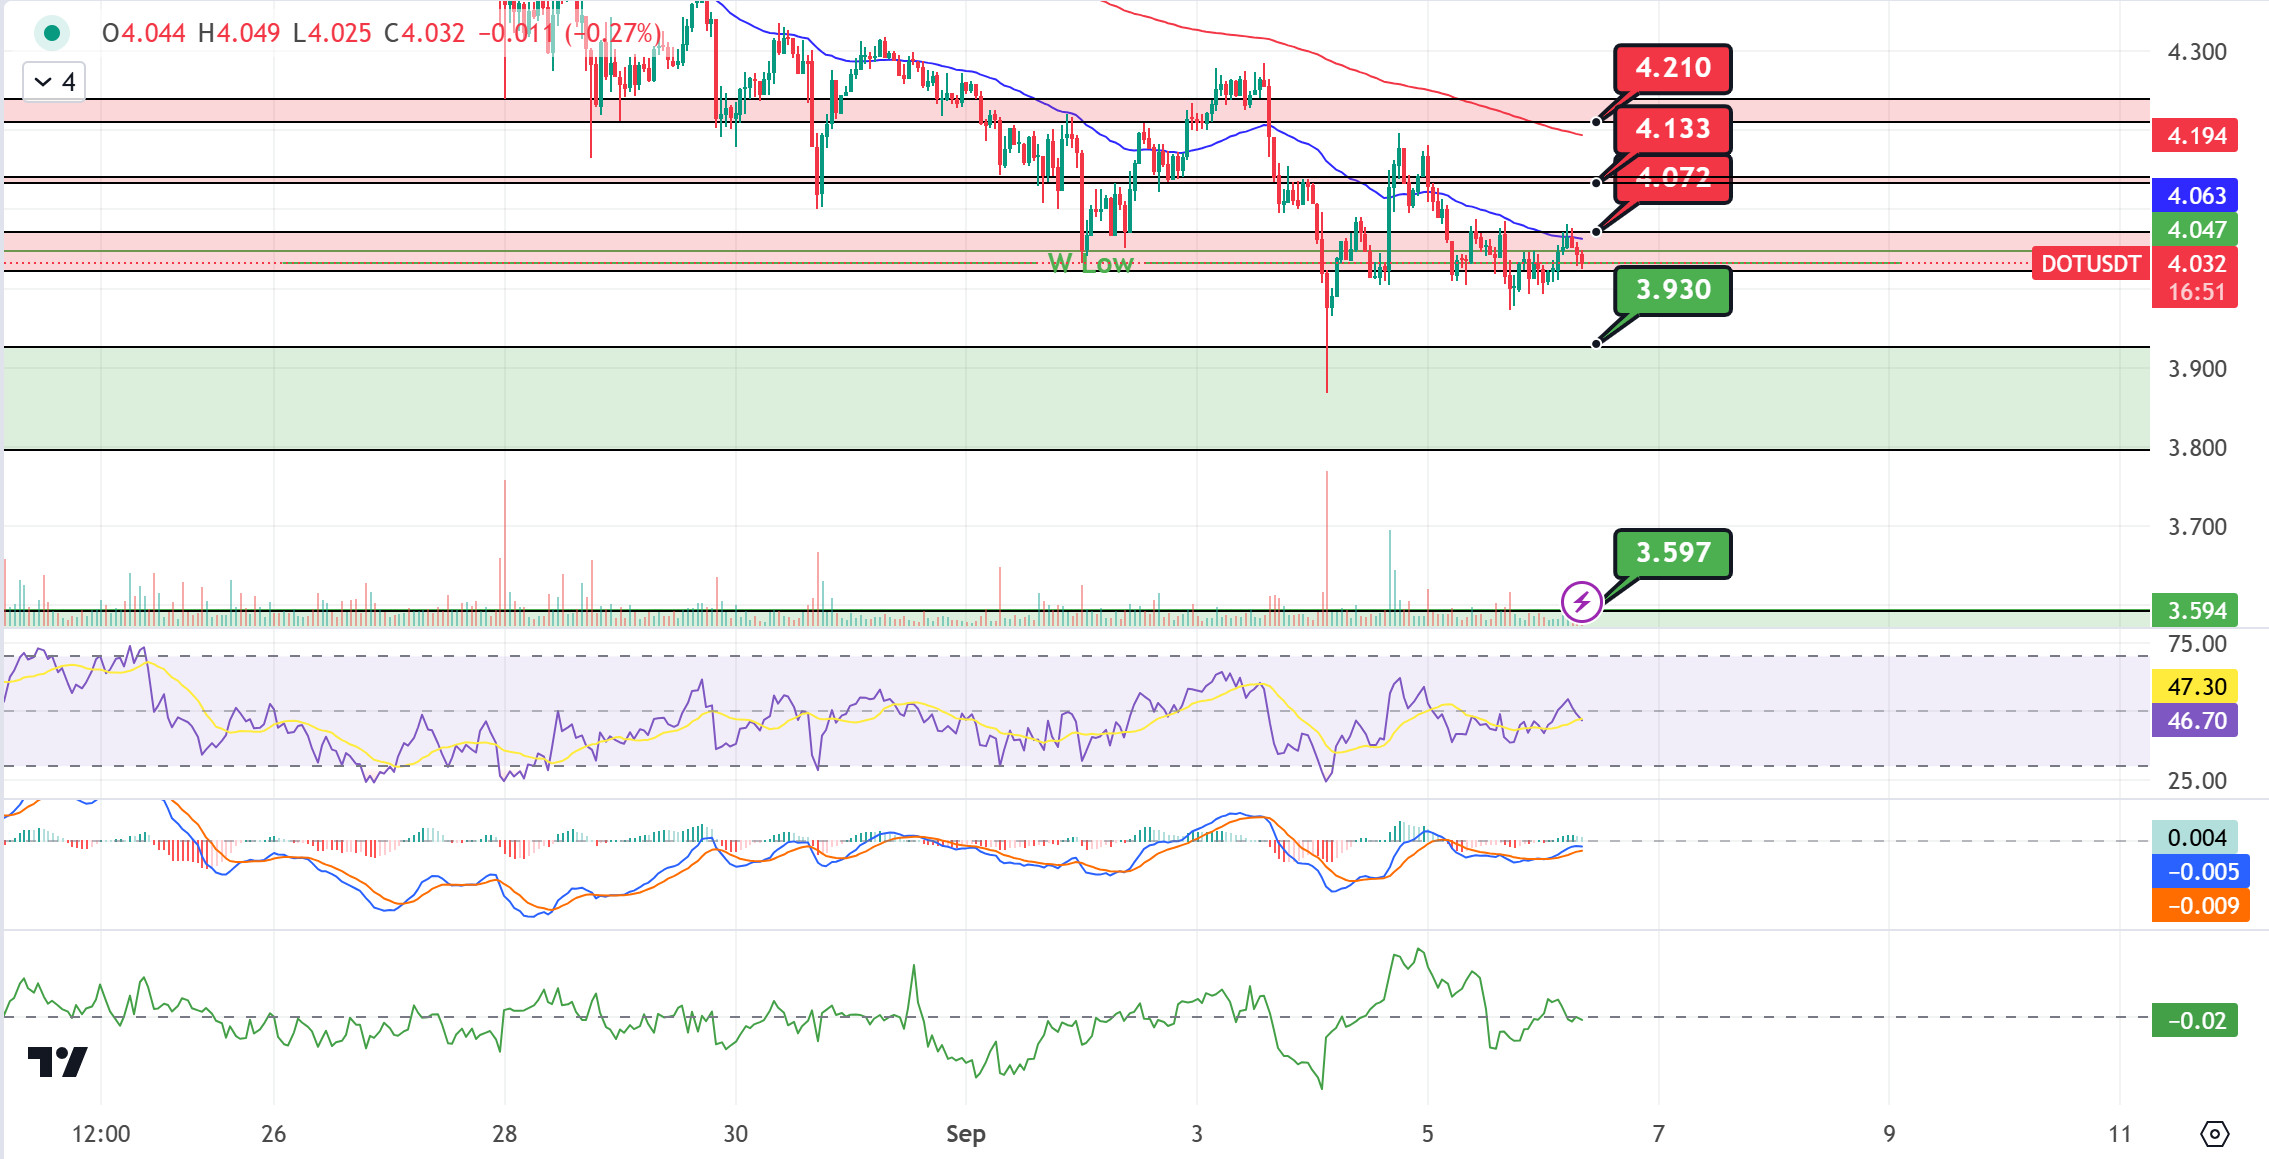
Mastercard is partnering with European payments firm Mercuryo to launch the Spend crypto debit card, which is compatible with leading blockchains such as Polkadot (DOT). The card enables users to spend crypto assets directly from their wallets, eliminating the need for intermediaries and making crypto more accessible for everyday spending.
When we examine the DOT chart, we see that the price rejected our first resistance level at 4,072. When we examine the MACD and CMF (Chaikin Money Flow) oscillators, we can say that the buyer pressure has decreased compared to the previous hours. According to this data, the price rejected at 4.072 may retreat to the support level of 3.930. On the other hand, if the selling pressure at 4.072 is broken with the increase in buyer pressure, the price may move towards 4.133 resistance.
(Blue line: EMA50, Red line: EMA200)
Supports 3.930 – 3.597 – 3.335
Resistances 4.072 – 4.133 – 4.210
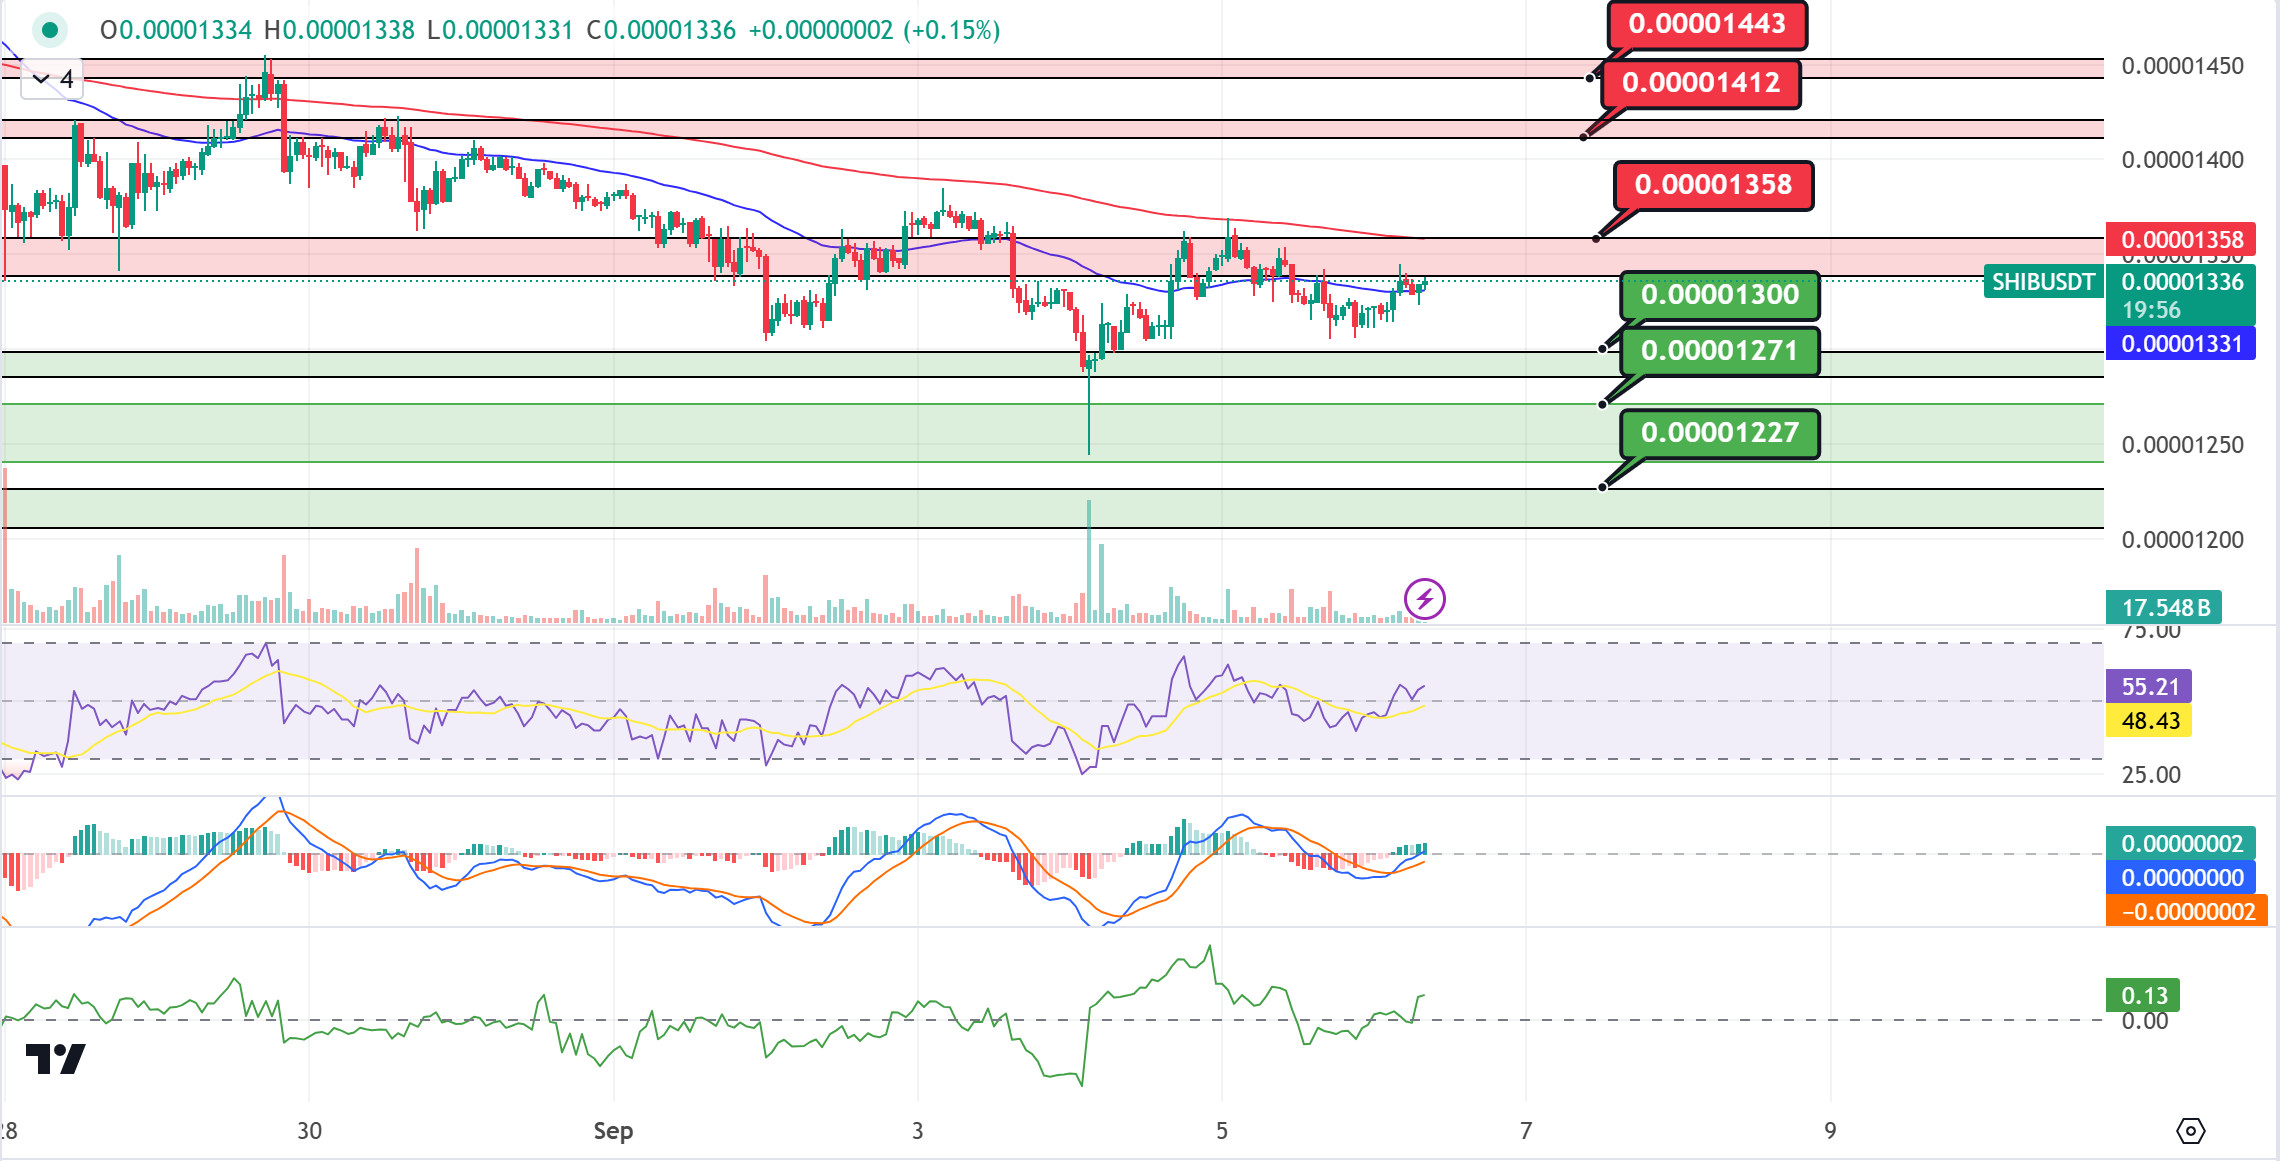
SHIB/USDT
The Shiba Inu team introduced the new DevPortal that will transform the Shibarium Layer 2 blockchain. The platform aims to streamline the dApp development process for both new and experienced developers. Equipped with advanced tools, API management and security-oriented features, the portal can contribute to the growth of Shibarium by supporting DeFi, NFTs and other blockchain applications.
Analyzing the SHIB chart, we see that the price is trying to stay above the EMA50. According to MACD and CMF (Chaikin Money Flow) oscillator, we can say that the buying pressure has increased compared to the previous hour. In the positive scenario, the price may look to break the selling pressure at 0.00001358 by moving towards the EMA200. If the selling pressure at this level is broken, we may see a rally towards 0.00001412. On the other hand, if the price fails to hold above the EMA50, the price may retreat towards the first support level of 0.00001300.
(Blue line: EMA50, Red line: EMA200)
Supports 0.00001300 – 0.00001271 – 0.00001227
Resistances 0.00001358 – 0.00001412 – 0.00001443
LEGAL NOTICE
The investment information, comments and recommendations contained herein do not constitute investment advice. Investment advisory services are provided individually by authorized institutions taking into account the risk and return preferences of individuals. The comments and recommendations contained herein are of a general nature. These recommendations may not be suitable for your financial situation and risk and return preferences. Therefore, making an investment decision based solely on the information contained herein may not produce results in line with your expectations.