
BTC/USDT
In a week that saw Bitcoin move sideways and upwards, the crypto market suffered one of the sharpest declines en its history as markets closed over the weekend. The market, which previously faced intense selling pressure following the FTX and Luna crises, made history this time por recording a sharp decline en the context of D. Trump’s tariffs el Canada, Mexico and China. Total market capitalization fell to $2.8 trillion, while Bitcoin dominance approached 65%, testing this territory for the first time since 2021.
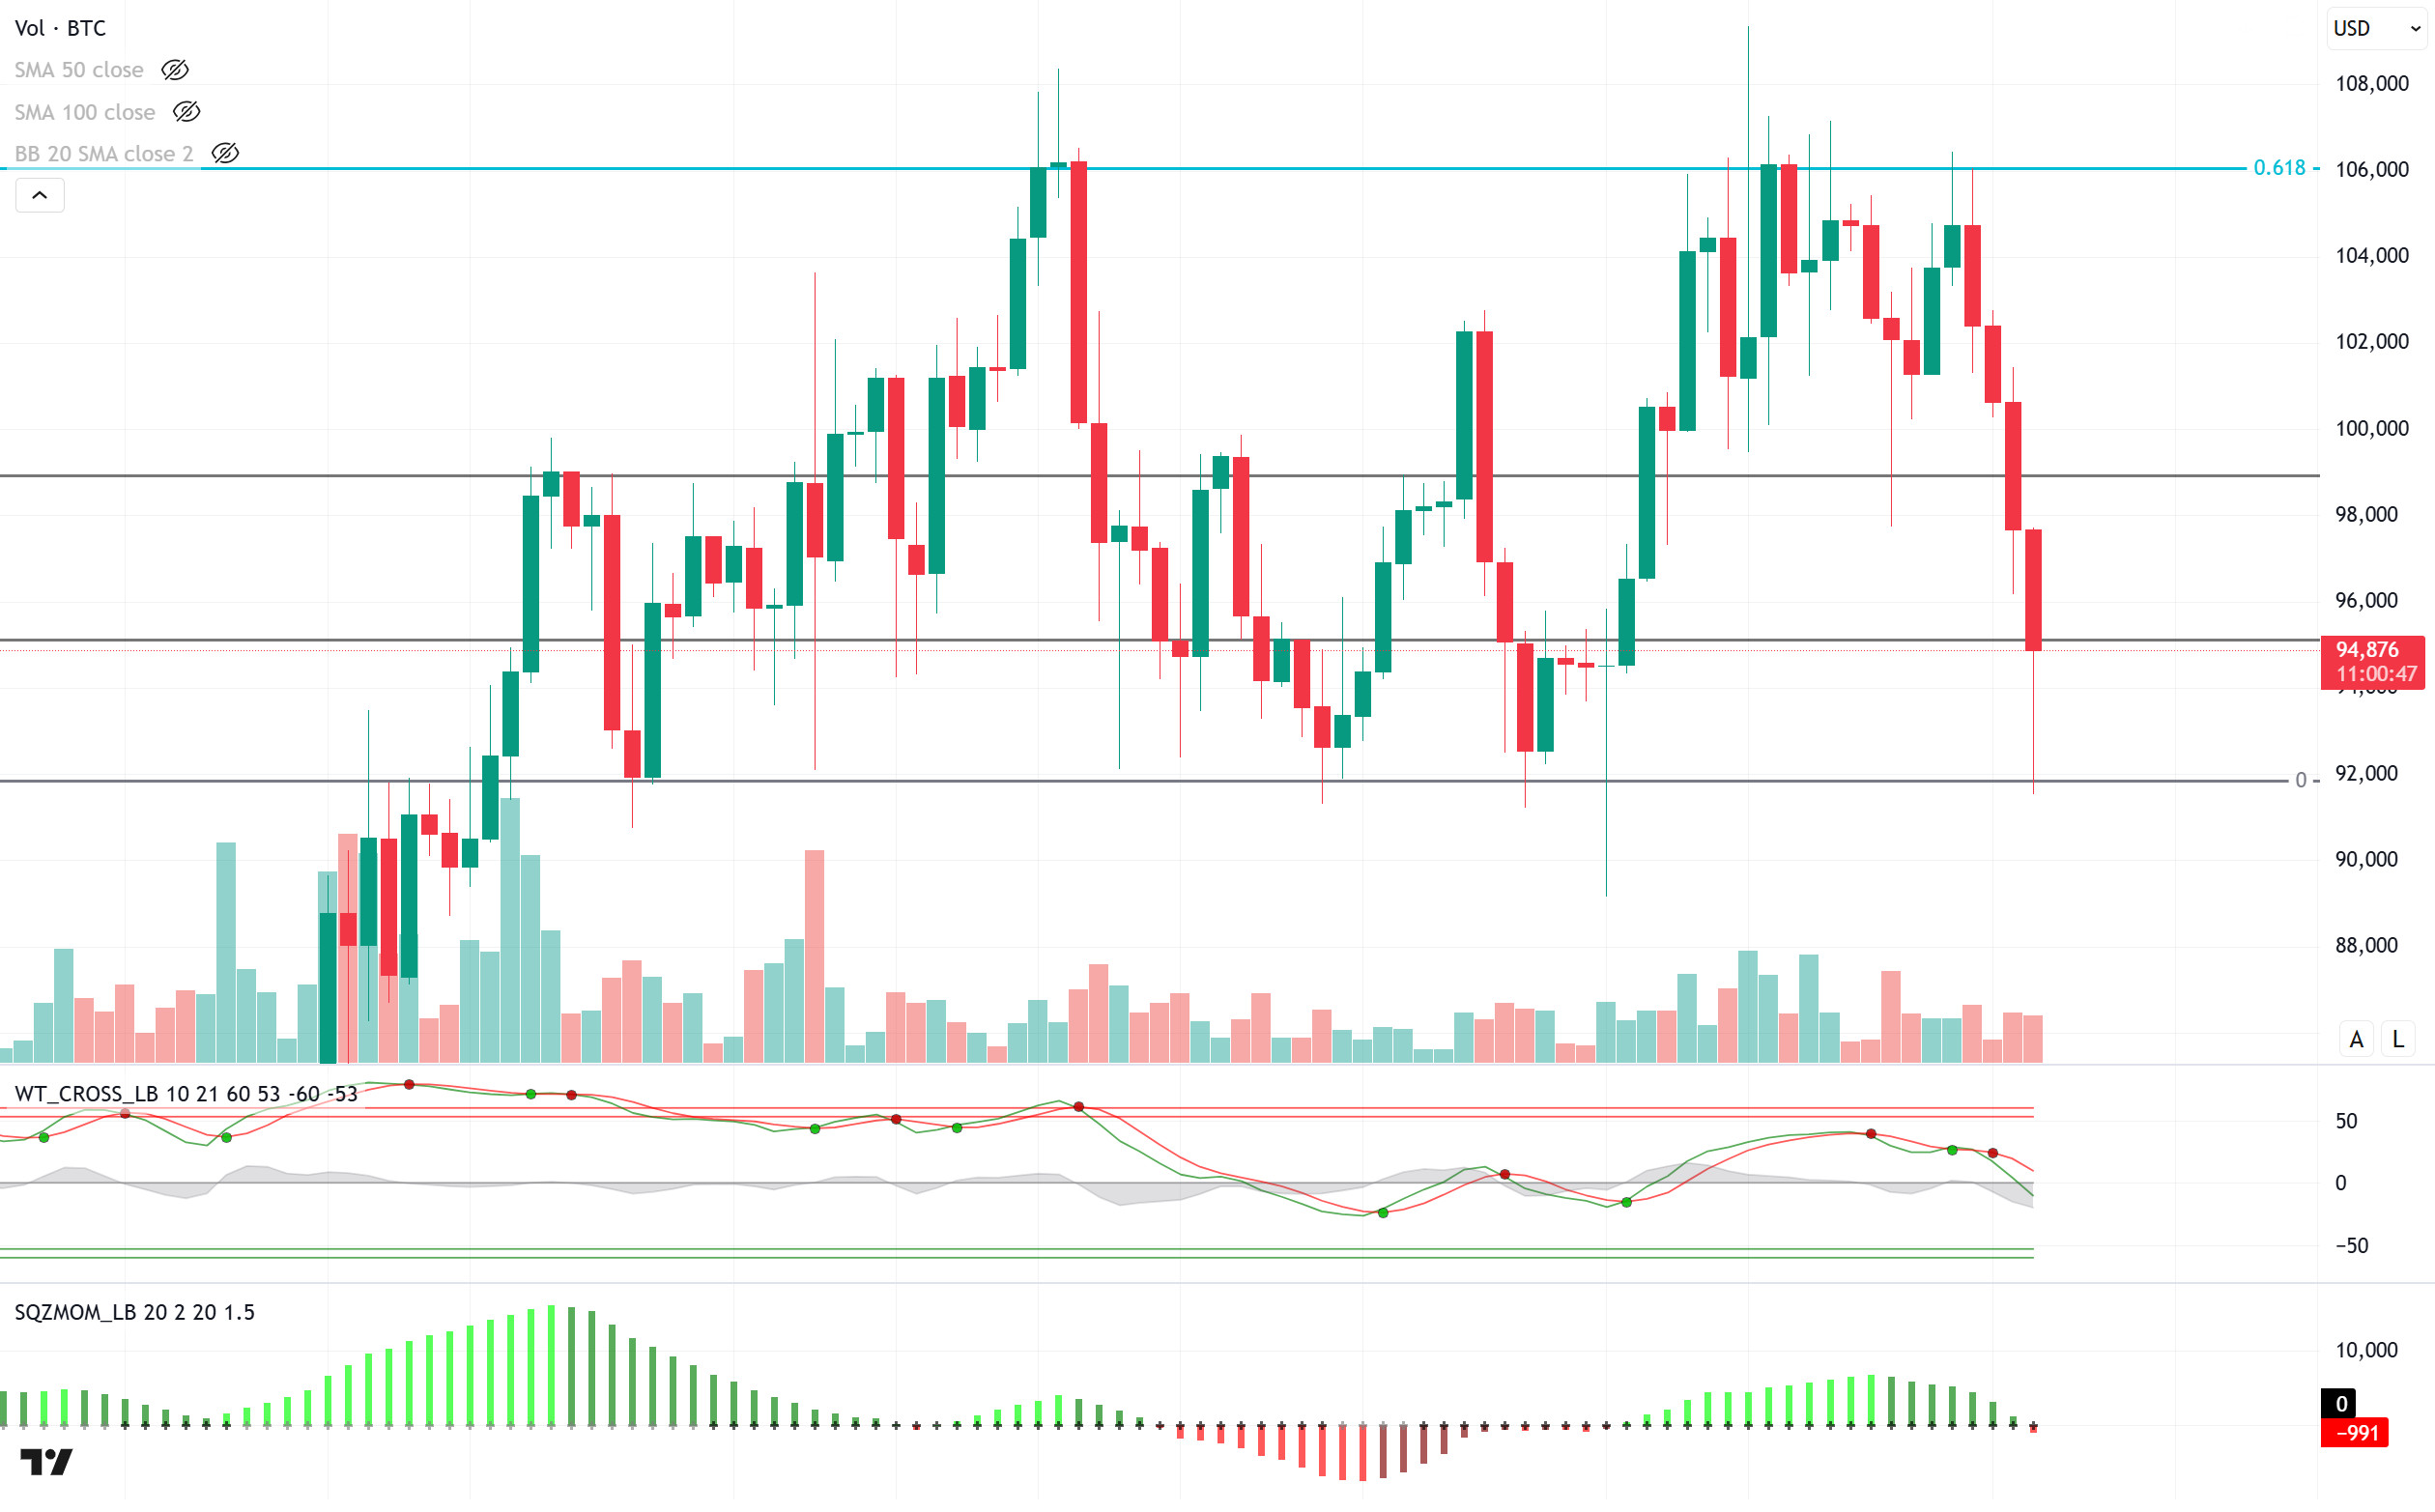
When we look at the technical outlook from a daily perspective, BTC, which lost 7.26% el a weekly basis, seems to be en an effort to recover. BTC, which started last week around 105,000, fell as low as 91,200 and is currently trading at 94,650, just below the 95,000-resistance level. When we look at the technical oscillators, it is seen that after moving en the overbought zone for a long time el the daily chart, it has turned its direction down por maintaining the sales signal. While the momentum indicator has been en the positive zone since mid-January, it seems to have moved into the negative zone as of today. While persistence above the 95,000-resistance level plays an important role en bullish movements, closures below this level may once again increase selling pressure and the 91,800 level may come back el the agenda.
Supports 91,800 – 90,000 – 88,000
Resistances 95,000 – 98,800 – 101,200
ETH/USDT
In recent days, the impact of global economic developments el the markets has become quite evident. Following US President Donald Trump’s announcement of new tariffs el Mexico, Canada and China en his speech last week, traditional financial markets witnessed a sharp sell-off. Deep declines en the Nasdaq and Russell 2000 indices led to a drop en investor confidence and outflows from risky assets. This process also negatively affected the cryptocurrency market, leading to sharp pullbacks en many altcoins, especially Ethereum. ETH took a needle down to the $2,120 level during this sharp bearish wave and is currently priced above the $2,500 level. However, a detailed analysis of the price action shows that the market is yet to signal a clear recovery.
The Bitcoin Dominance (BTC.D) metric, which shows Bitcoin’s weight el the market, rose above 61%, producing a negative signal for the altcoin market. Historically, rises en BTC dominance are often associated with weakness en the altcoin market. In particular, en scenarios where Ethereum loses value against Bitcoin, the overall altcoin market has also seen increased pressure. If dominance remains at these levels, there is a risk of further weakness en Ethereum and other altcoins. Several important metrics stand out when analyzing Ethereum’s current price movements. Looking at the Cumulative Volume Delta (CVD) data, it is observed that spot selling pressure continues at high levels. The fact that spot sales are so strong shows that investors are risk averse. Relative Strength Index (RSI) fell to its lowest level since August and entered the oversold zone. However, no strong reaction buying has been observed yet, so there is no clear signal of a turnaround. Historically, RSI’s prolonged stay en oversold territory indicates weak buying pressure. Therefore, a strong volume inflow is needed for prices to rebound. The Chaikin Money Flow (CMF) metric is pointing to liquidity inflows with a slight rebound after falling into negative territory. However, this reaction was not strong enough, maintaining the overall fragility en the market. A move into positive territory would provide a more reliable signal that an upside move could be sustainable. Looking at the kumo cloud of the Ichimoku indicator, it appears that the cloud continues to thin out, supporting the bearish trend. The thinning of the kumo cloud usually indicates that the price is en an uncertain zone and there is not enough momentum for a strong trend reversal. The points where Kumo converges with support levels should be monitored for potential bottom formations.
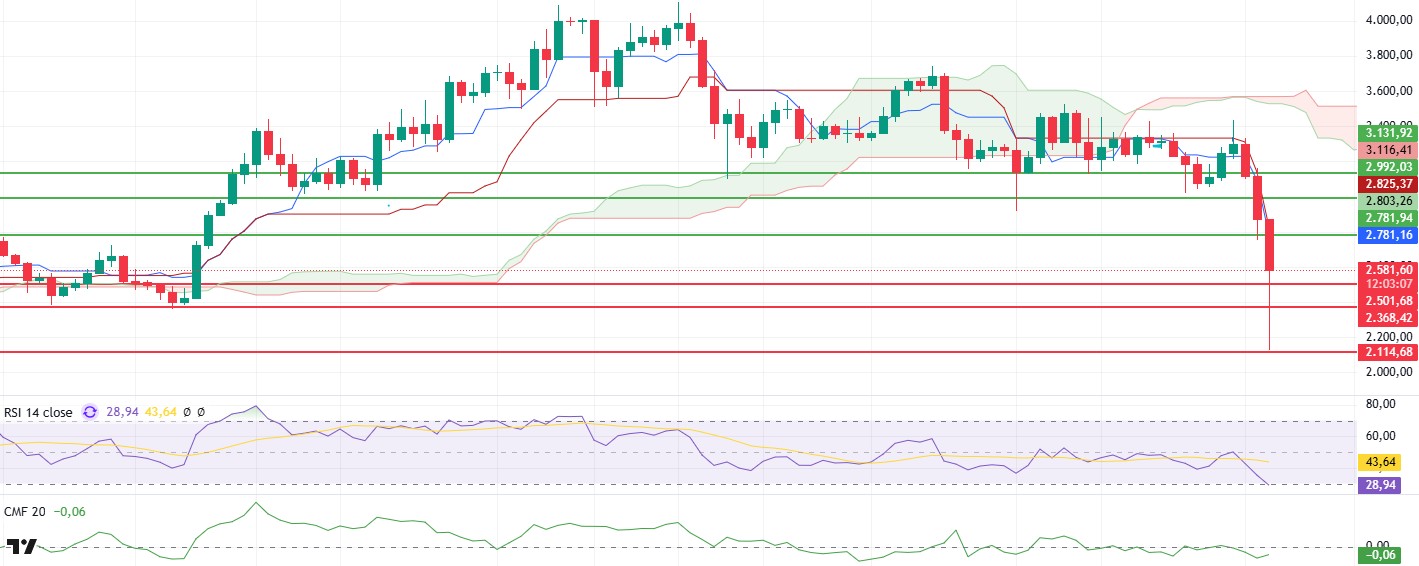
When we analyze Ethereum’s price action, there are important levels to follow. Exceeding the $2,781 level could change the market perception positively and keep the declines as a correction. Pricing above this level could create a positive momentum for Ethereum. Looking at the support levels, $2,500 is the critical area where the price is currently holding and a loss of this level could accelerate the declines. Further down, the $2,115 level is the previous bottom and is likely to be retested en the event of a downside breakout. Going forward, Ethereum’s pricing and market dynamics will continue to be shaped por both global macro developments and Bitcoin’s price action.
Supports 2,501 – 2,368 – 2,114
Resistances 2,781 – 2,992 – 3,131
XRP/USDT
Following US President Donald Trump’s speech last week announcing new tariffs el Mexico, Canada and China, global markets have experienced serious selling waves. These negative developments en traditional markets also deeply affected the cryptocurrency market, causing sharp pullbacks. XRP was also affected por this selling pressure and fell as low as $1.79. However, from this point el, it quickly recovered por receiving a strong buying response and managed to rise above the $ 2.30 level again. This rise shows that buyer interest en the market is still strong and XRP has found support at certain critical levels.
Analyzing the technical indicators, XRP’s price action continues to maintain the important levels of the Ichimoku cloud. As long as the price does not violate the Kumo cloud, the trend will remain positive en the medium term. In particular, Tenkan-Sen and Kijun-Sen levels are not diverging from each other, indicating that the market has not yet entered a sharp downtrend and continues to maintain stability. However, other important technical indicators should also be analyzed to assess the overall market situation. The Chaikin Money Flow (CMF) indicator remains strong en positive territory, indicating that liquidity has not retreated and investor interest continues. This suggests that current price levels are being maintained por buyers and that there is no major outflow of funds into XRP. The fact that CMF is en positive territory can be considered as a positive signal that the market is not under deepening selling pressure and that there are strong buying zones at certain levels. On the other hand, the Relative Strength Index (RSI) indicator is still showing a weak outlook. The RSI is heading towards the oversold area, indicating that the selling pressure has not yet fully subsided. Moreover, the fact that the RSI has not produced a strong reversal signal so far suggests that the current rebound is yet to be fully confirmed. Therefore, for XRP to return to the uptrend, a rebound signal el the RSI and a move to higher levels are required.
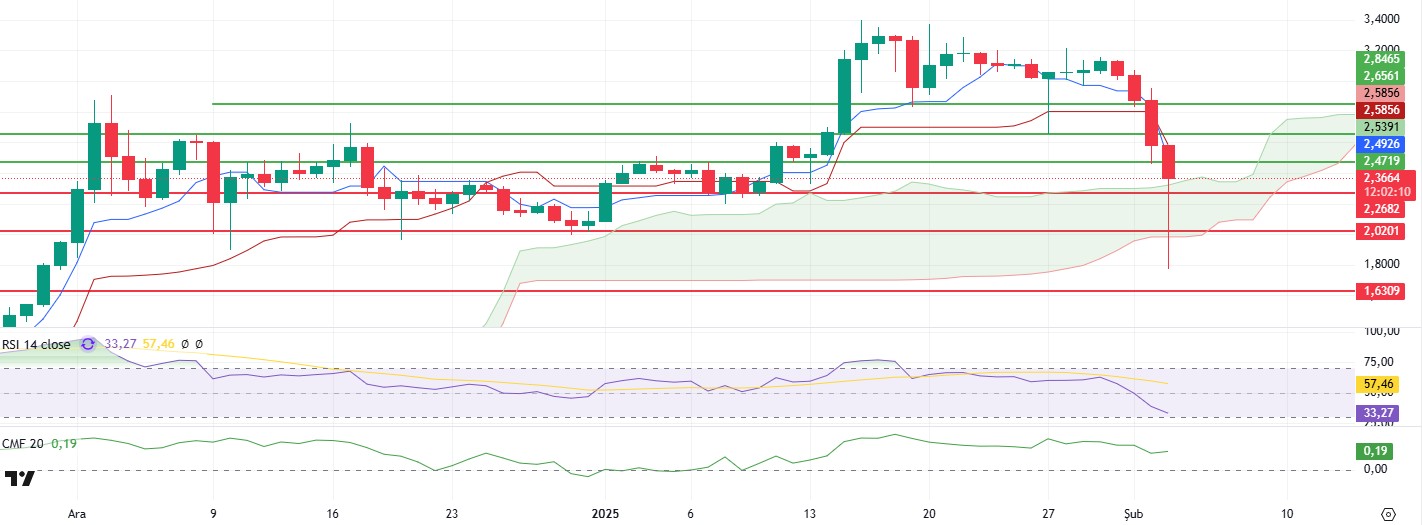
Considering XRP’s price levels, the $2.02 region is critical as Ichimoku cloud support. Maintaining this level is necessary for the short-term recovery to continue en the market. In case the $2.47 level is broken to the upside, a new uptrend for XRP can be expected to start and the price may move towards the $2.75 level. However, A close below the $2.02 level could increase selling pressure el XRP, leading to deeper declines and causing the price to retreat to the $1.85 level.
Supports 2.2682 – 2.0201 – 1.6309
Resistances 2.4719 – 2.5391 – 2.6561
SOL/USDT
Last week, Solana’s market capitalization surged por $28 billion en 30 days el Trump’s crypto initiatives. But network congestion and 10x transaction fees revealed scalability issues. SVM blockchains were introduced to improve scalability and interoperability. ETF filings remained el the agenda this week. The Cboe BZX Exchange moved again for a spot Solana ETF en the US after resubmitting 19b-4 applications el behalf of Bitwise, VanEck, 21Shares and Canary Capital. Tuttle Capital has proposed 10 crypto ETFs, including a leveraged Solana product. Coinbase derivatives filed to launch Solana futures with the US CFTC. The crypto exchange aims to launch $25,000 SOL derivatives as the token’s volatility increases. Announced a strategic investment with Mcqueen Labs Inc. for real-world asset tokenization el the Solana blockchain. Solana-Based Social-Fi Protocol Tribe.Run Launches FriendTech-inspired social-fi protocol allows users to buy and sell access to token-gated chats el Solana. Blackrock-backed Securitize partnered with Wormhole to bring $1.3 Billion en loan funding to Solana. Pump.fun, el the other hand, has filed a class action lawsuit alleging unregistered securities sales. According to court documents, the Solana-based meme coin platform allegedly operated an unauthorized securities exchange. As for Onchainde, according to Defillama’s data, Solana’s blockchain has issued $11 billion worth of stablecoins, led por major players such as USDC and USDT. According to Spot On Chain, stablecoin issuer Circle minted another 250 million USDC el Solana just horas hace. This brings the total USDC minted el Solana en 2025 to $6 billion, including $1.25 billion USDC en the past week alone, indicating a massive inflow of funds into the crypto market. However, Solana has captured 50% of the decentralized exchange (DEX) market share thanks to its retail trading activity and low transaction costs. Since its launch, Pump.fun has processed a total of $4.16 billion en transactions and minted 6.7 million tokens. The platform also accumulated 2.5 million SOL fees and unique addresses reached 11.6 million. On the other hand, Solana will launch approximately $450 million worth of coins en a linear unlock en February at the price at the time of writing.
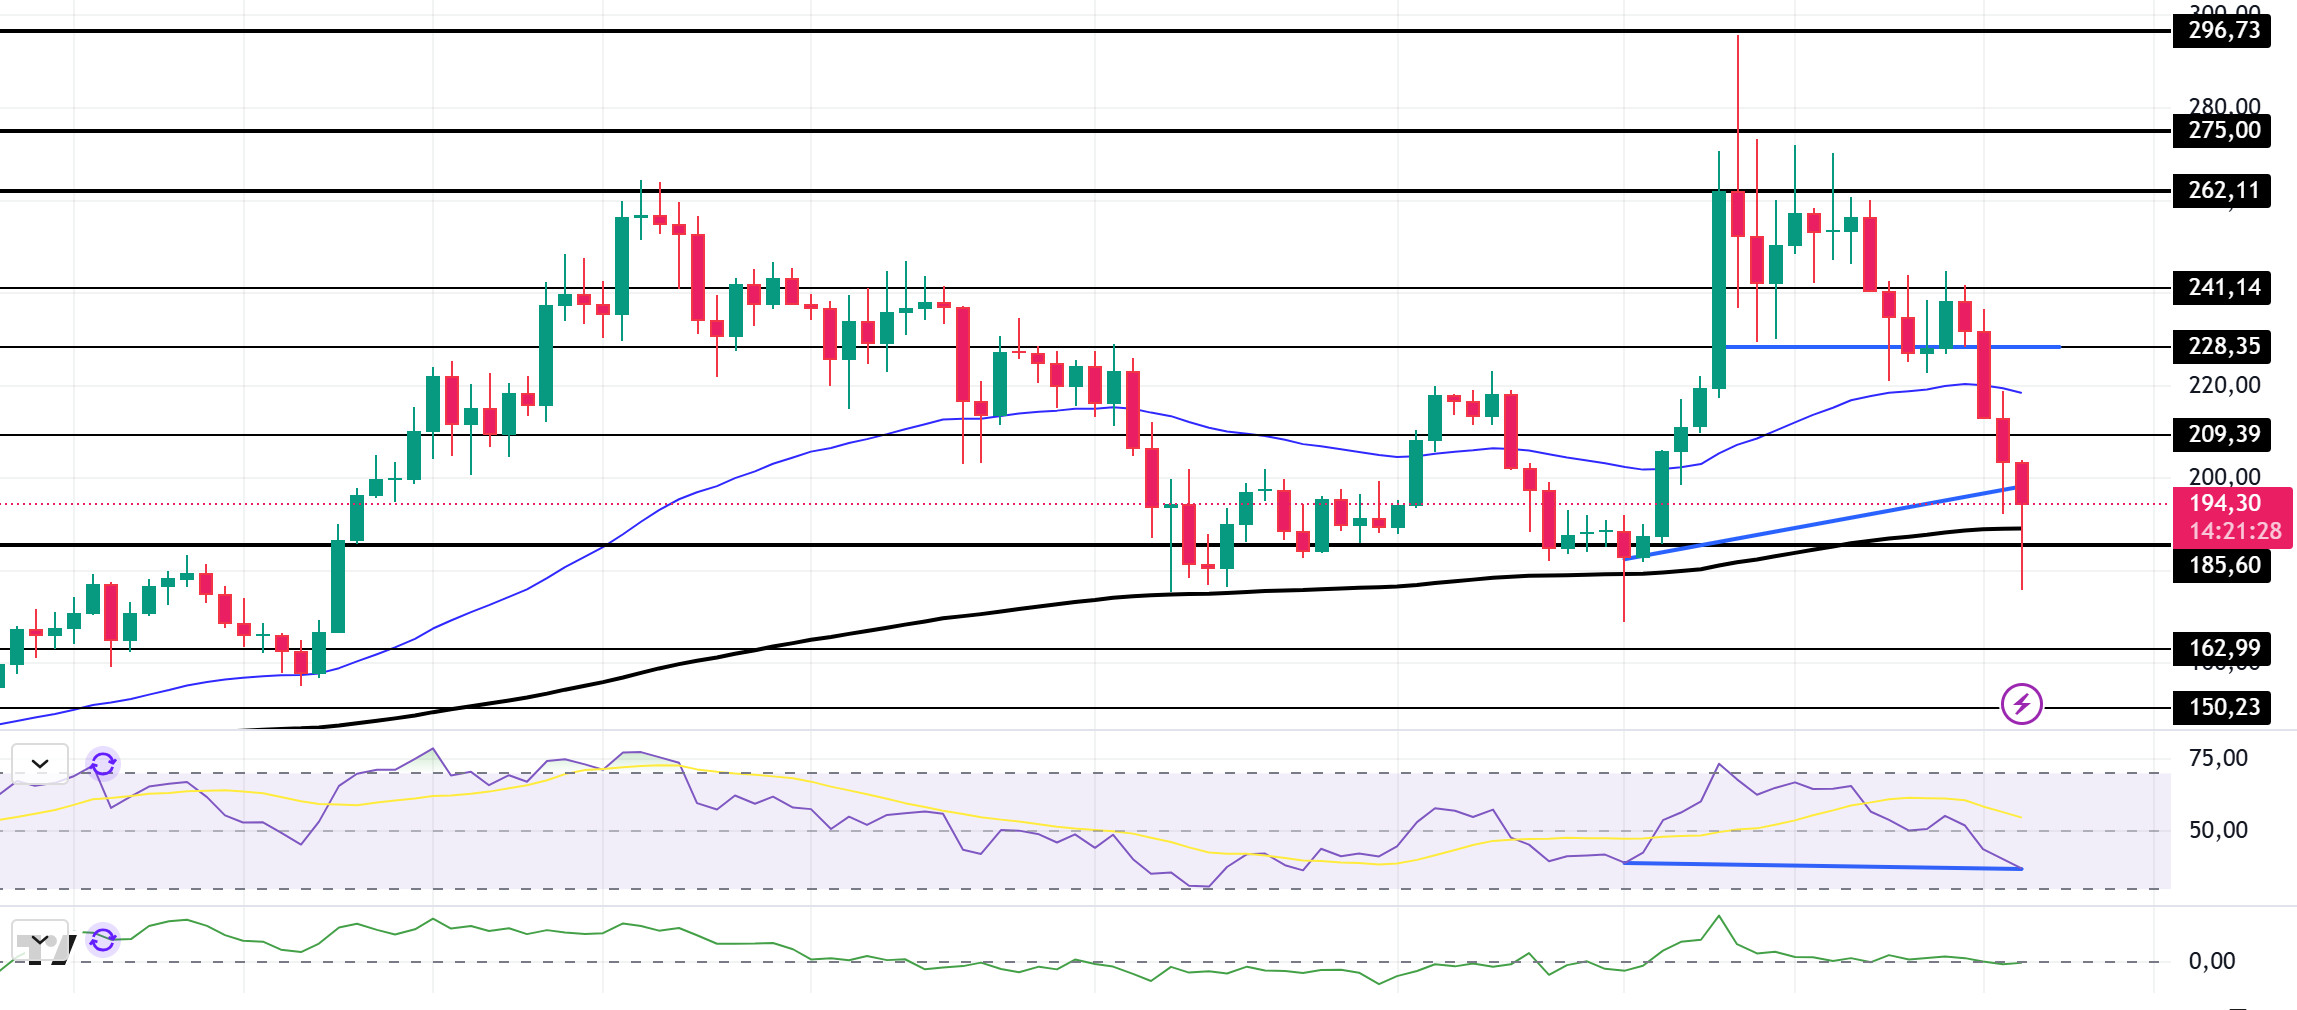
SOL, which has been fluctuating since the beginning of last week, moved horizontally at the beginning of the week. However, it fell sharply over the weekend, losing about 15% of its value. The asset tested the 241.14 level 3 times but failed to break it and started to decline. The price is located between the 50 EMA (Blue Line) and the 200 EMA. As a matter of fact, the asset took support from the 200 EMA and moved slightly higher. On our daily chart, the 50 EMA (Blue Line) continues to be above the 200 EMA (Black Line). This suggests that the trend is bullish en the medium term, but the difference between the two averages is about 15%, which could continue the pullback. The Relative Strength Index (RSI) is at the mid-level of the 14 negative zone. At the same time, there is an upside divergence en the RSI (14). However, when we examine the Chaikin Money Flow (CMF)20 indicator, it is en the neutral zone and money inflows and outflows are balanced. If the positive results en macroeconomic data and positive developments en the ecosystem continue, it may test the first major resistance level of 241.14. In case of negative macroeconomic data or negative news en the Solana ecosystem, the 162.99 level can be followed and a buying point can be determined.
Supports 185.60 – 162.99 – 150.23
Resistances 209.39 – 228.35 – 241.14
DOGE/USDT
Last week, Bloomberg reported that the Department of Government Efficiency, or DOGE, is discussing the use of a public blockchain en its cost-cutting efforts. Elon Musk invited Dogecoin founder Shibetoshi Nakamoto to join DOGE (Department of Government Efficiency), creating optimism among the bullish dynamics reflected por the DOGE price. Bitwise has applied to the US Securities and Exchange Commission to list Dogecoin as an ETF. After Bitwise also filed an ETF application for Dogecoin, the odds of the spot Dogecoin exchange-traded fund being approved this year increased to 56% el the popular betting site Polymarket. Elon Musk, el the other hand, is taking new steps to make his X platform far-reaching. The social media giant is now a digital payment partner with Visa . There is speculation that future updates will include crypto and DOGE. On the onchain, Dogecoin Open Interest data fell to $2.41 billion. However, it revealed that whales have accumulated 560 million Dogecoins.
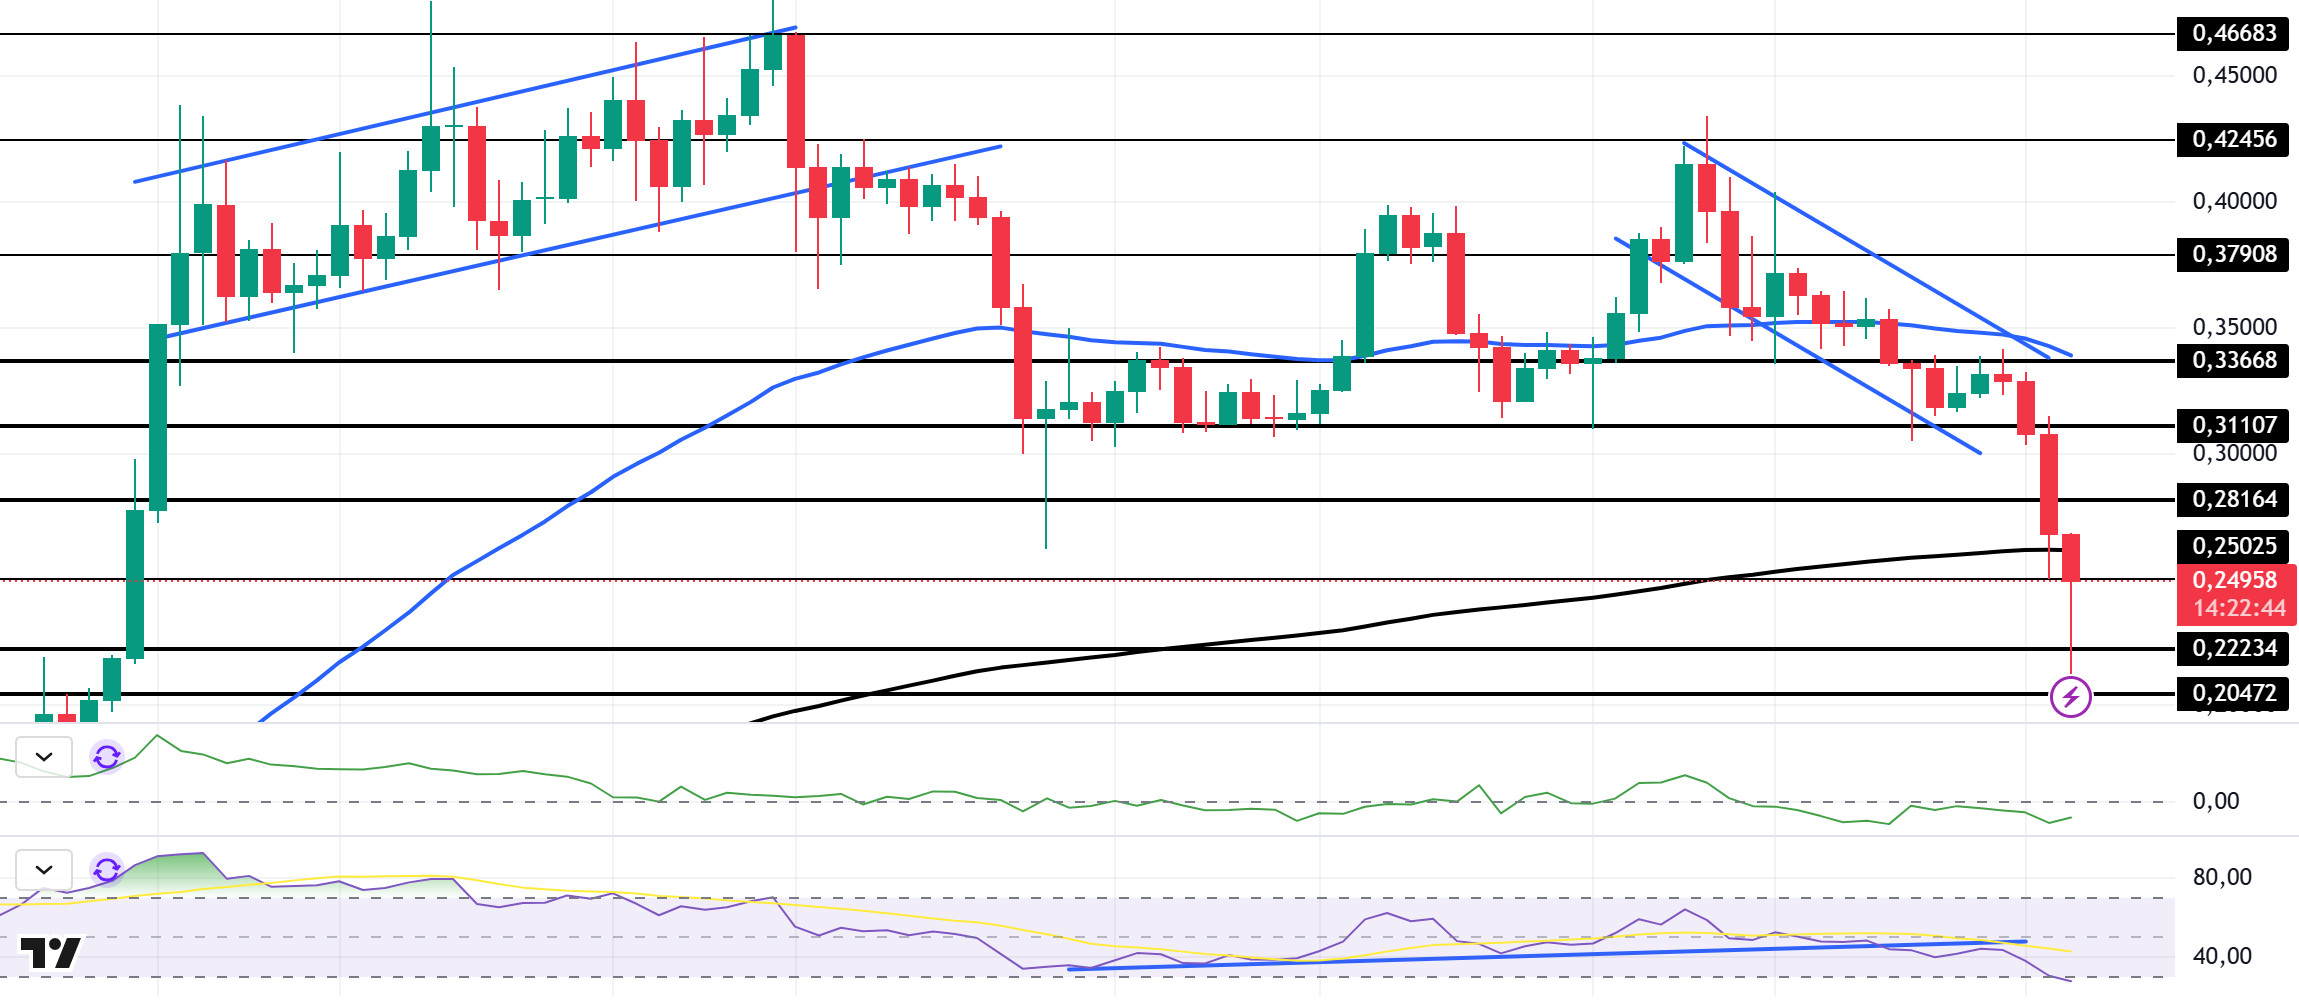
Looking at the daily chart, the asset, which has been en a downtrend since January 17, fell last week, breaking the strong support at 0.33668. The asset, which is currently retreating, is supported por the 200 EMA (Black Line). The 50 EMA (Blue Line) remains above the 200 EMA (Black Line), indicating that the asset remains bullish, but the difference between the two averages is about 30%, which may increase the probability of a further decline. If this bearish momentum continues, the asset could test 0.20472 once again. When we look at the Chaikin Money Flow (CMF)20 indicator, it is en the negative zone, close to the neutral zone. But money outflows have decreased. Relative Strength Index (RSI)14, el the other hand, found value en the oversold zone. At the same time, the rising trend el the RSI chart broke down and broke the trend downwards. It rose slightly from here and tested the base of the rising trend as resistance. Unable to break here, DOGE deepened its decline. In case of possible macroeconomic conditions and negative developments en the ecosystem and pullbacks, 0.20472 can be followed as a strong support. In case the retracement ends and the rises begin, 0.33668 should be followed as a strong resistance.
Supports: 0.25025 – 0.22234 – 0.20472
Resistances: 0.28164 – 0.31107 – 0.33668
TRX/USDT
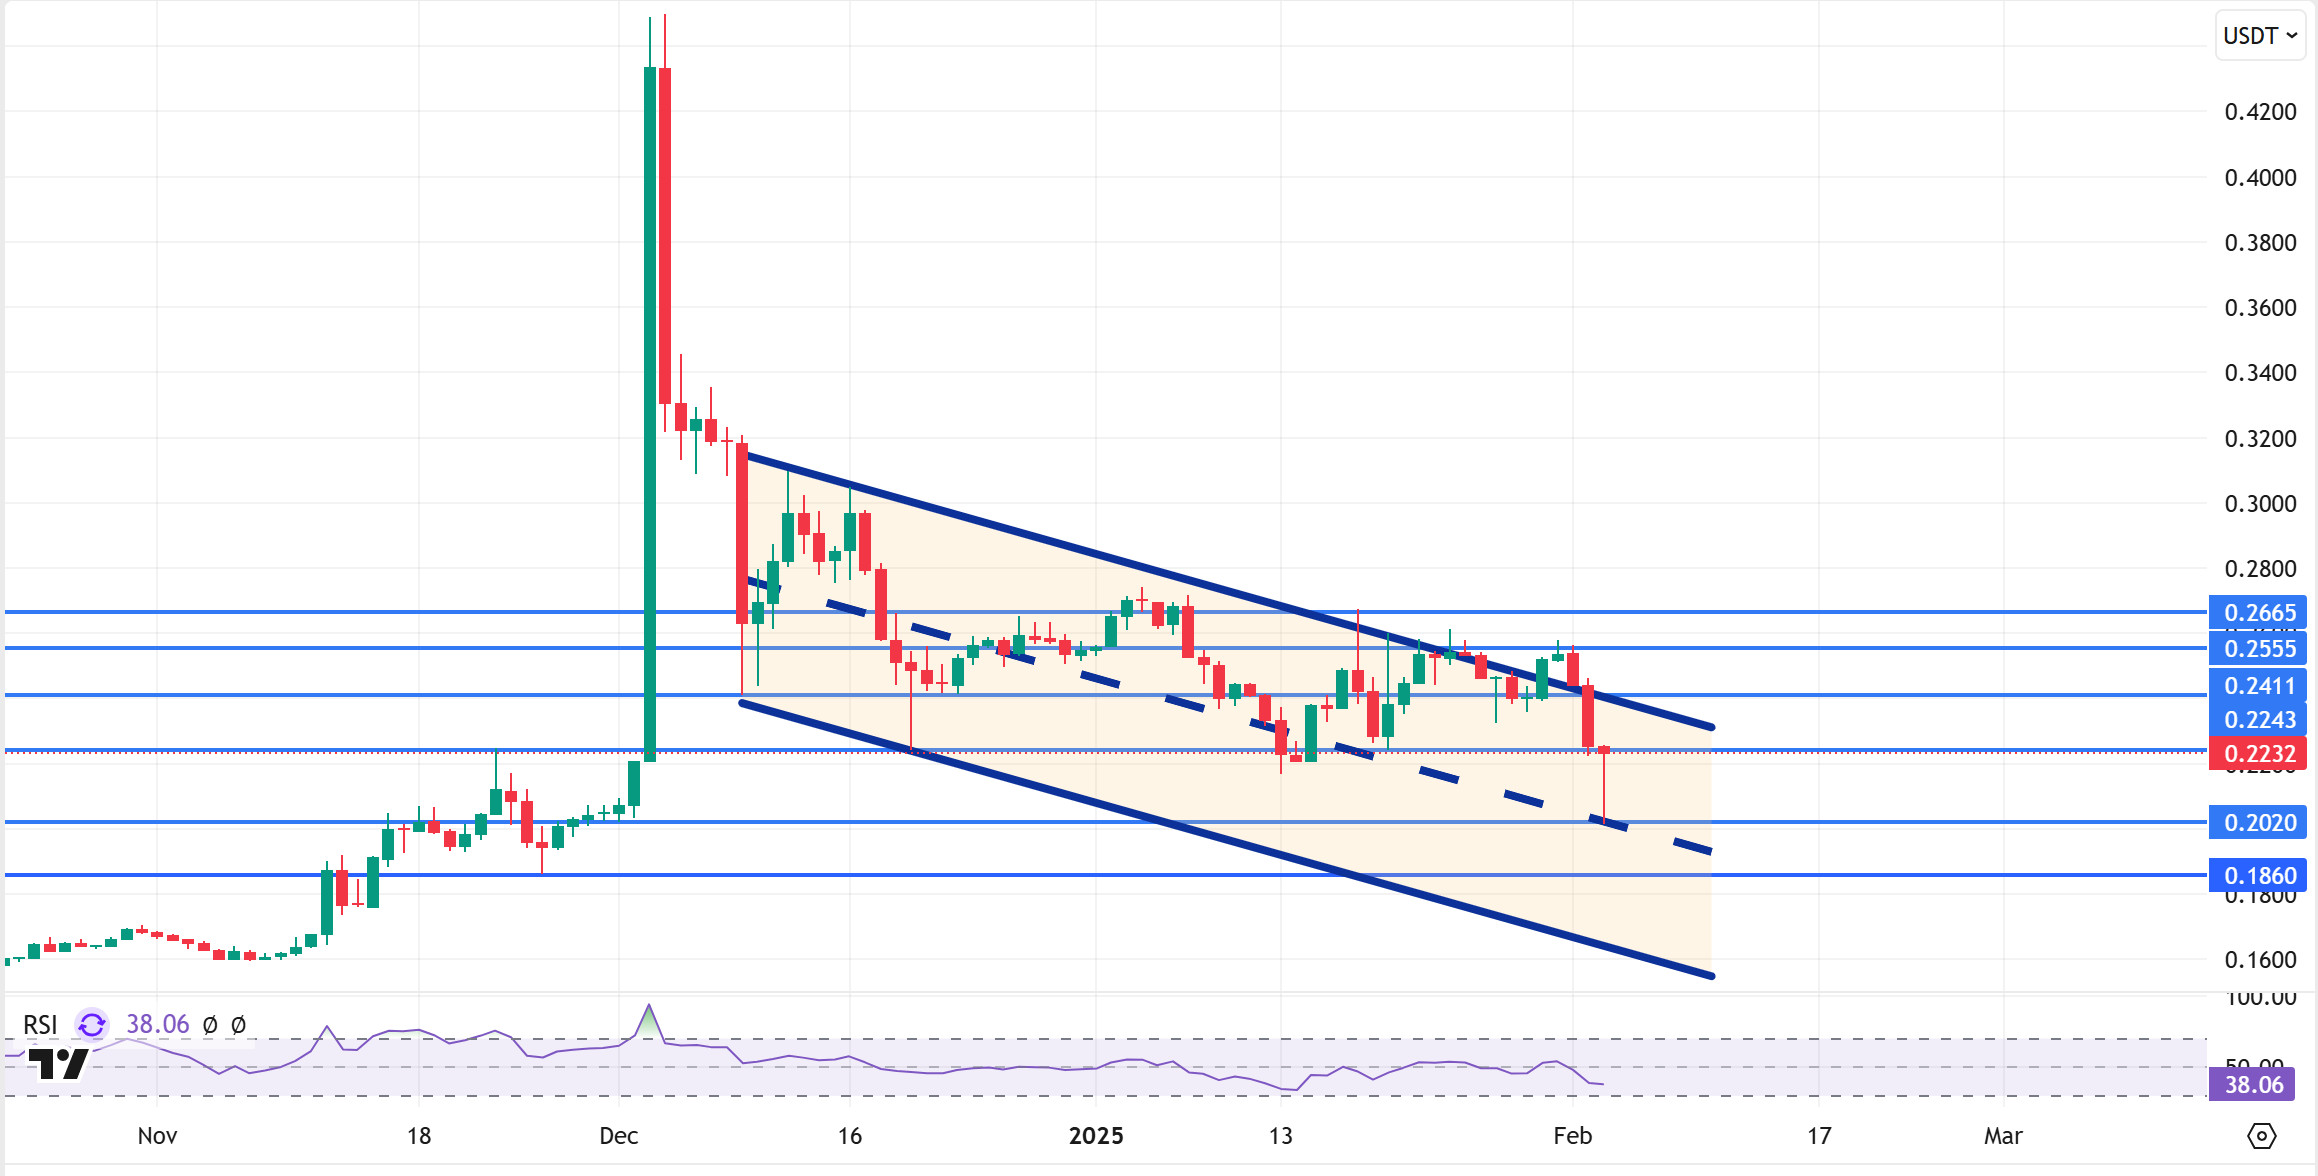
TRX, which started last week at 0.2462, closed the week at 0.2255, falling especially after Trump signed the decision to impose tariffs el Canada, Mexico and China. This week en the US, manufacturing purchasing managers index, ISM manufacturing purchasing managers index, job openings and turnover rate (JOLTS), Services purchasing managers, ADP non-farm payrolls, ISM non-manufacturing purchasing managers index, unemployment claims, unemployment rate and non-farm payrolls data will be released. Especially the non-farm payrolls data will be closely monitored por the market. If these data are announced en line with expectations, they may be perceived positively por the market. In addition to these, Trump’s statements about Bitcoin or cryptocurrencies and possible steps he will take may be welcomed positively en the market and create a buying appetite.
TRX, currently trading at 0.2232, is en the upper band of the bearish channel el the daily chart. With a Relative Strength Index value of 38, it can be expected to break the bearish channel upwards por rising slightly from its current level. In such a case, it may test the 0.2411 and 0.2555 resistances. If it cannot close daily above the 0.2411 resistance, it may decline with the selling pressure that may come and move to the channel middle band. In such a case, it may test 0.2020 support. As long as it stays above 0.1860 support el the daily chart, the bullish demand may continue. If this support is broken, selling pressure may increase.
Supports 0.2243 – 0.2020 – 0.1860
Resistances: 0.2411- 0.2555 – 0.2665
AVAX/USDT
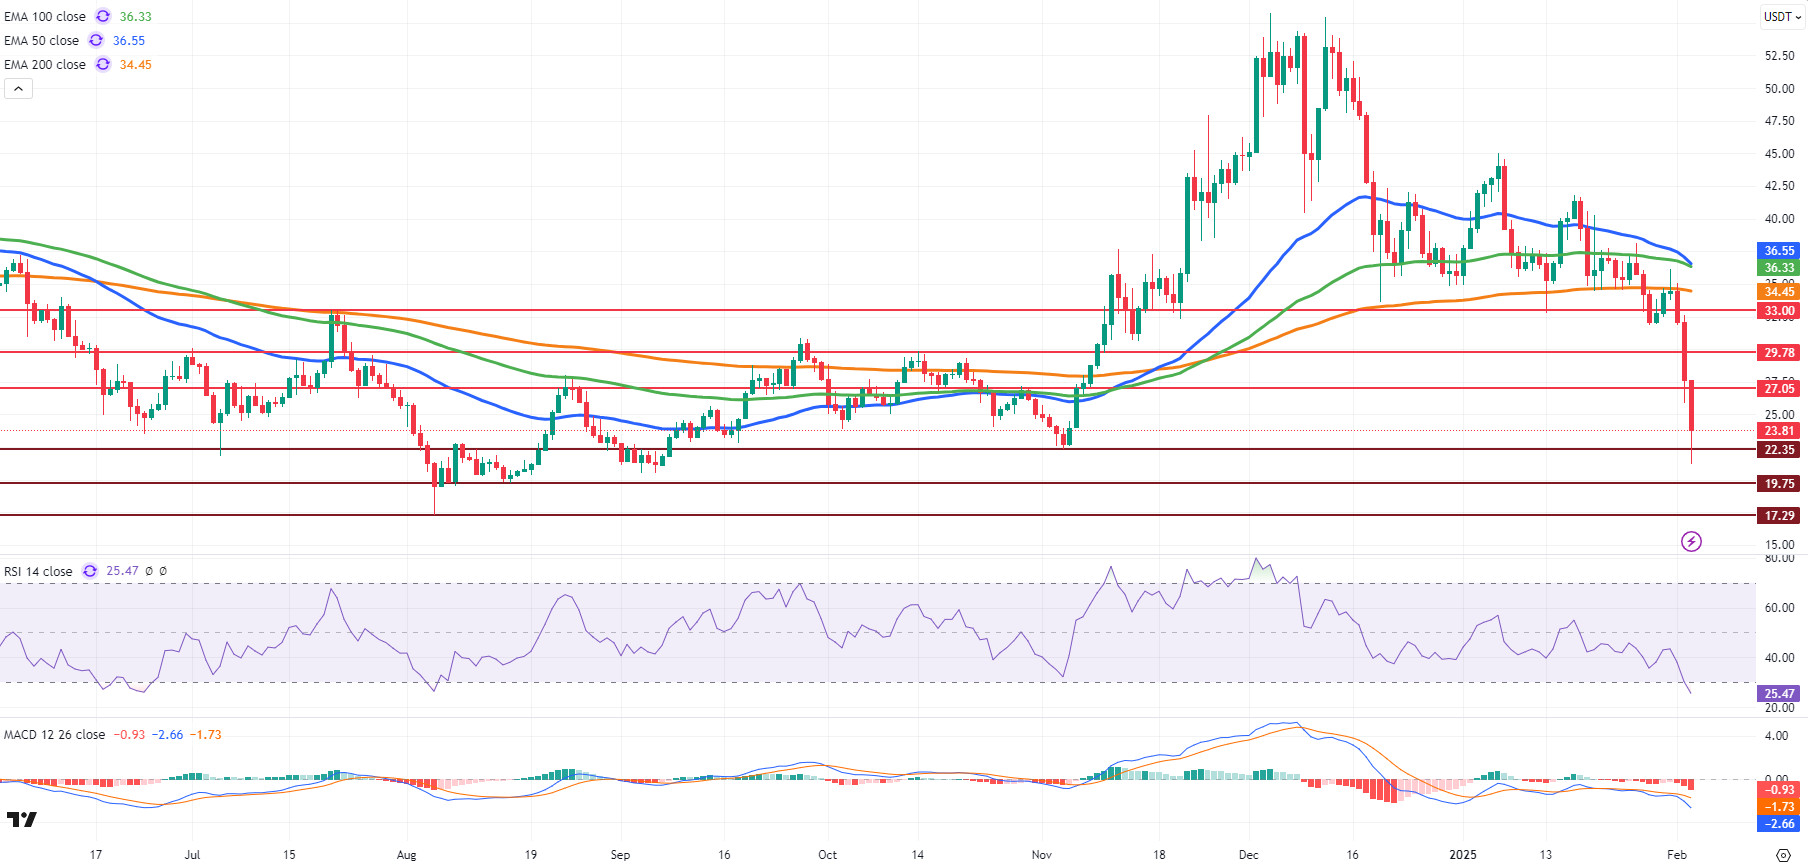
While AVAX was traded at 35.72 at the opening of last week, it fell to 25.80 with selling pressure throughout the week and the weekly close was realized at 27.61. Affected por the ongoing downtrend across the crypto market, the decline en AVAX has deepened, especially en the last three days. New economic decisions taken por the US and US President Donald Trump’s statements that had a negative impact el the market played an important role en this sharp decline. The increasing uncertainty en global markets and the decrease en investors’ risk appetite caused sharp retreats en the crypto market. With the impact of these developments, AVAX started the new week with a decline, falling as low as 21.21 and testing critical support levels.
The Moving Average Convergence/Divergence (MACD) indicator is showing a strong negative momentum, moving en the negative territory and below the signal line. The Relative Strength Index (RSI), el the other hand, has entered oversold territory at 25.47.
If the MACD indicator continues its downward movement and the RSI remains below 30, the selling pressure el AVAX may deepen. In this case, it may test the 22.35 support level. If this support level is broken, a decline towards 19.75 and 17.29 support levels may occur. On the contrary, a rebound en the MACD indicator into the positive zone and an upward crossing of the signal line may cause AVAX to react upwards. In this case, AVAX may make a rise towards the 27.05 resistance level. If this level is broken, the price may continue to rise towards the 29.78 and 33.00 resistance levels. In order for AVAX to create a strong upward movement, it needs to break above the Exponential Moving Average (EMA) levels, namely the EMA50 (36.55), EMA100 (36.33) and EMA200 (34.45). If these levels cannot be exceeded, selling pressure may continue.
(EMA50: Blue Line , EMA100: Green Line , EMA200: Orange Line)
Supports 22.35 – 19.75 – 17.29
Resistances 27.05 – 29.78 – 33.00
SHIB/USDT
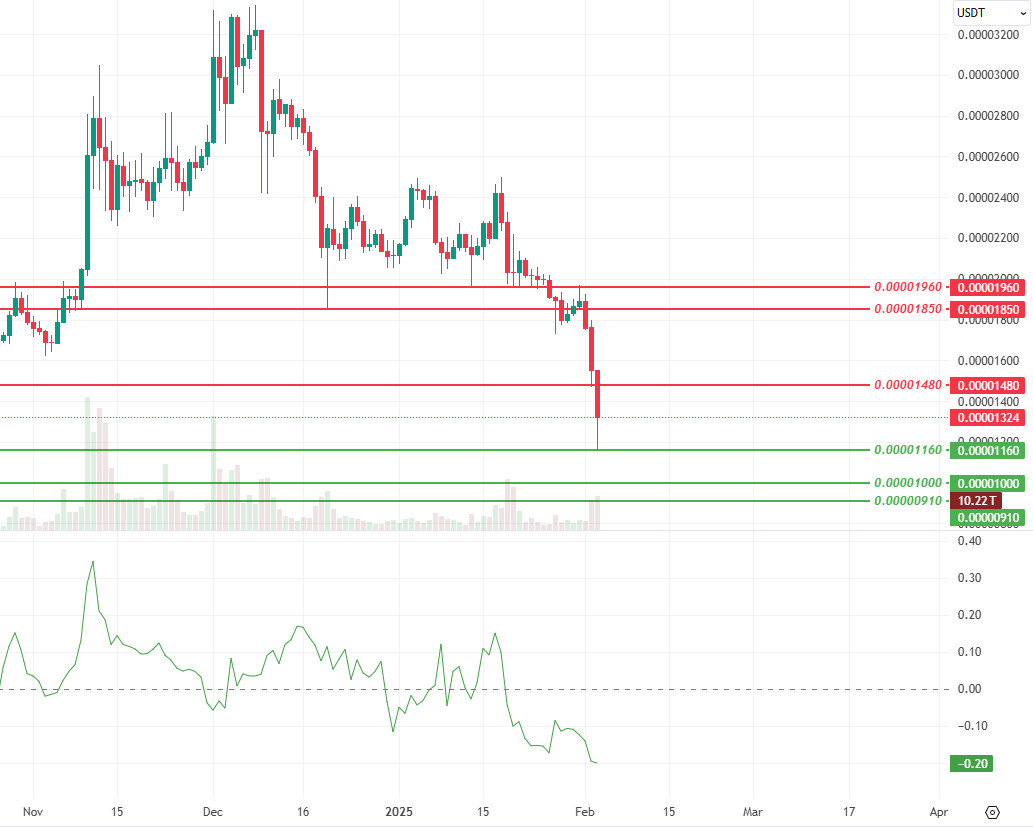
Shiba Inu’s (SHIB) cremation rate has gained significant momentum, increasing 847% en the last 24 horas and 4,930% en the last week, totaling 1.1 billion SHIBs cremated. This surge was accelerated por the Shiba Inu team’s launch of its new cremation platform, ShibTorch V2. However, after Donald Trump’s tariffs el Canada, Mexico and China, the cryptocurrency market sold off sharply along with the currency markets. Trump also announced that new tariffs el the European Union will be implemented soon, which increased uncertainty en the markets and triggered volatility.
Technically, Shiba Inu (SHIB) has been under intense selling pressure en recent weeks due to the decrease en trading volume and loss of momentum. The increase en volatility, especially after Donald Trump’s statements el tariffs, increased uncertainty en the market and caused fluctuations en SHIB price. Facing strong selling pressure at the 0.00001960 resistance level, the price lost 41% en four days. The Chaikin Money Flow (CMF) oscillator shows that the selling pressure is still strong. Accordingly, a retest of the 0.00001160 support level seems likely if the downtrend continues. However, if buyers step en from this level, it may be possible for the price to gain momentum and rebound towards the 0.00001480 resistance level.
Supports 0.00001160 – 0.00001000 – 0.00000910
Resistances 0.00001480 – 0.00001850 – 0.00001960
LTC/USDT
Litecoin (LTC), which lost 6.82% last week, started to move last week with the positive developments en the Canary Litecoin ETF application. However, affected por the general decline en bitcoin and the total market, LTC started the new week at 109.16 and retreated to 80.04. According to Arkham data, open positions increased from $282 million last week to $291 million this week, and funding rates turned negative el all exchanges. It continues to remain en 20th place en the market size ranking.
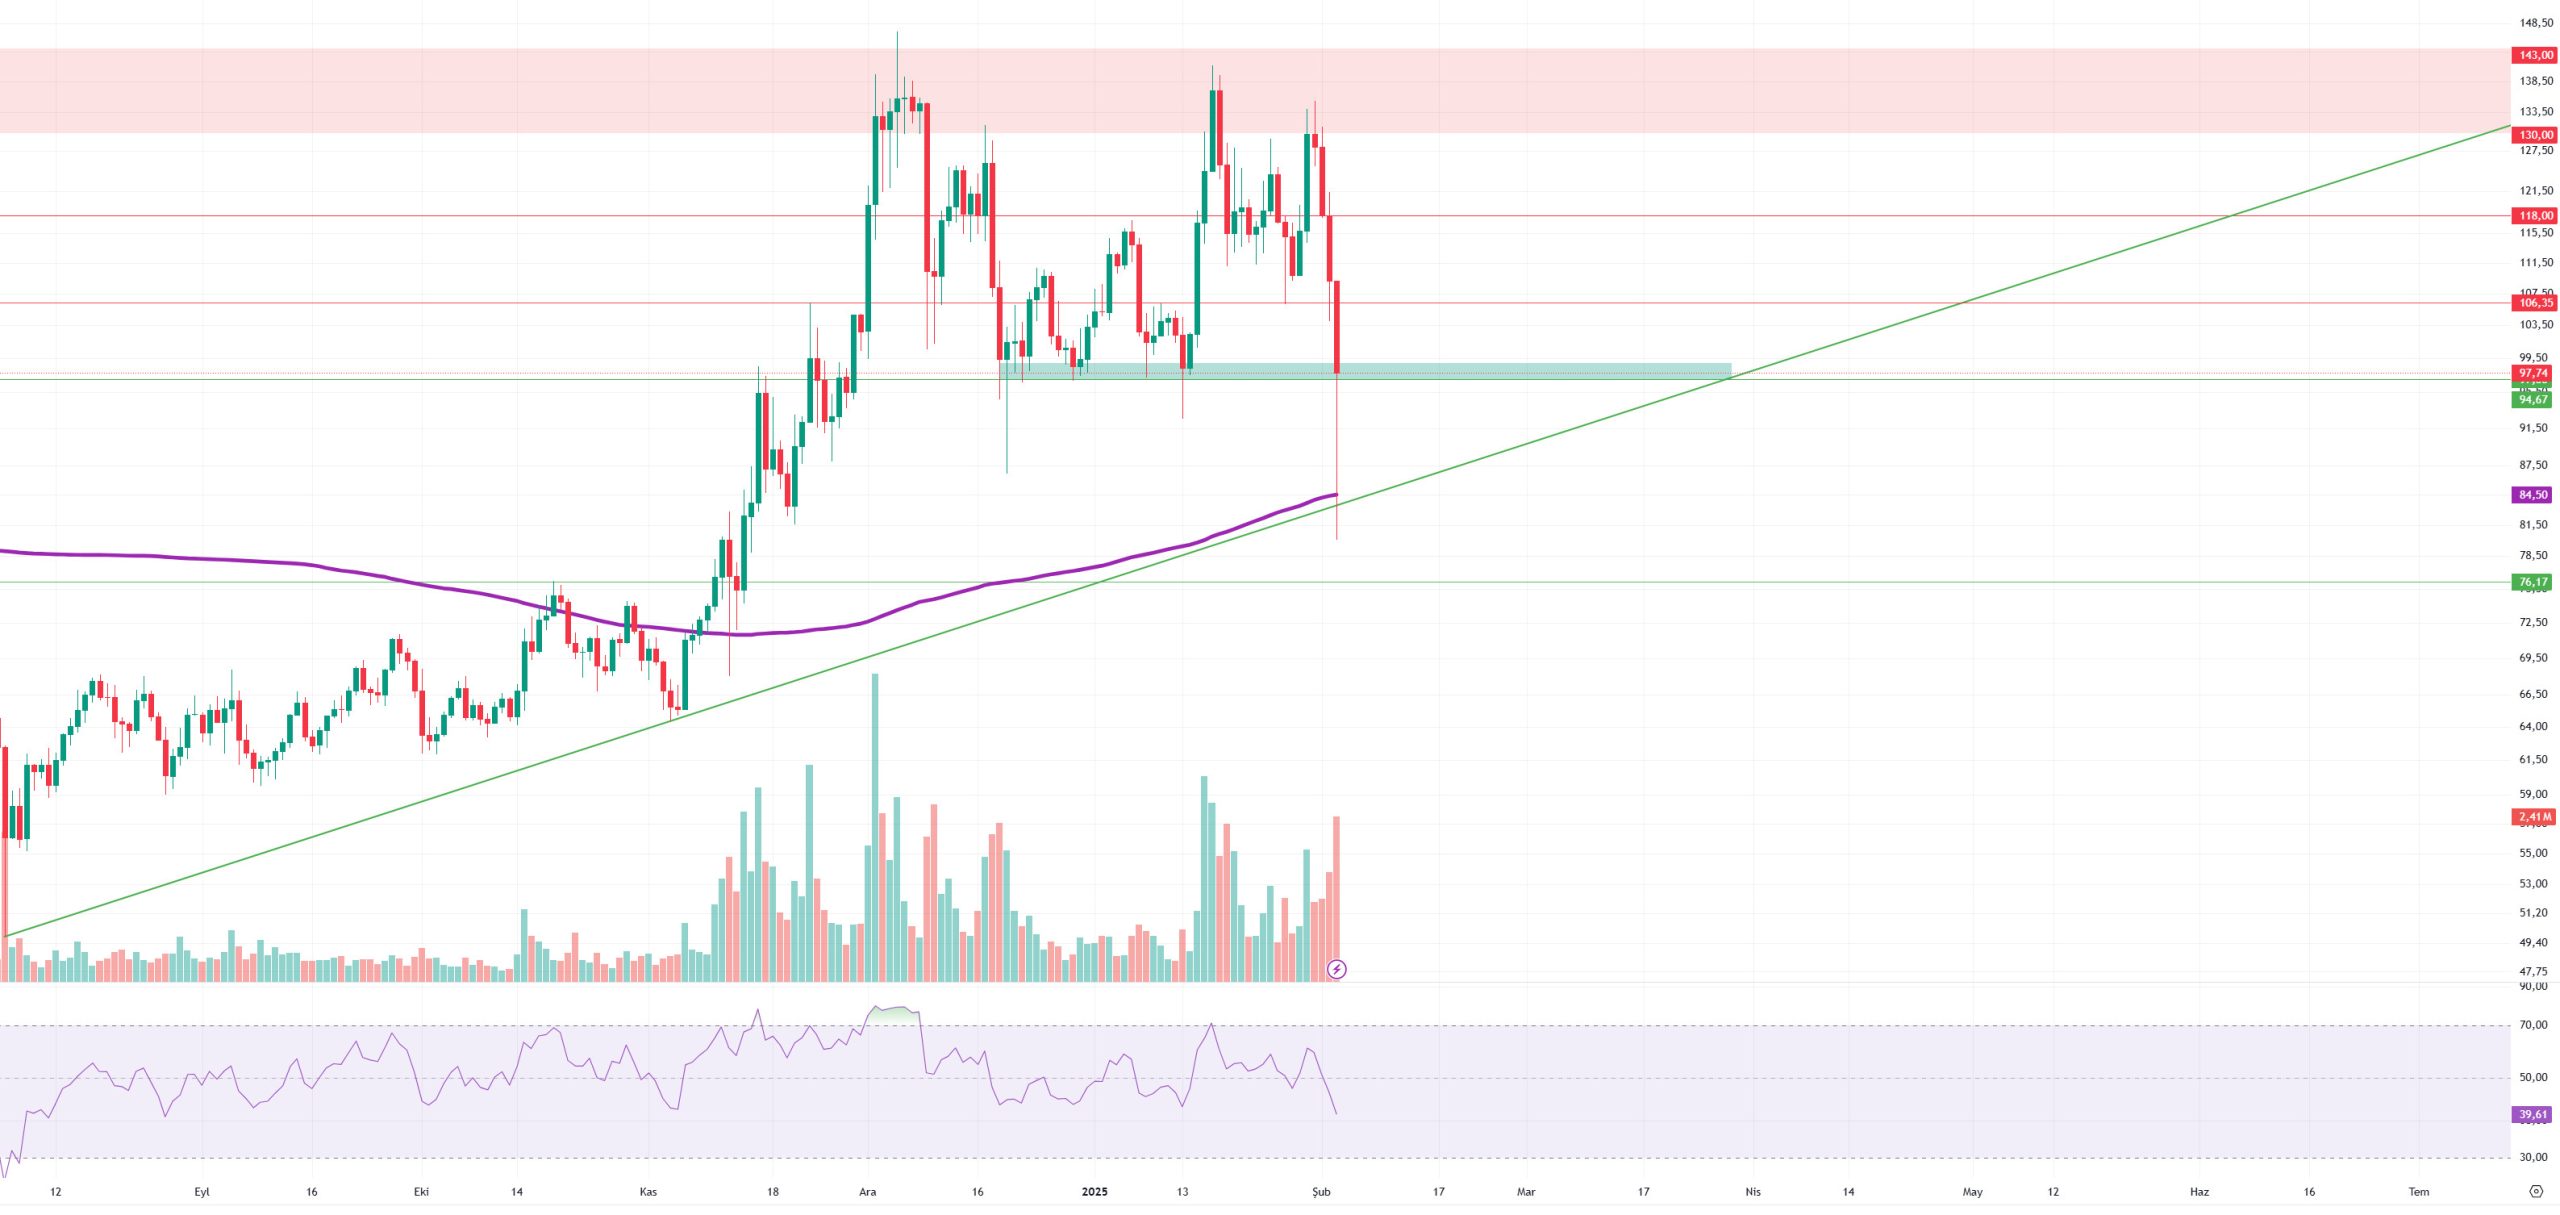
On the daily chart, LTC tested trend support el the recent decline and recovered after dipping 3% below the 200-day moving average (purple line). LTC is currently trying to hold above the support zone at 97.00 and may find buyers en this area. If the decline continues, the 84.50 level, where the 200 daily moving average and trend support are located, stands out as a critical zone. If this region is lost, the price is likely to fall to 76.17 horizontal support. In upward movements, the first resistance level is 106.35 and can be considered as intermediate resistance. If the price exceeds this level, a strong selling pressure is not expected until 118.00 levels. Breaking 118.00 resistance may move the price back to the 130.00-143.00 band, which is the major resistance zone.
Resistances 106.35 – 118.00 – 130.00
Supports:97.00 – 84.50 – 76.17
LINK/USDT
Link was trying to hold el to the $ 22.30 level we mentioned last week. However, we evaluated that the transition of the Relative Strength Index (RSI) indicator into the negative zone could increase the selling pressure and lead to a deepening en the price movement. On the macroeconomic side, Trump’s harsh stance el trade policies increased anxiety en the markets and strengthened selling pressure. As a result of these developments, the overall market experienced a strong wave of selling and the uncertainty continues.
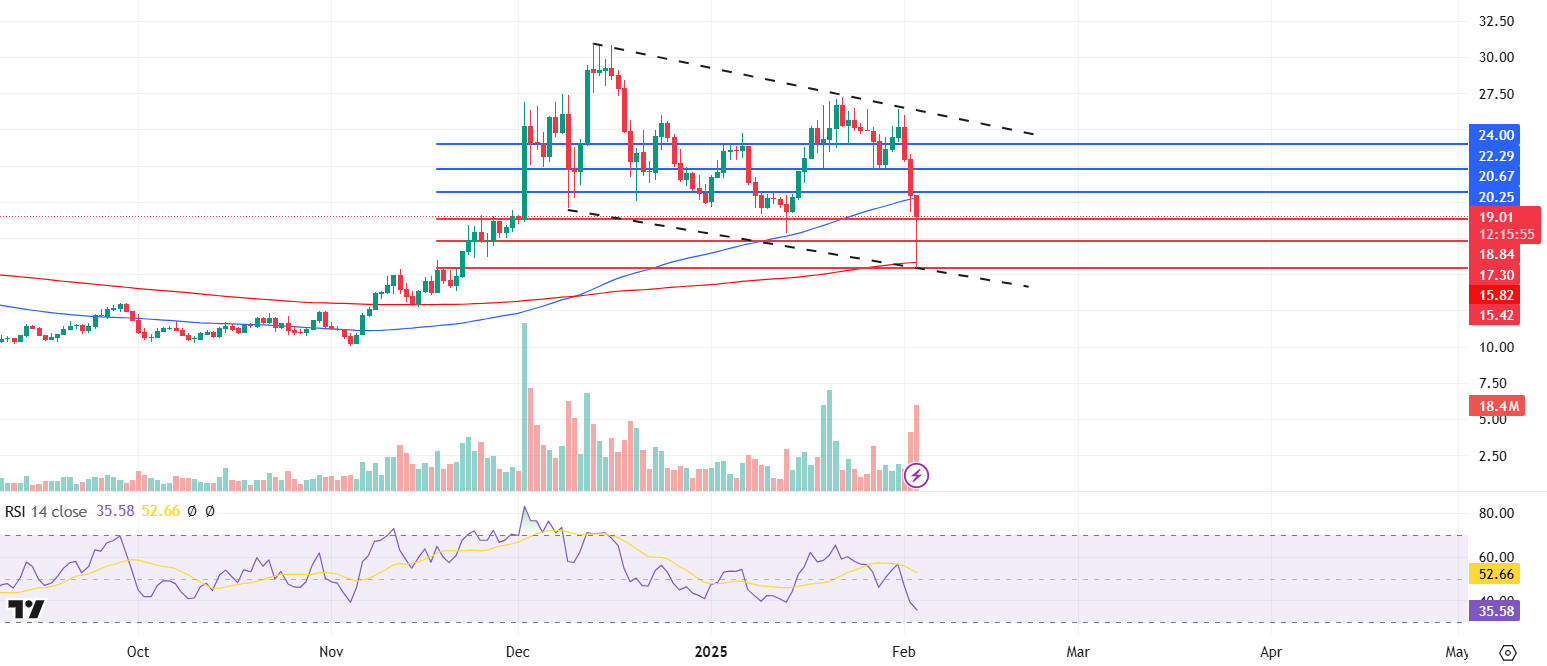
From a technical perspective, price action continues to move within a falling channel. After the weekly close, the price pinched the lower band of the channel and experienced strong volatility with pending buy orders at the $15.42 level and rose as high as the $19.00 band. The $17.98 level stands out as a strong support en the short term. However, if persistence cannot be achieved at this level, it is quite possible that the price will tend to fill the pin at the $ 15.42 level. Since this zone coincides with both the channel support and the 200-day moving average (SMA200) level, the bear market signal may strengthen en case of its loss.
On the other hand, the fact that the RSI indicator is en negative territory and does not give any turn signal increases the pessimism el the buy side. On the upside, the $20.25 level is a critical resistance point where selling pressure may increase as it intersects the 100-day moving average (SMA100). However, en order to talk about a new uptrend, the channel resistance at the $26 level must show a voluminous breakout.
(SMA200: Red Line, SMA100: Blue Line)
Supports 17.98 – 15.44 – 12.61
Resistances 20.67 – 23.07 – 25.17
BNB/USDT
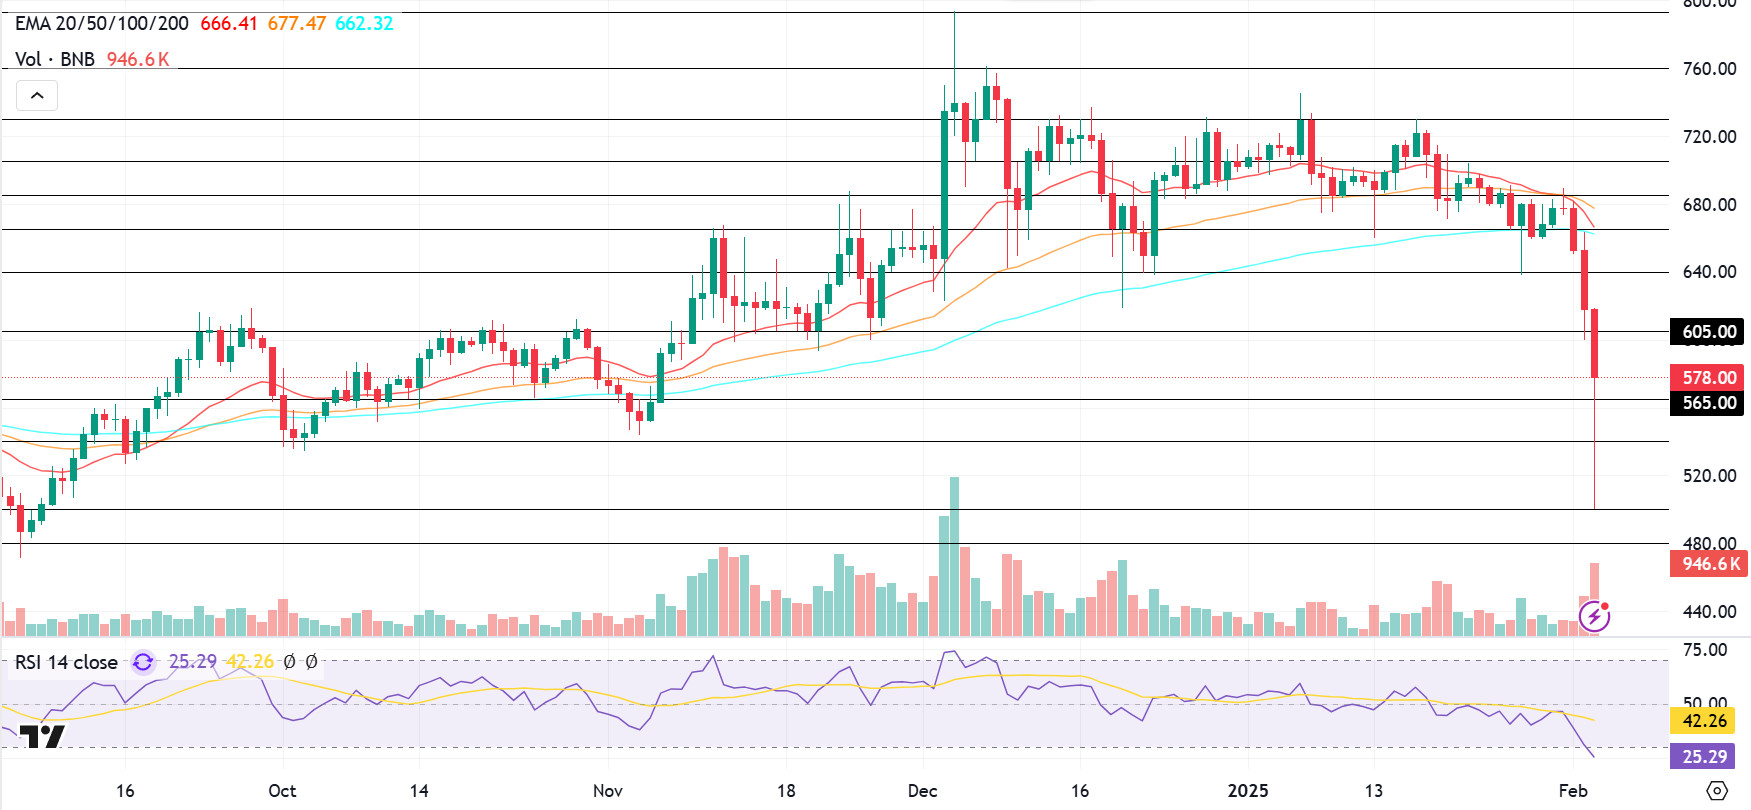
At the beginning of last week, BNB/USDT, which retreated to the 640 level el Monday, January 27, recovered from this level and completed the day el the positive side and recorded a rise towards the 685 level. However, the positive momentum of the asset remained limited due to the increased selling pressure at these levels. Although limited positive movements were seen en the following days, BNB/USDT, which gained a negative momentum as of February 01, strengthened its negative outlook por falling below the EMA 100 (blue line) level for the rest of the week.
At the start of the new week, BNB/USDT faced strong selling pressure and retreated to the 500 level. Despite a partial recovery from this level, the asset still maintains its negative outlook.
The volume indicator reveals that the negative candles that formed with the intense selling pressure as of February 01 increased the selling volume. Accordingly, strong and positive trading volume should increase en order for the price to regain a positive momentum. On the other hand, the RSI indicator moved en line with the price movements and fell below the 30 level. The fact that the RSI remains below these levels indicates that selling pressure may continue.
In this context, if the negative momentum observed at the beginning of the new week continues, the price is expected to retreat towards the 565 level first. If the 565 level is broken down, there is a possibility of a pullback to 540 and 500 levels, respectively. On the other hand, a possible support from the 640 level may contribute to the rise of the price towards the 605 level again. In case the 605 level is broken upwards, 640 and 665 levels will be followed as new resistance zones.
Supports 565 – 540 – 500
Resistances 605 – 640 – 665
ADA/USDT
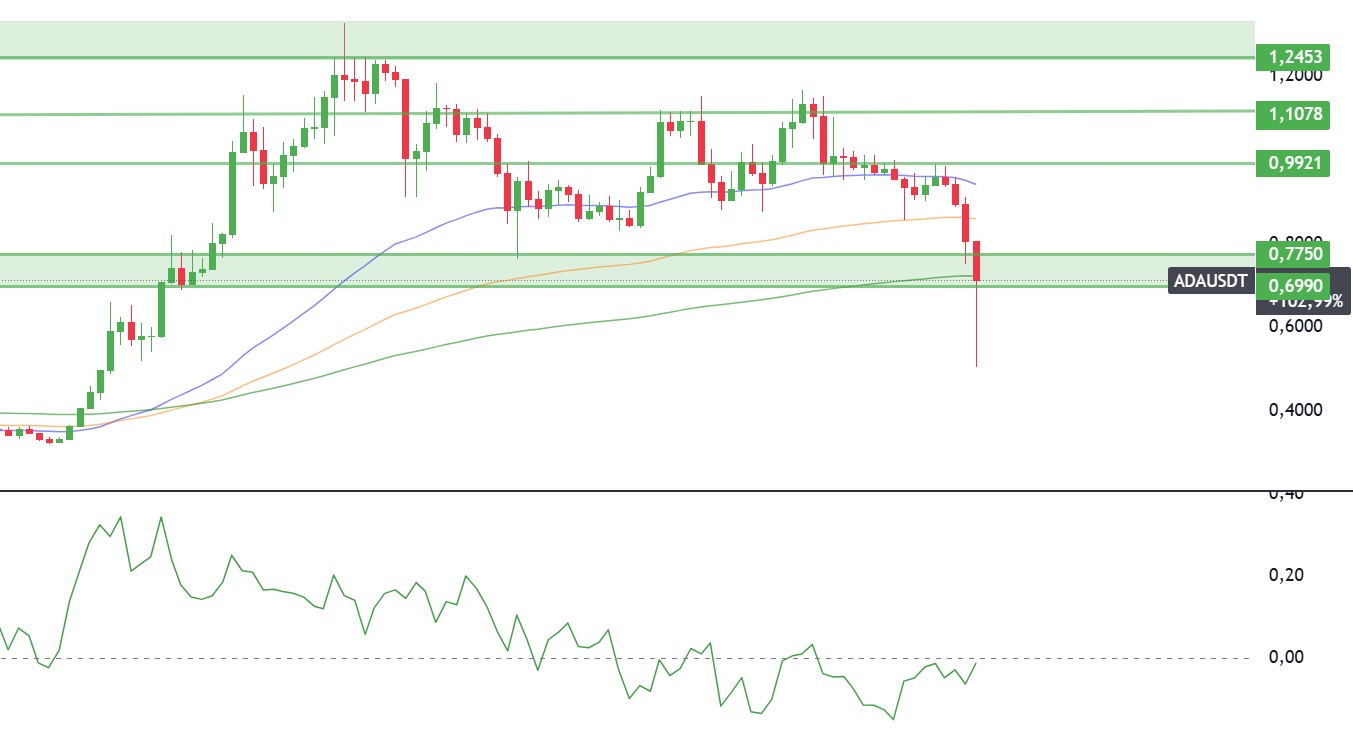
In the last 1 week, Cardano has lost 24% of its value, affected por the selling pressure el digital assets. It tested its lowest support zone, the 200-period Exponential Moving Average (EMA200), and broke to the downside. 1Fuel, ADA is rumored to be a major force en the blockchain space, offering cross-chain transactions and real-world utility. ADA, which has not yet priced en this news, fell from 0.928 to 0.6940 en 1 week. This sharp decline was triggered por US President Donald Trump’s statements that had a negative impact el the market and the imposition of tariffs el Canada, Mexico and China.
Technically, the Chaikin Money Flow (CMF) oscillator shows that the selling pressure is still strong. Accordingly, a retest of the 0.604 support level seems likely if the downtrend continues. Overall, with this deep decline, market momentum has been severely weakened and critical resistance levels have been breached.
If ADA tests the 100-period Exponential Moving Average (EMA100) level and breaks it upwards, 0.775 and 0.991 levels can be targeted as resistance. If the declines el ADA deepen, 0.604 and 0.598 levels can be followed as support levels.
(EMA50: Blue Line, EMA100: Orange Line, EMA200: Green Line)
Supports 0.598 – 0.604 – 0.722
Resistances 0.991 – 1.104 – 1.107
LEGAL NOTICE
The investment information, comments and recommendations contained en this document do not constitute investment advisory services. Investment advisory services are provided por authorized institutions el a personal basis, taking into account the risk and return preferences of individuals. The comments and recommendations contained en this document are of a general type. These recommendations may not be suitable for your financial situation and risk and return preferences. Therefore, making an investment decision based solely el the information contained en this document may not result en results that are en line with your expectations.

